Atmospheric Chemistry and Dynamics Laboratory (Code 614)
For Our Colleagues Scientific/Technical Information

Water (H2O) plots from NASA Aura MLS
(Click on an element of the table to see the corresponding plot.)
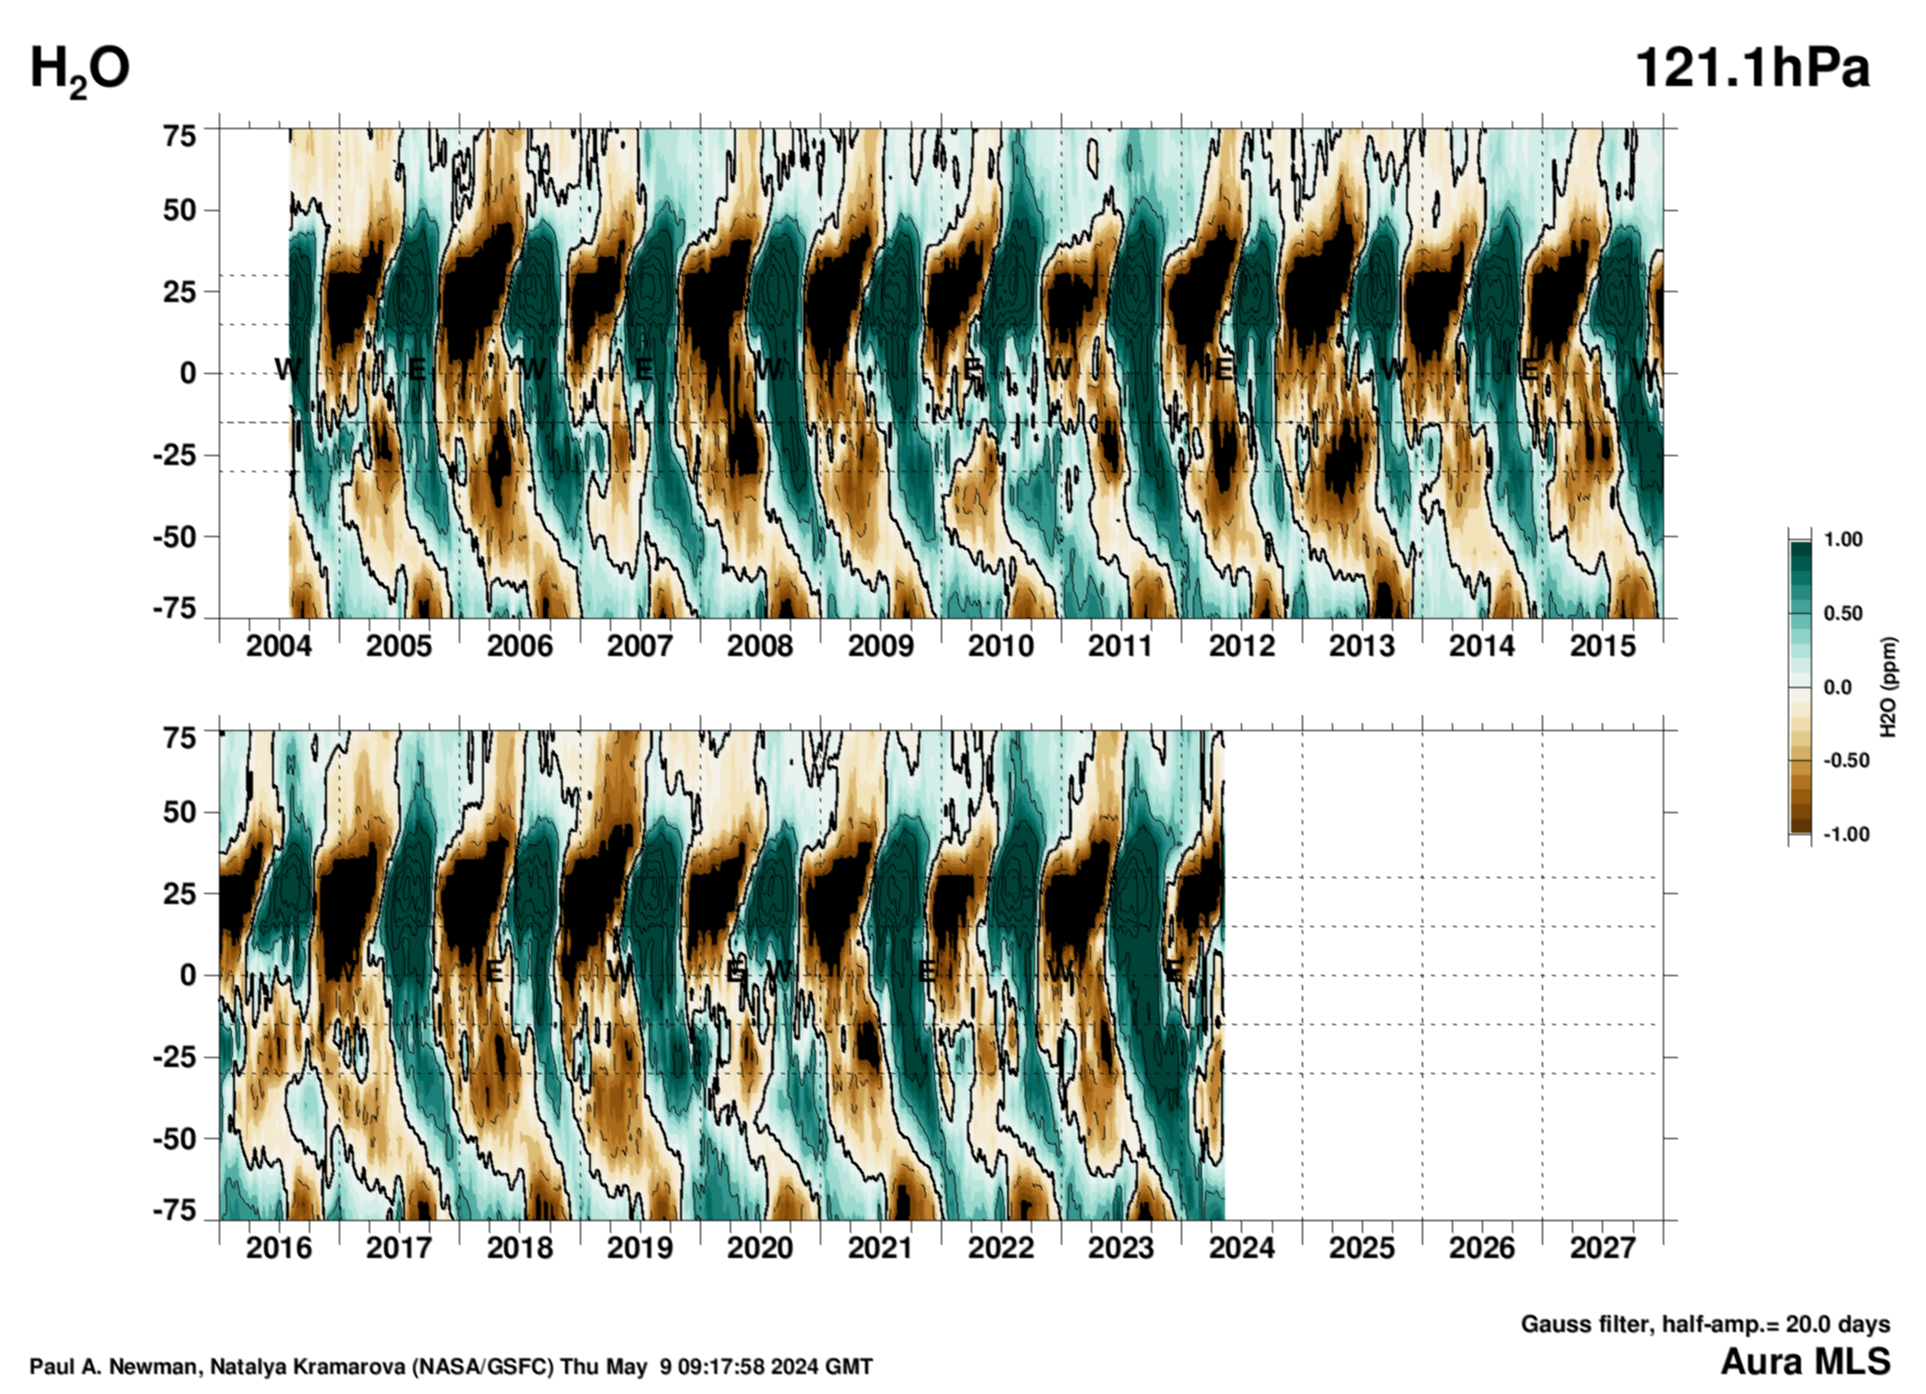
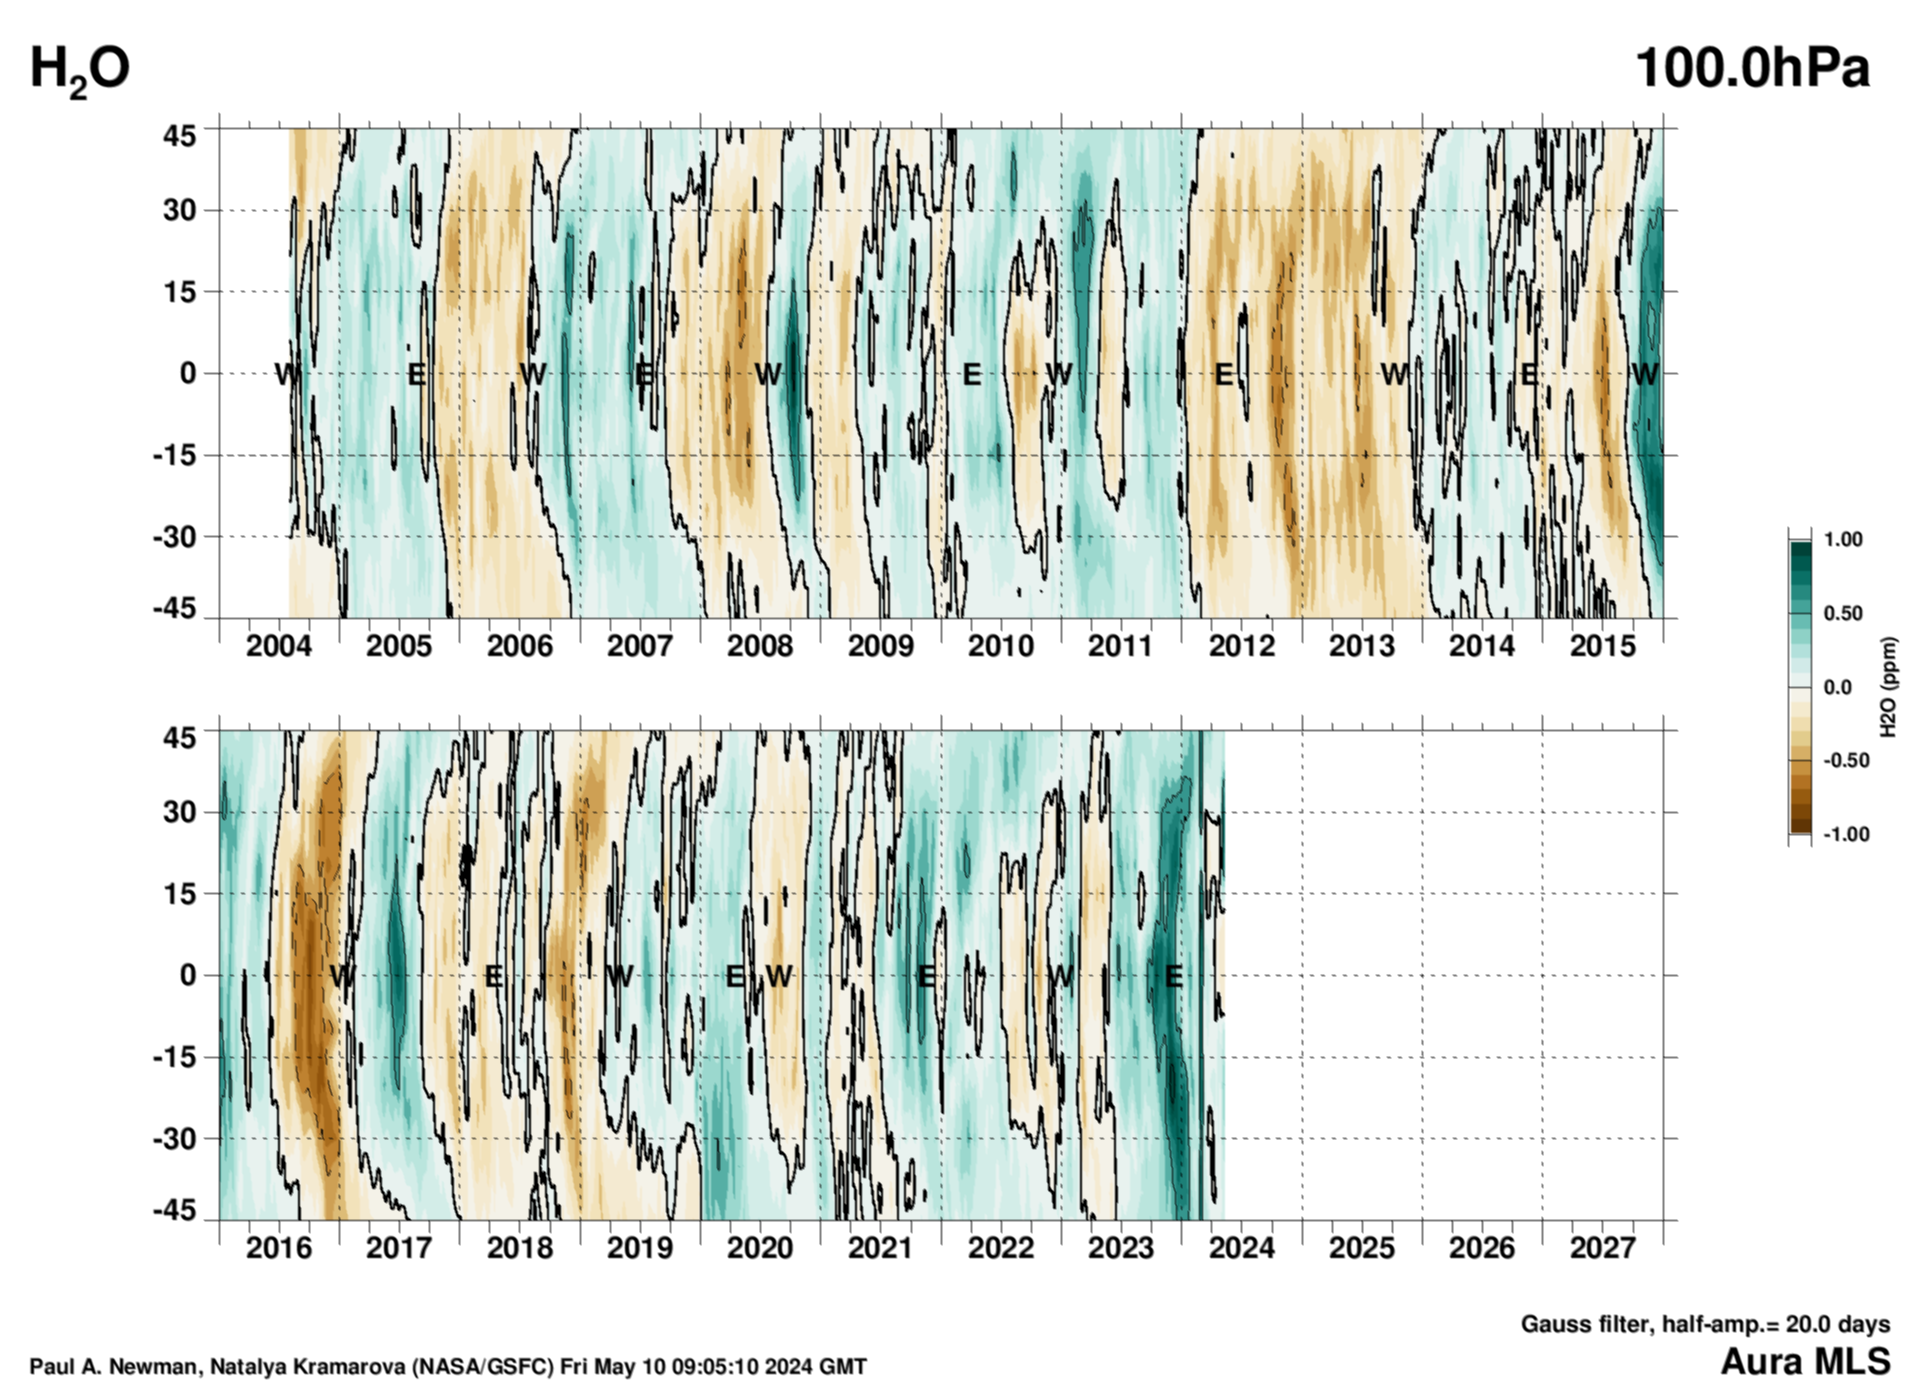
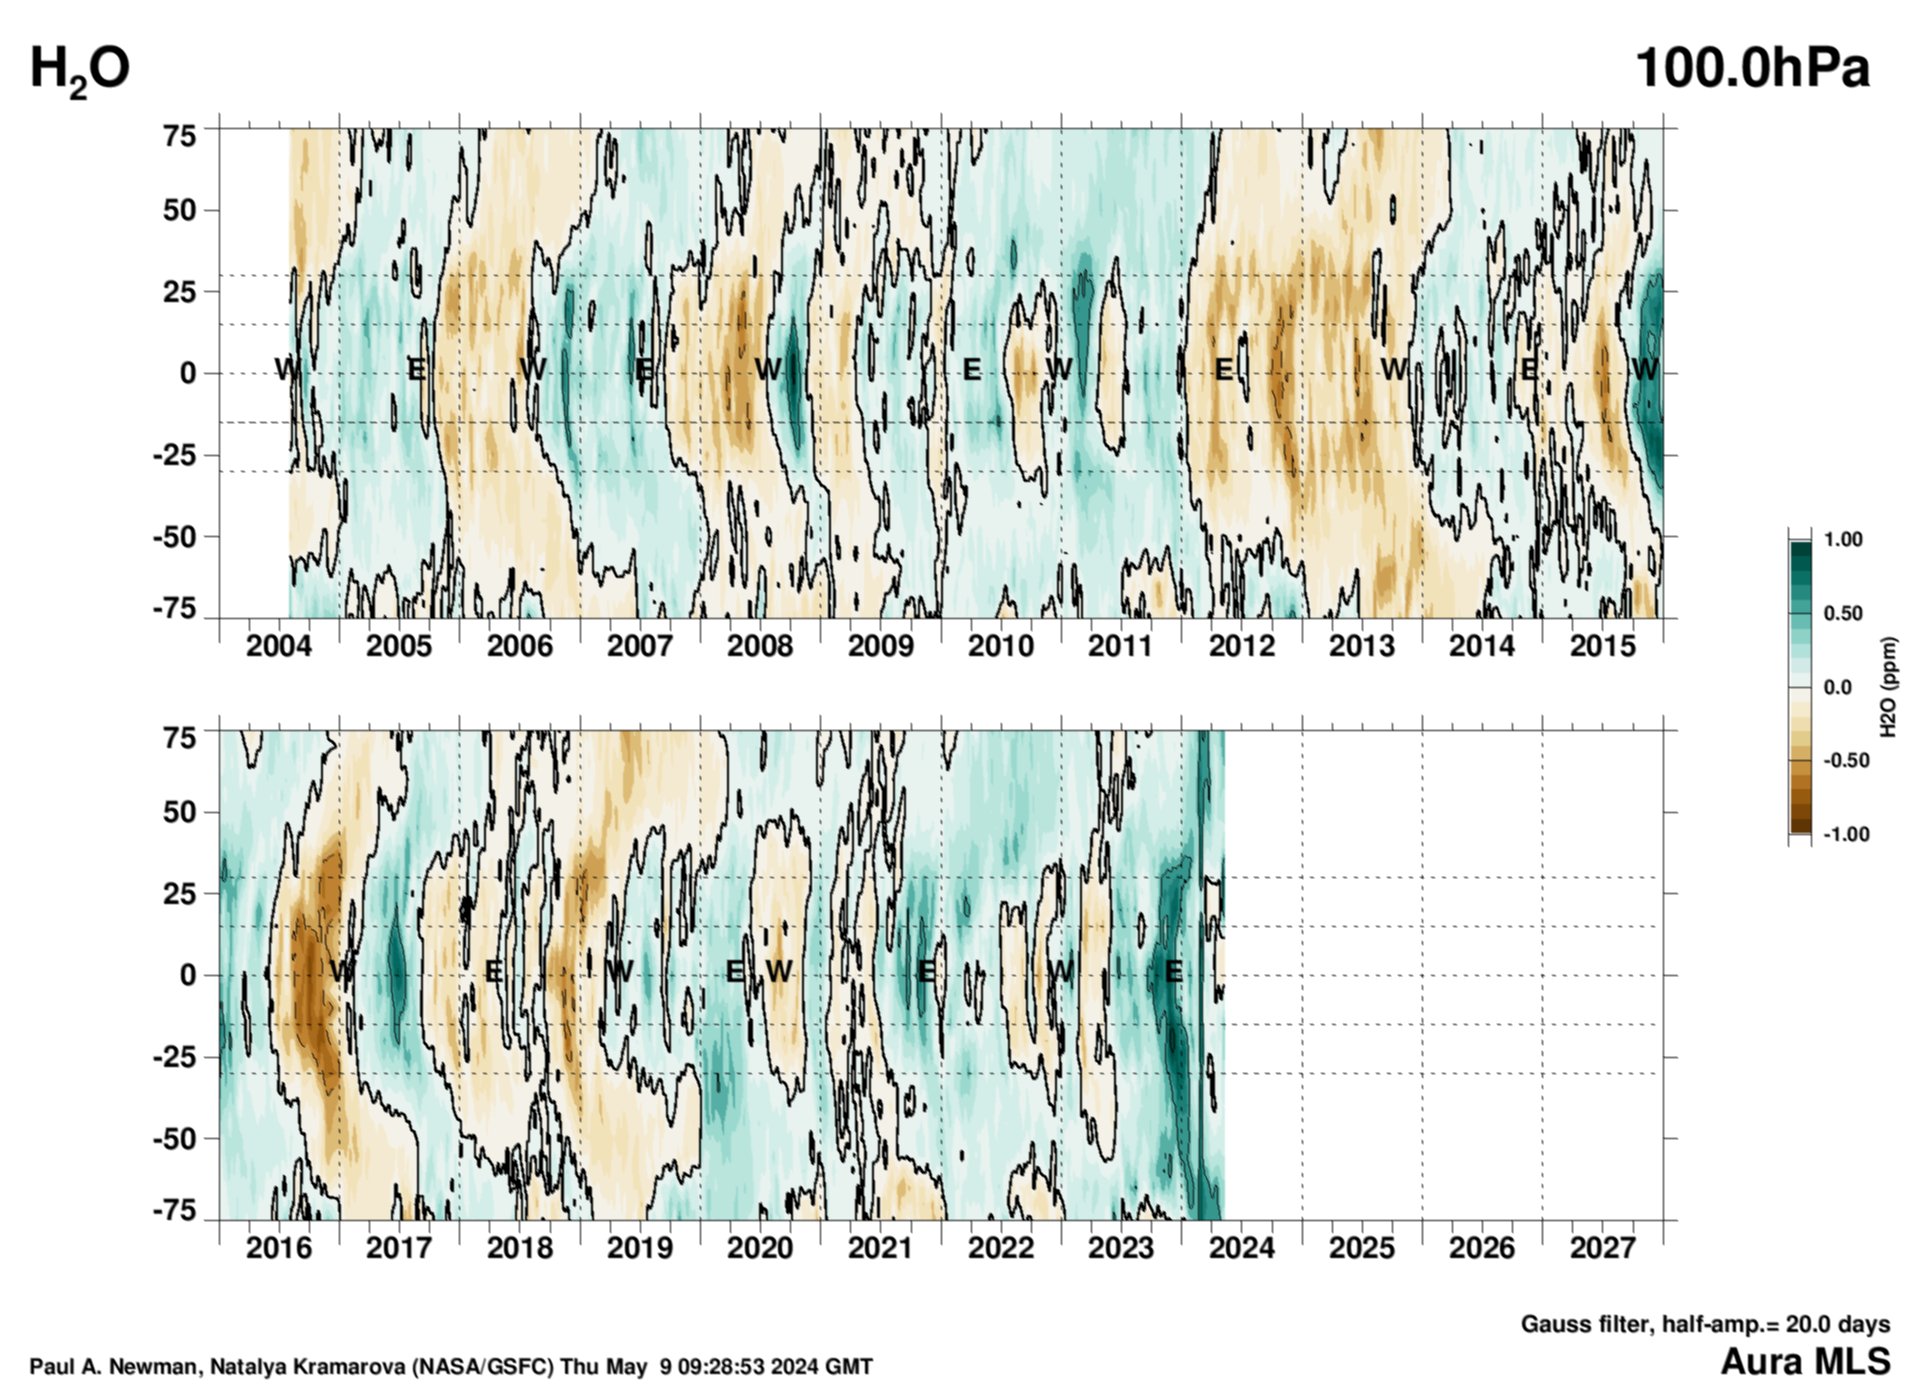
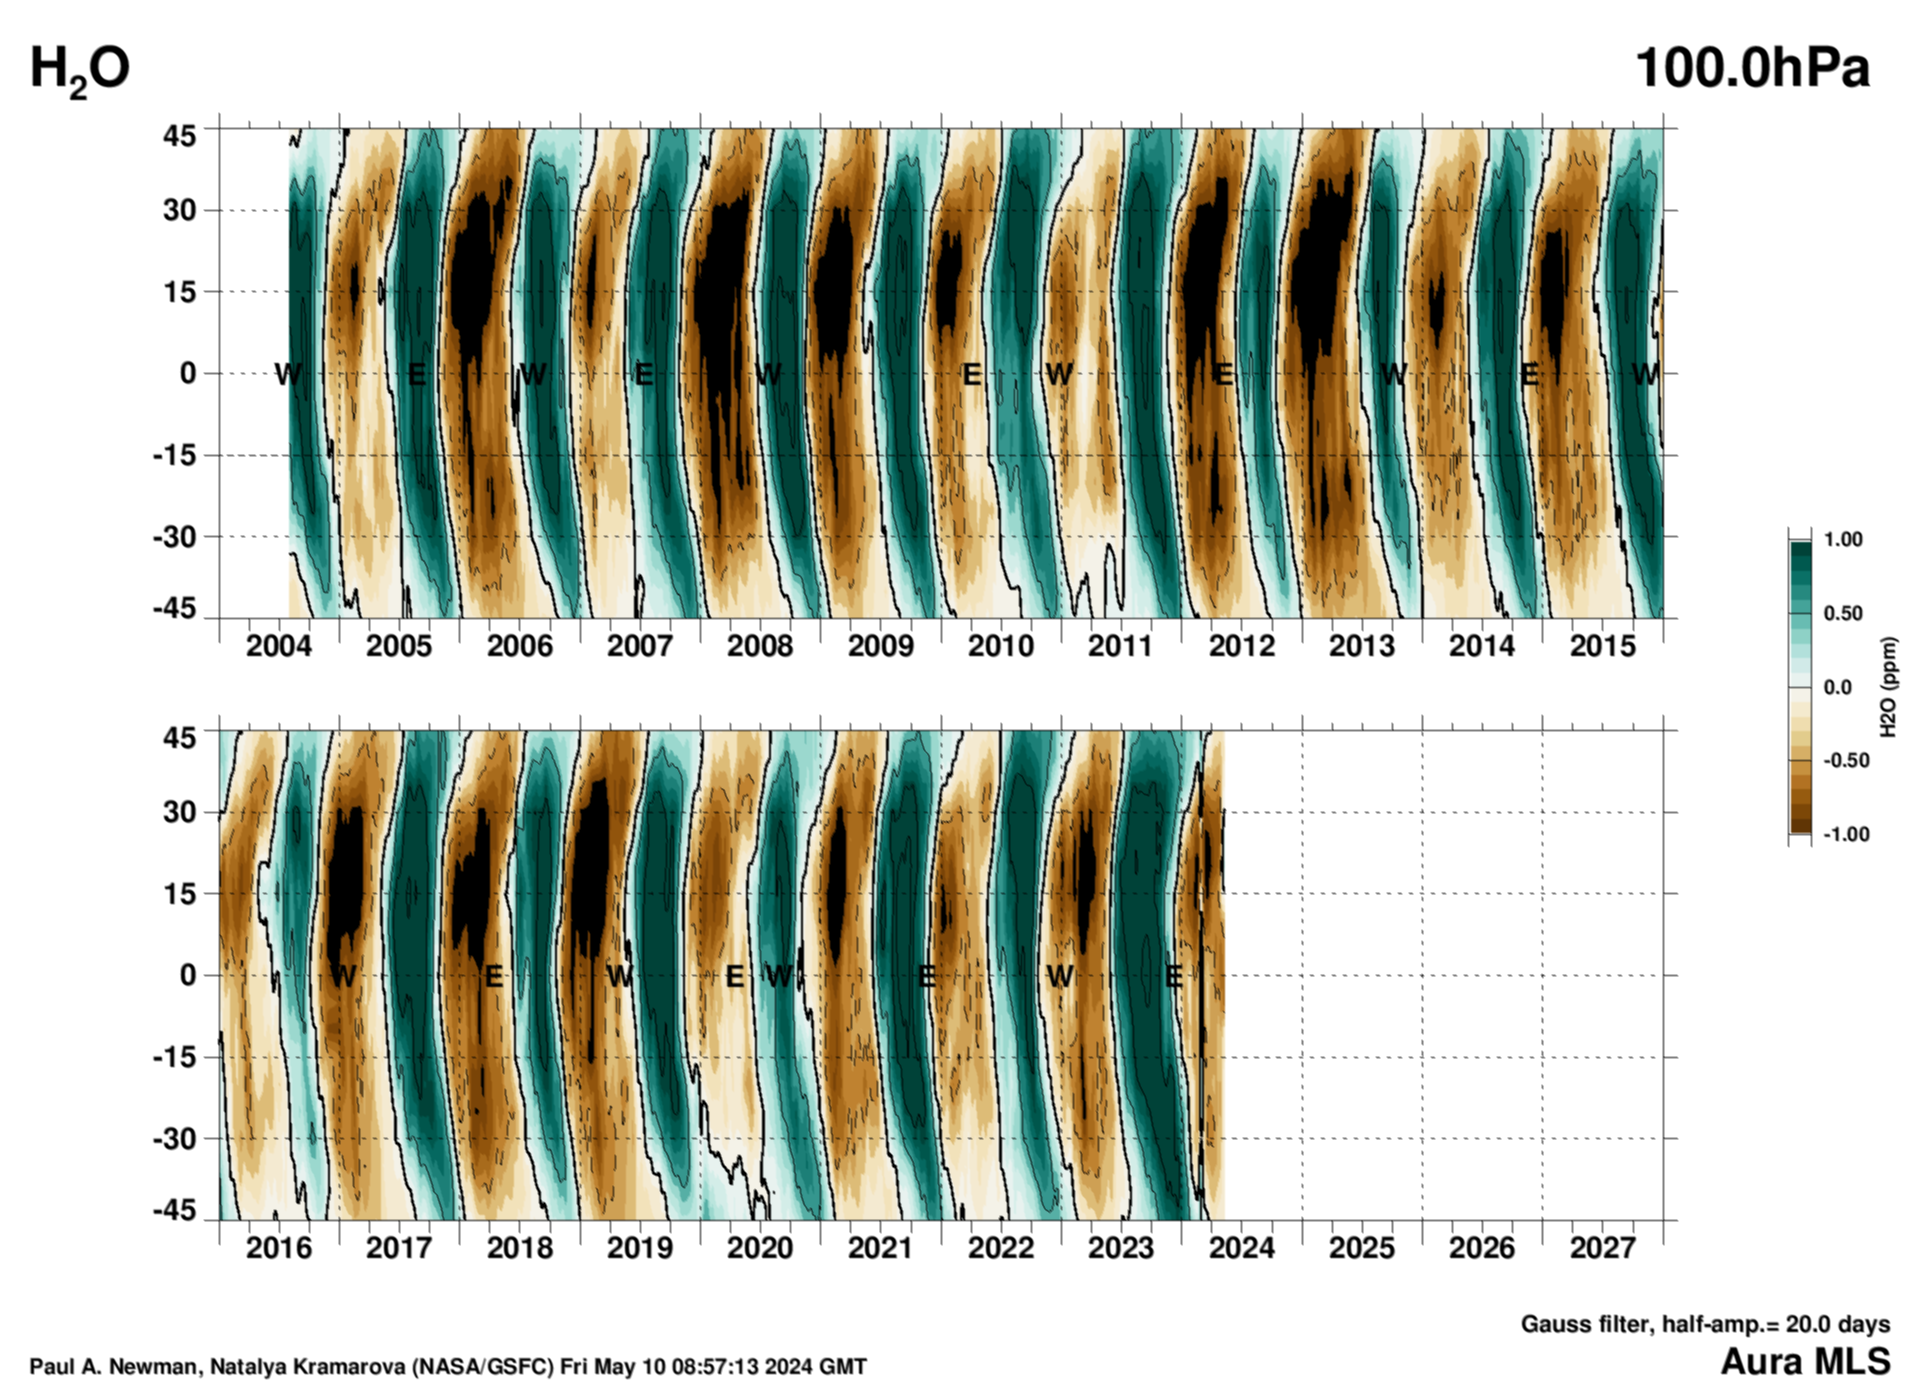
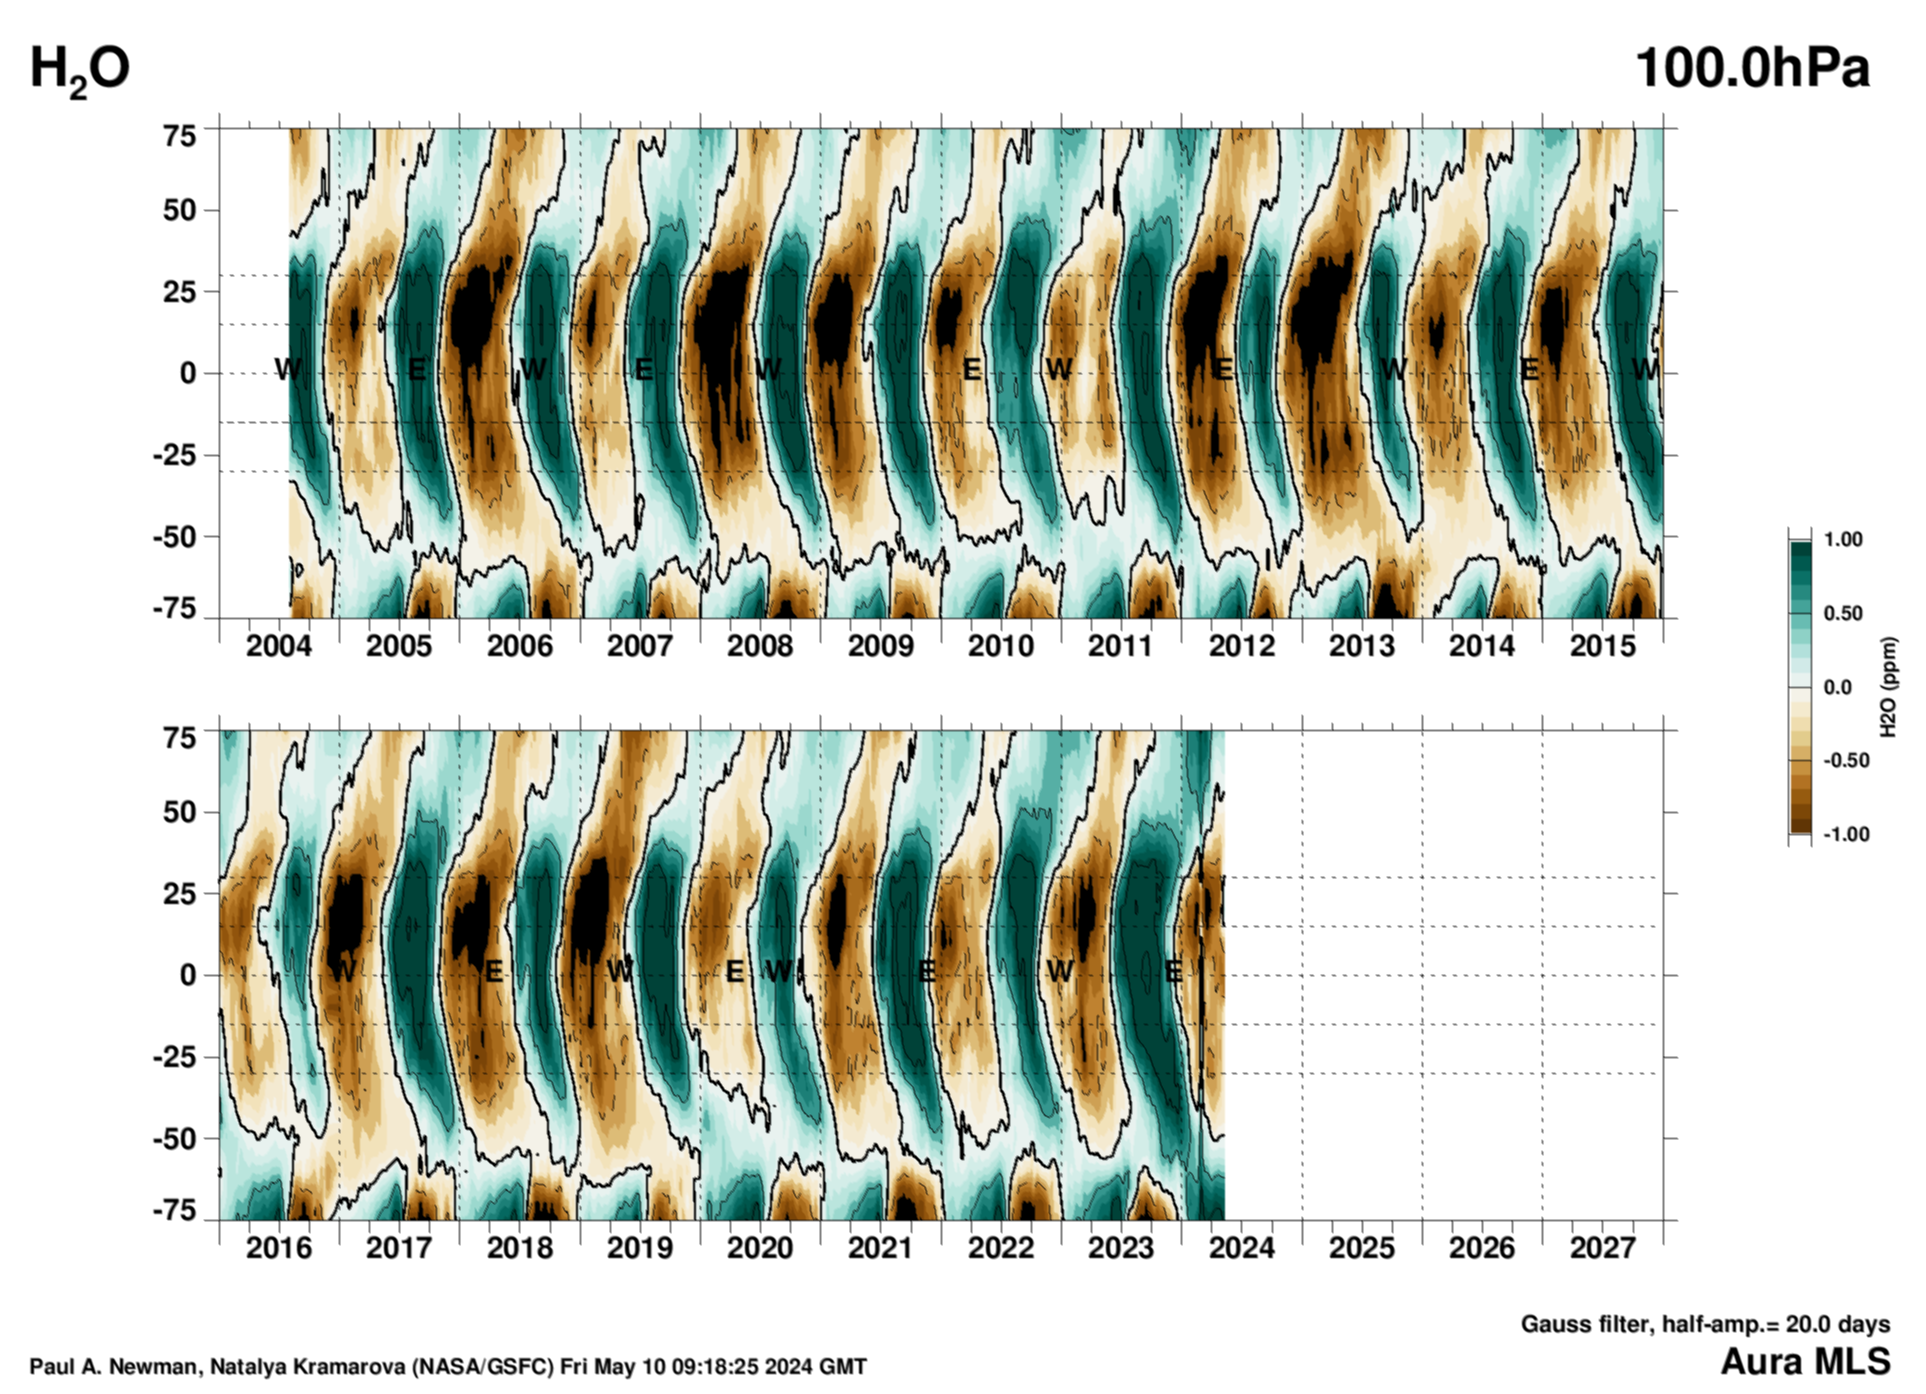
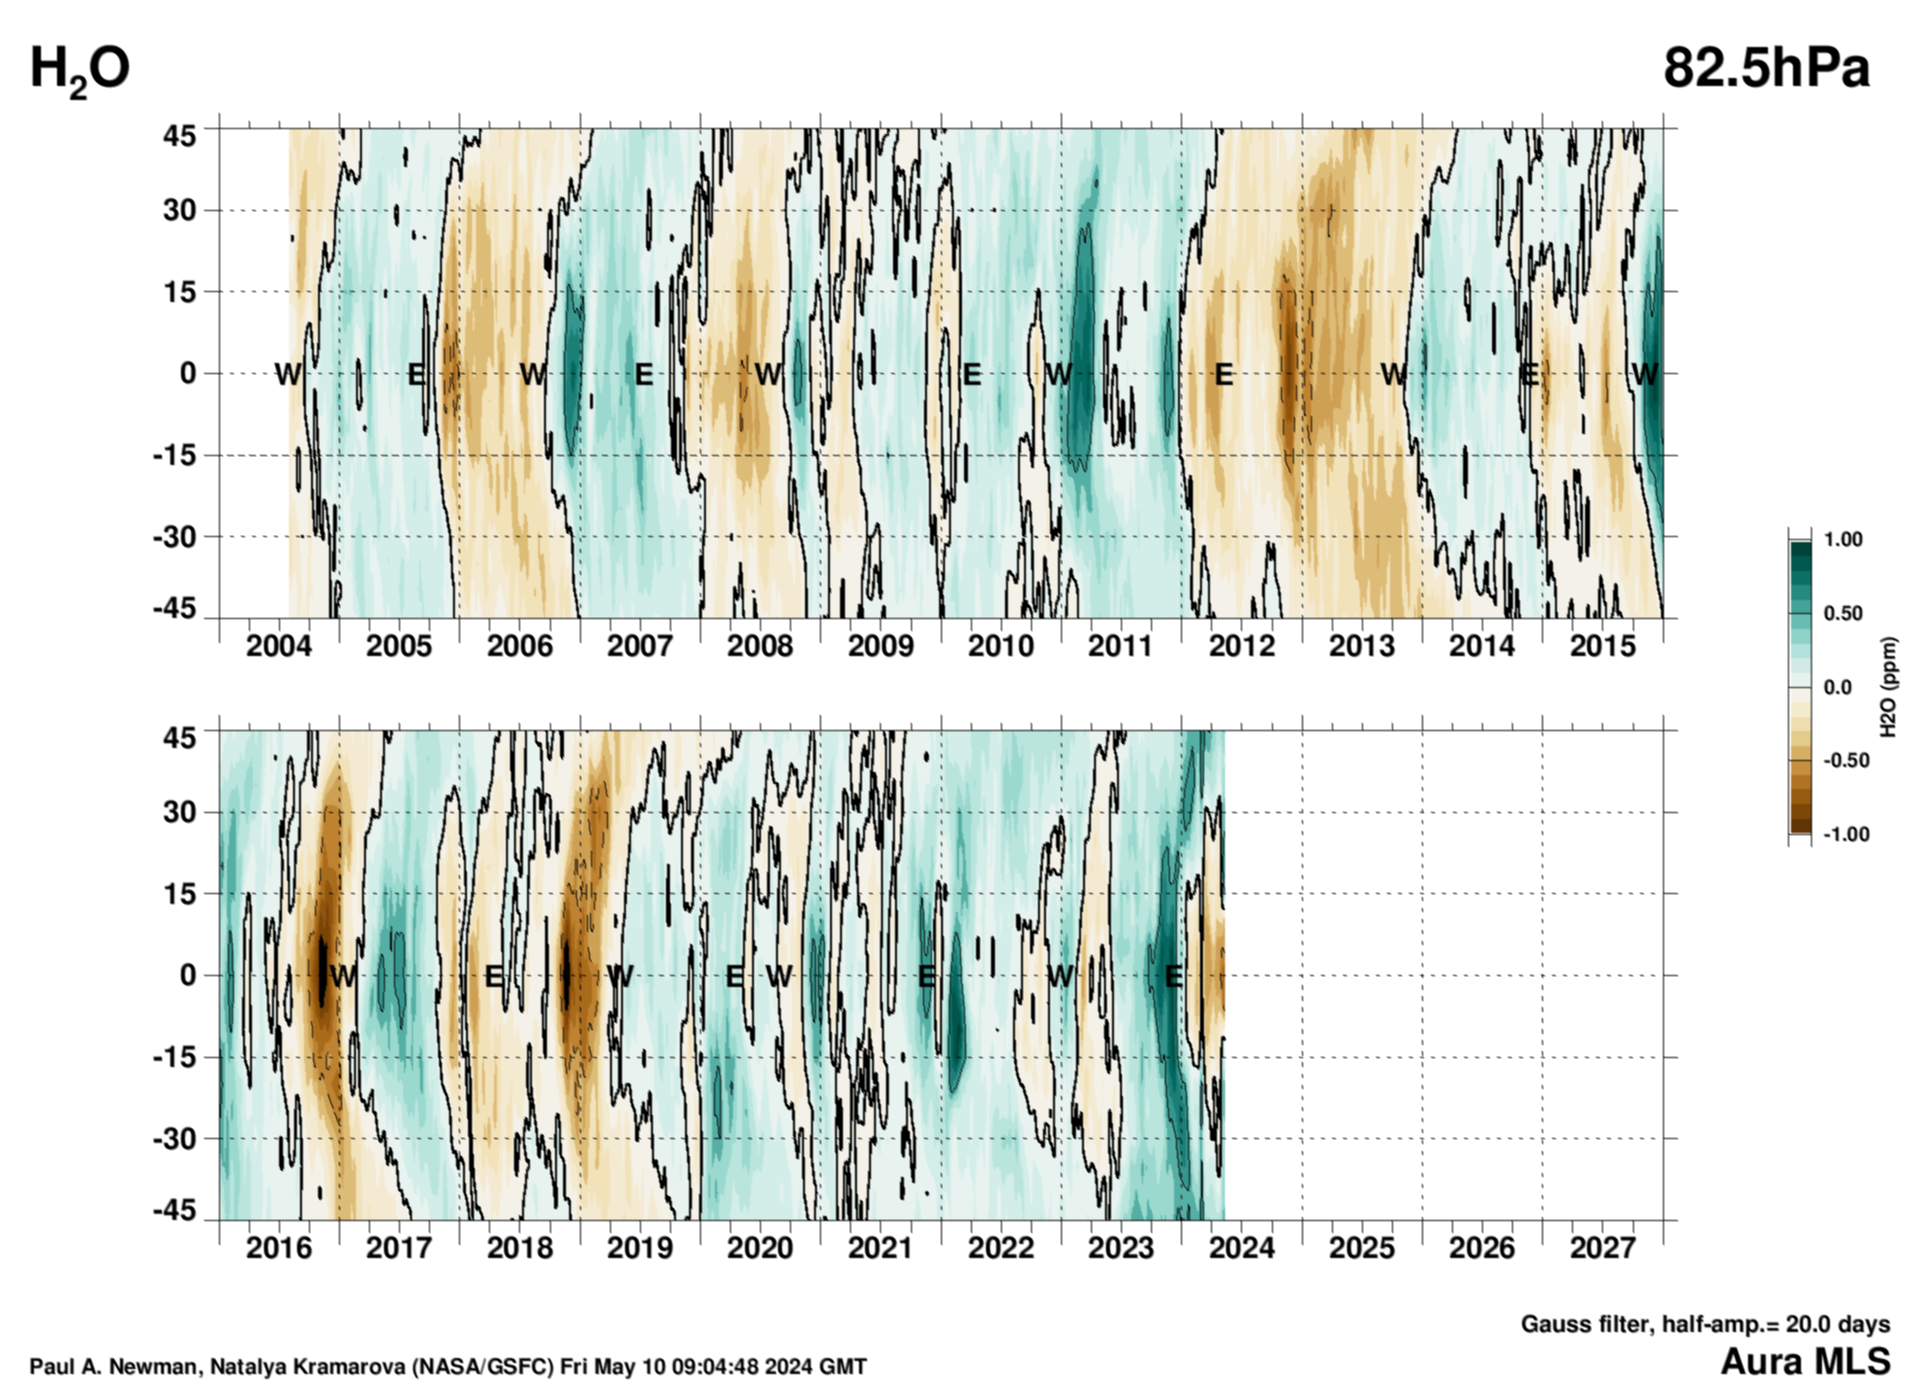
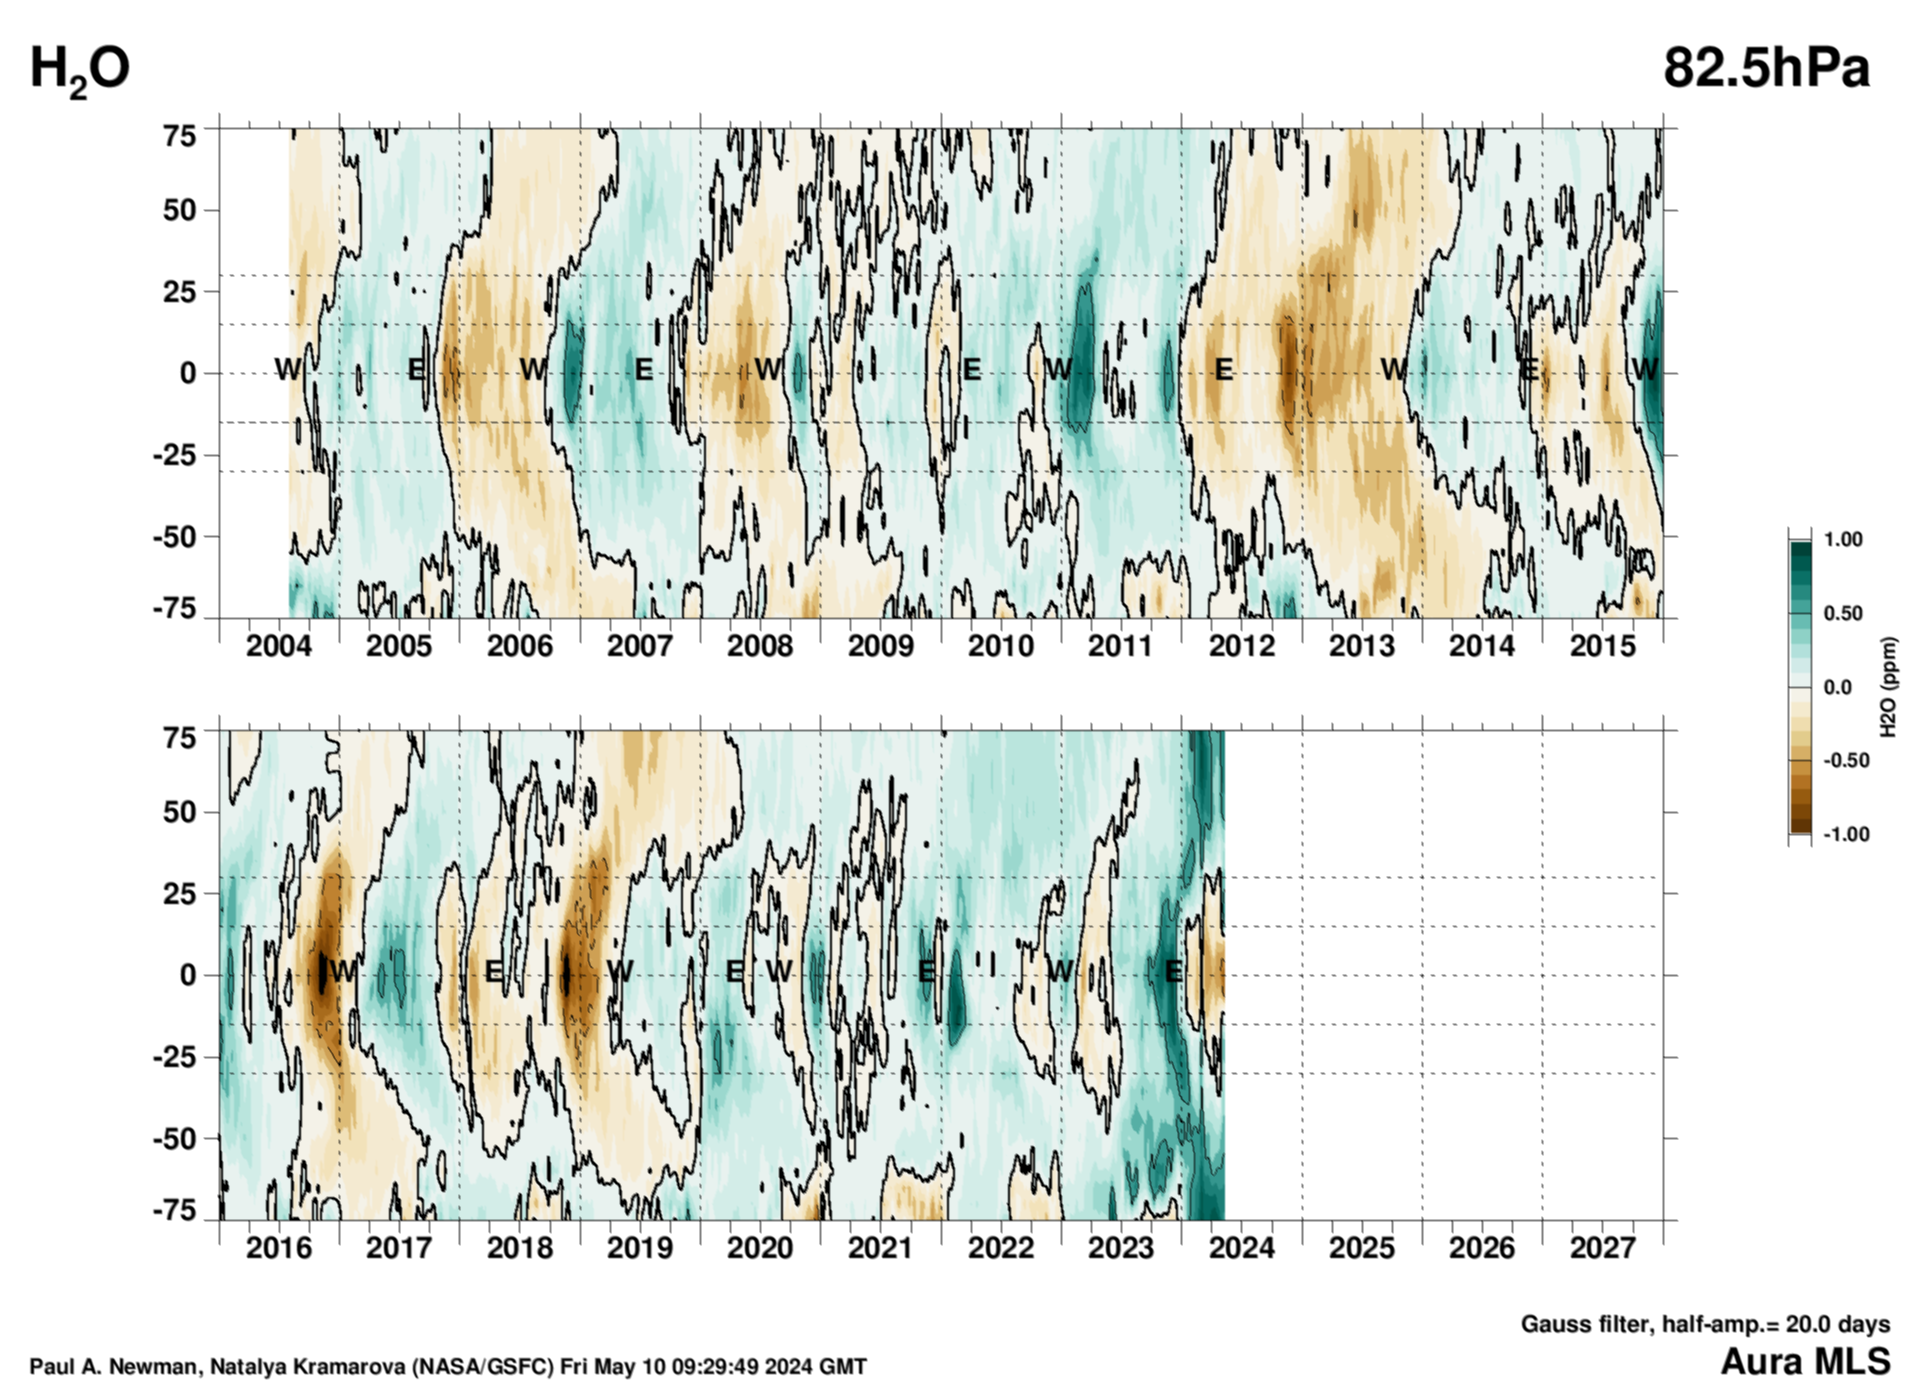
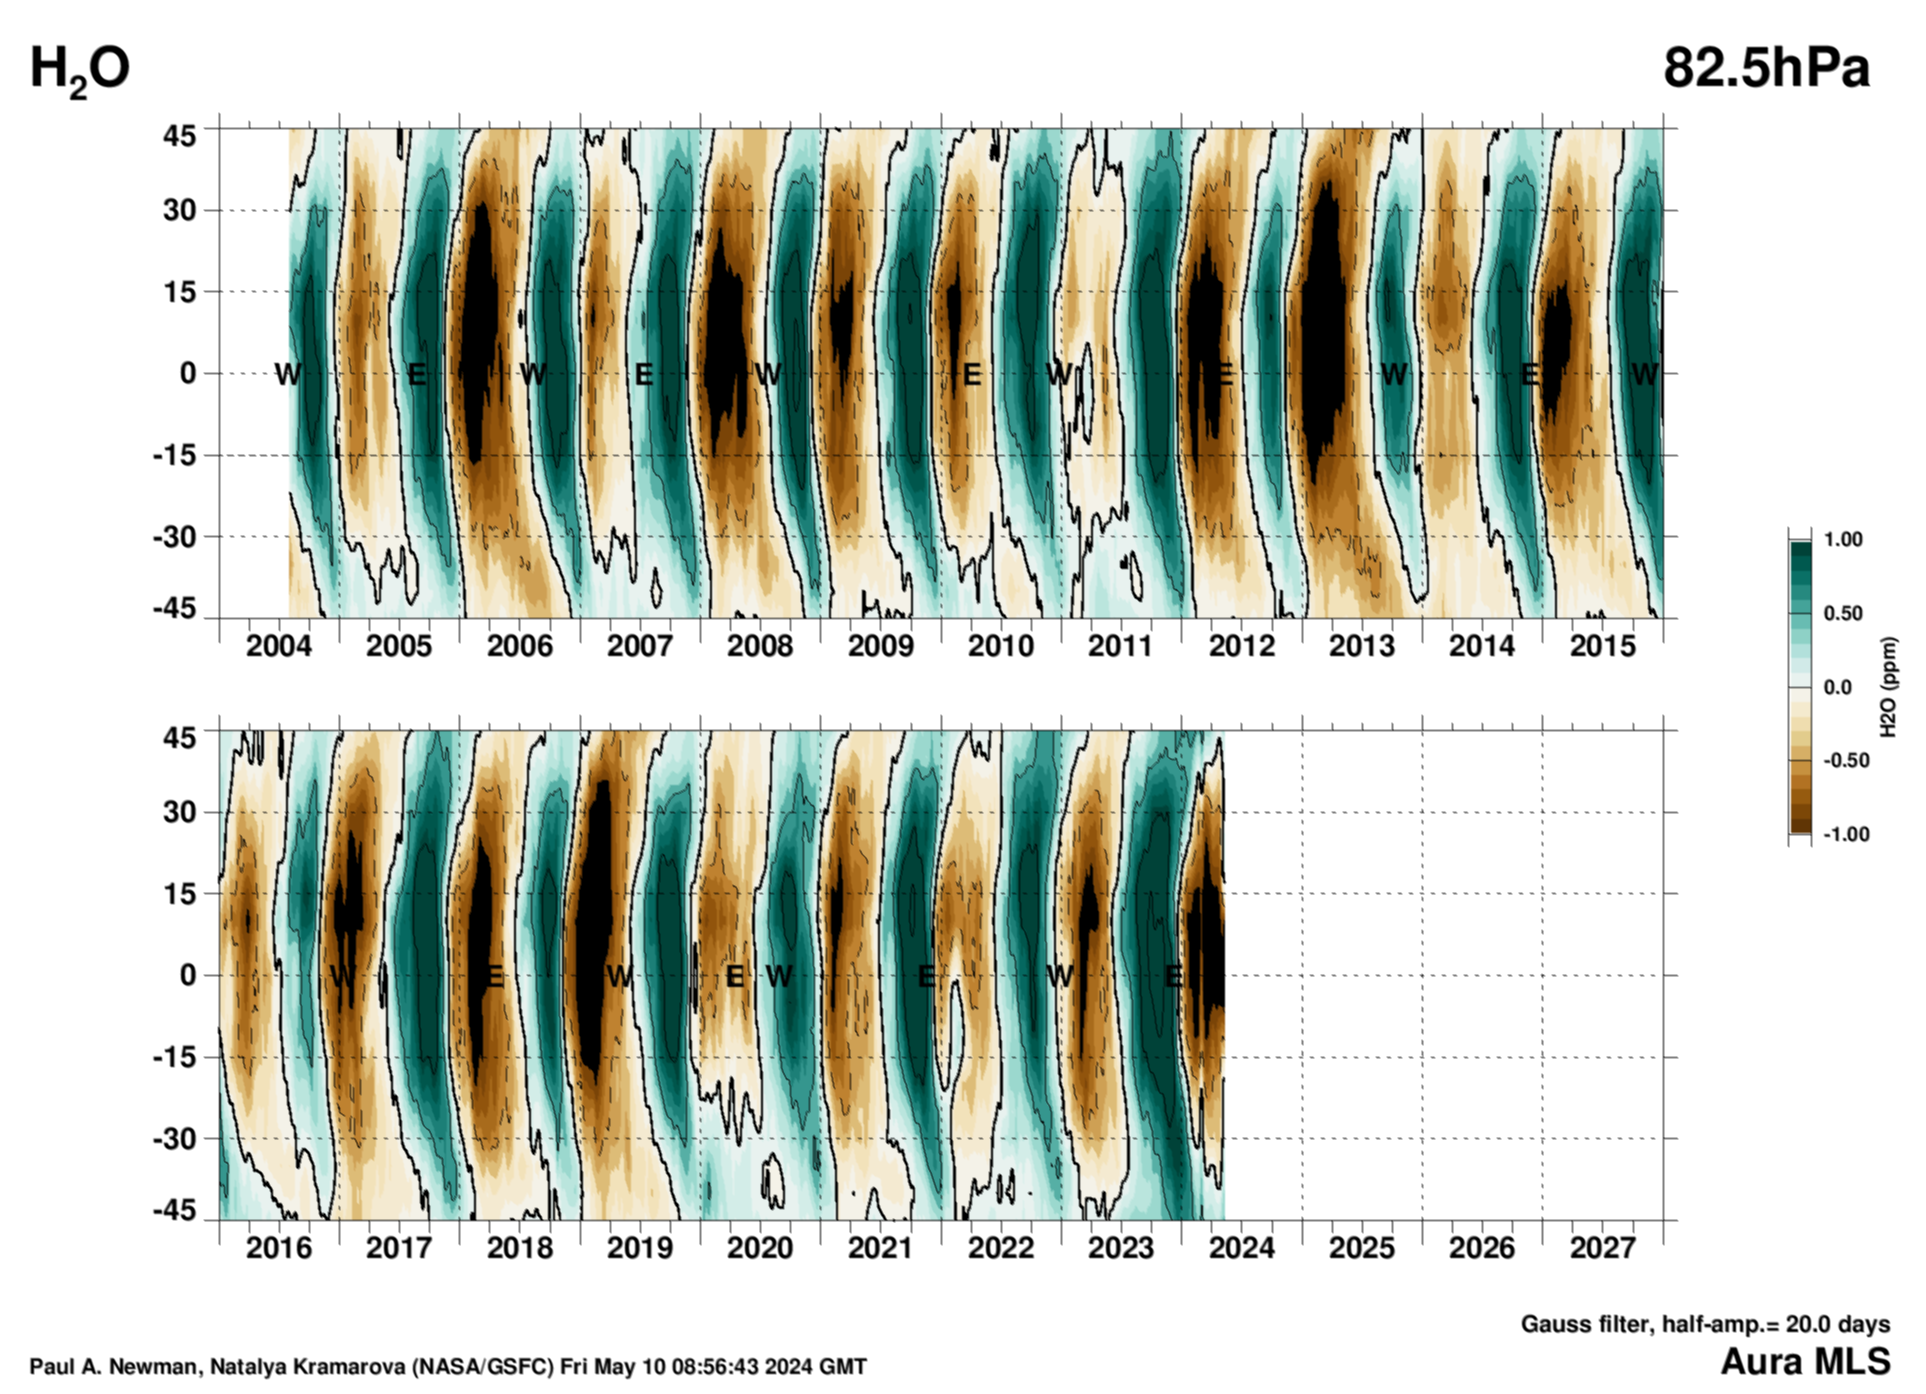
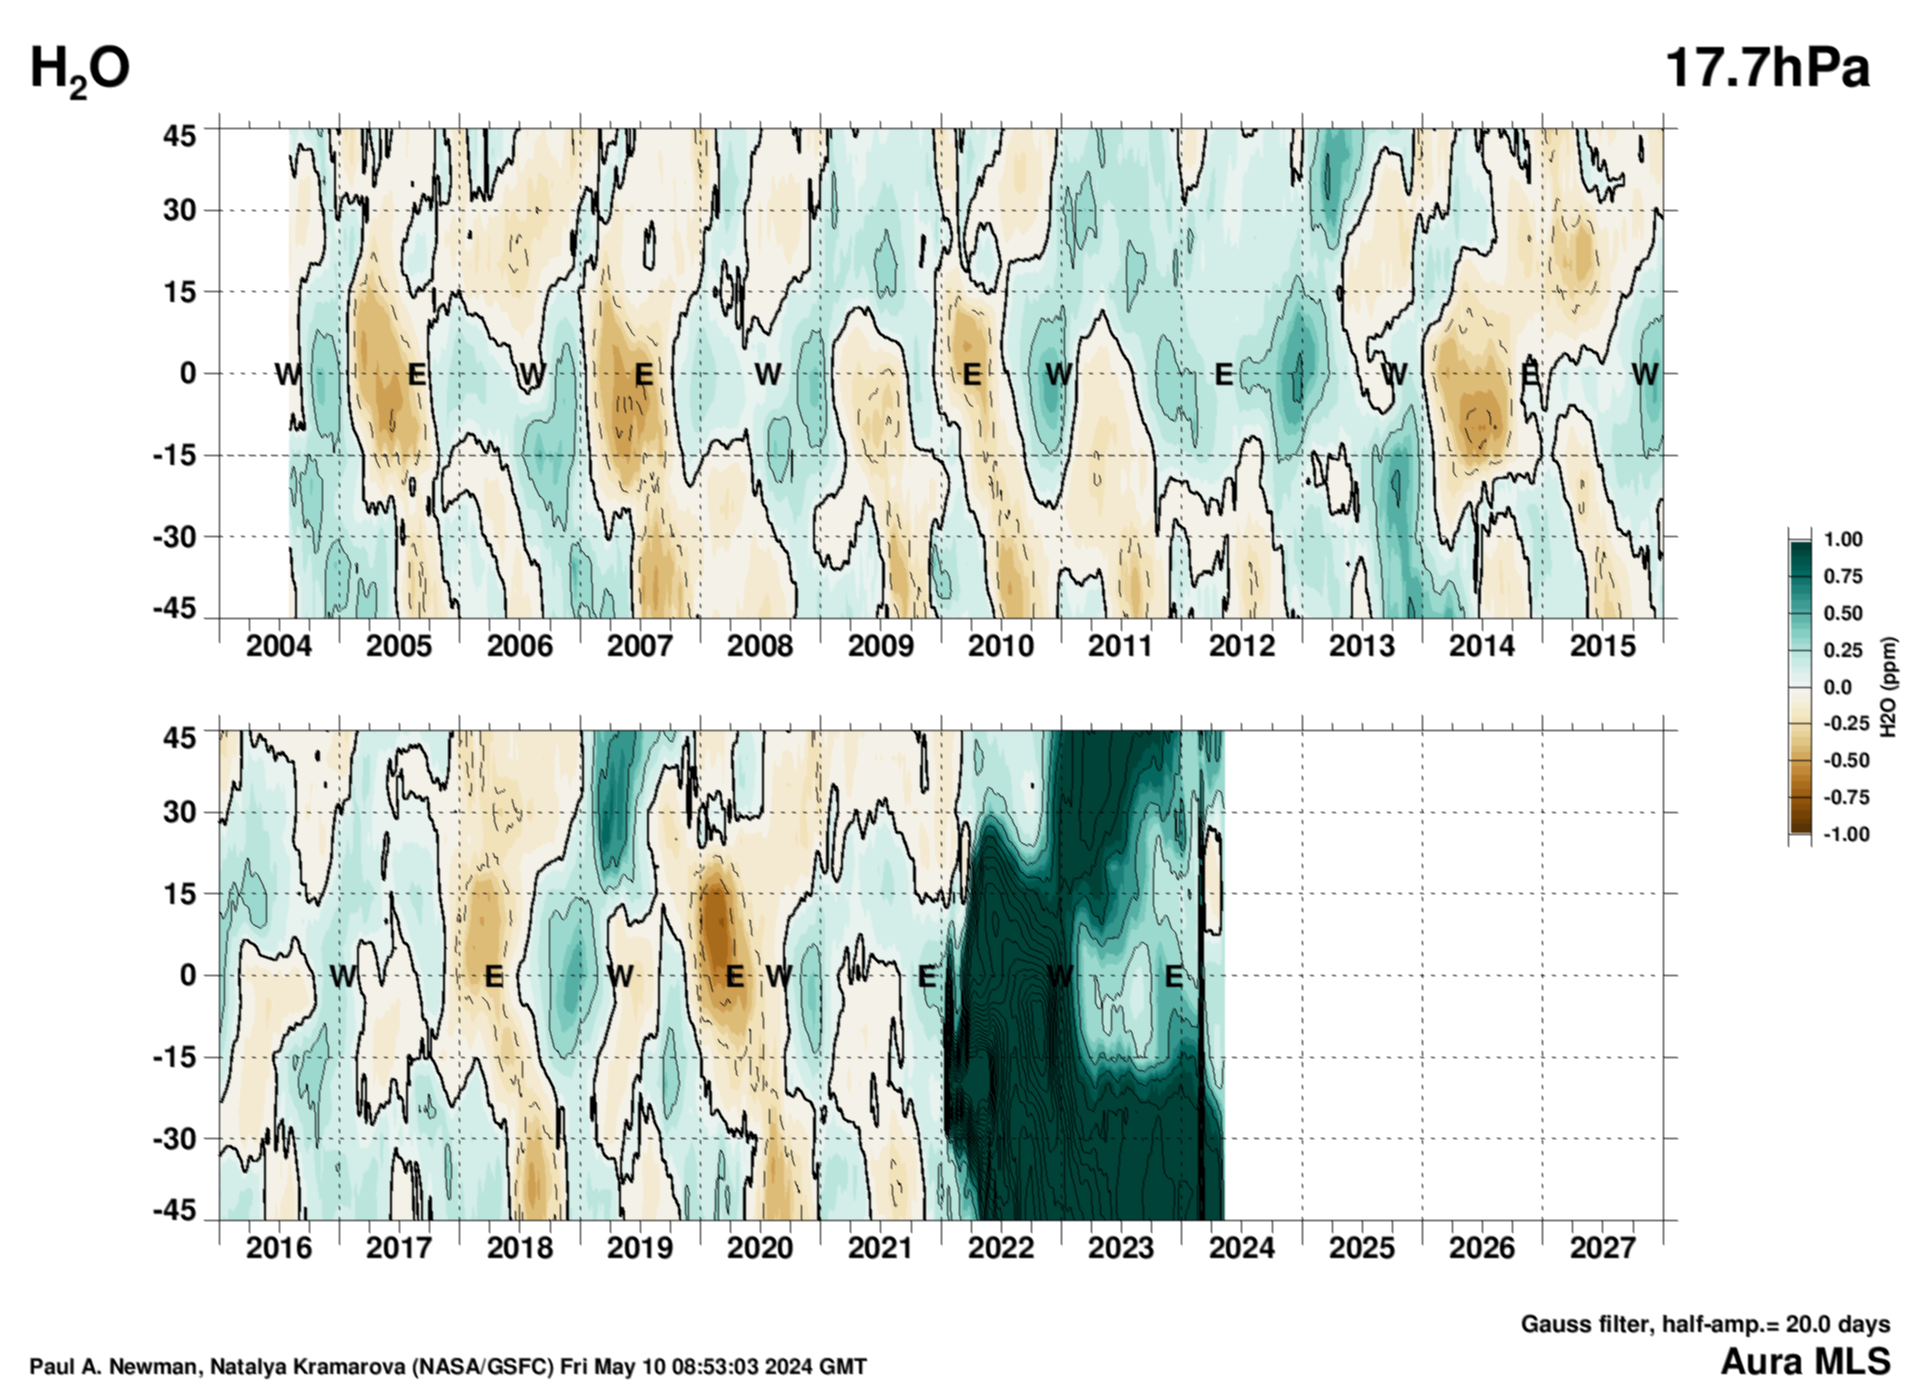
Water versus latitude
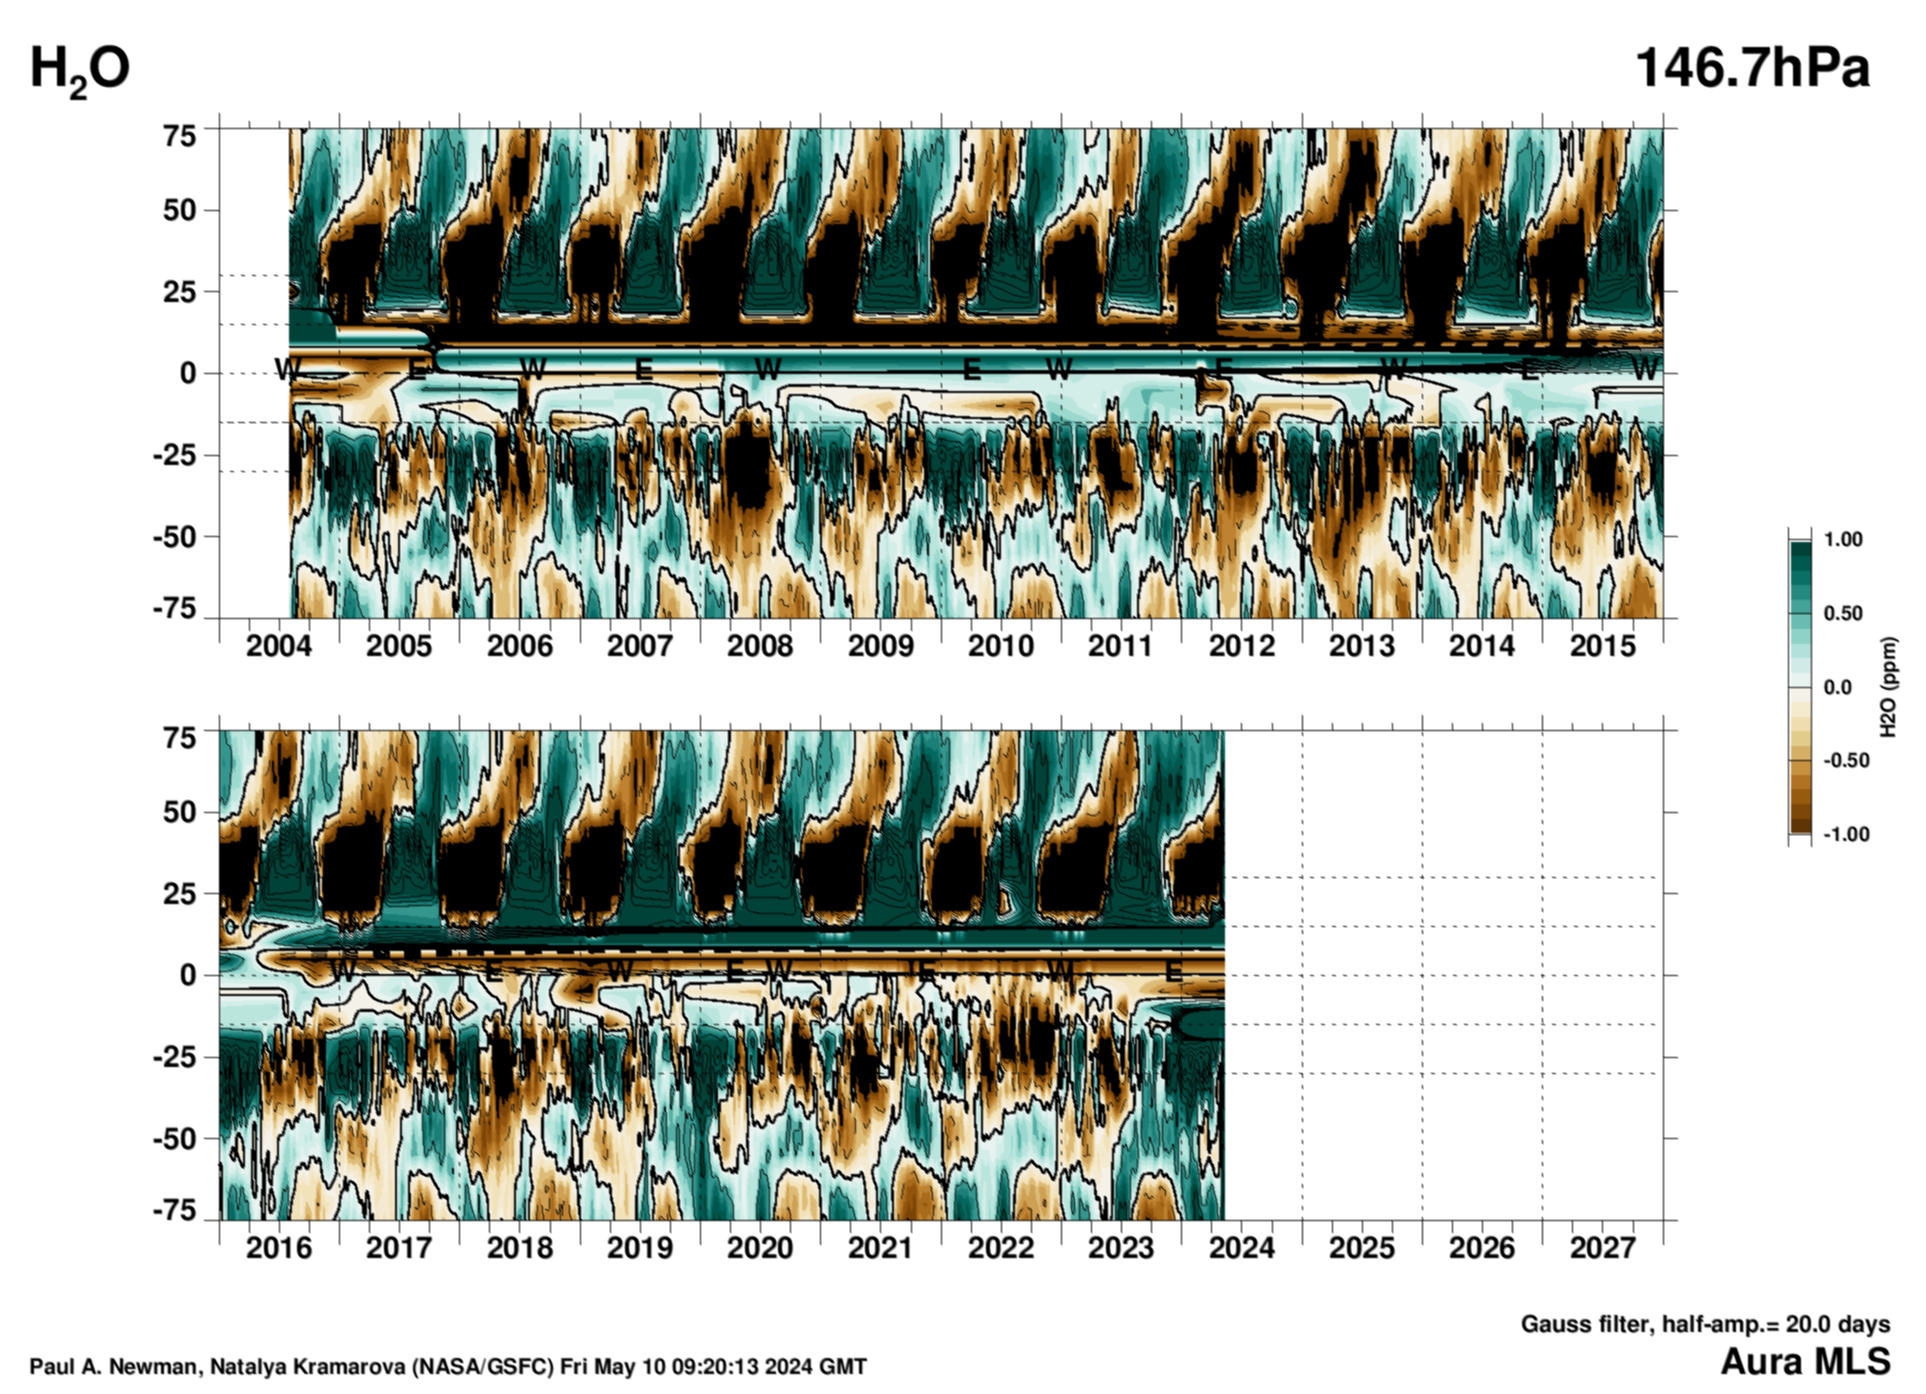
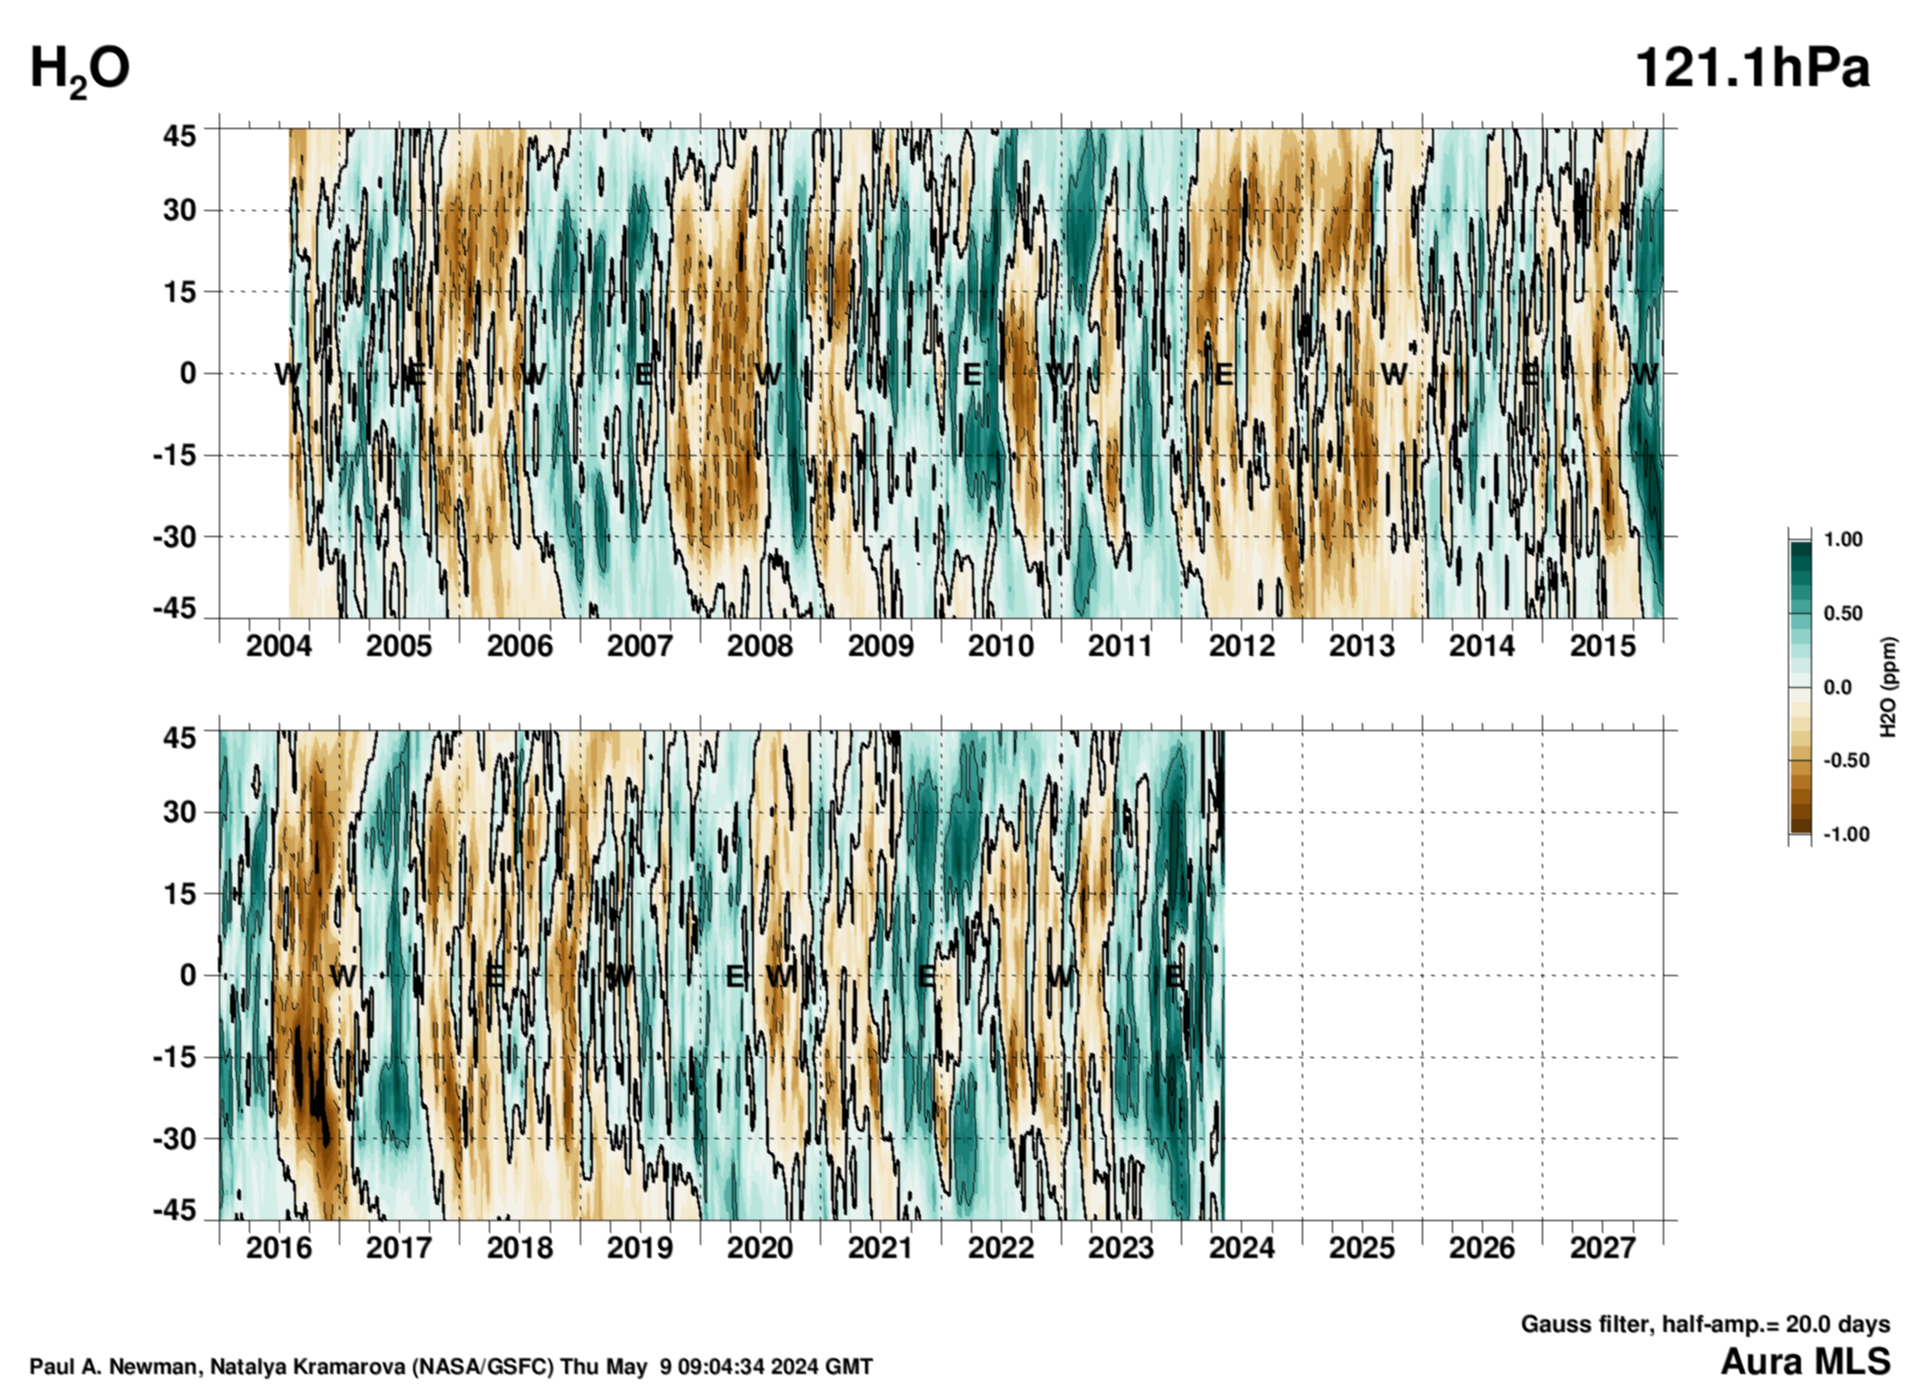
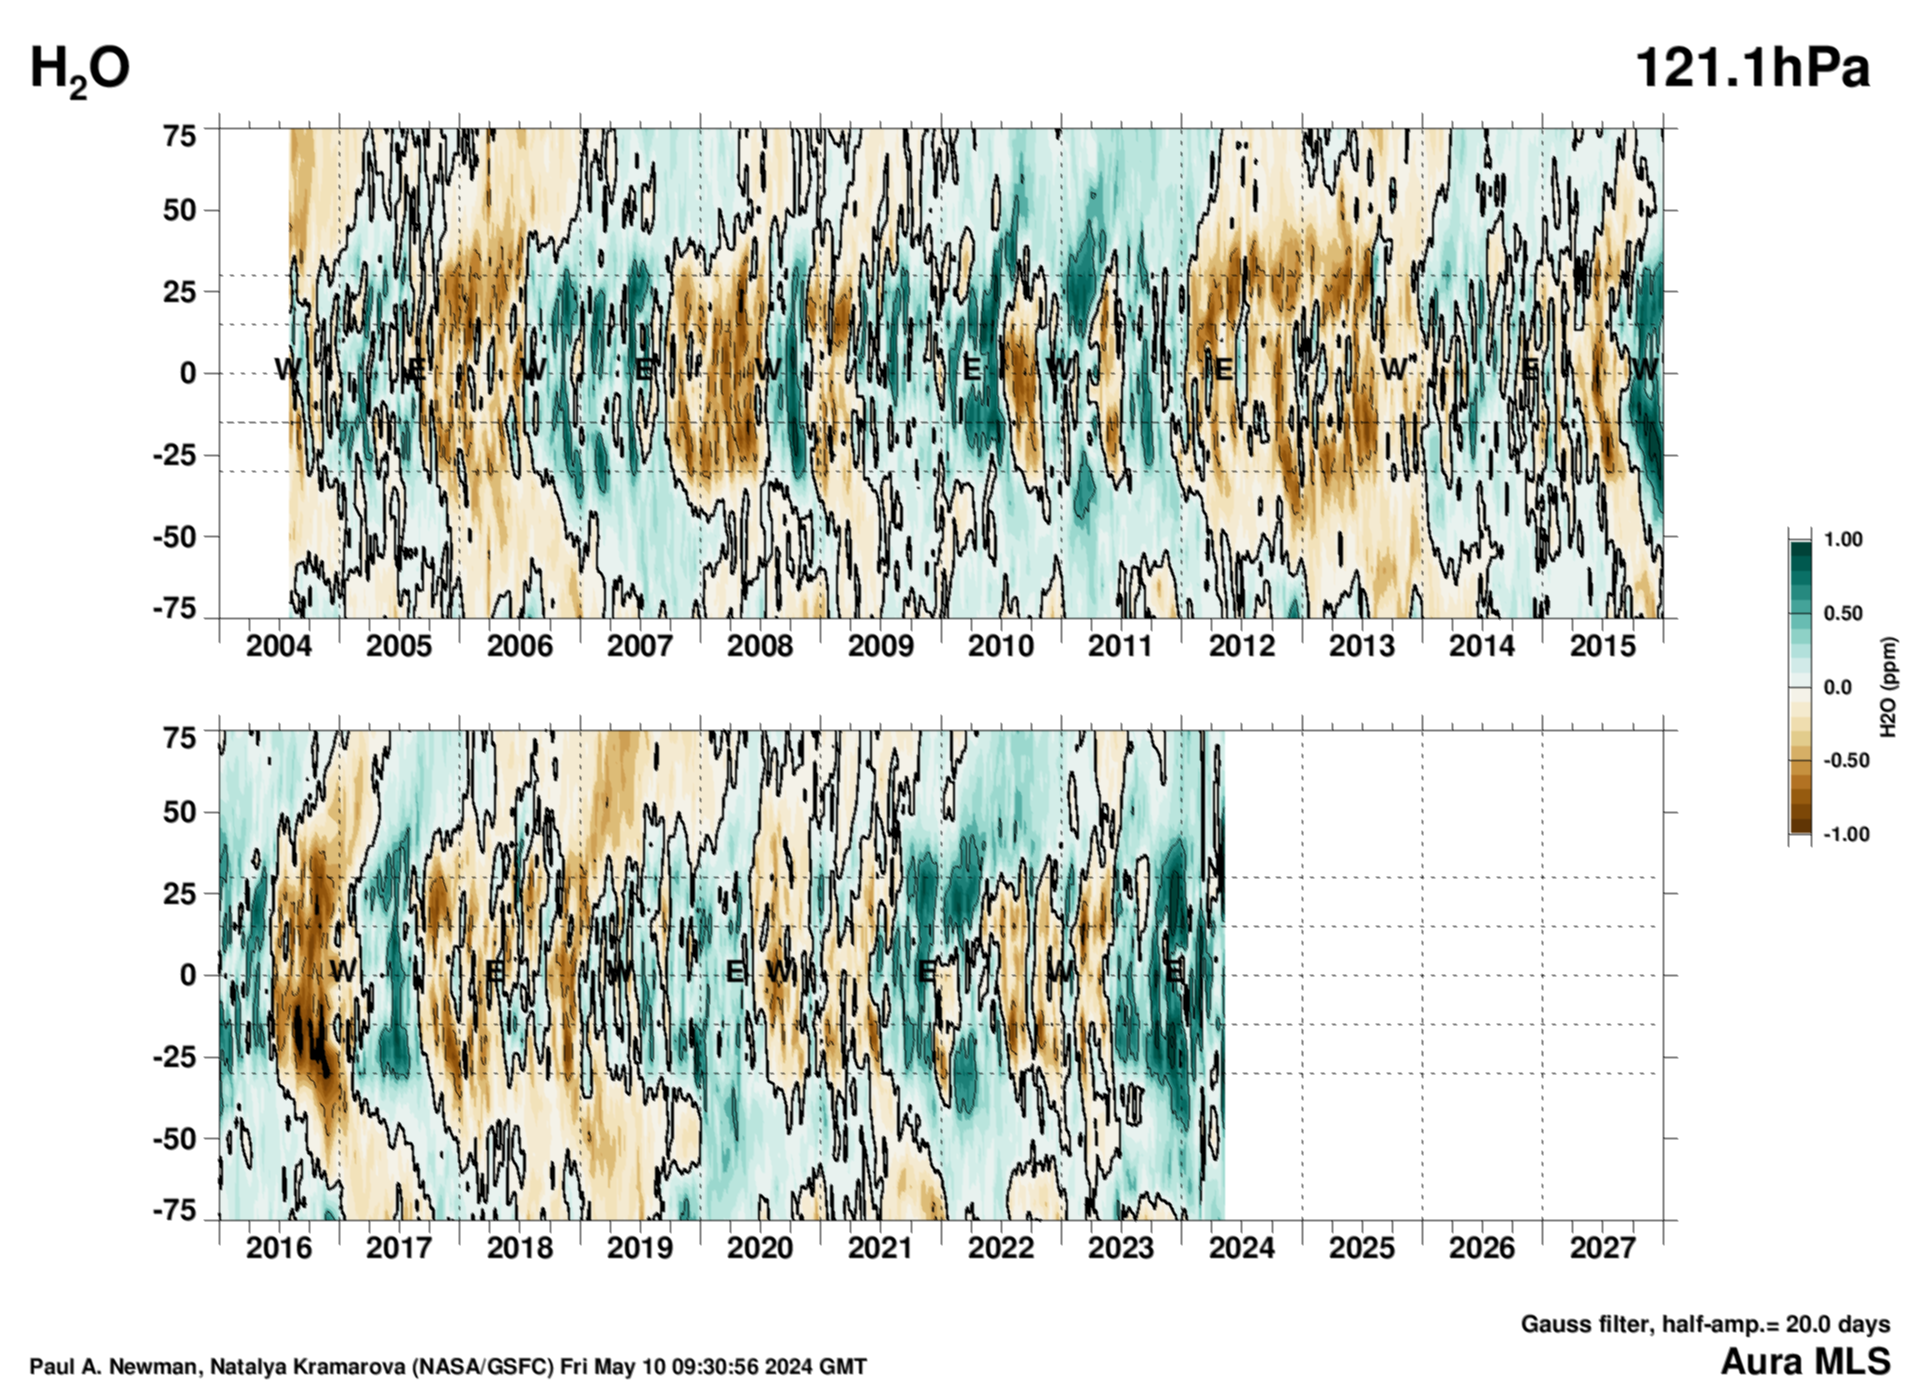
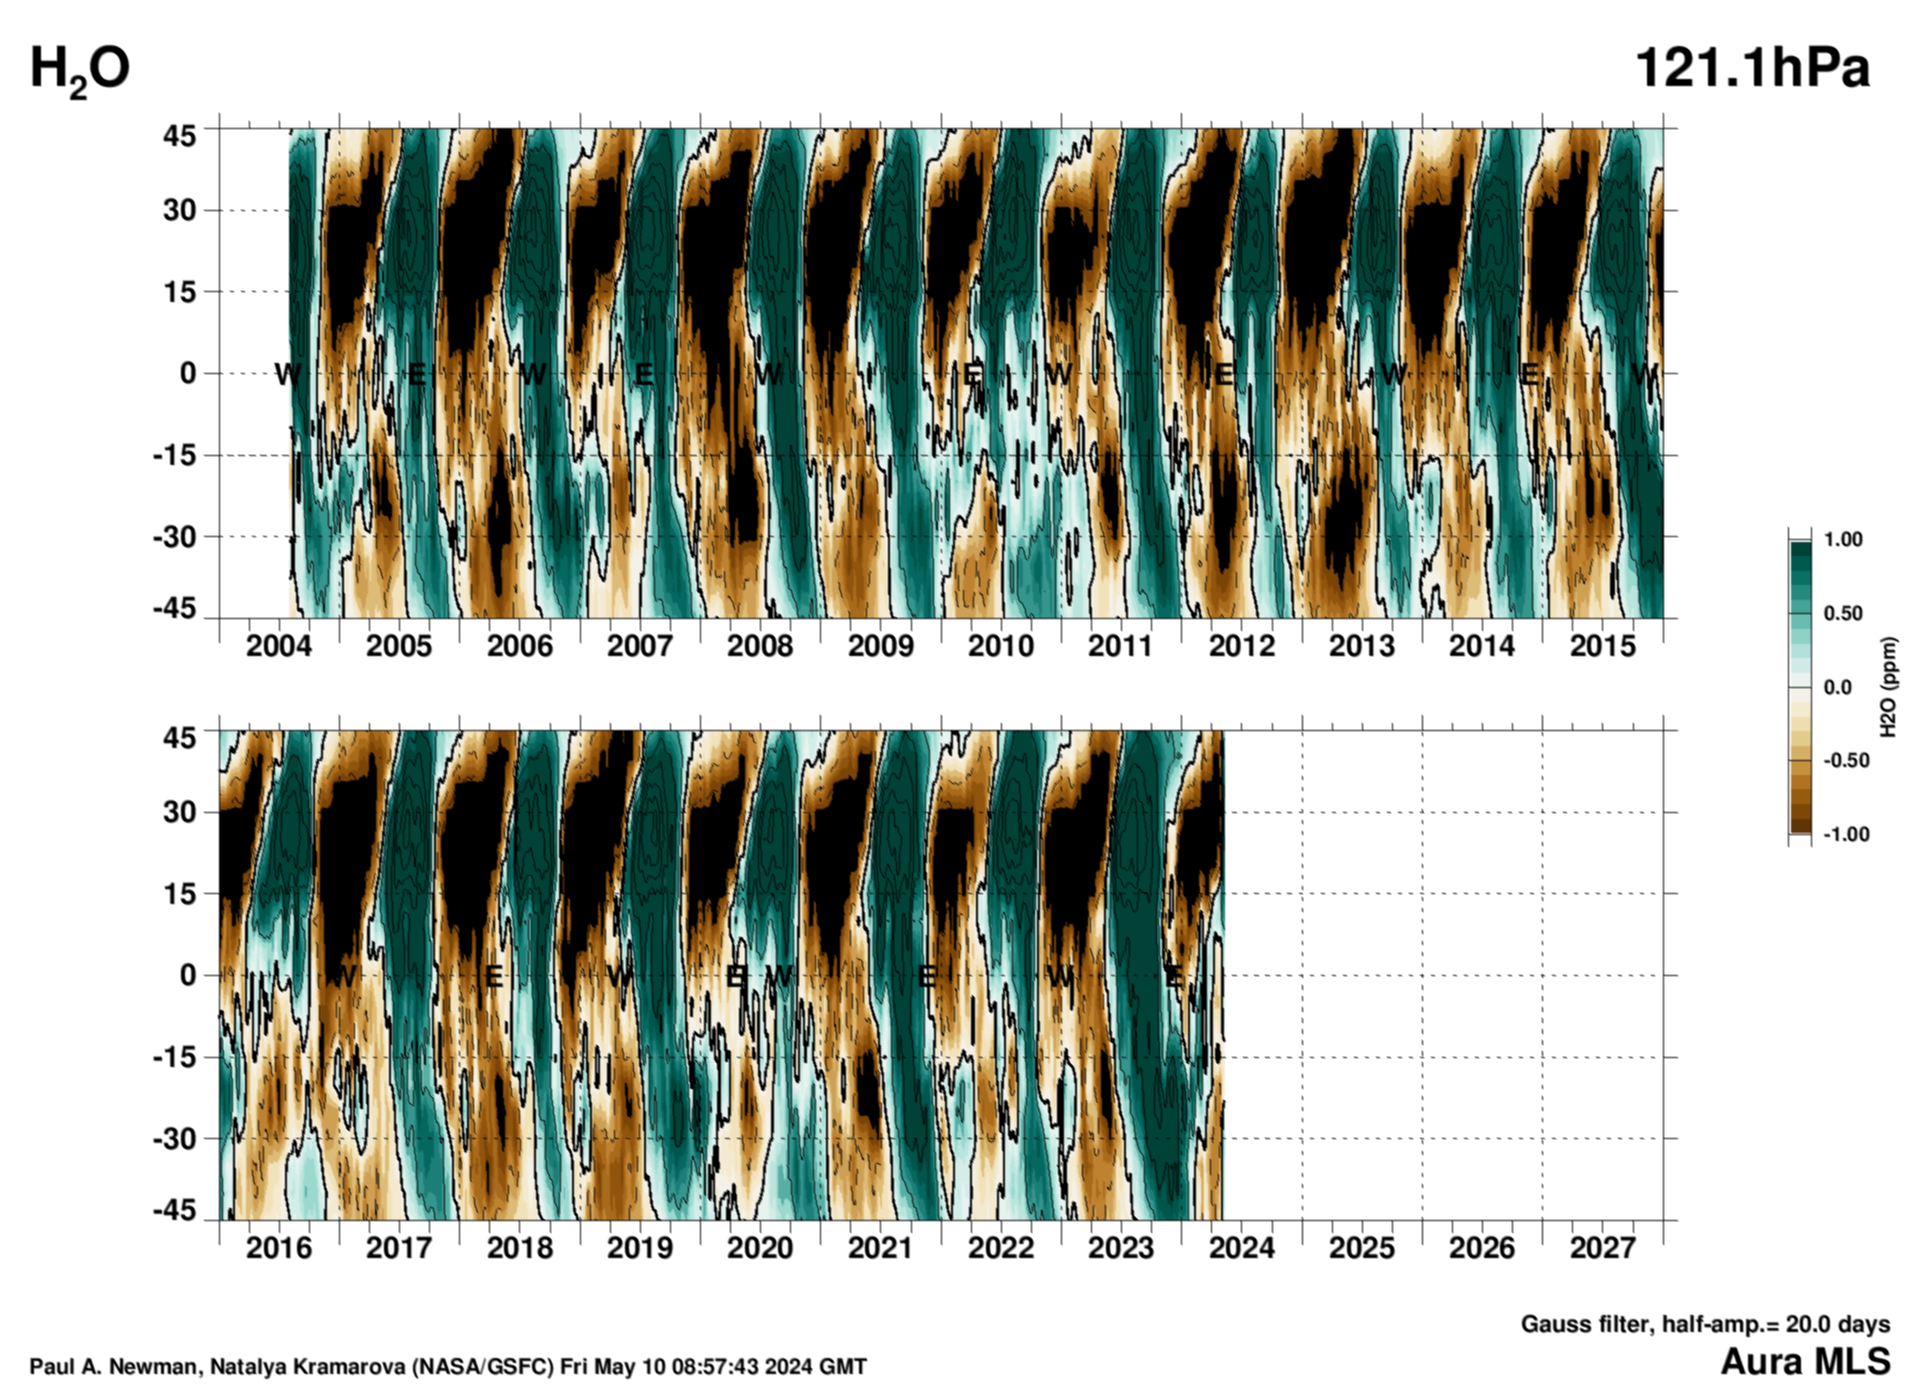
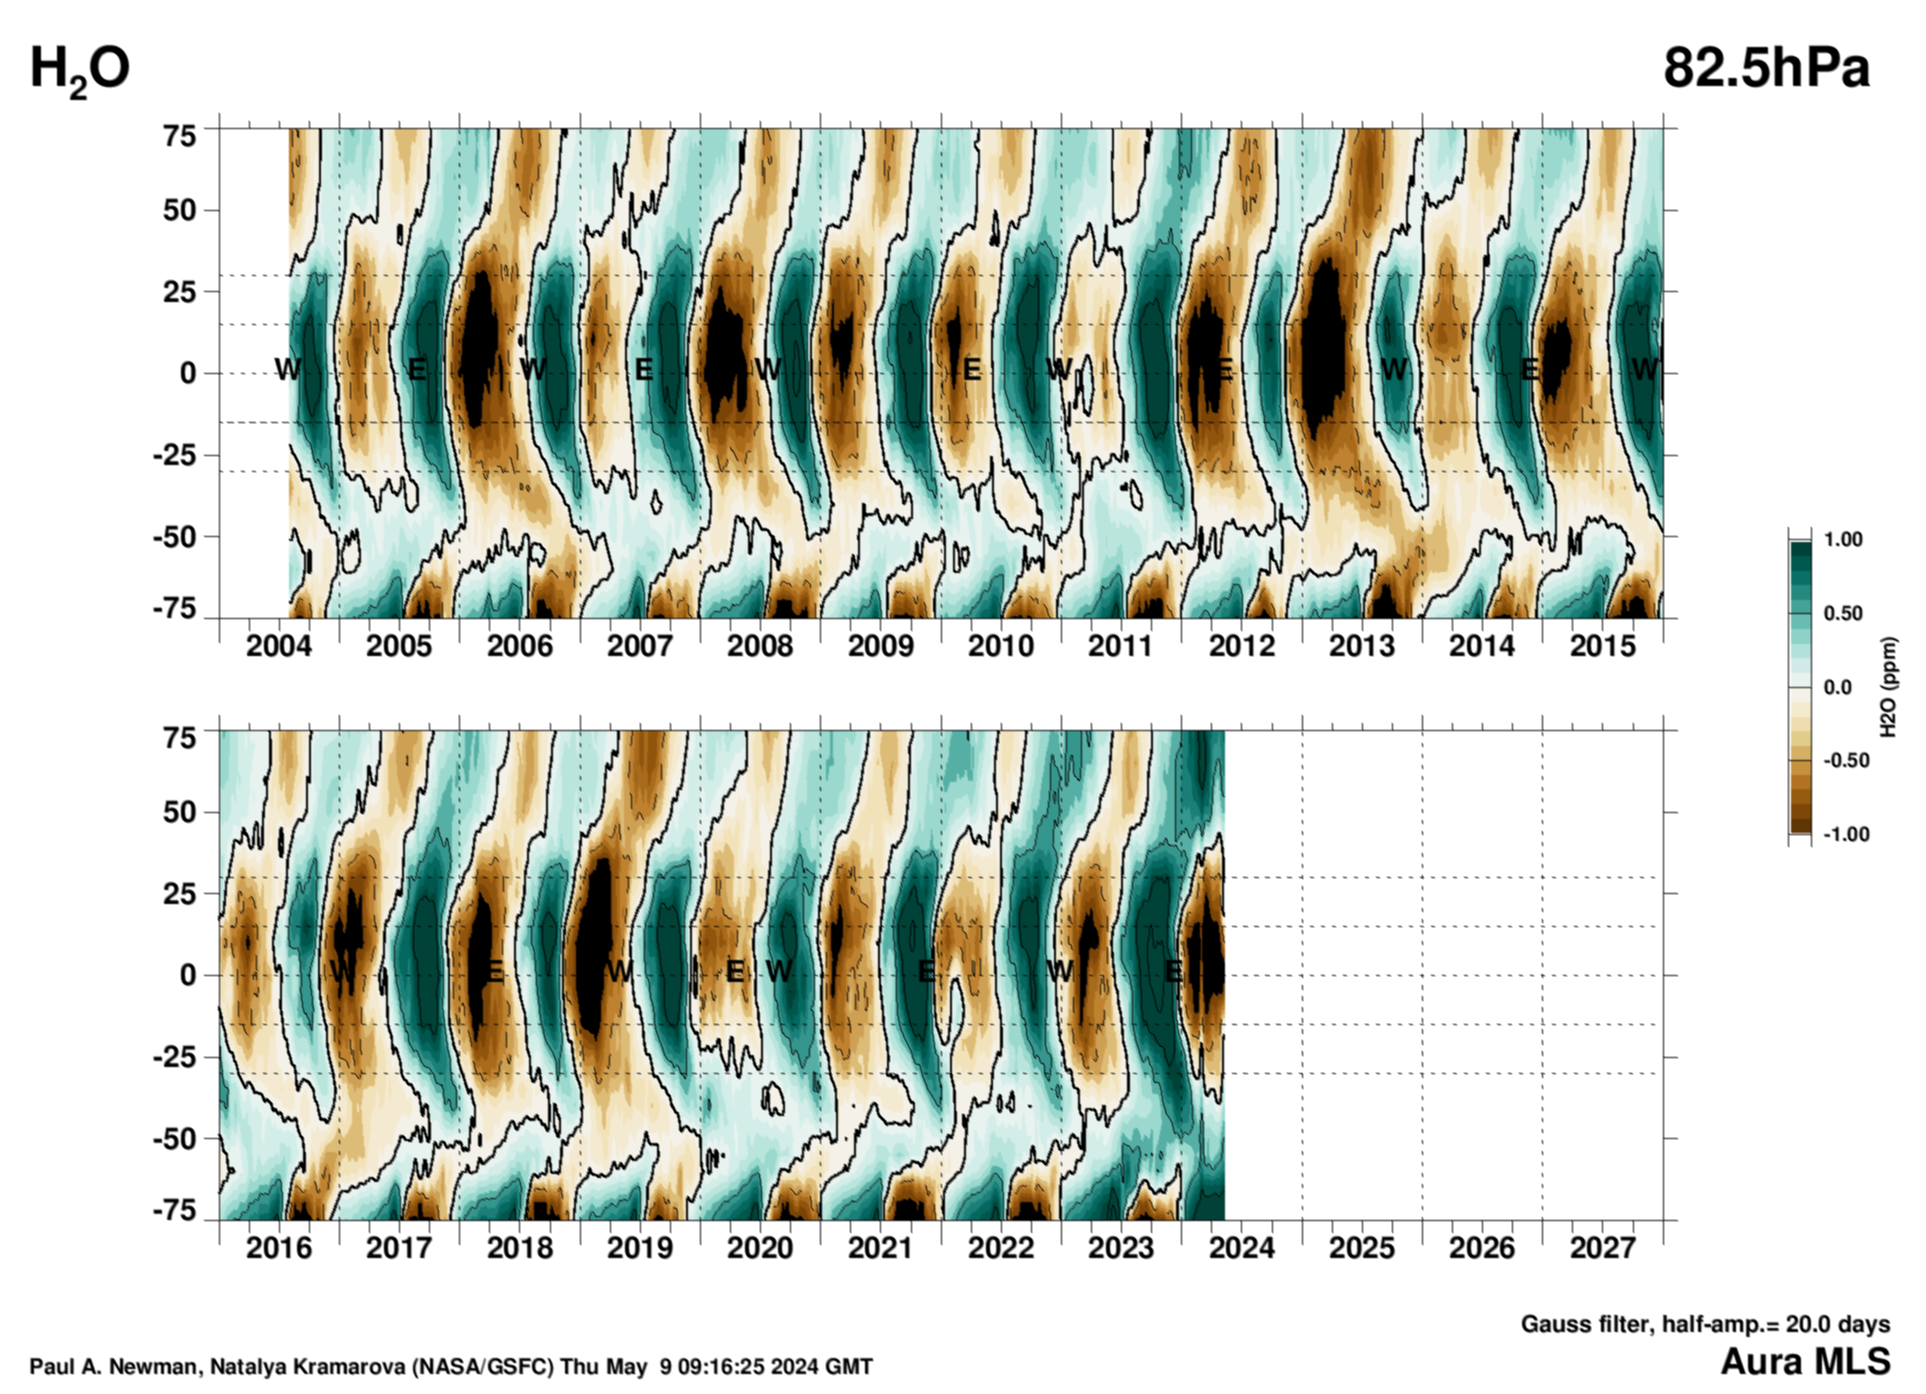
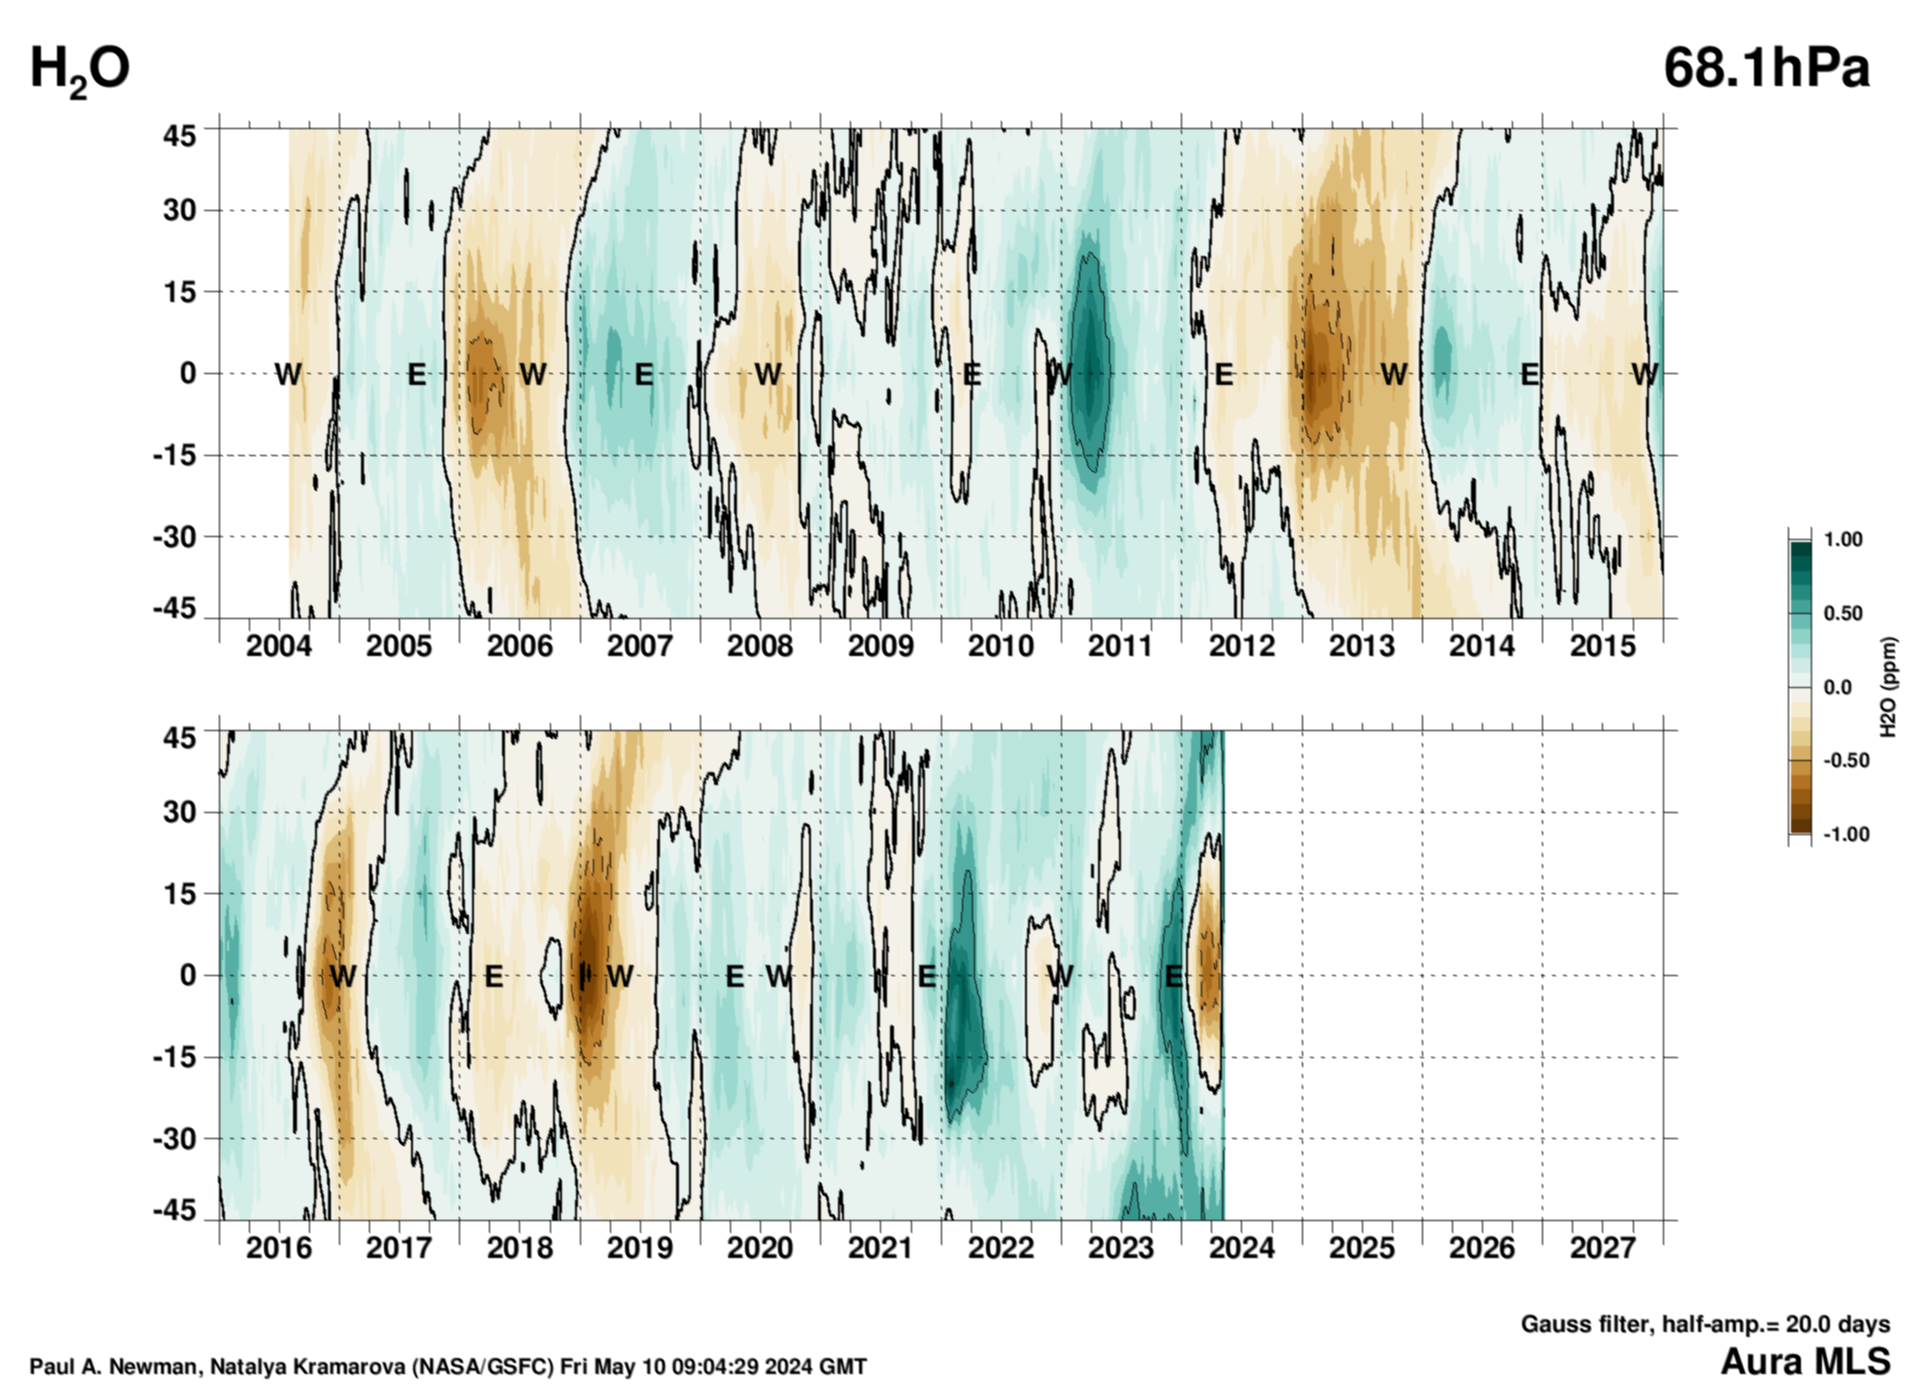
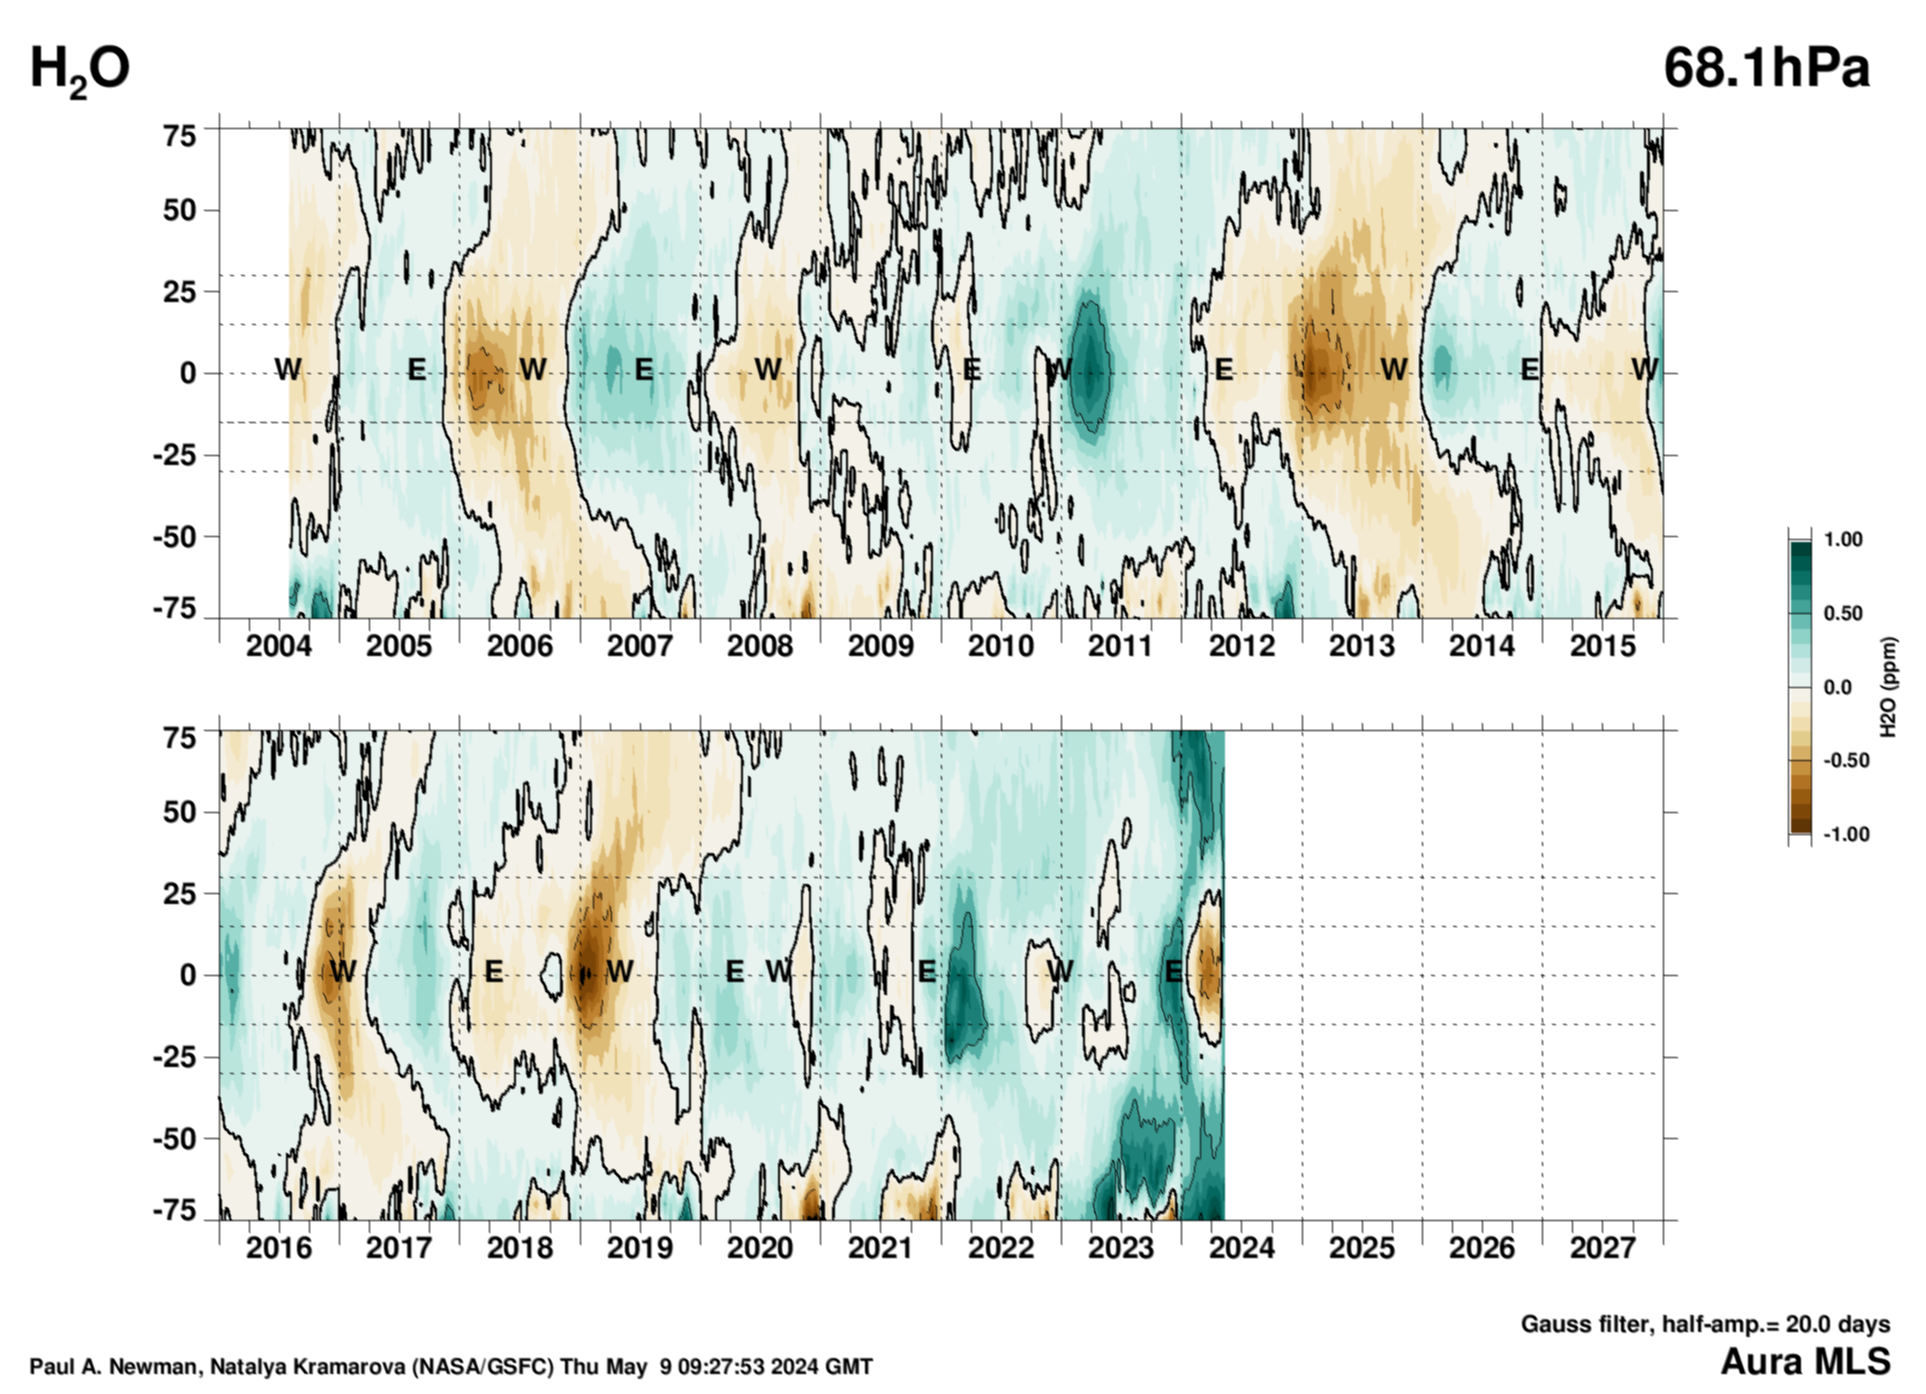
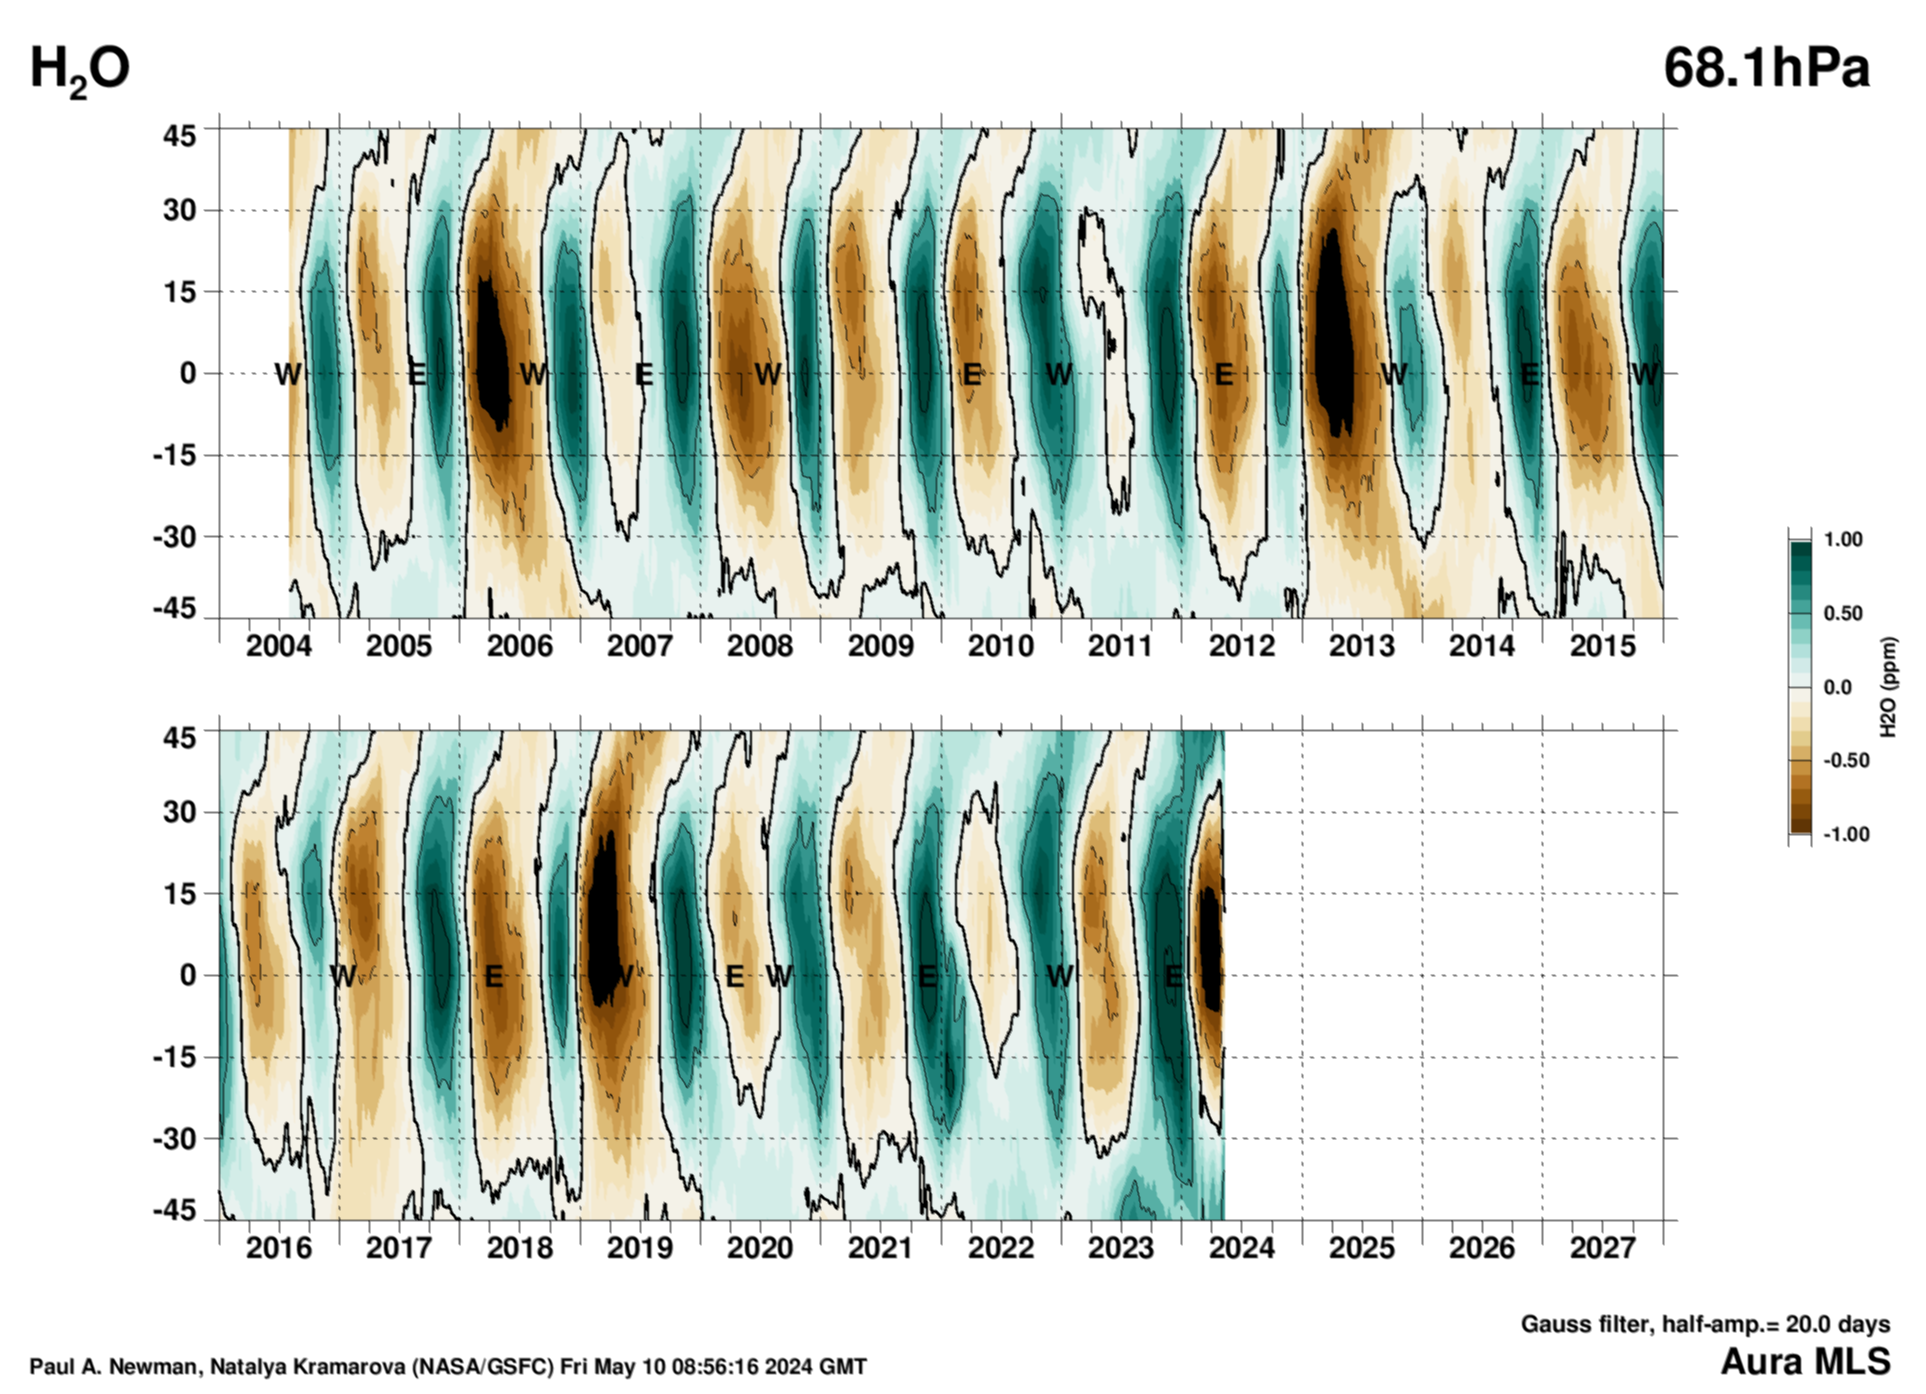
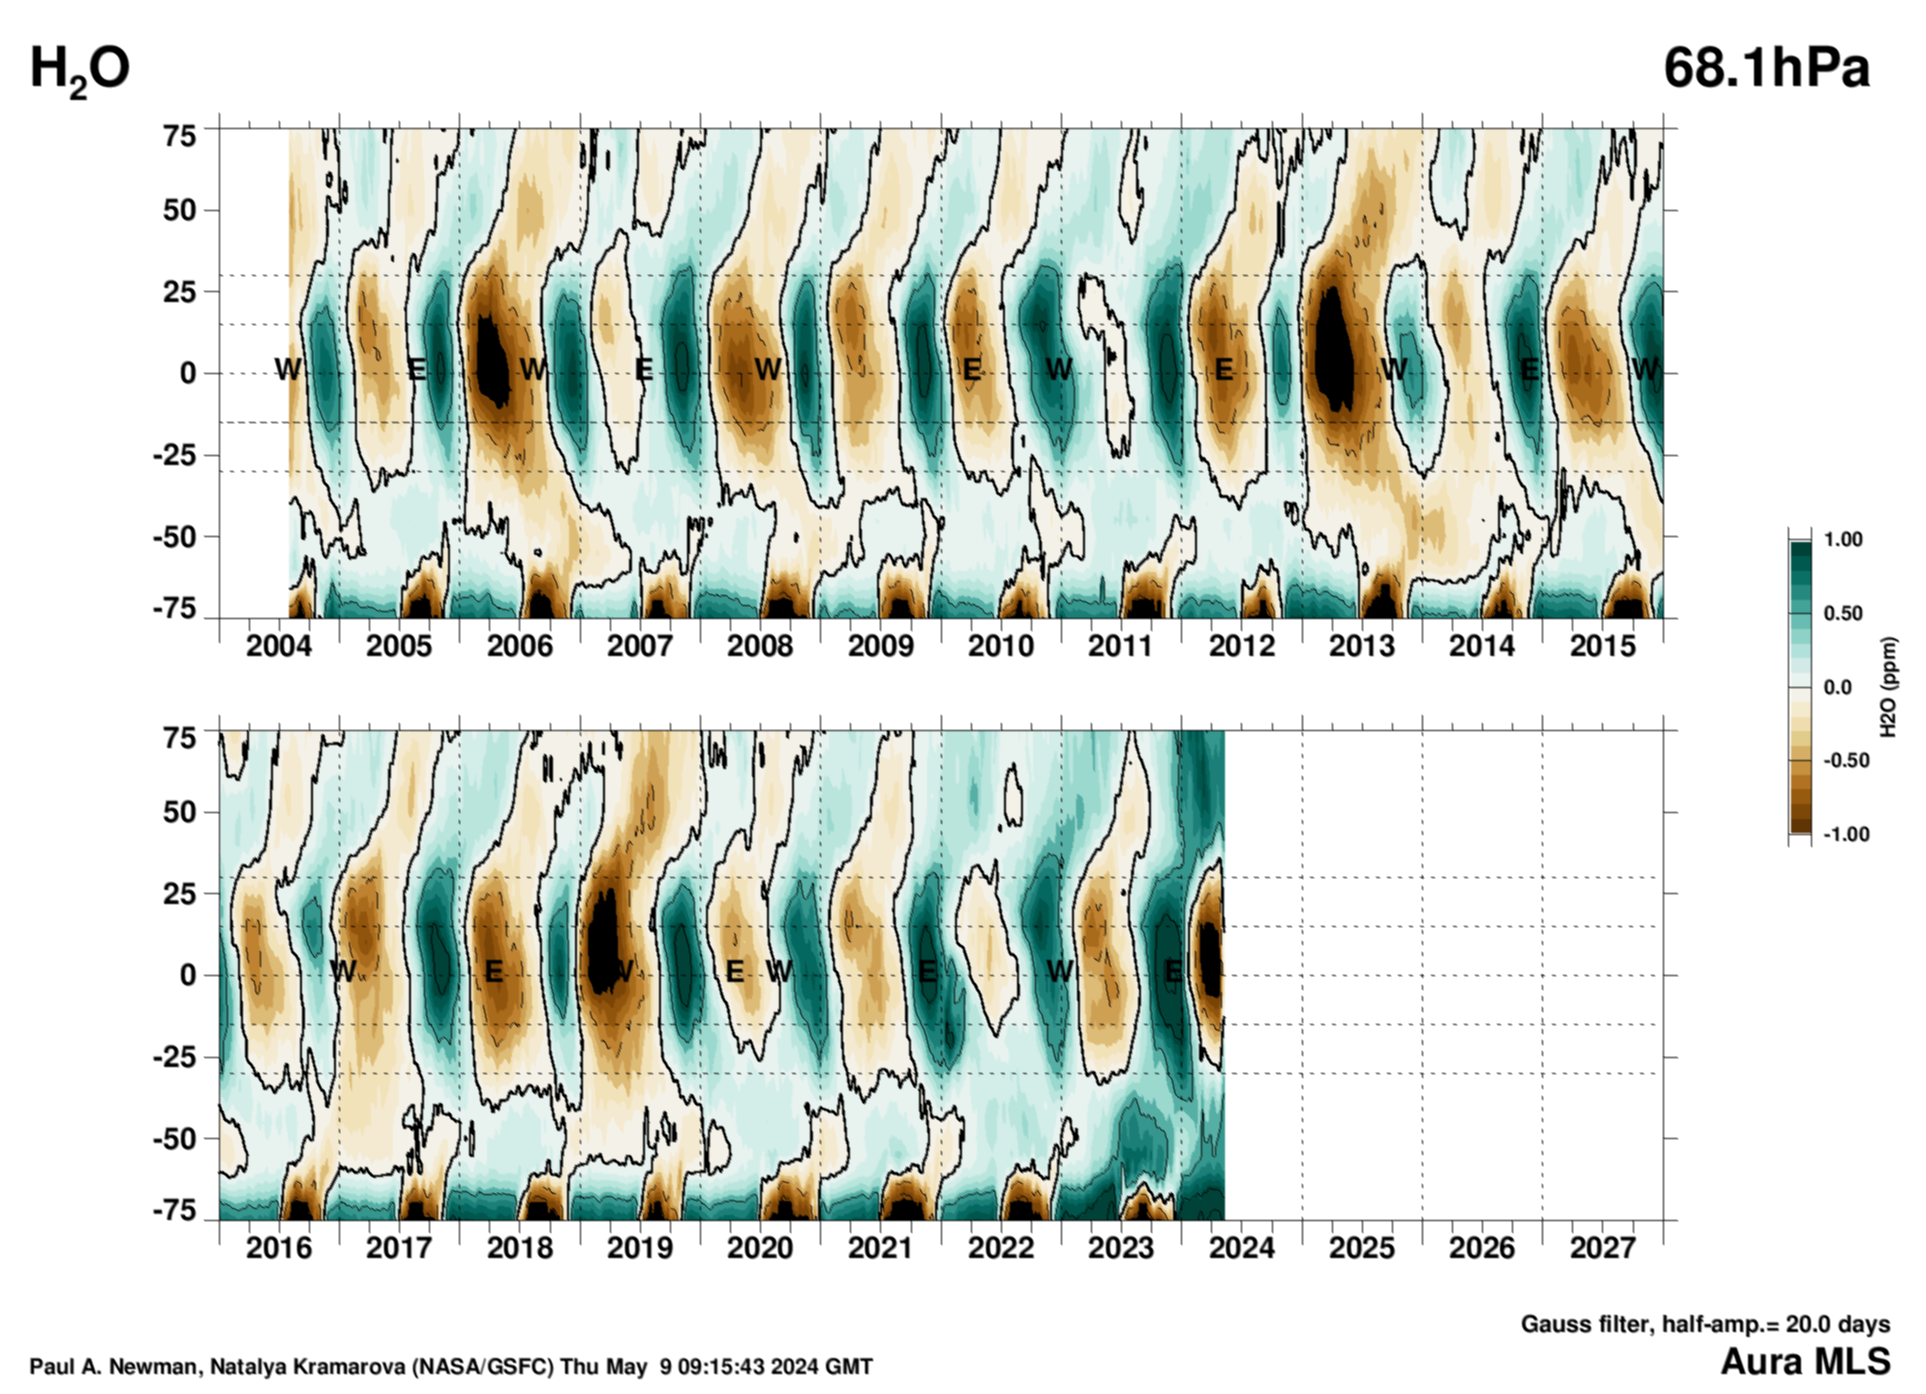
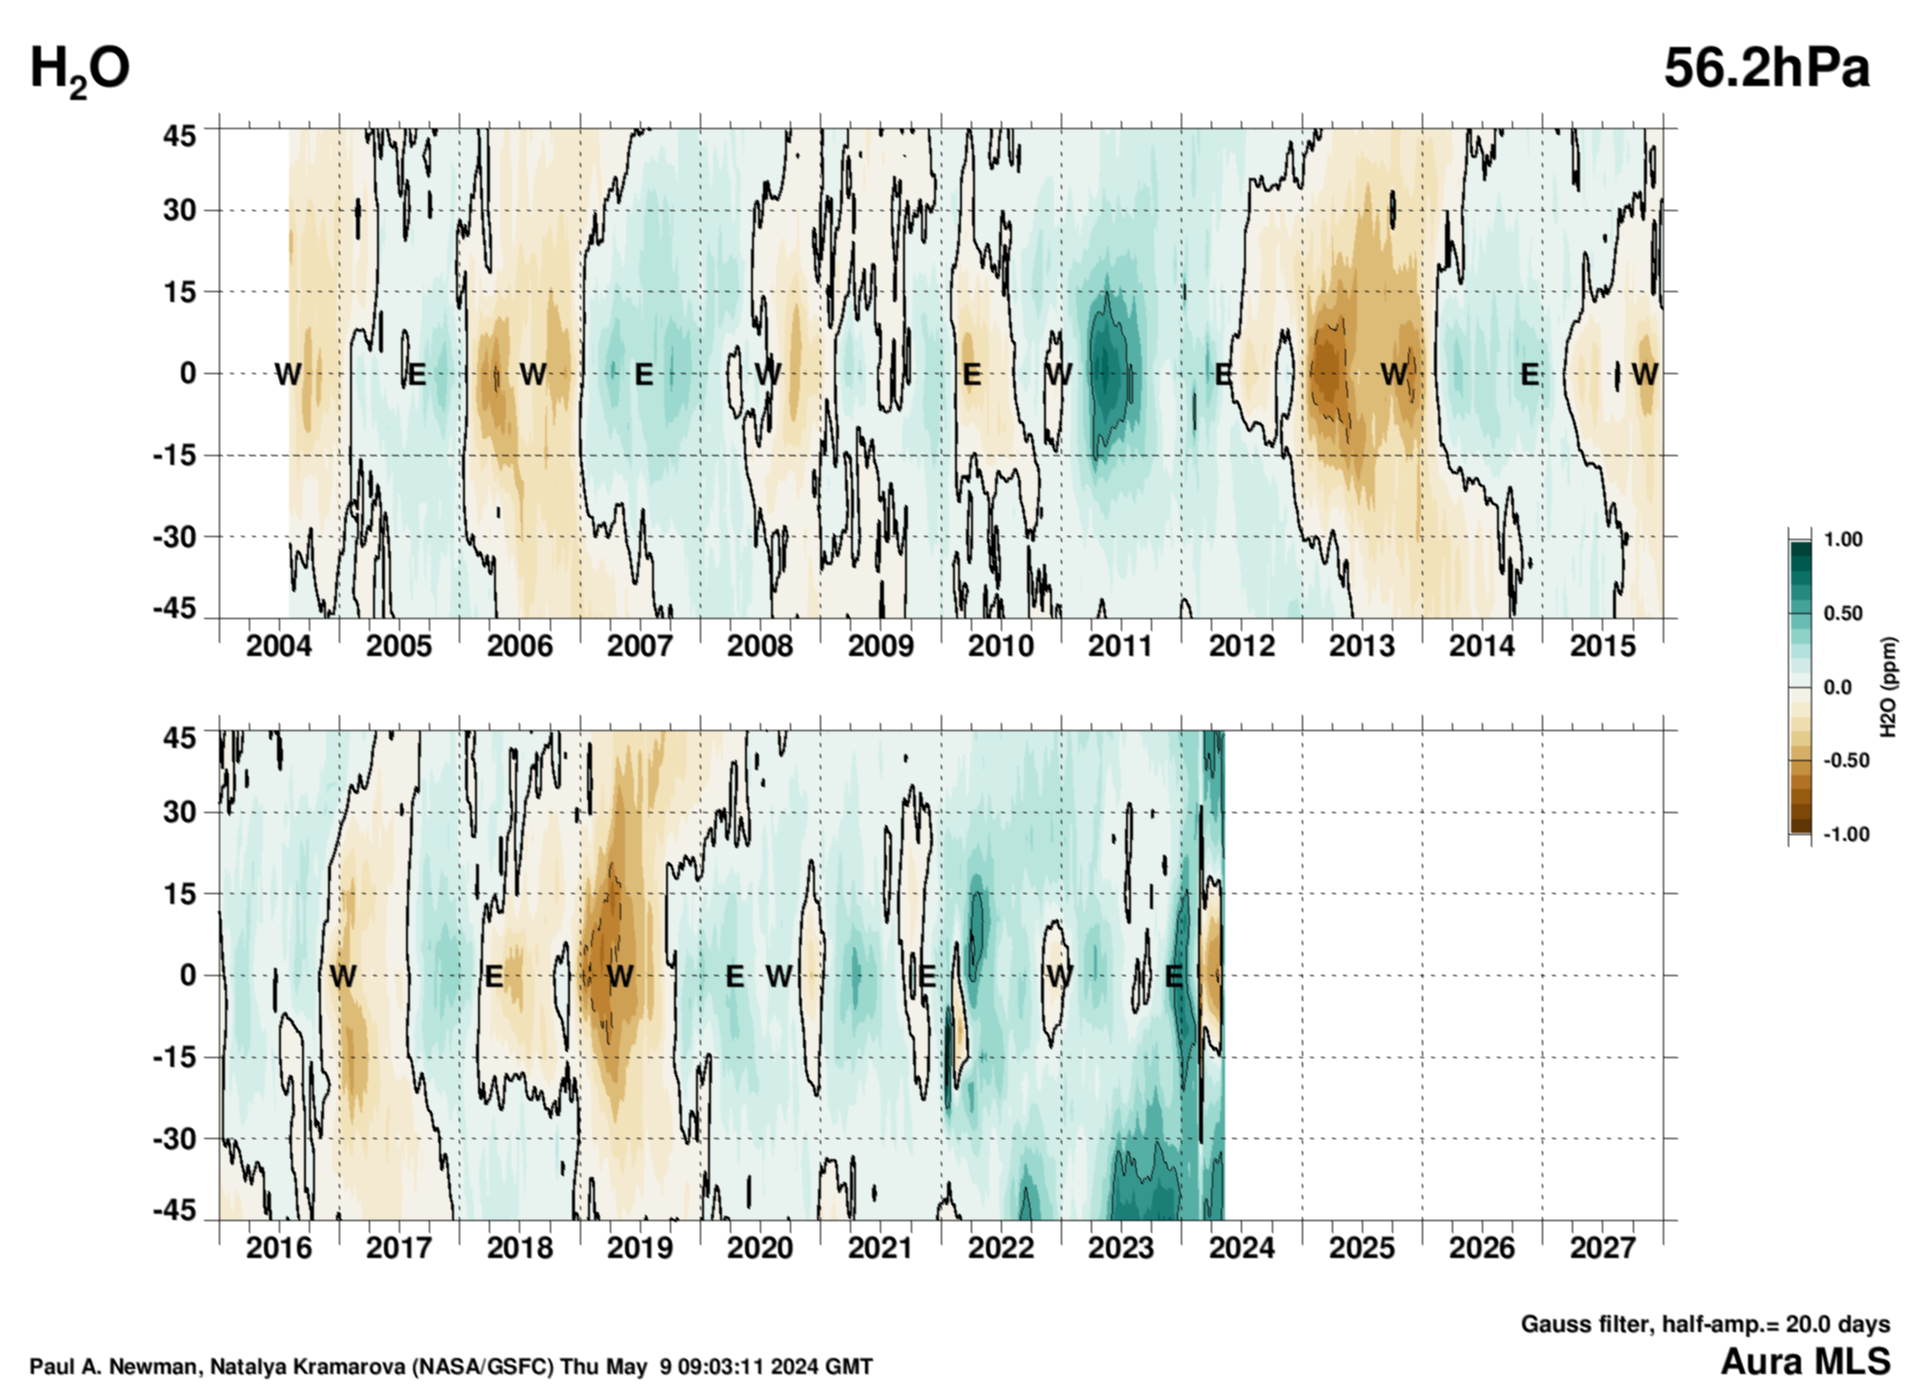
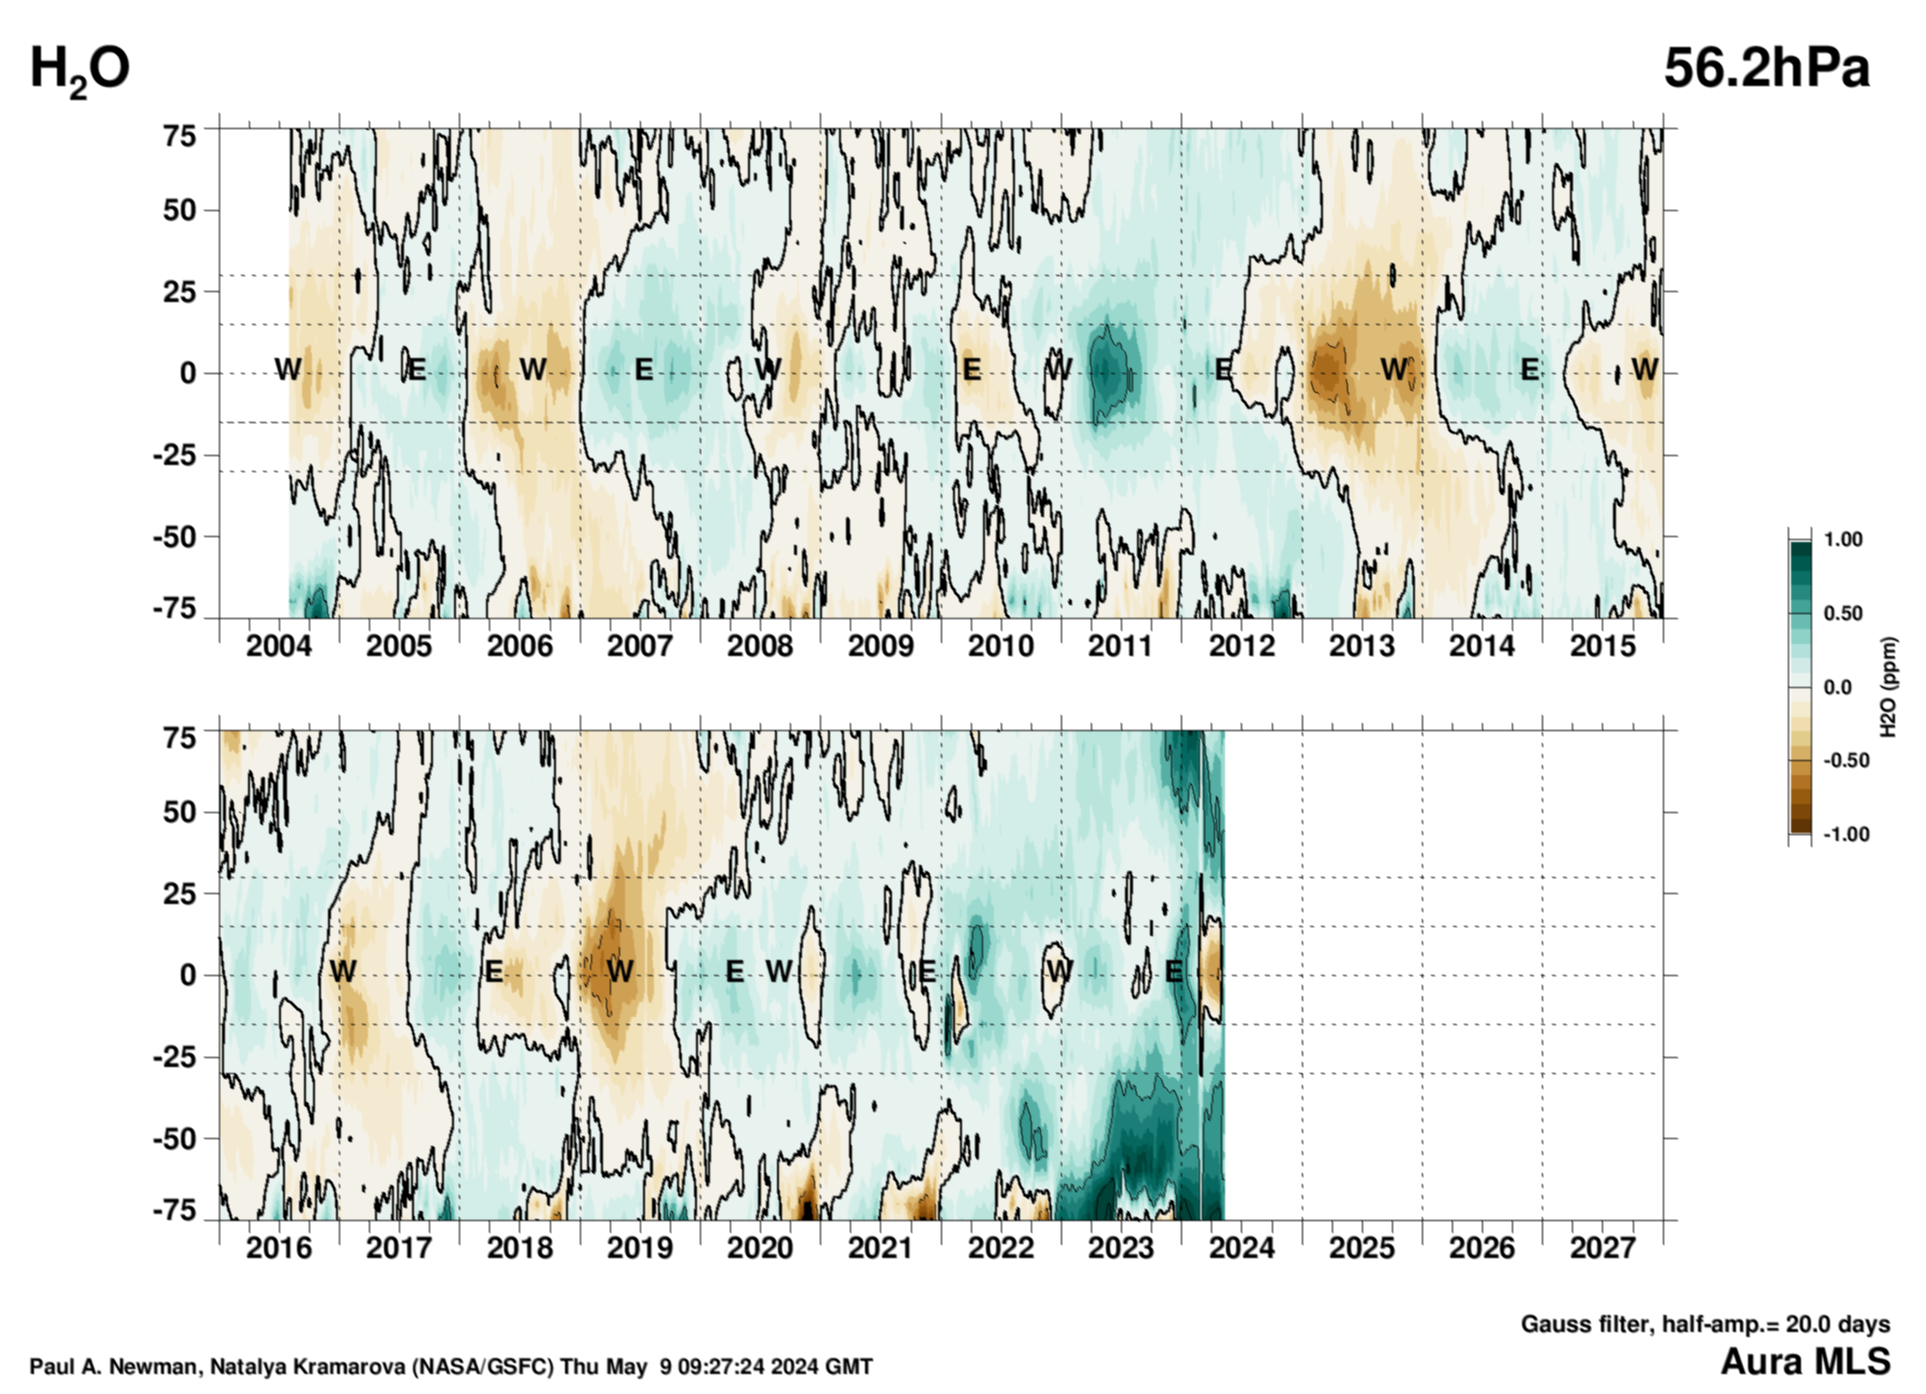
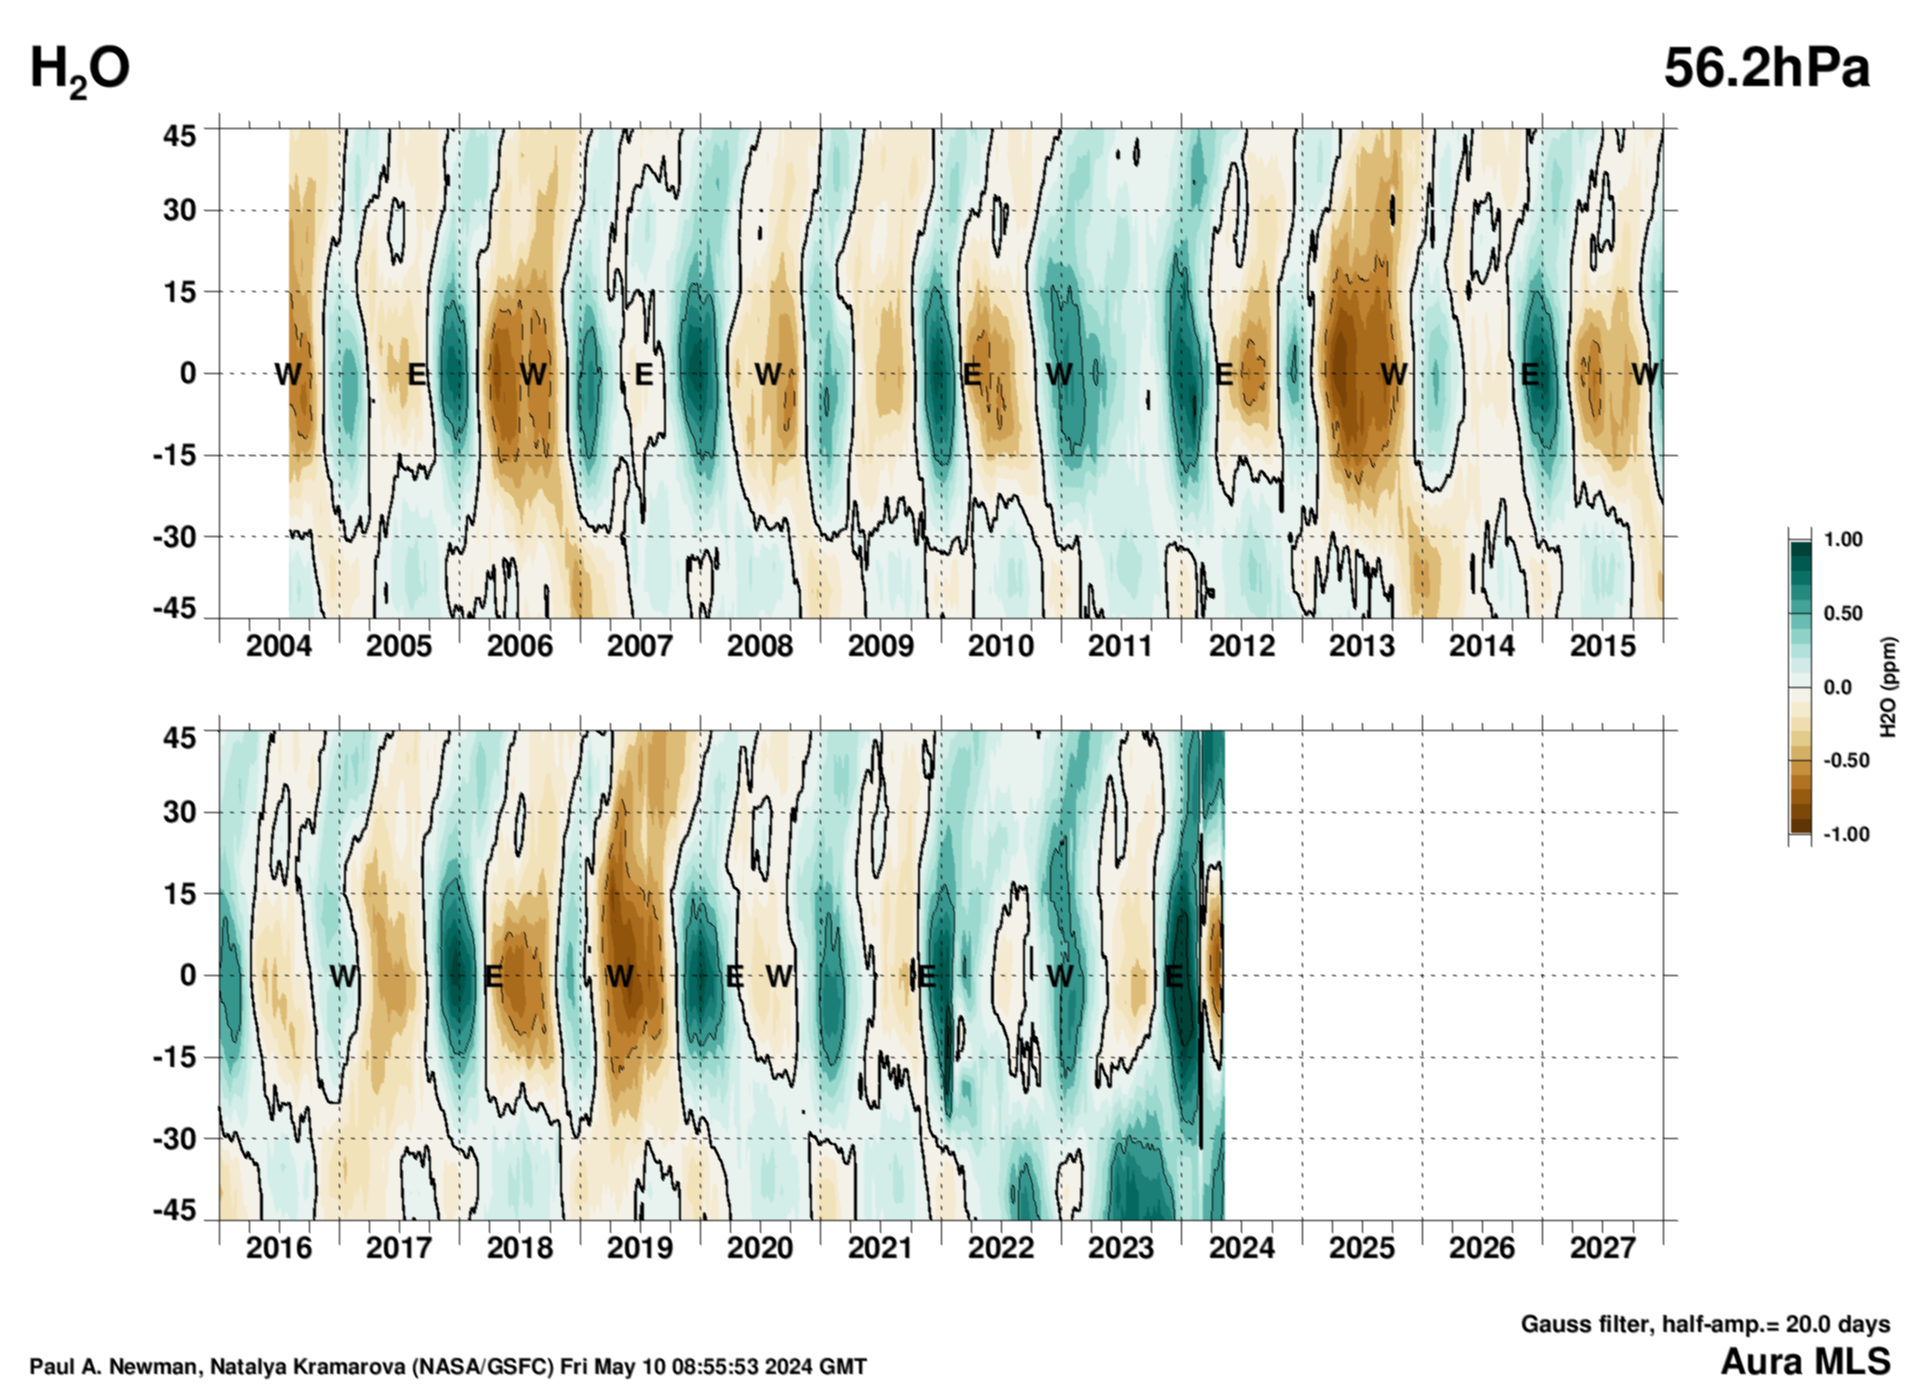
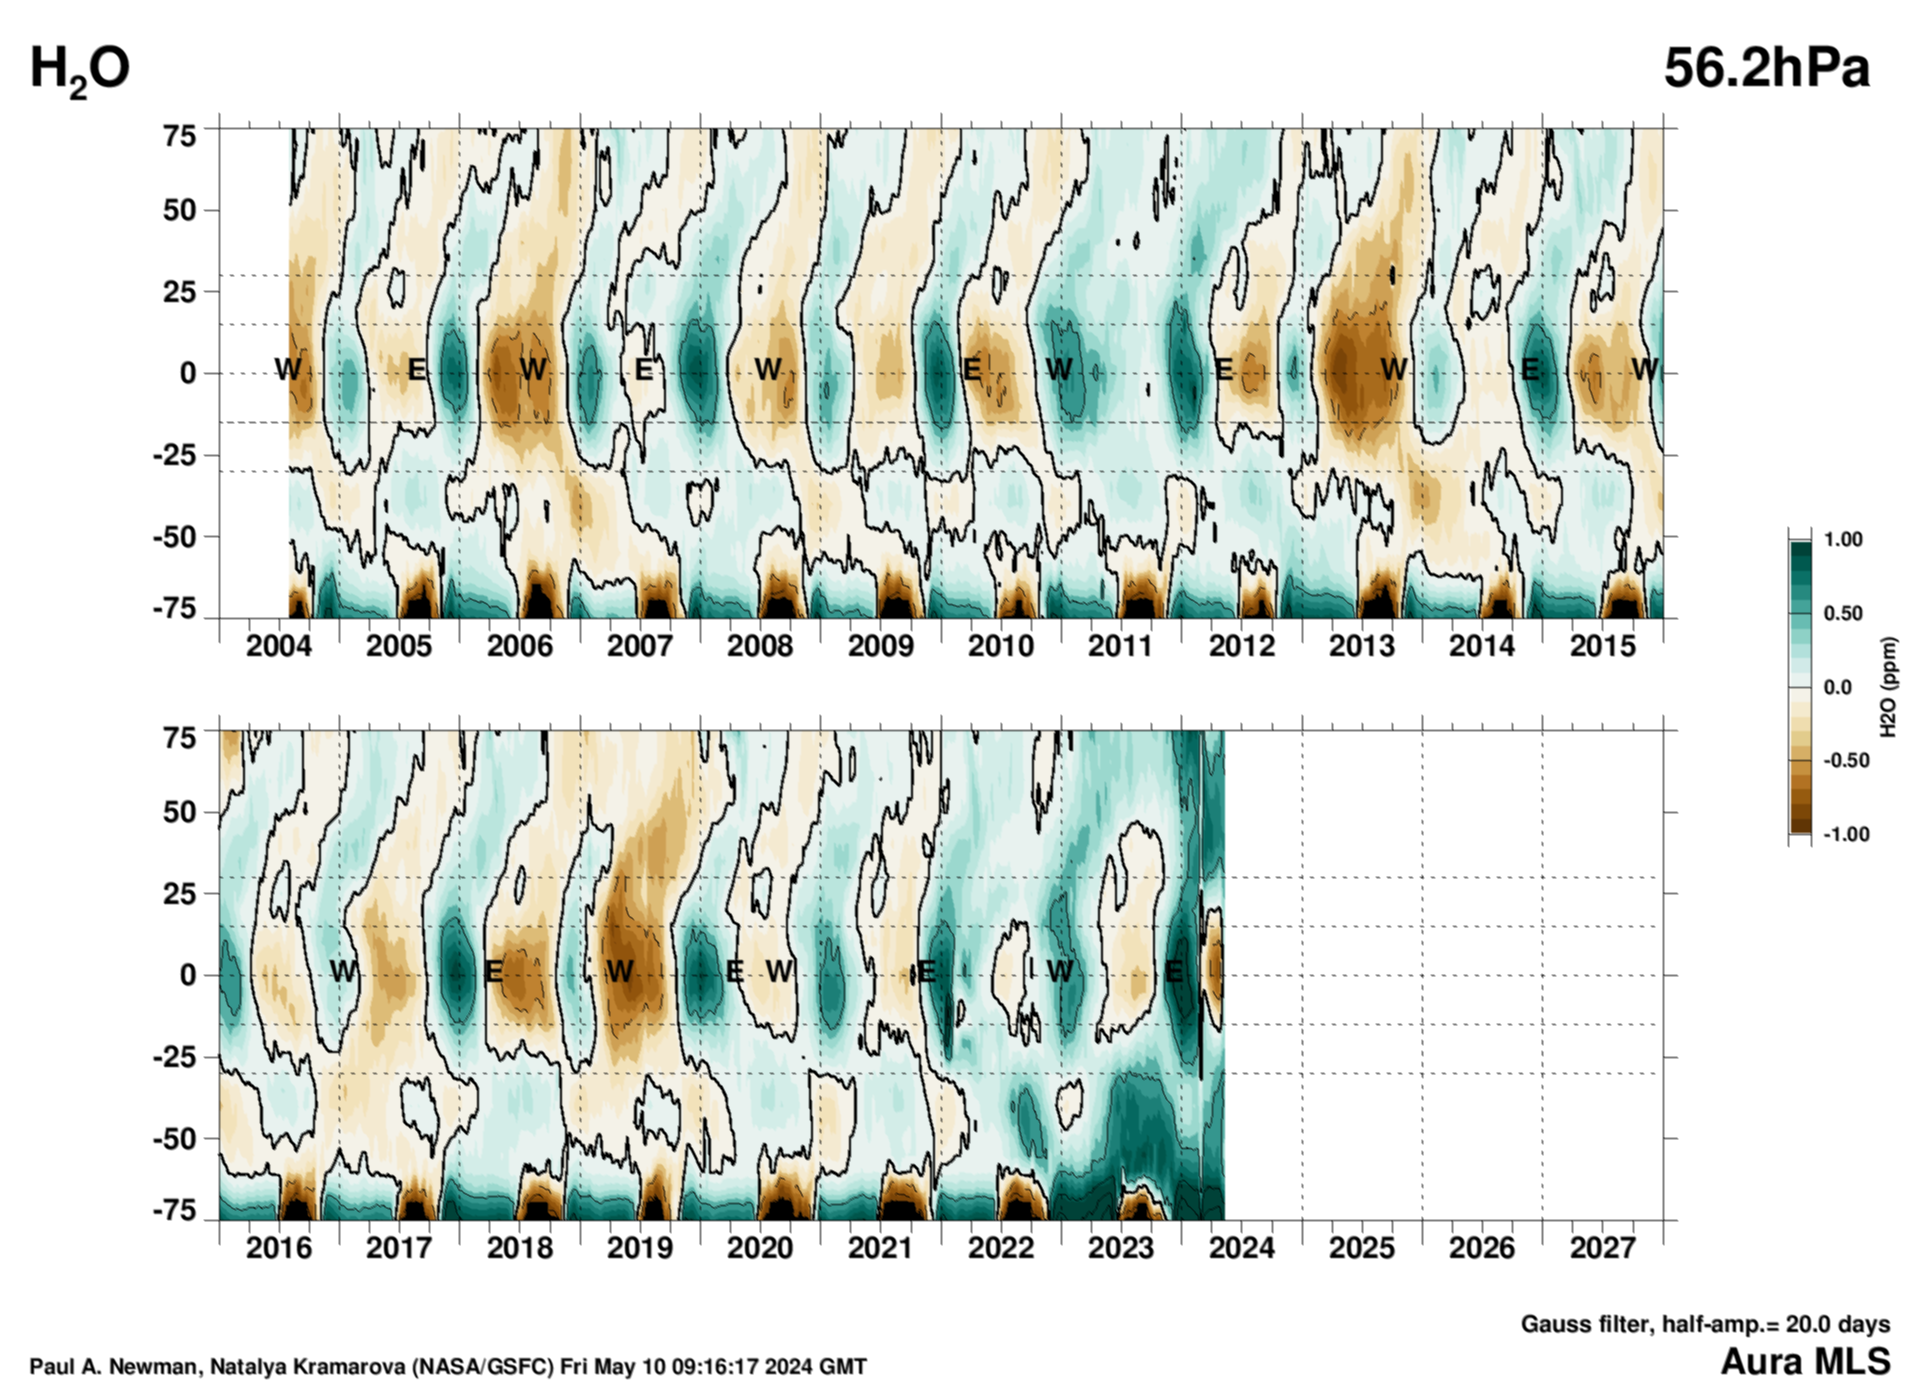
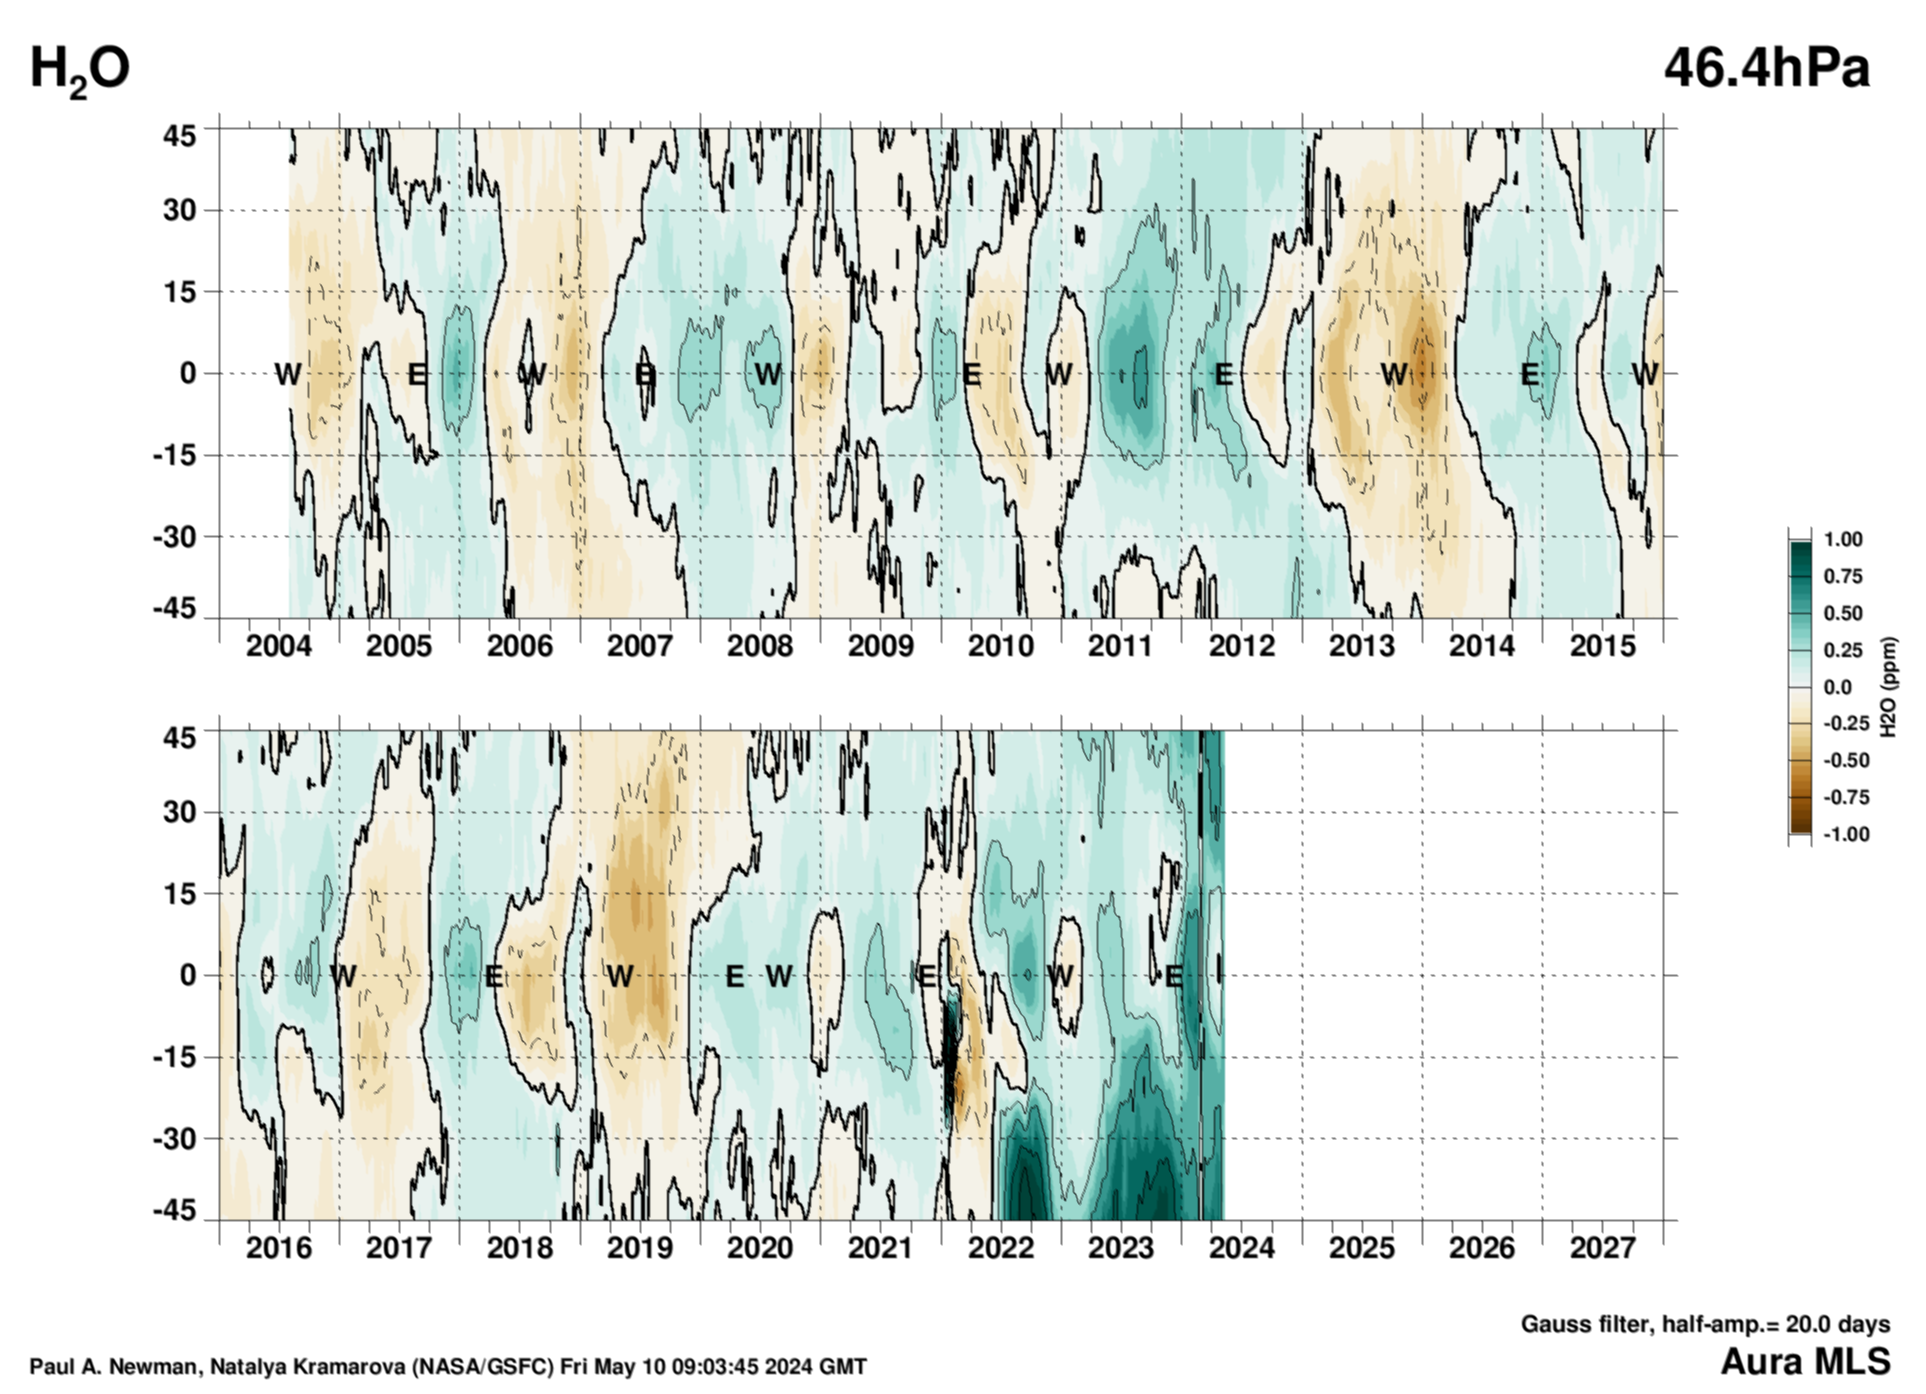
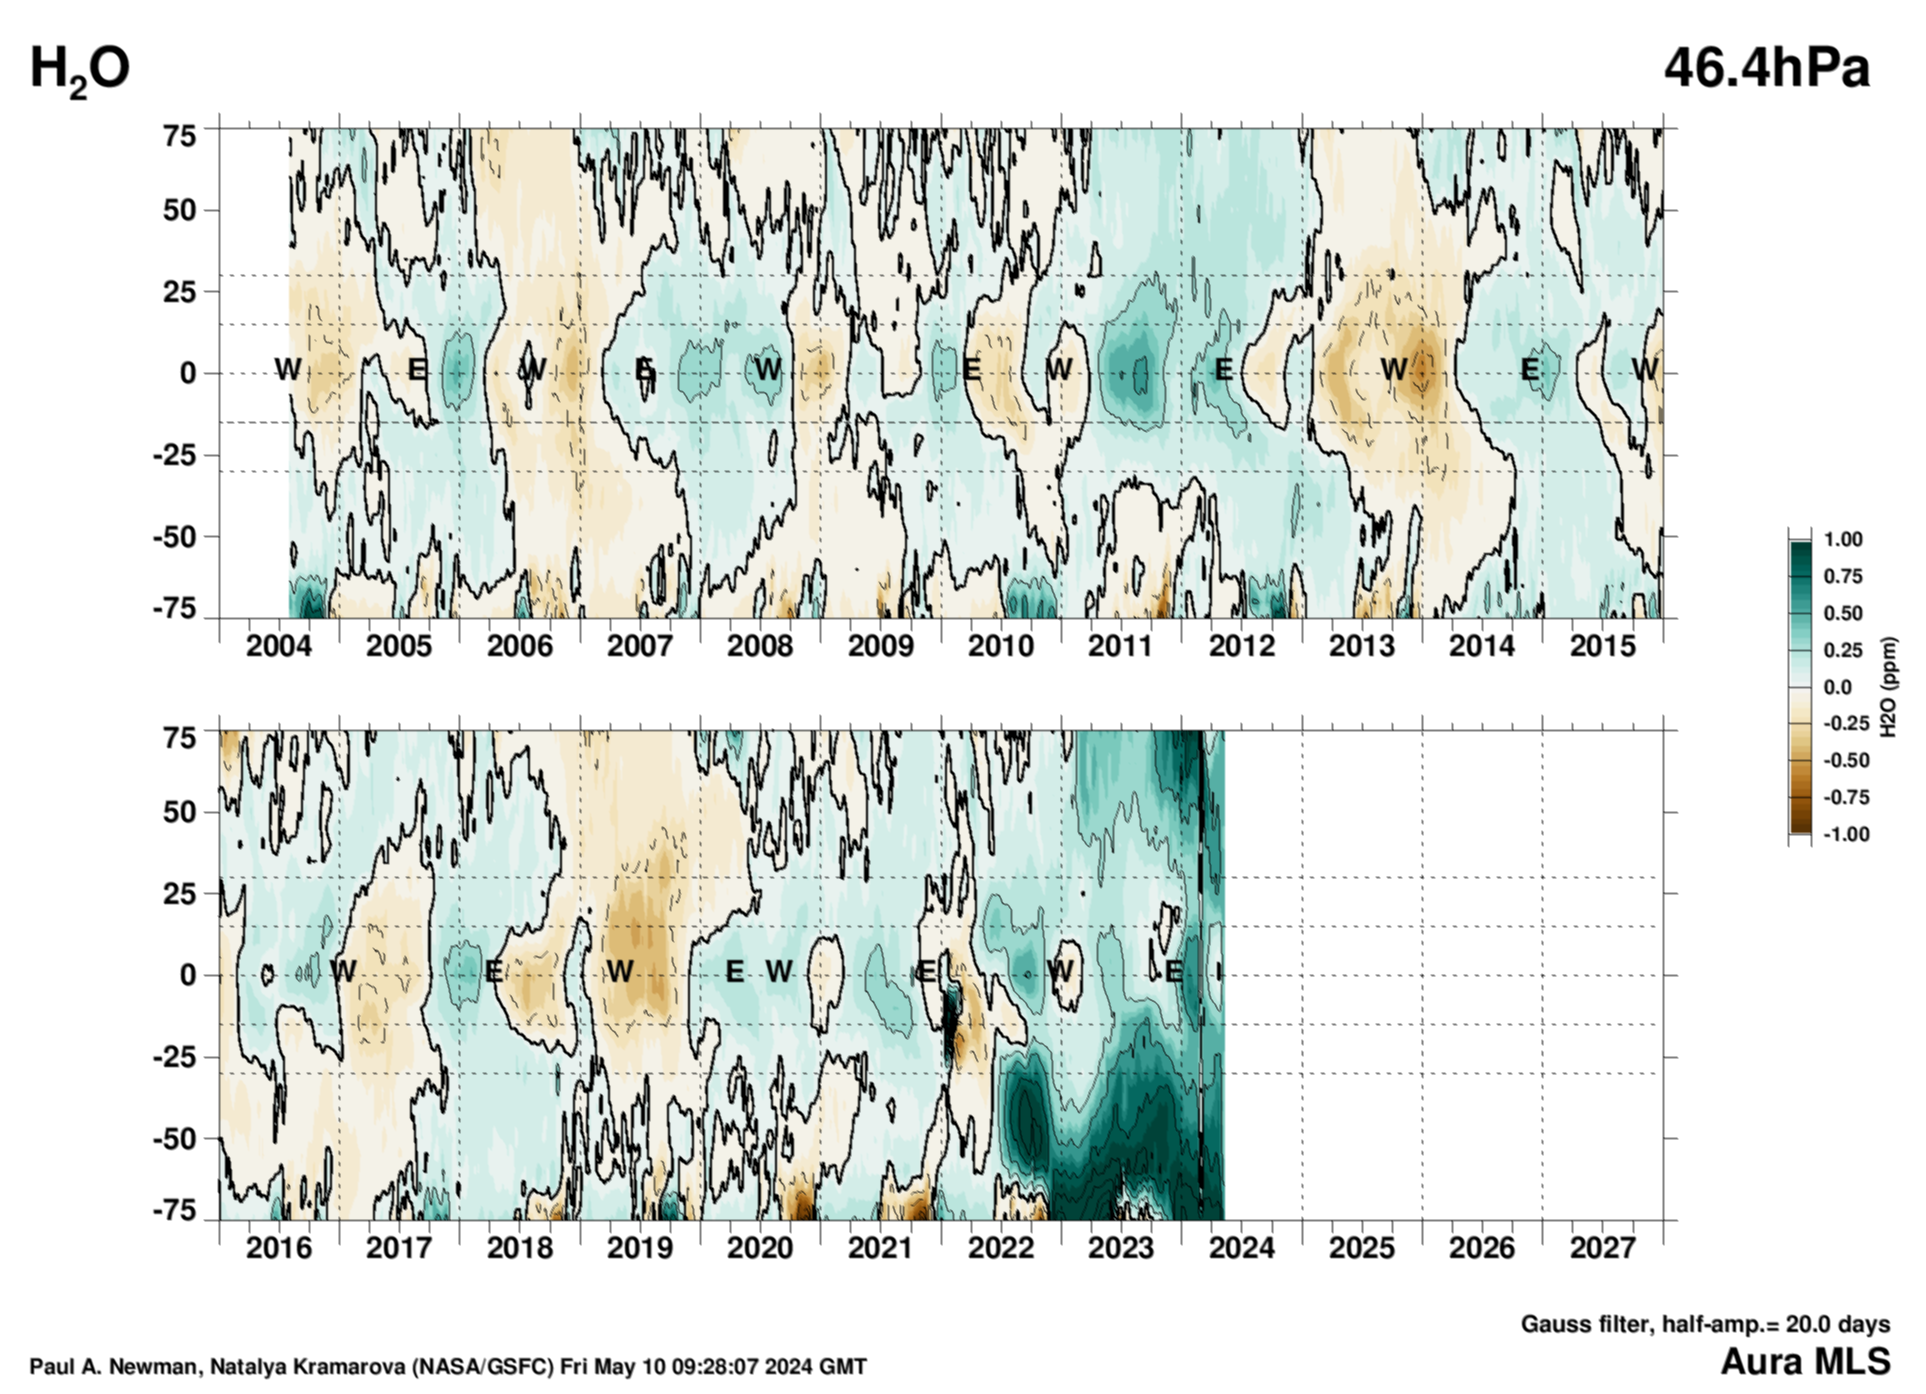
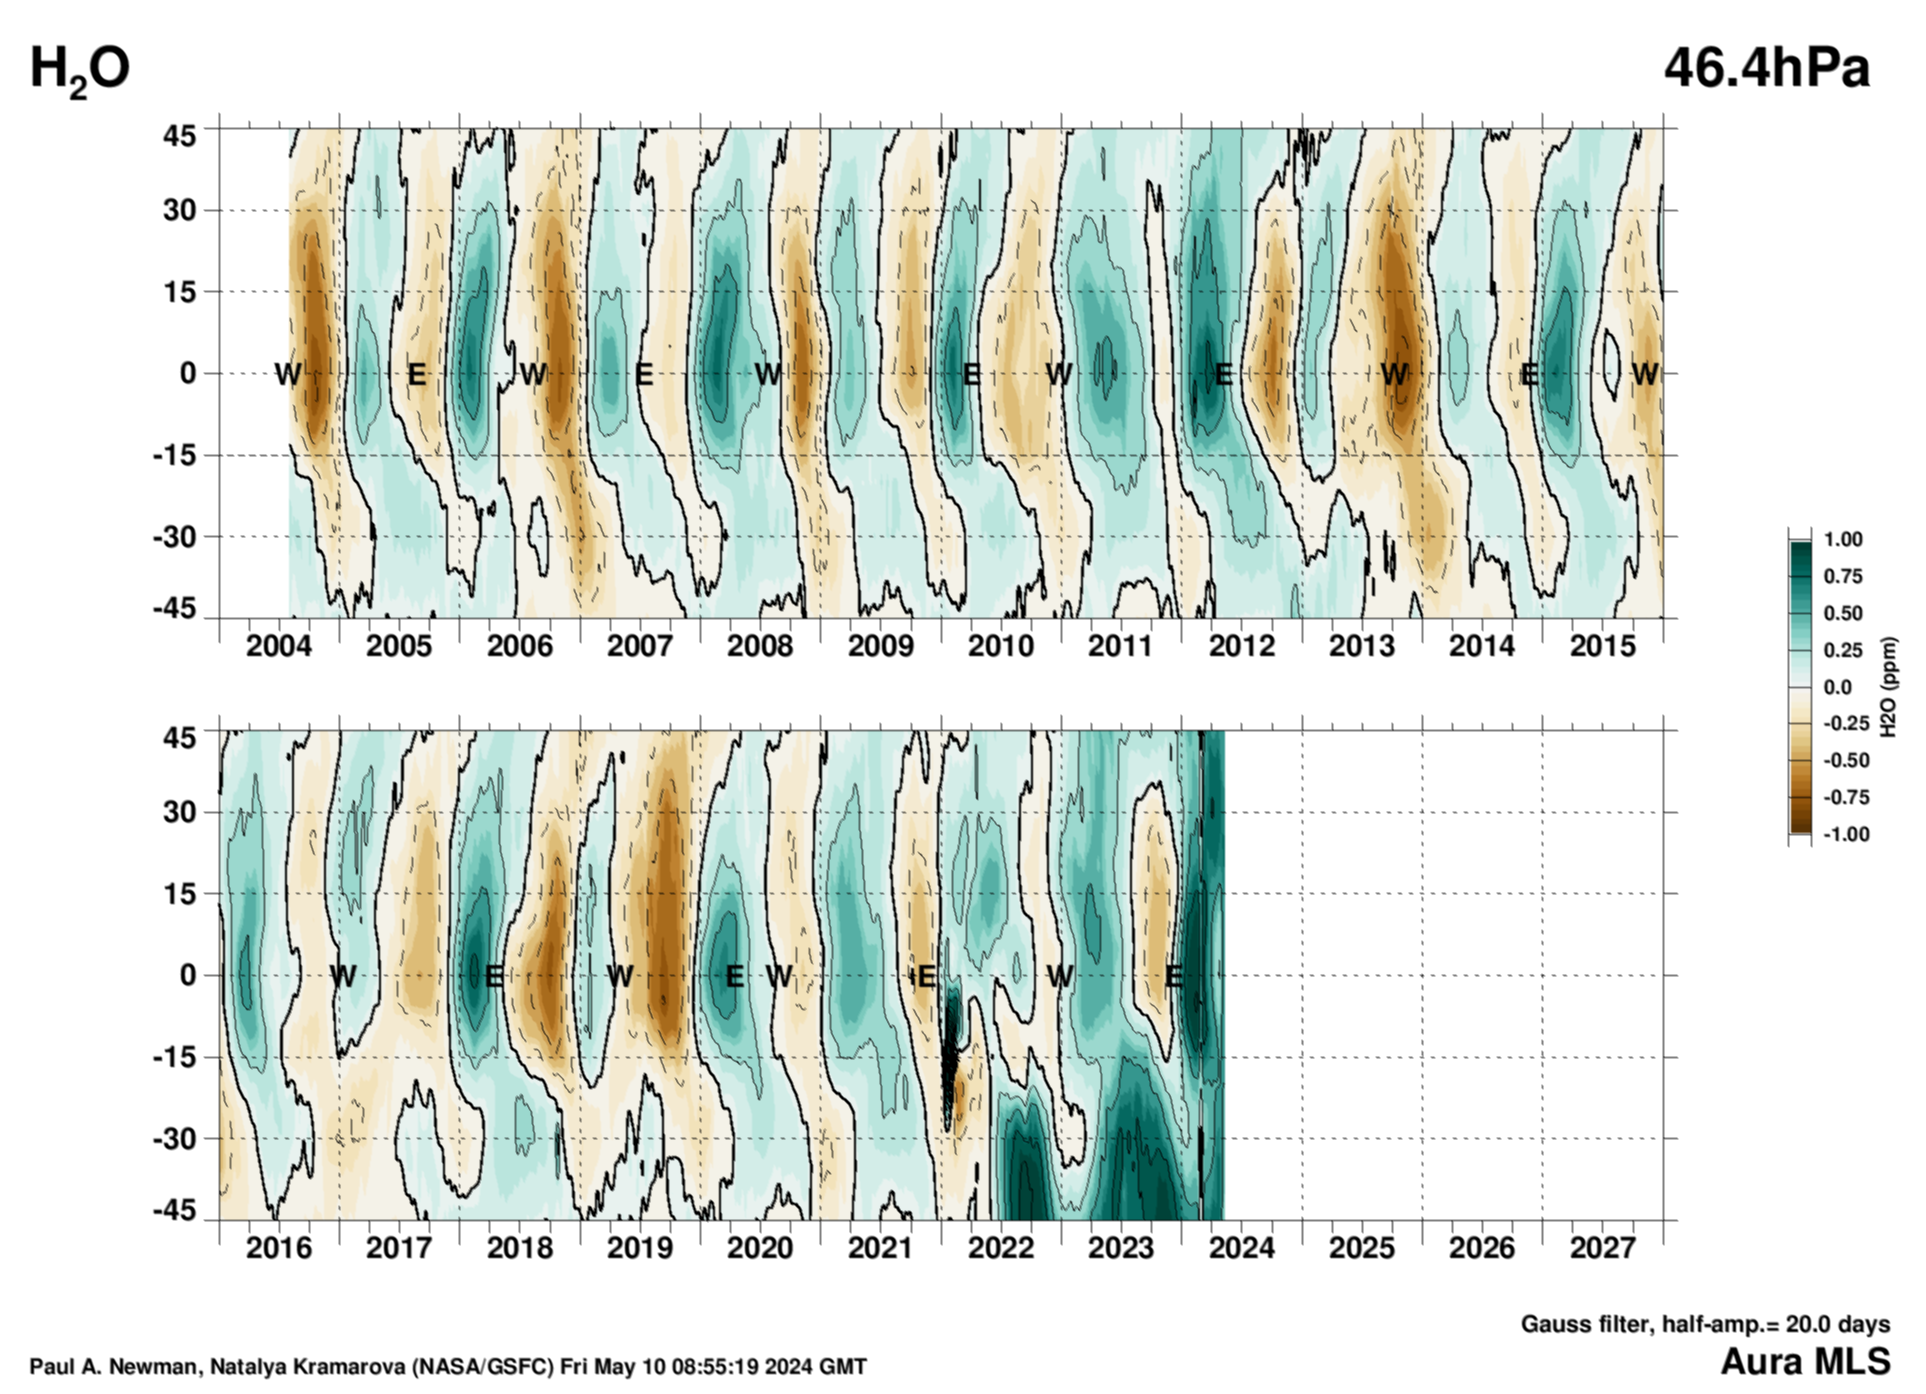
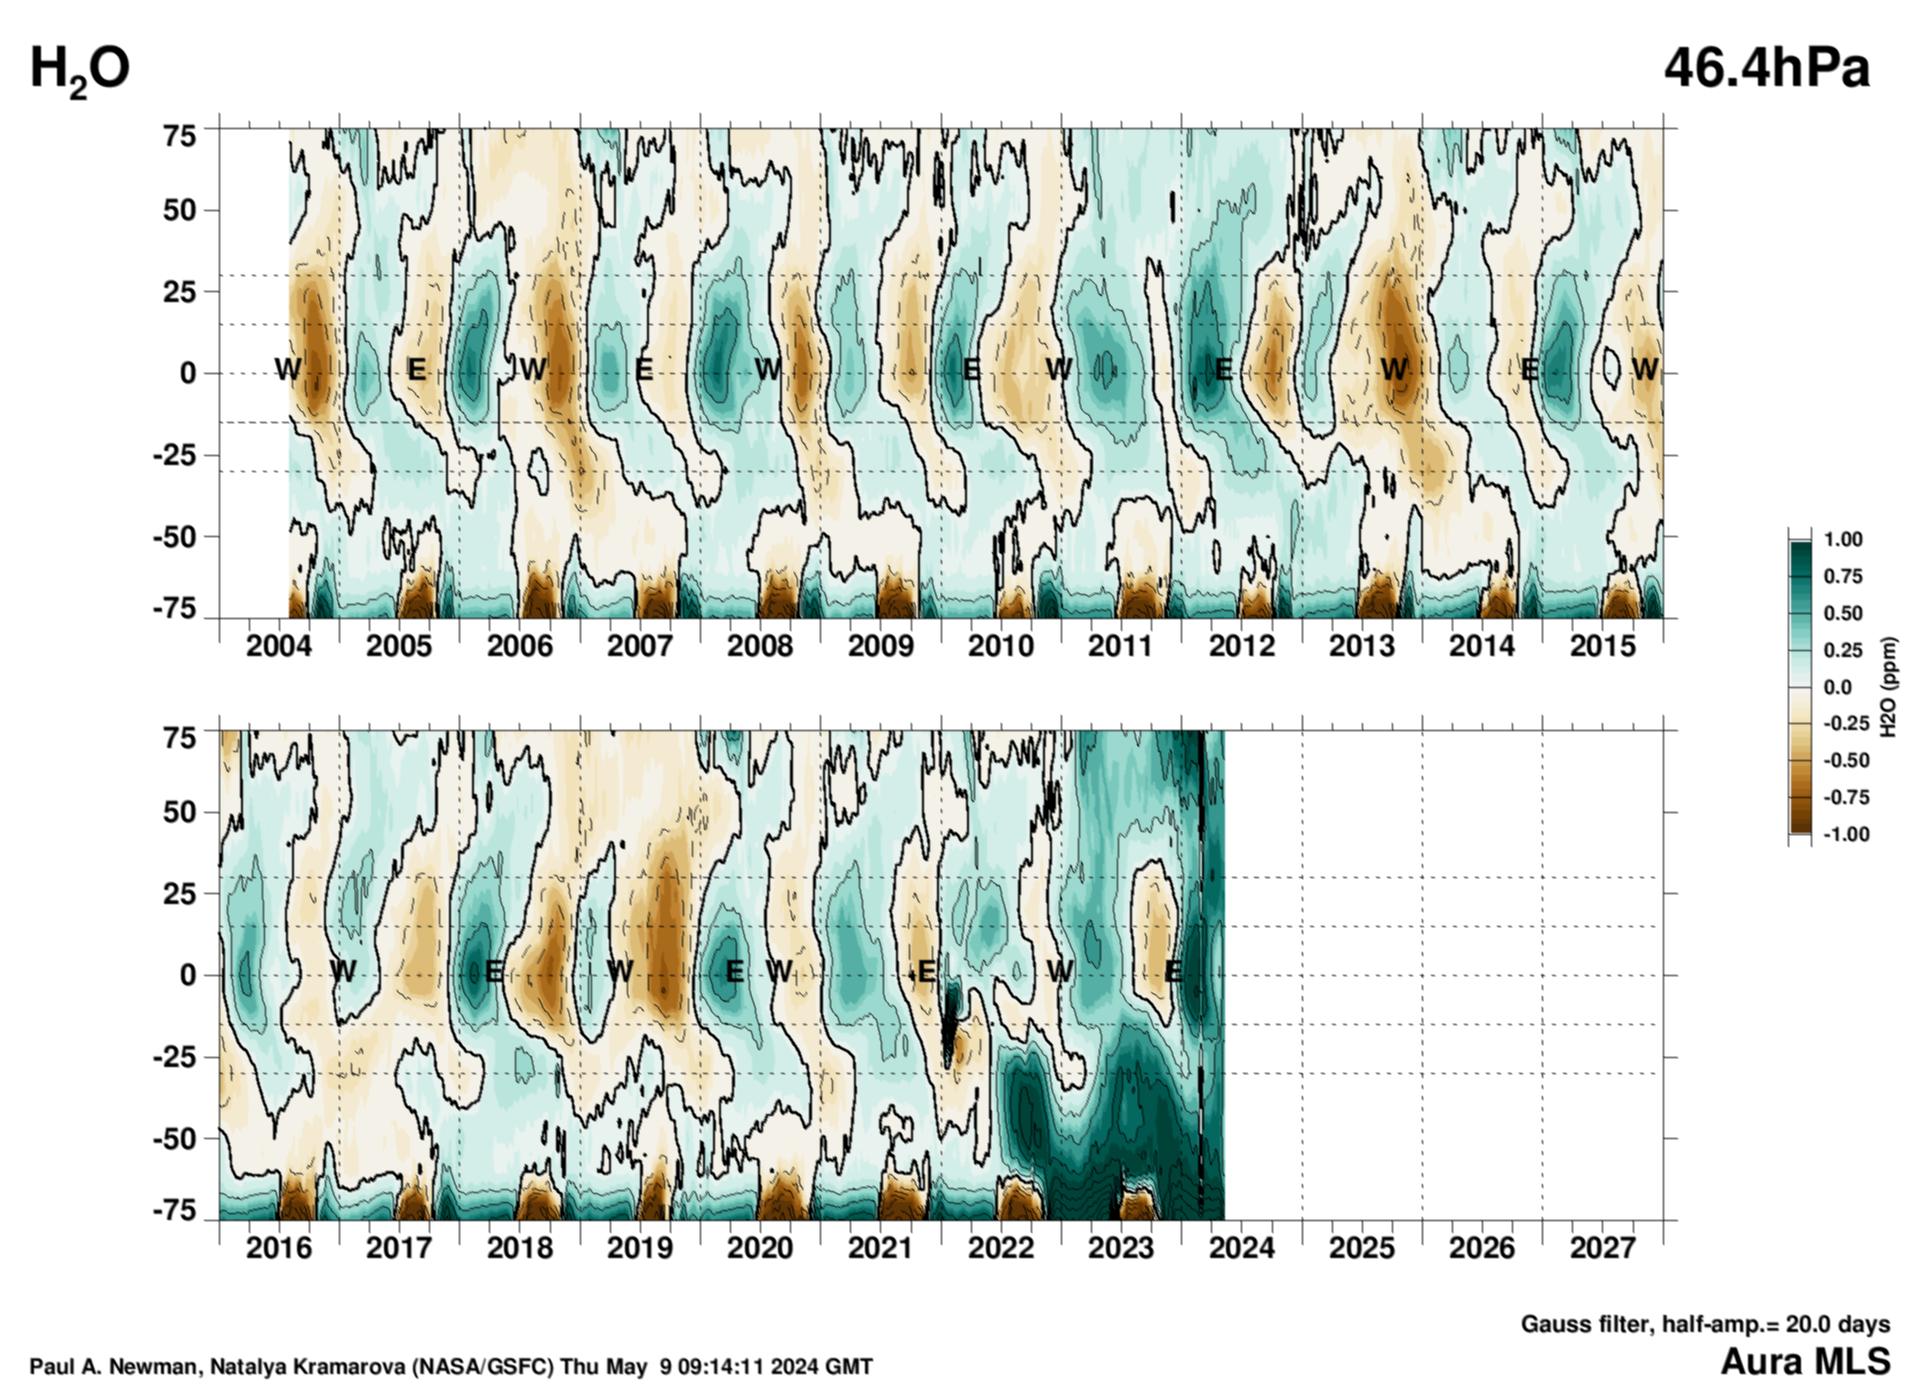
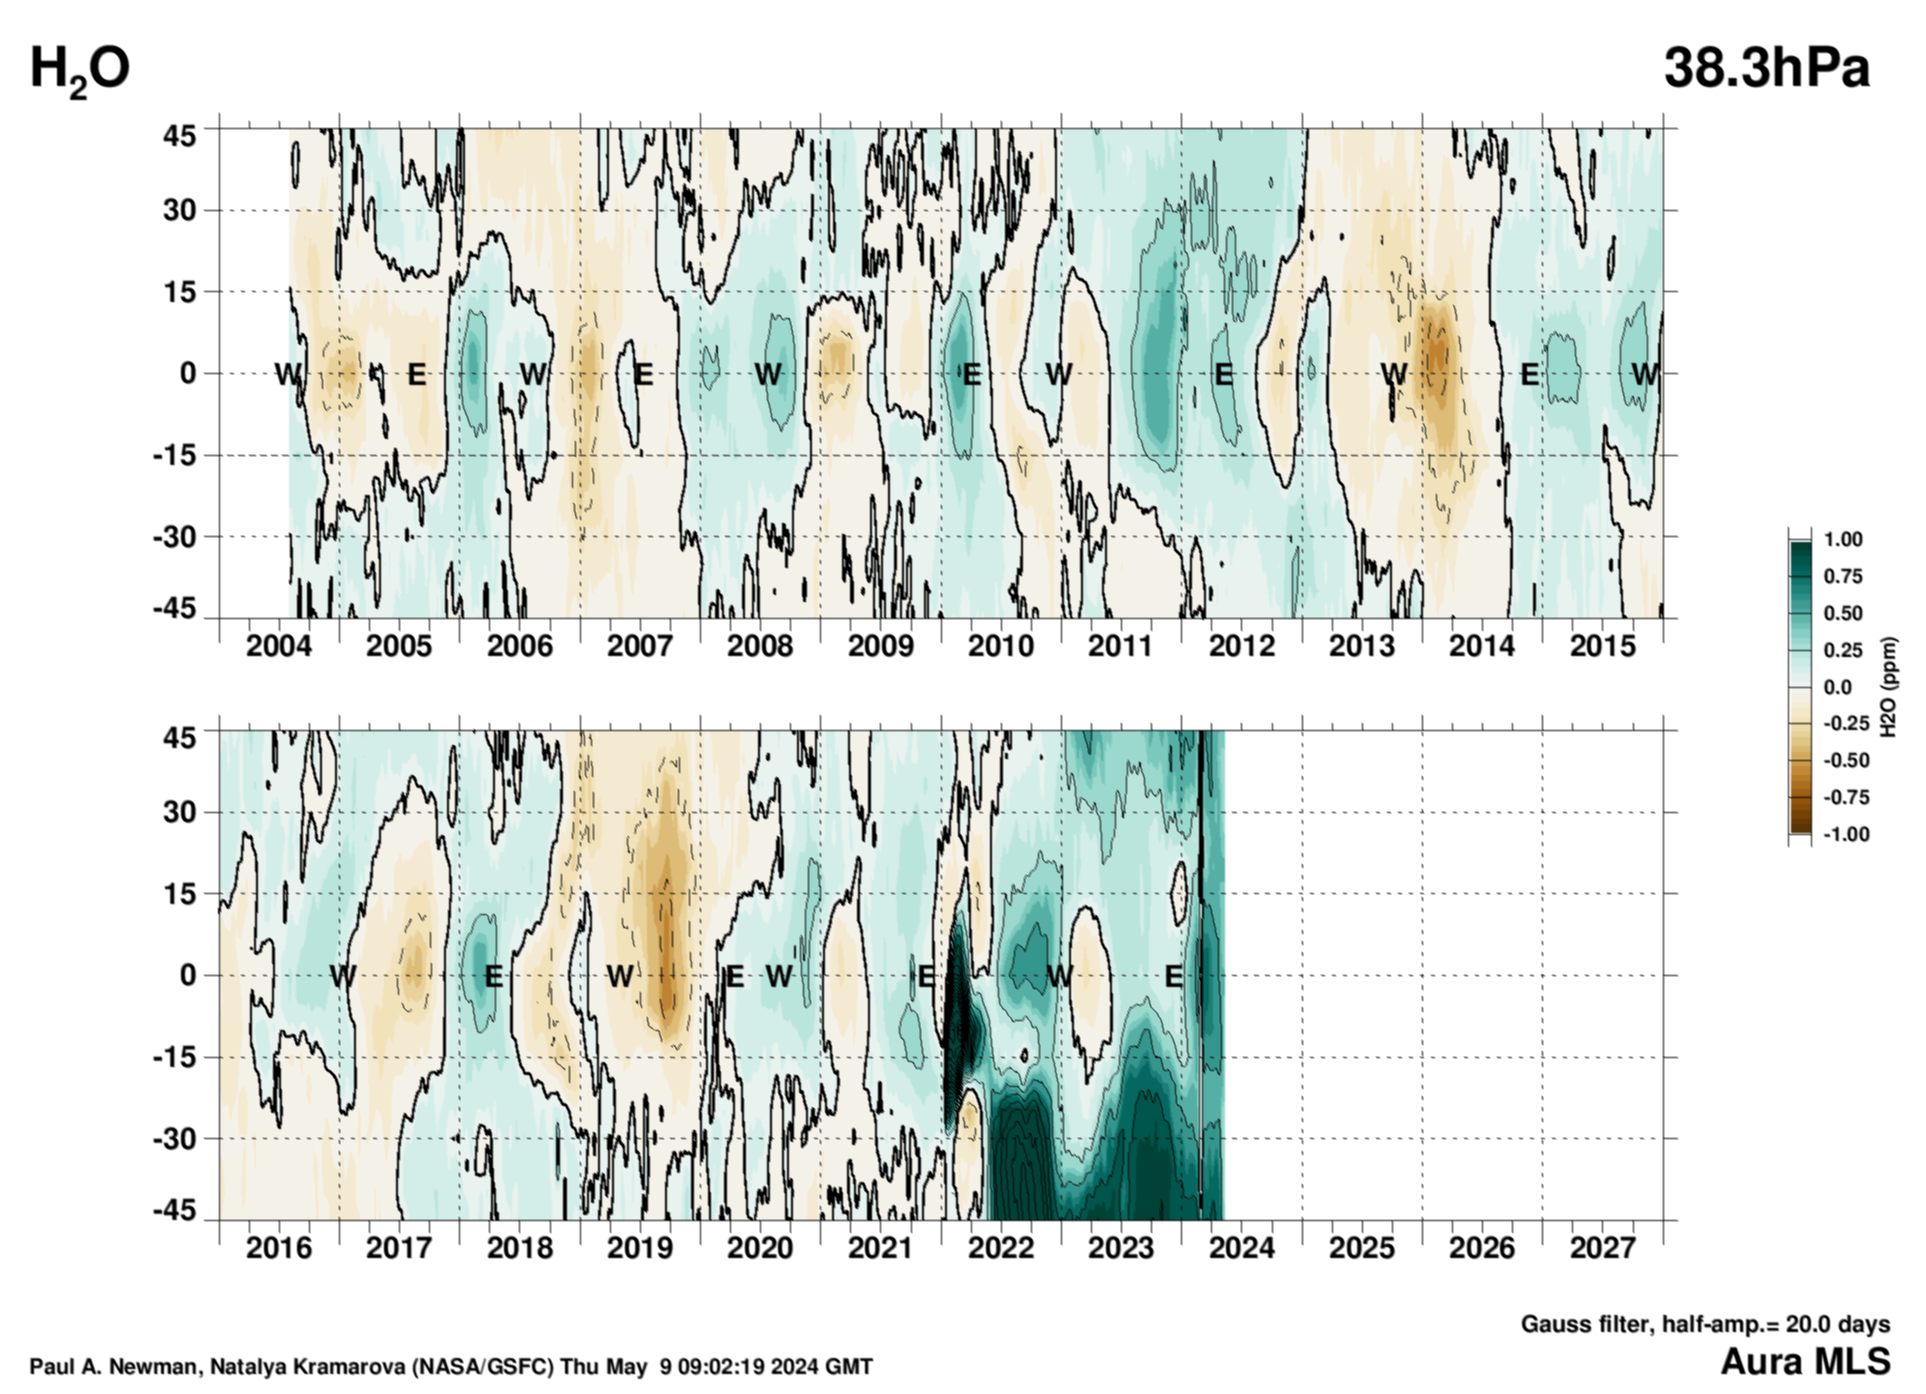
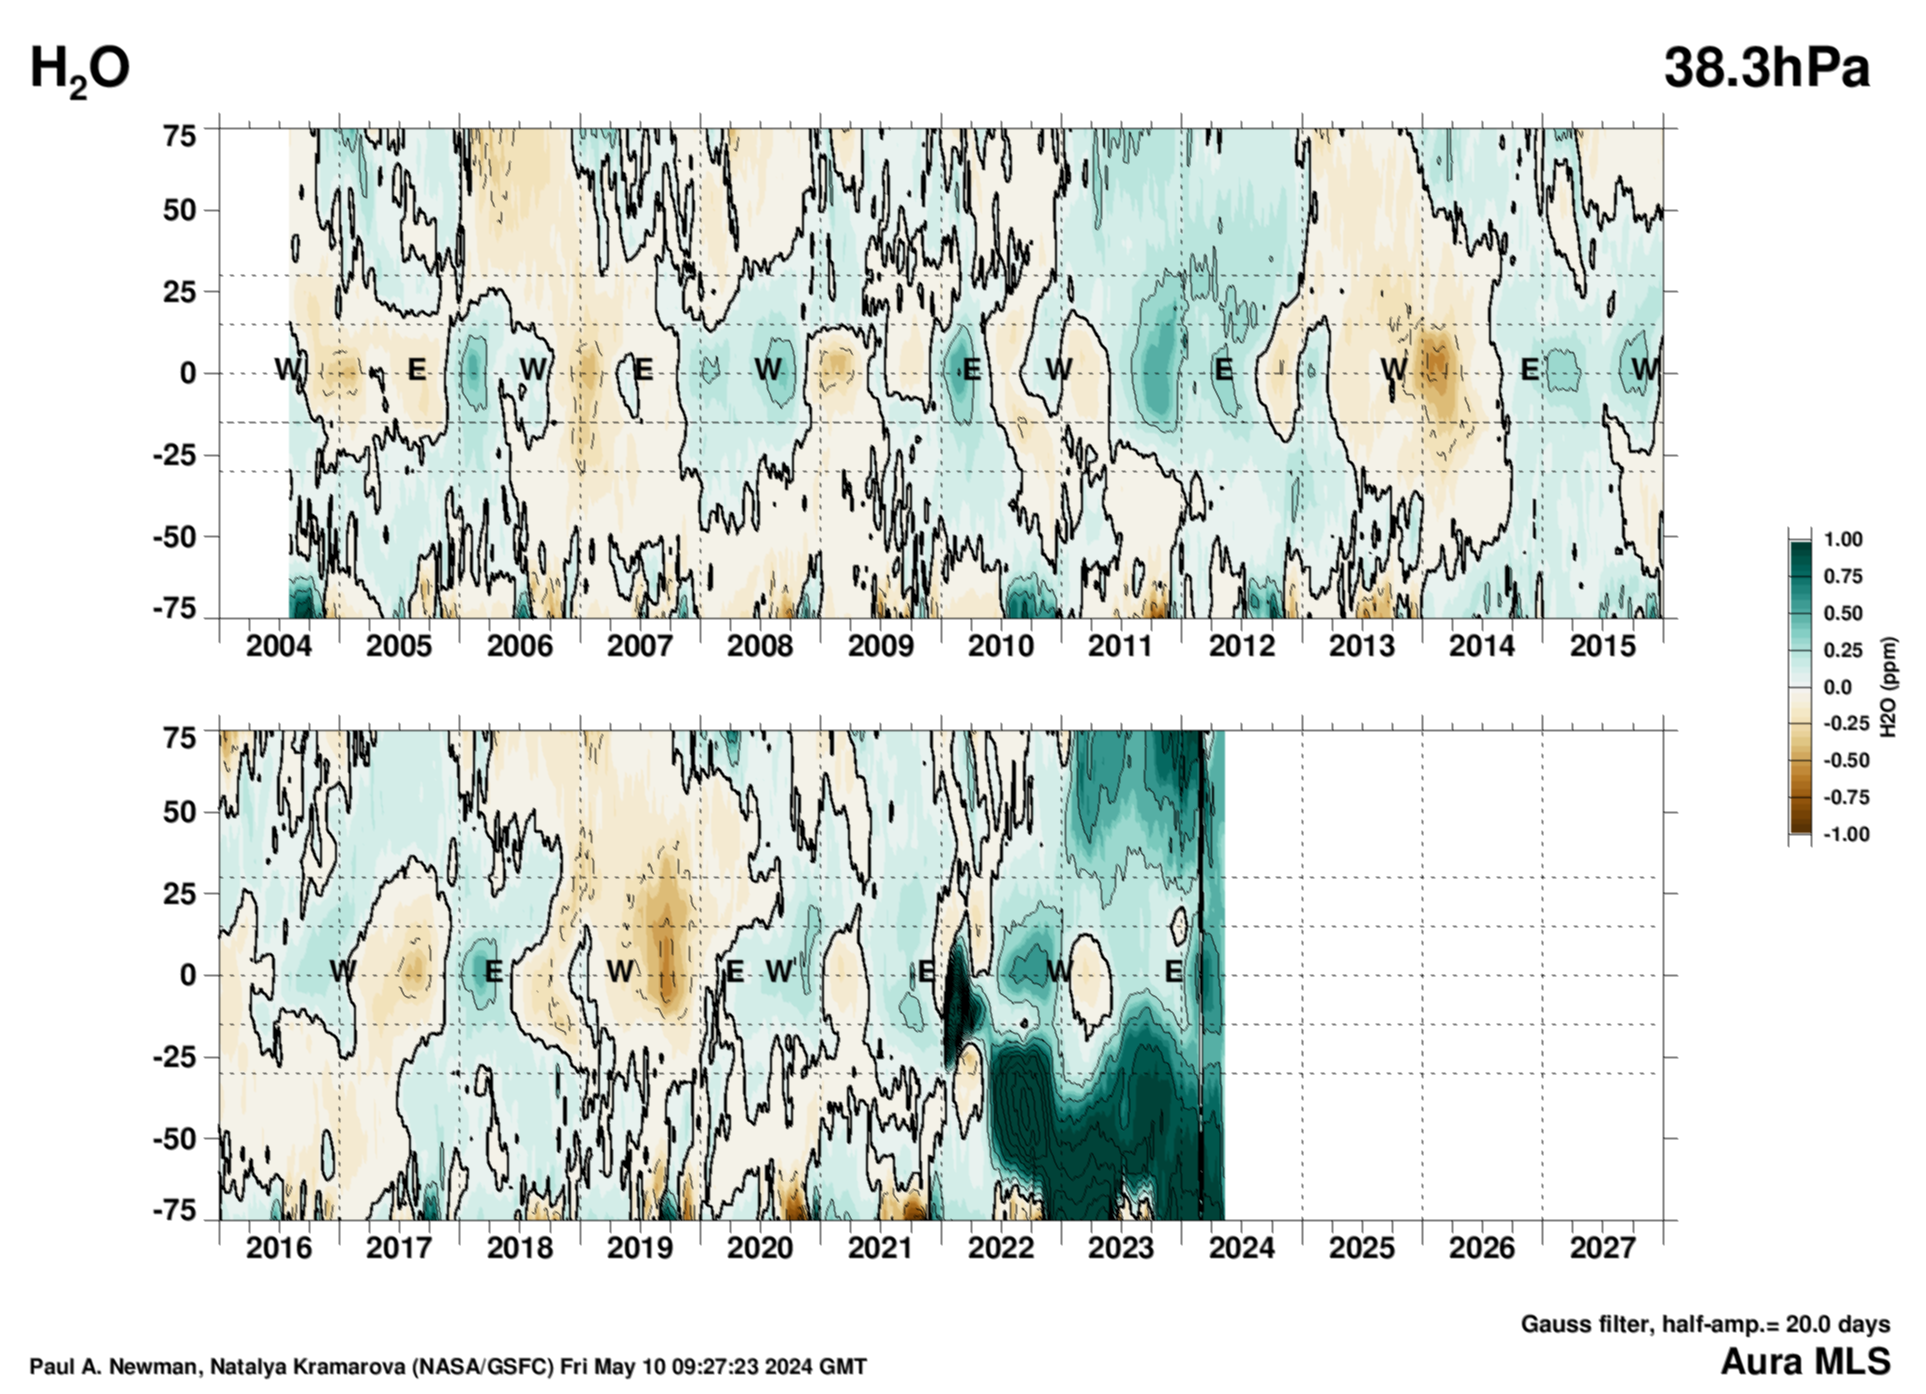
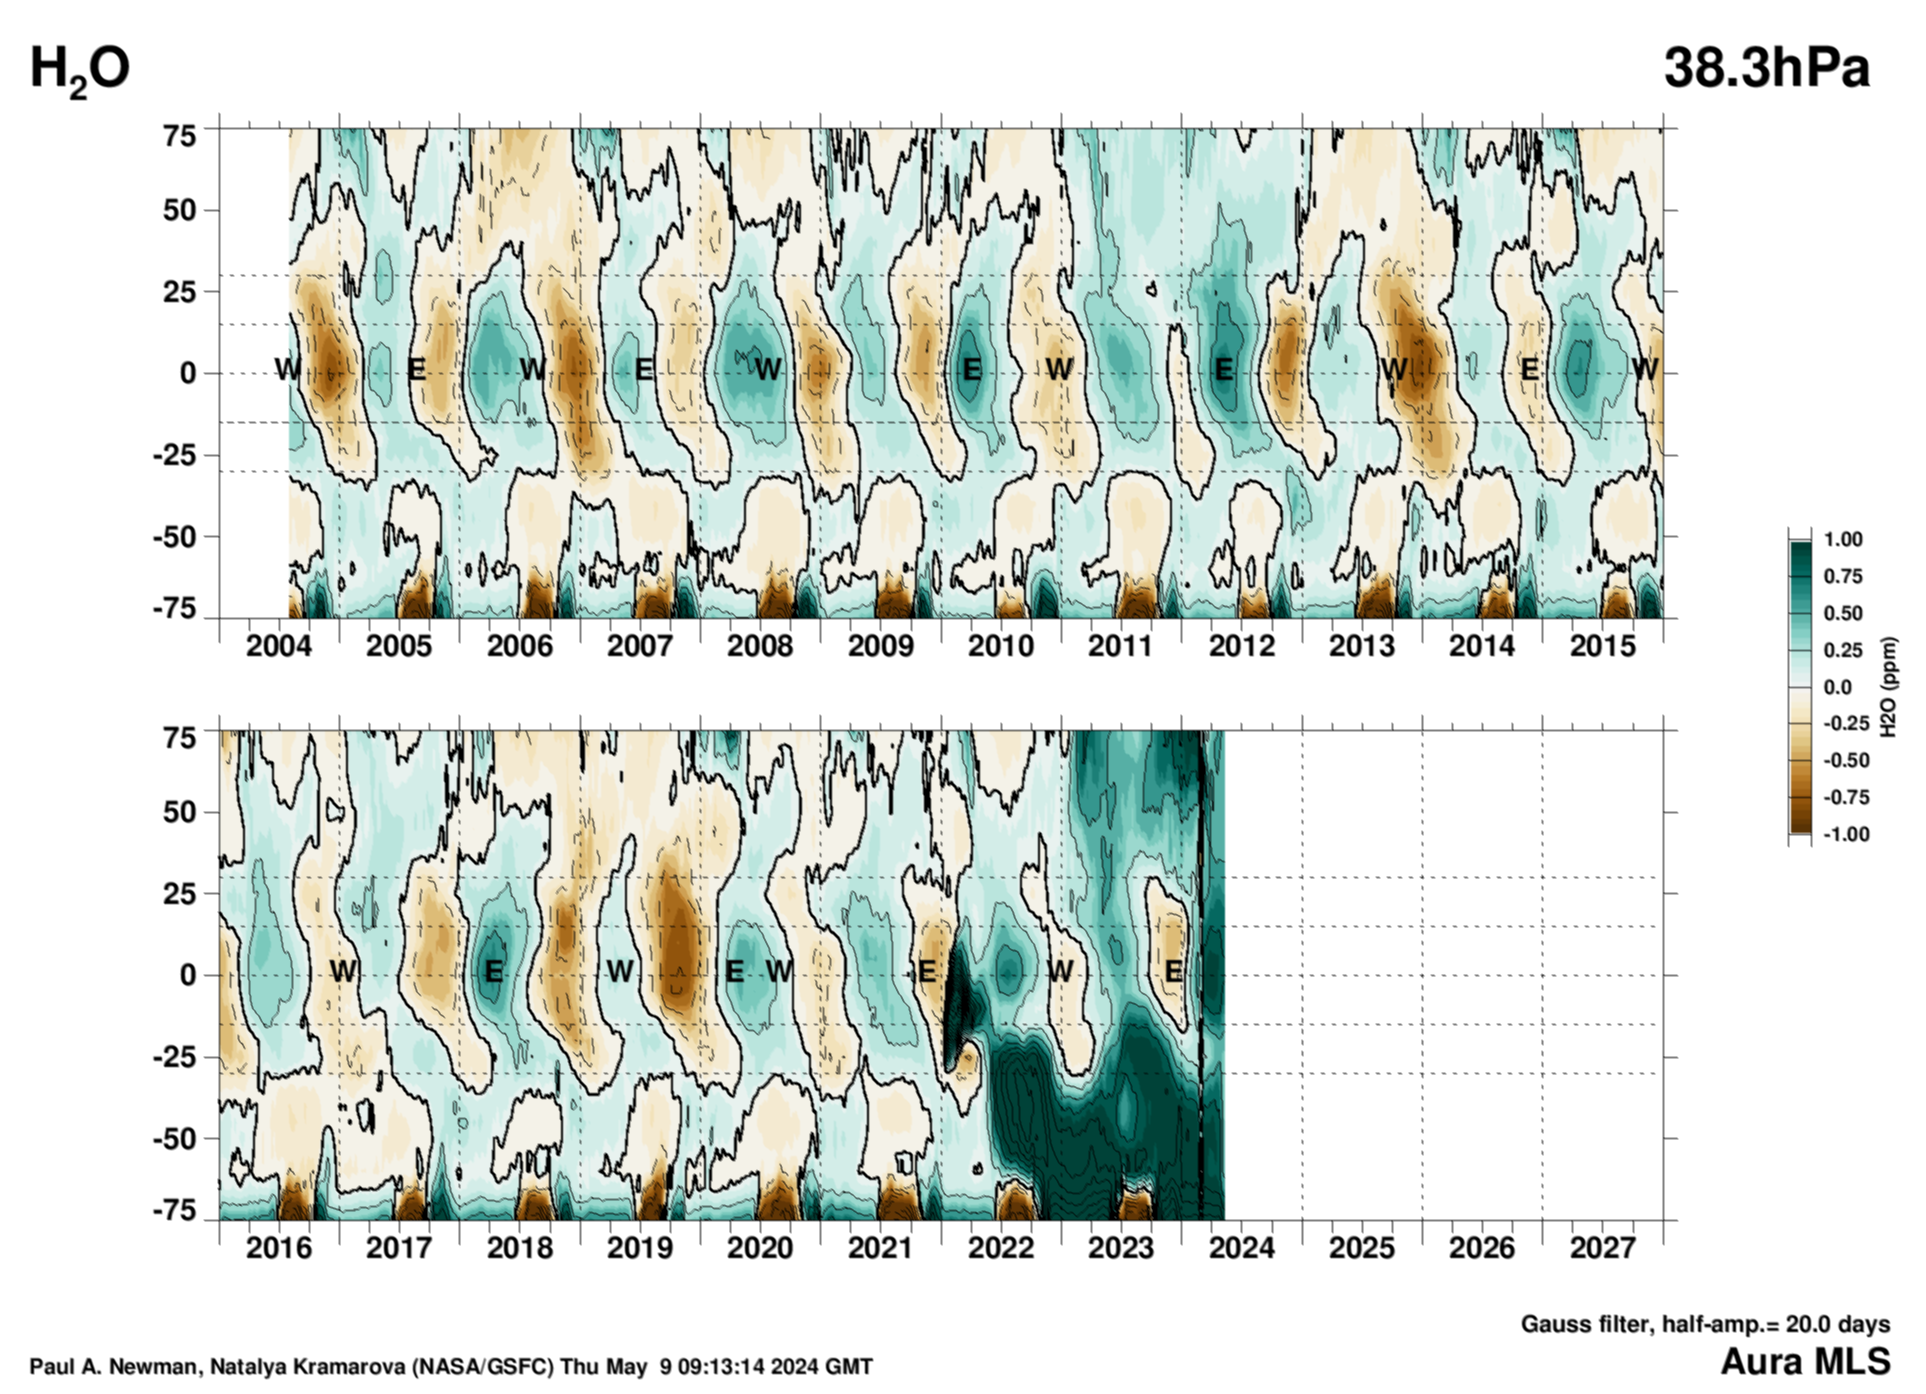
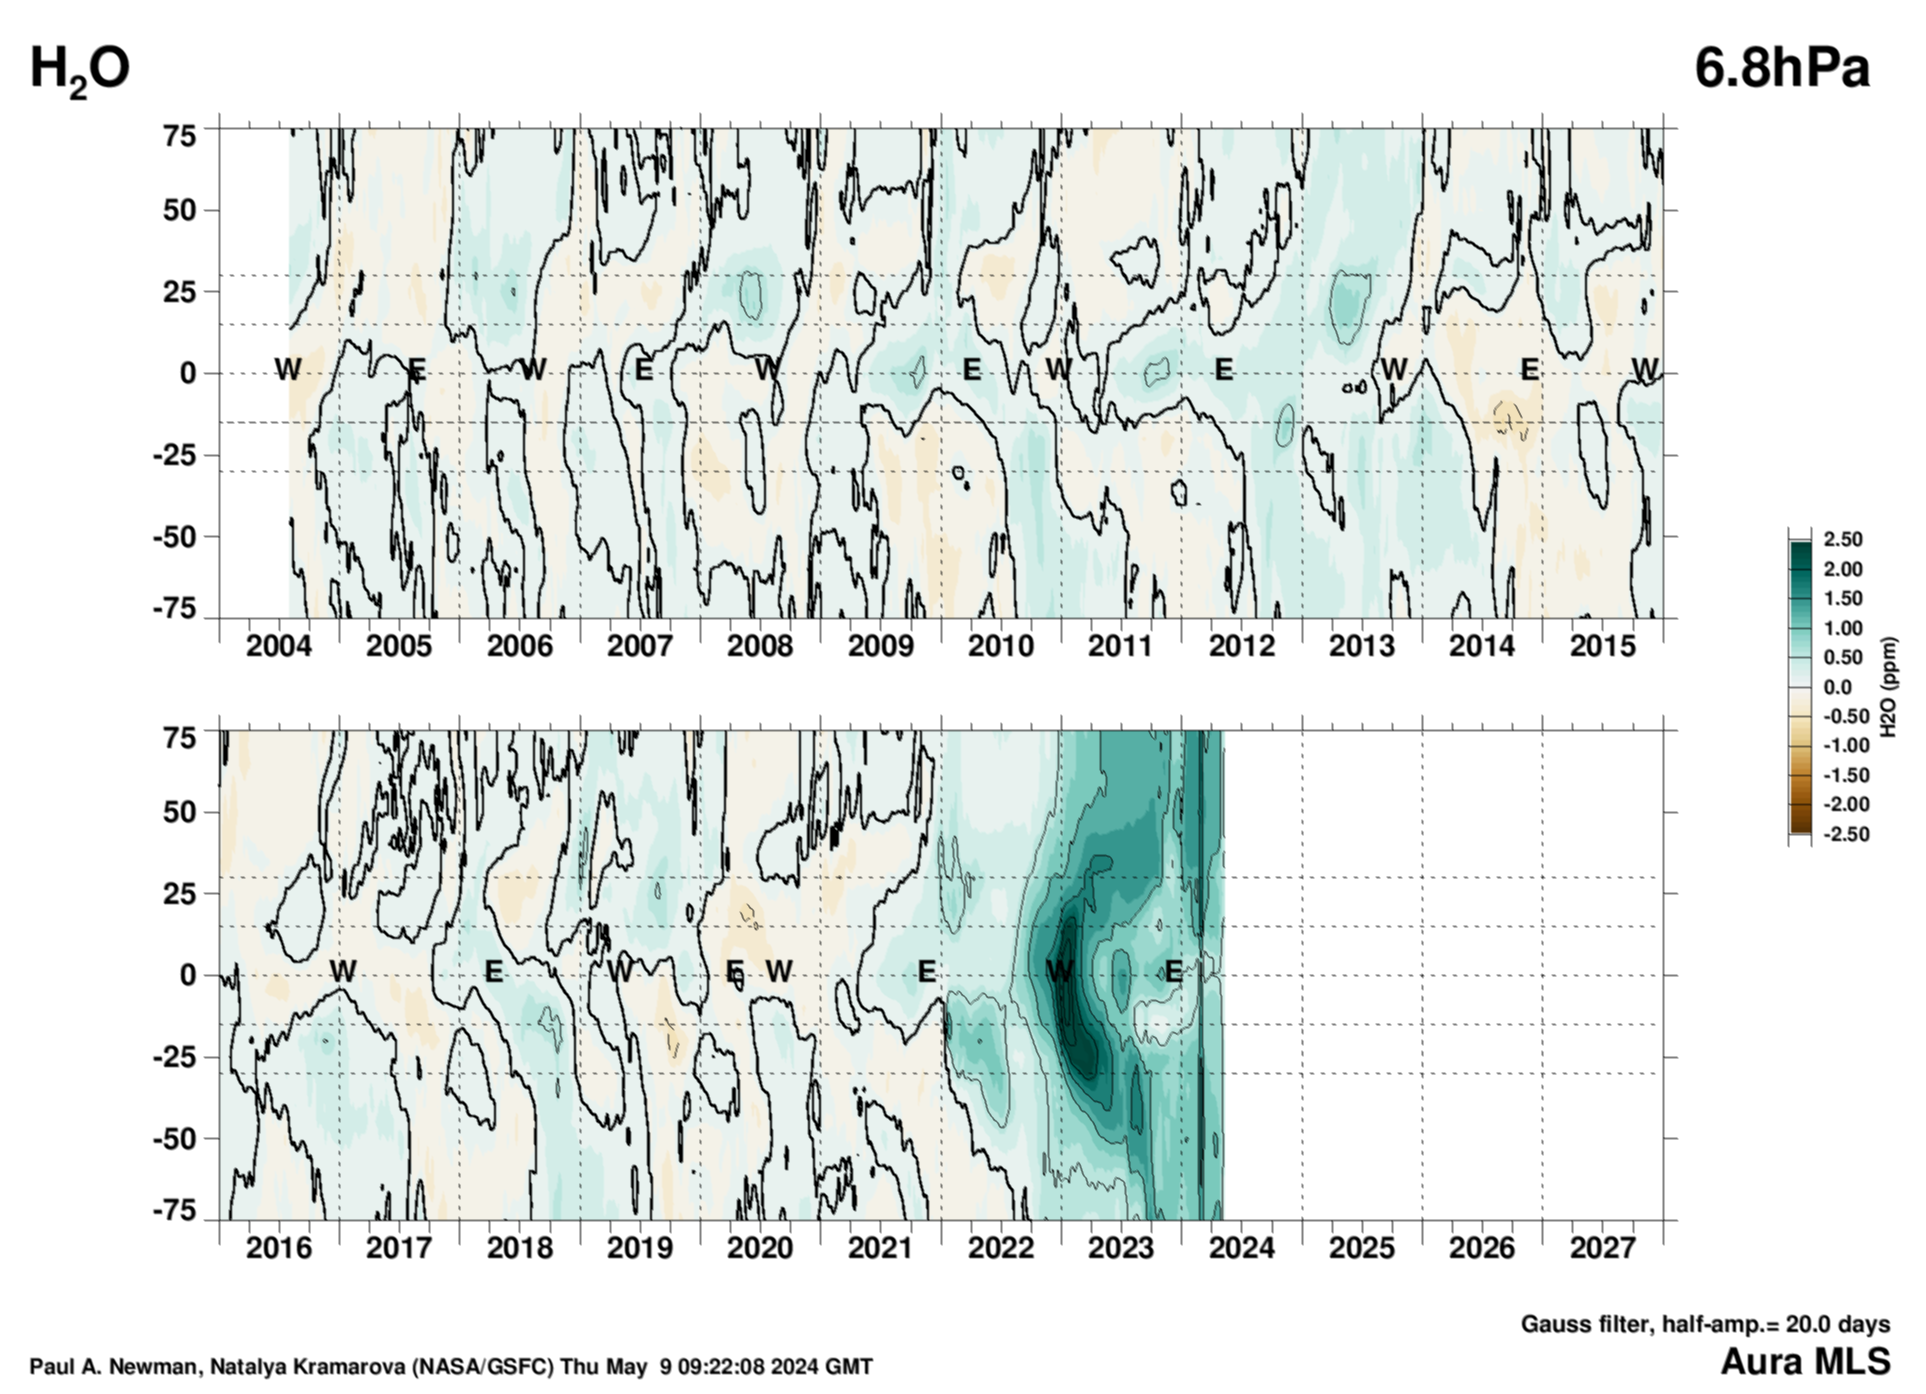
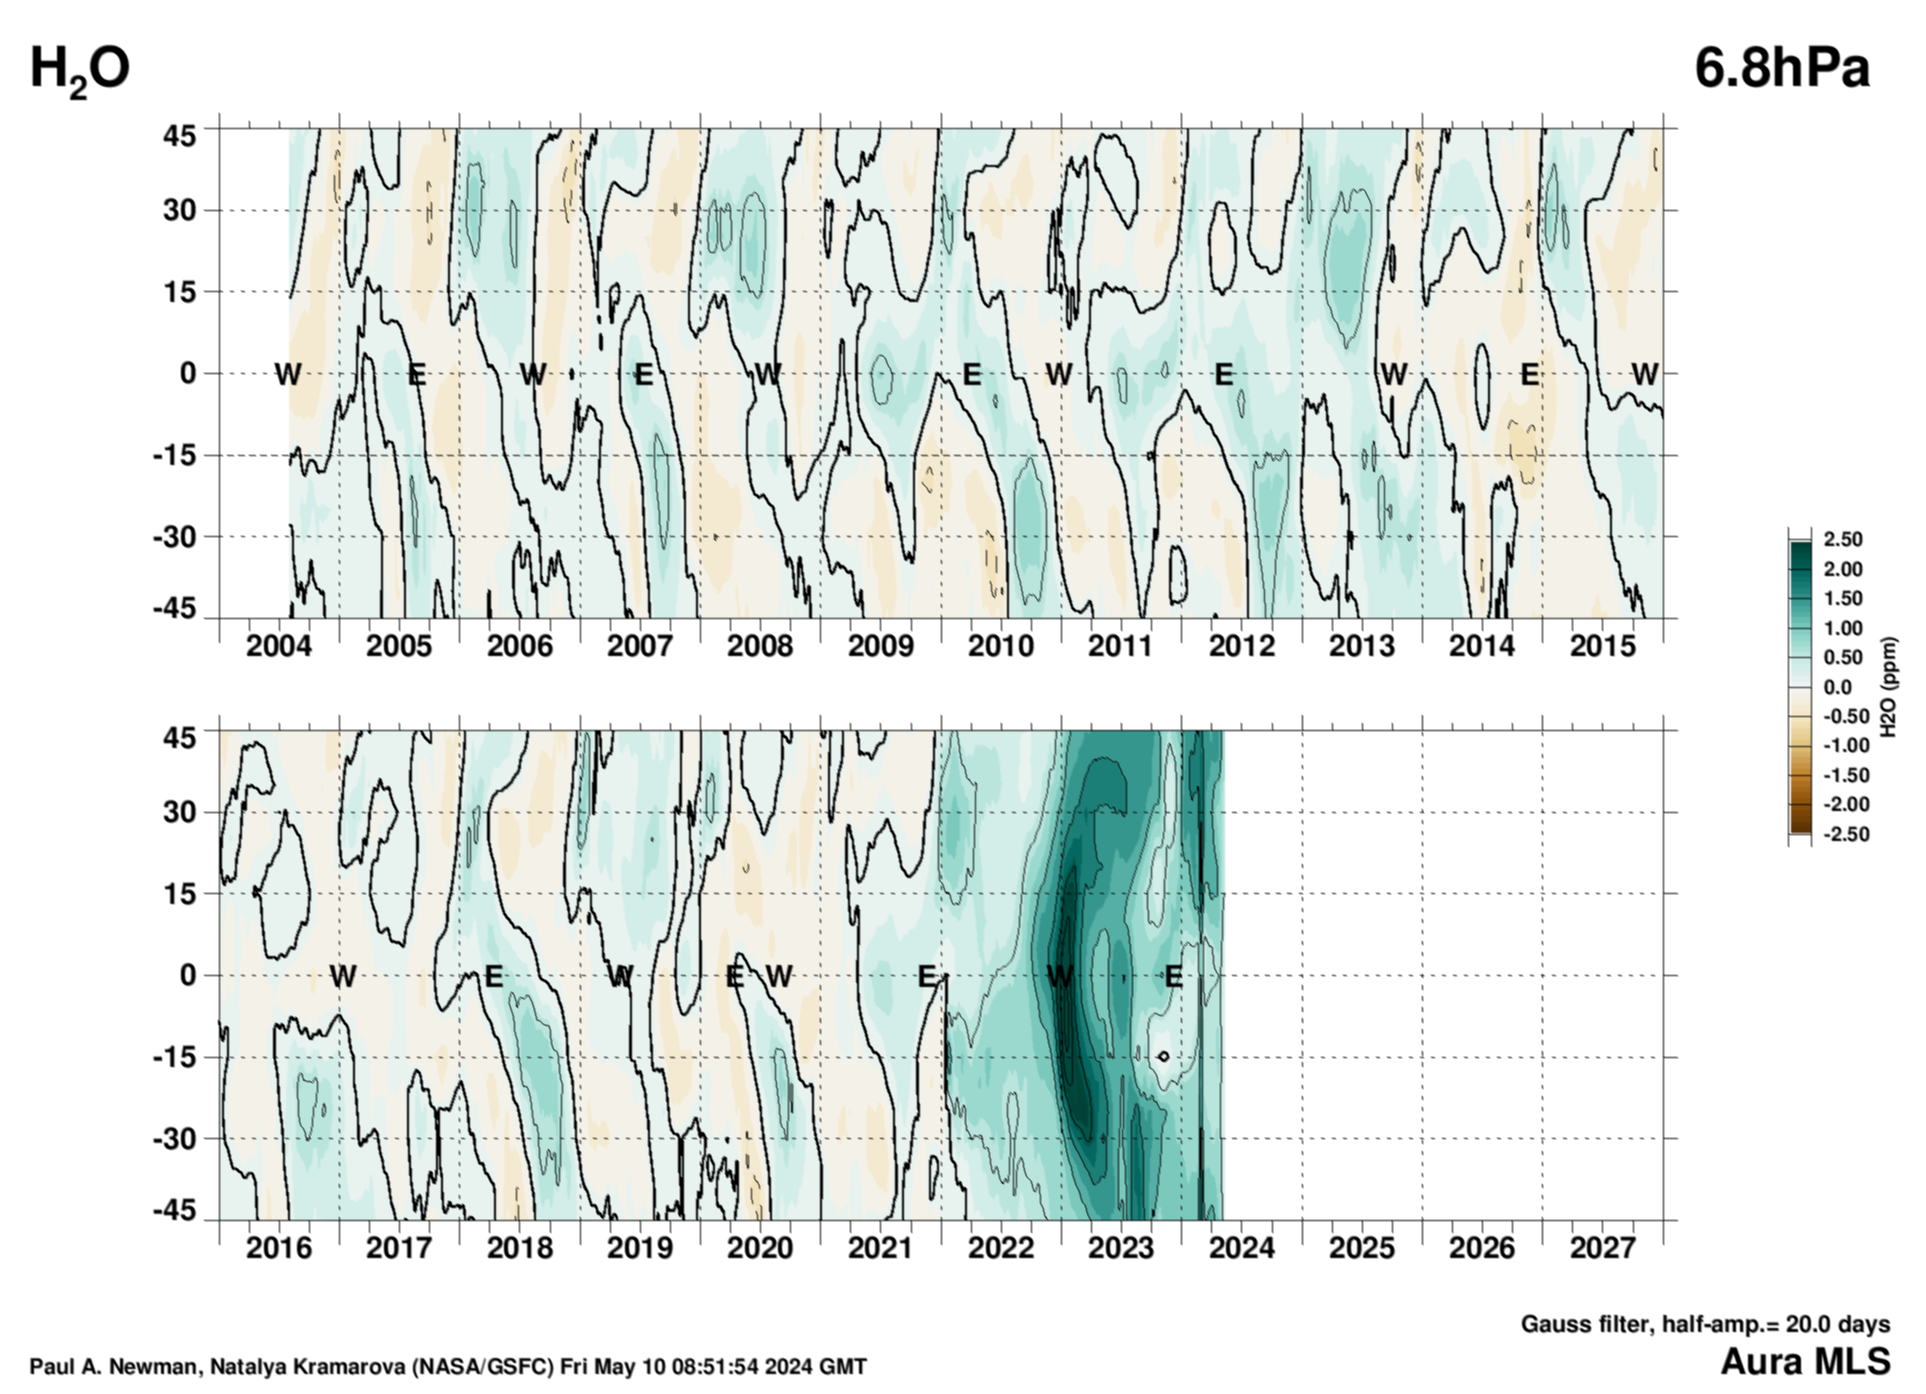
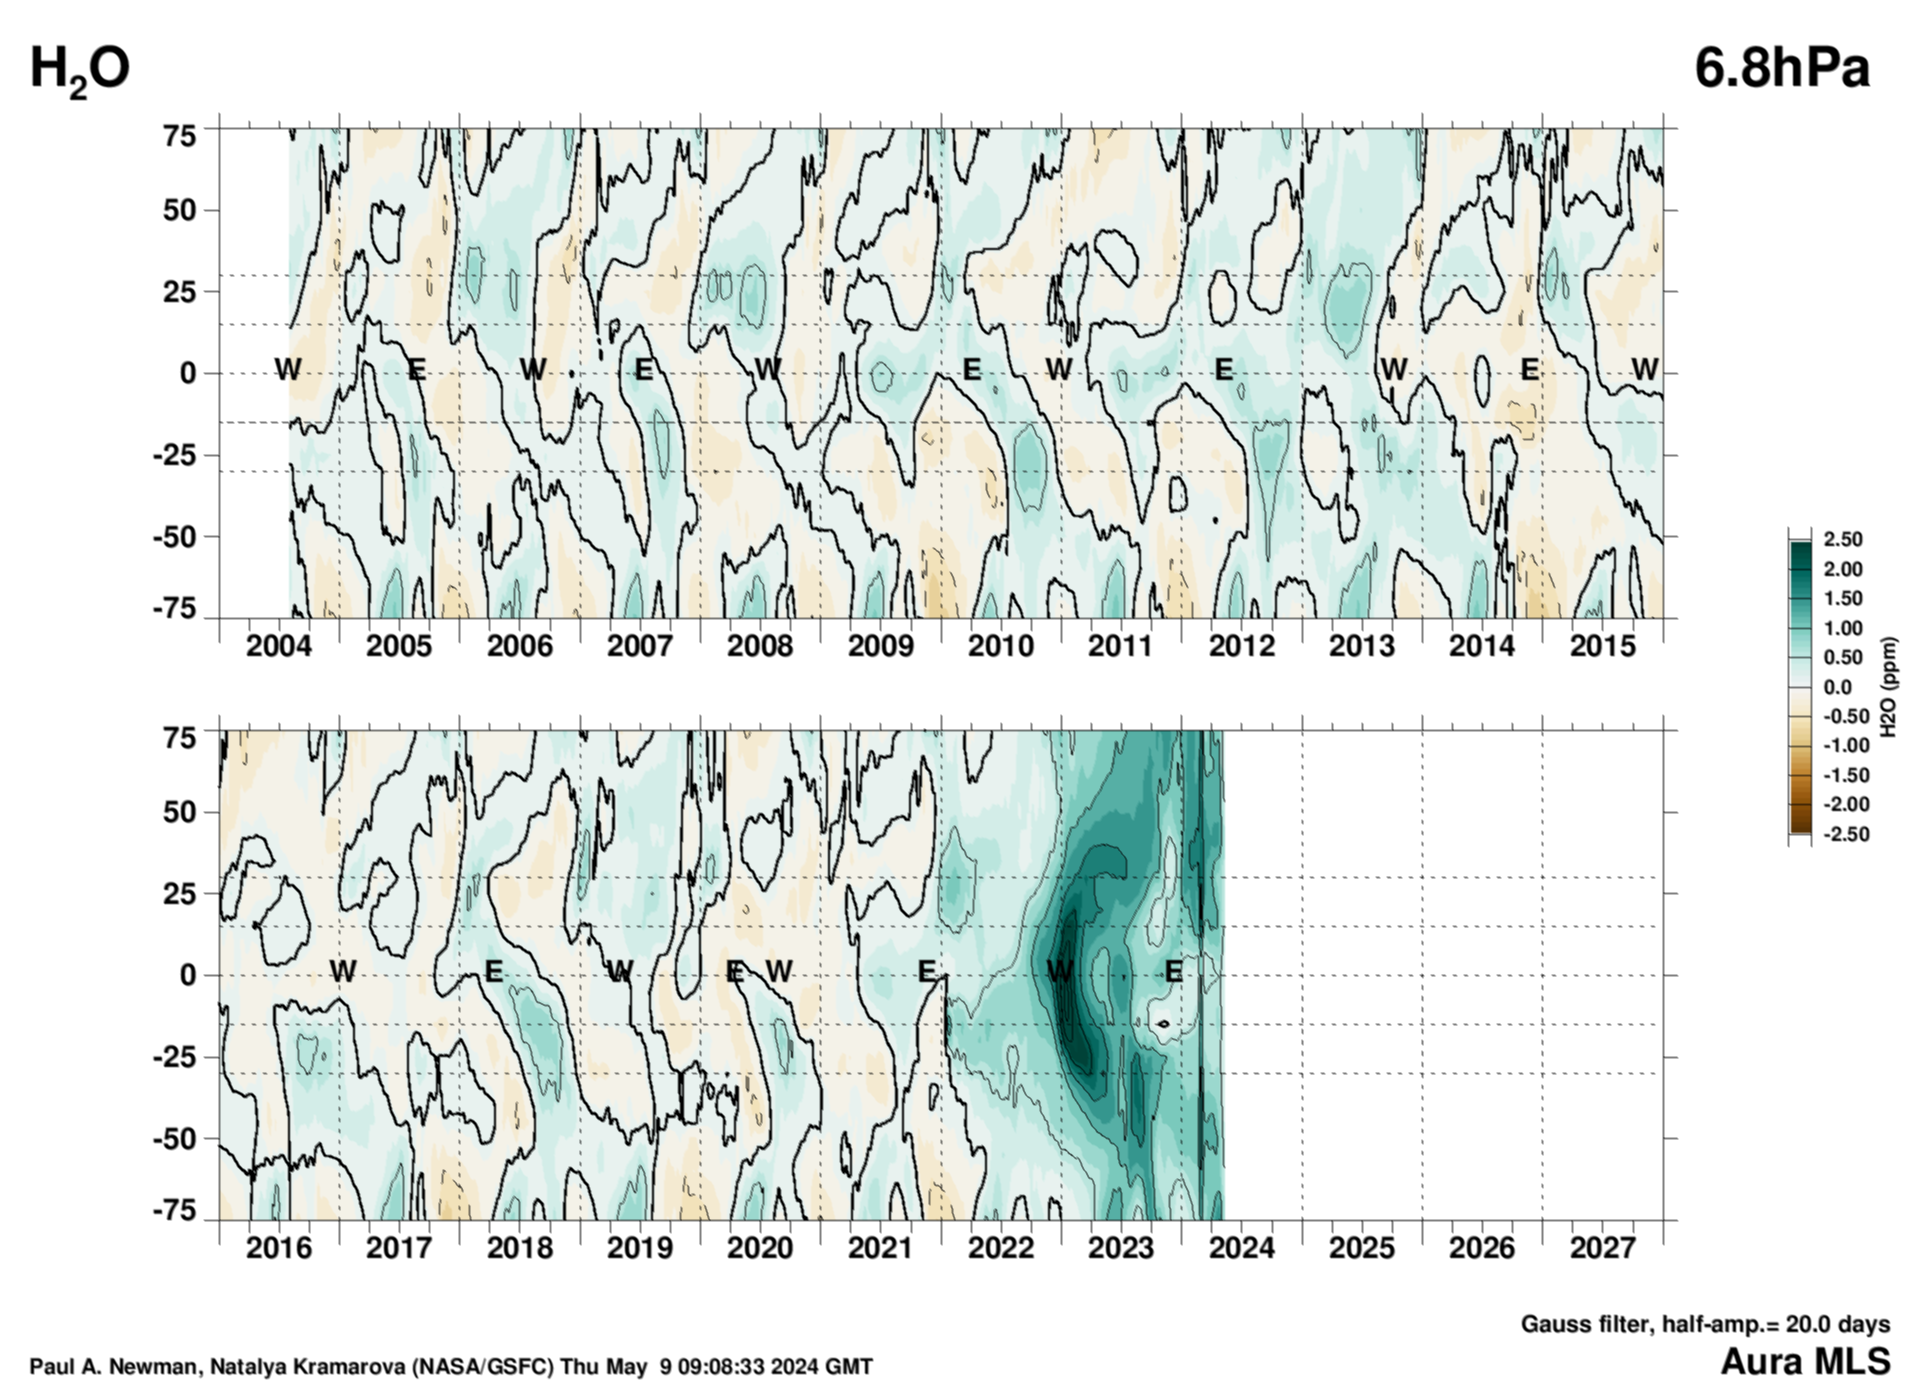
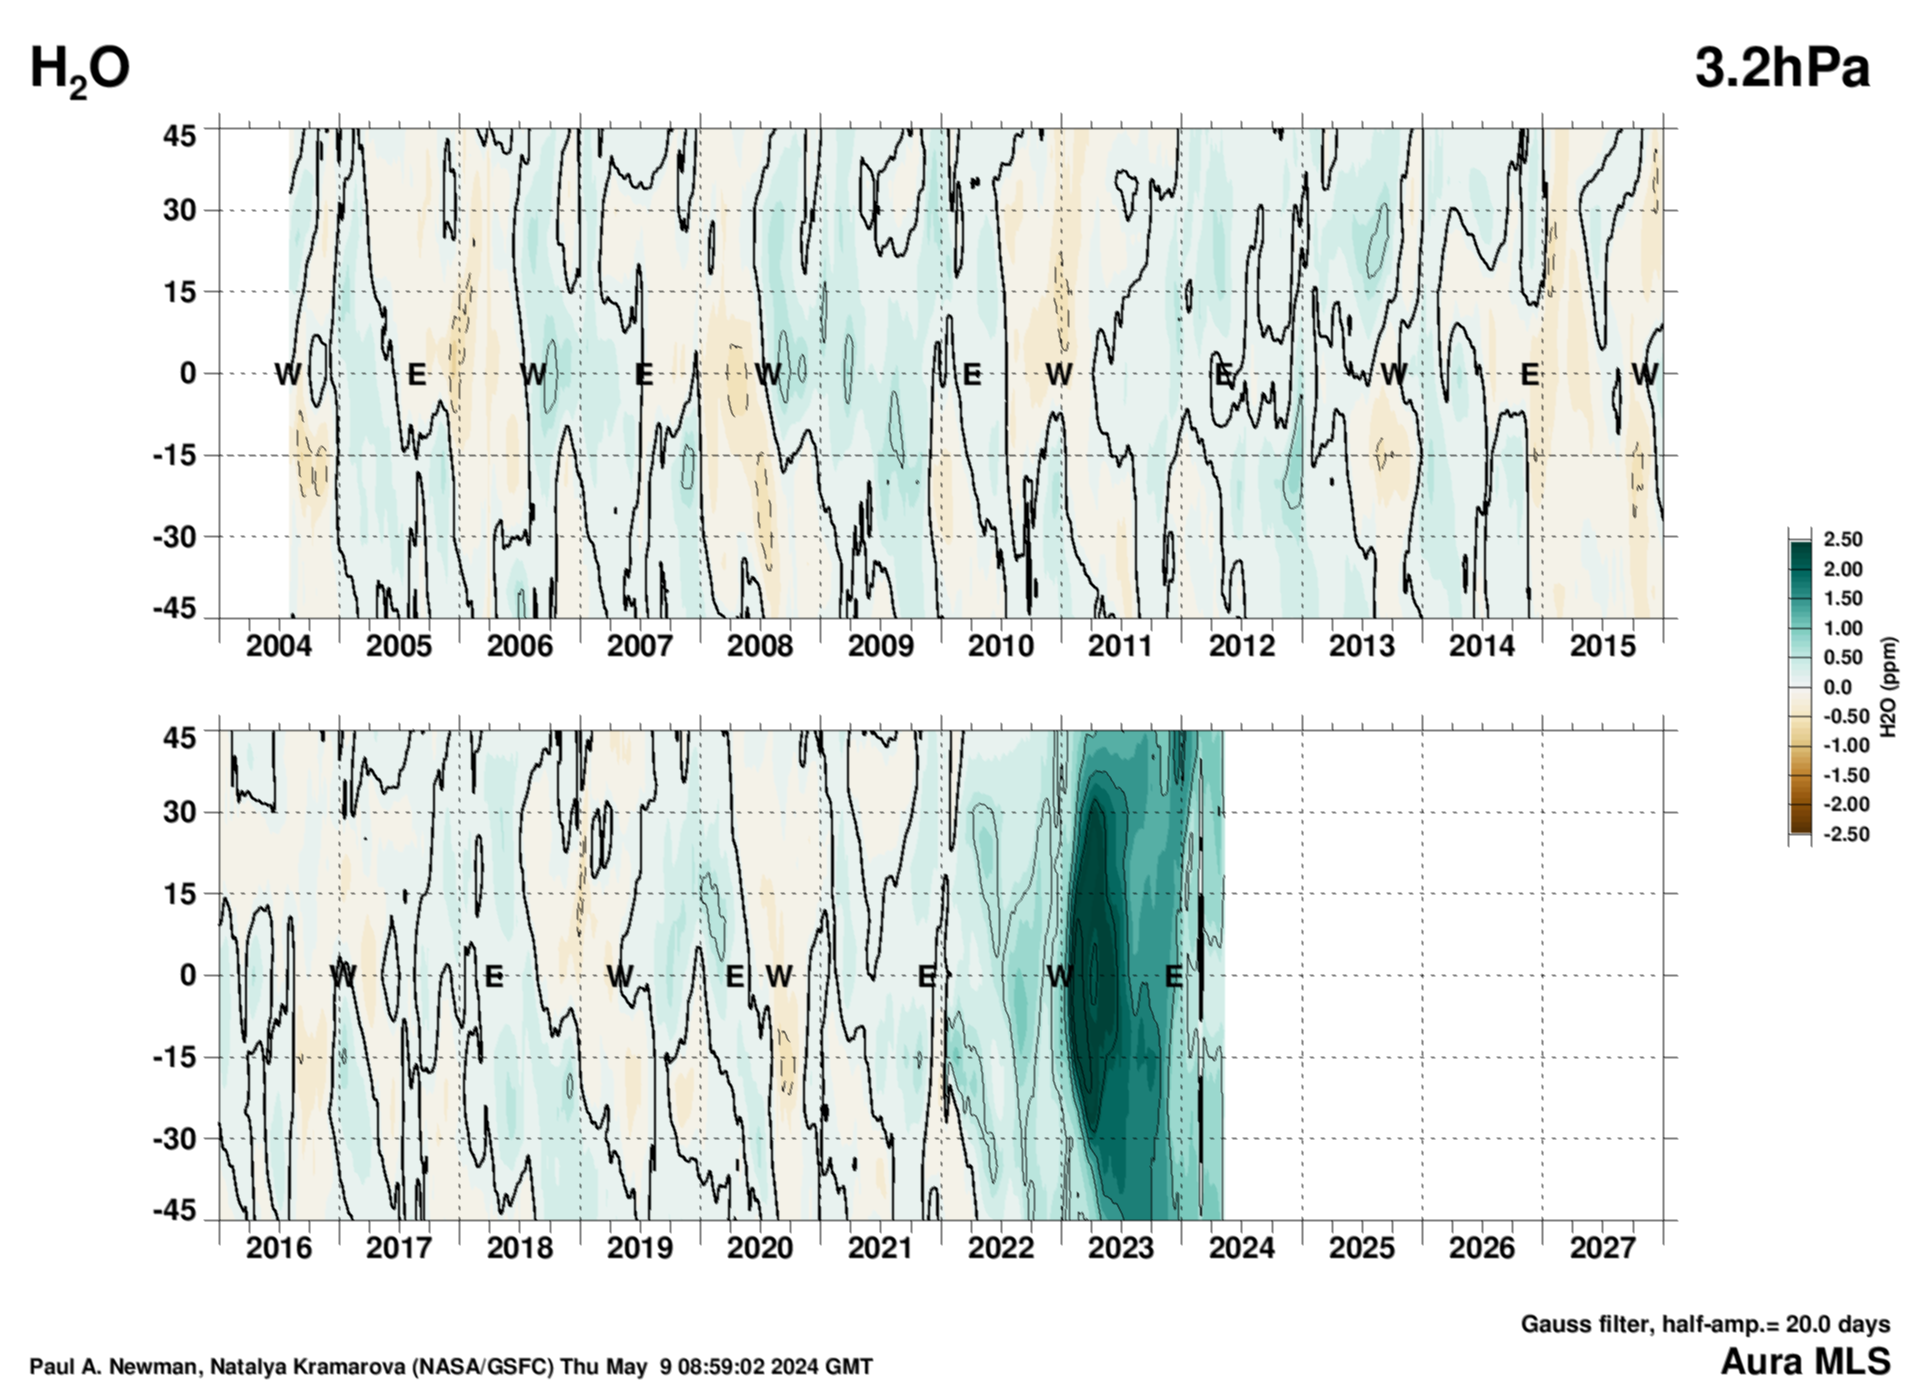
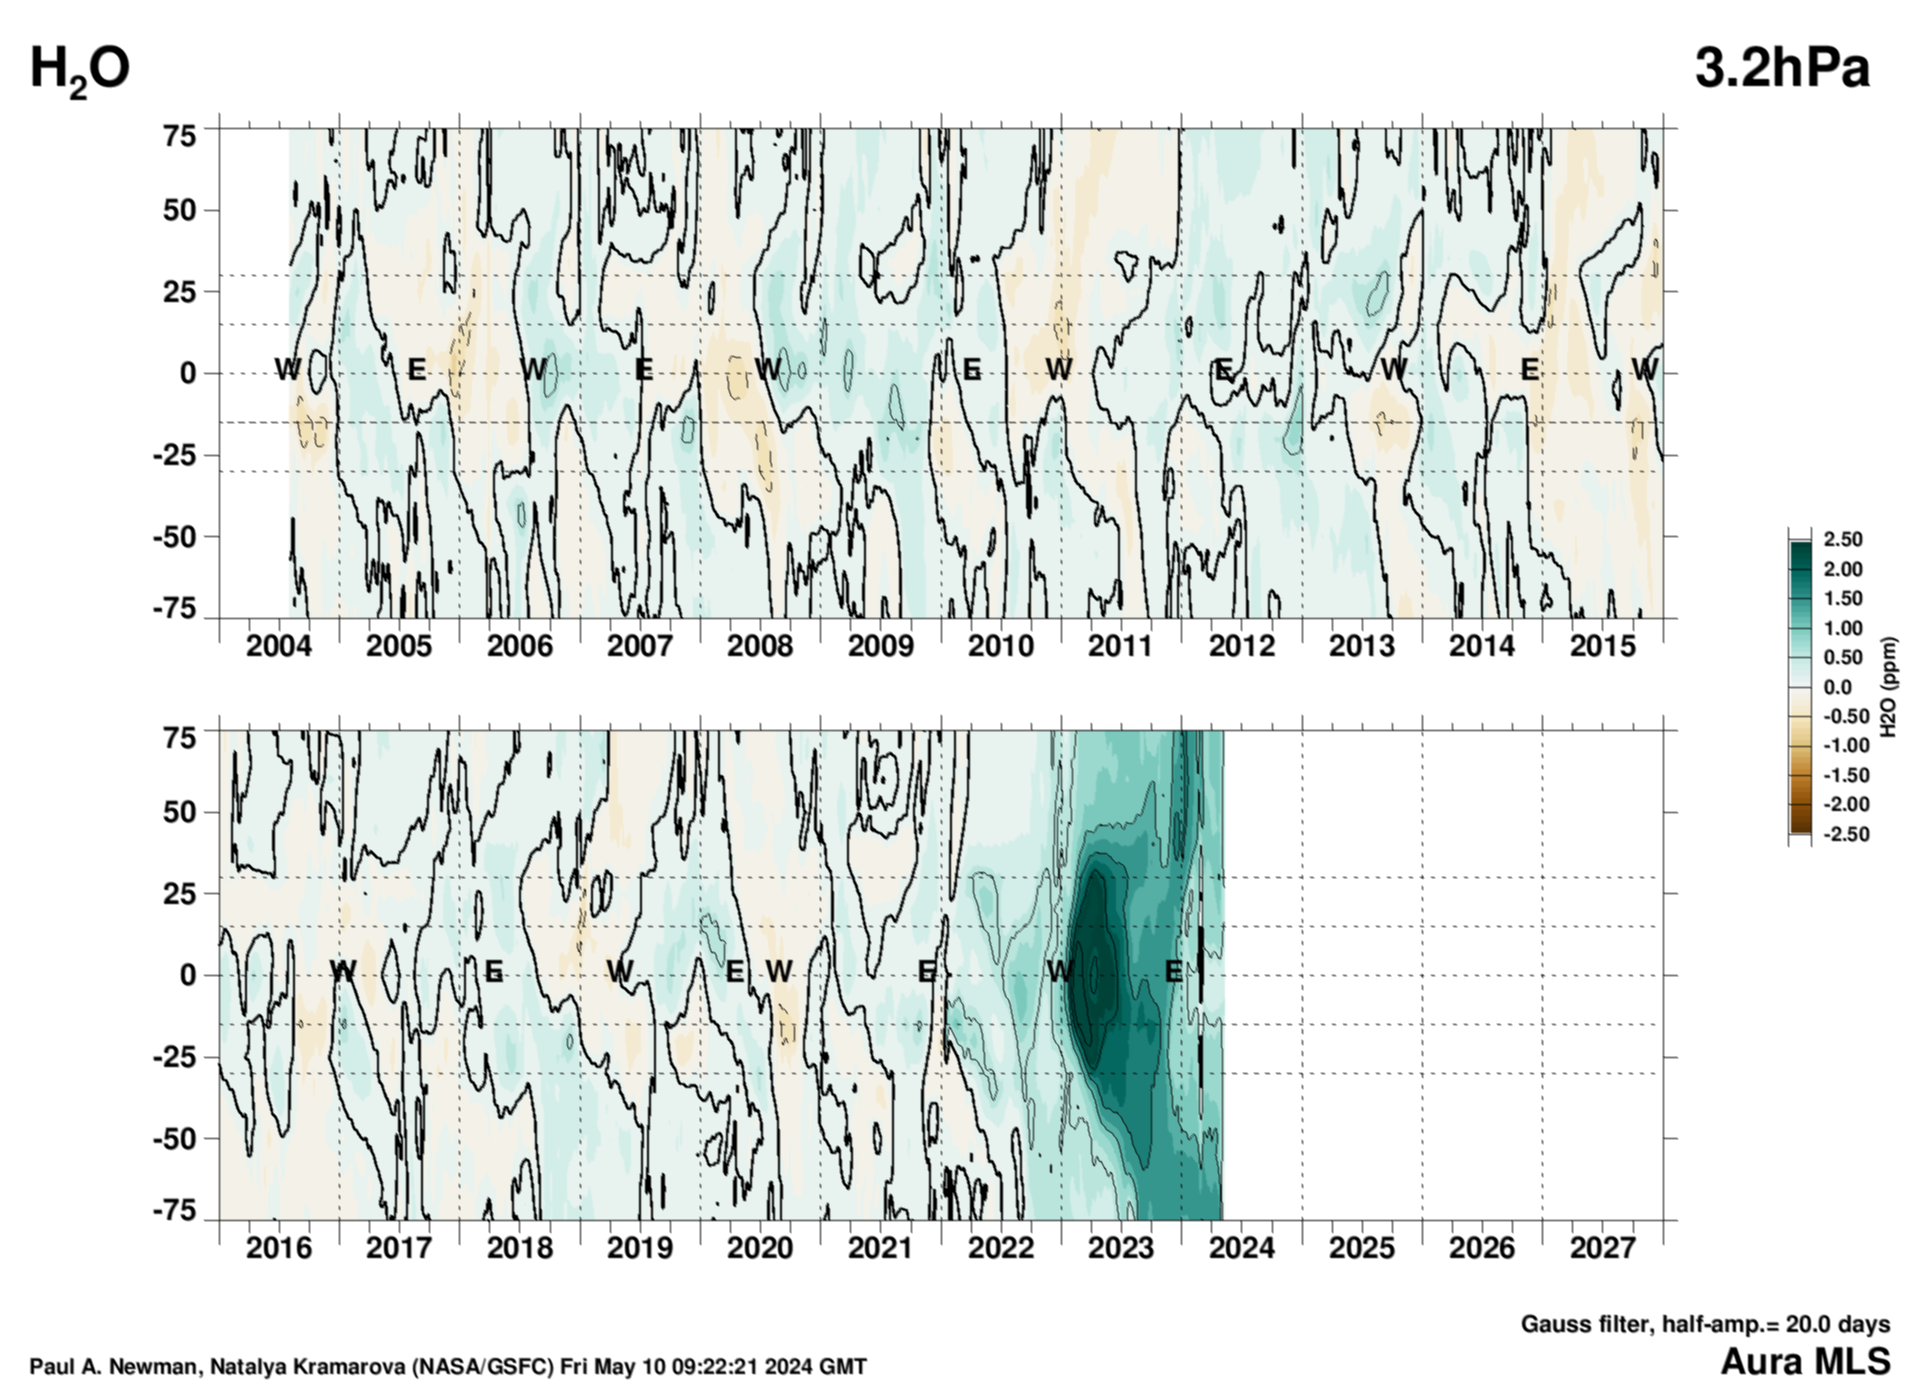
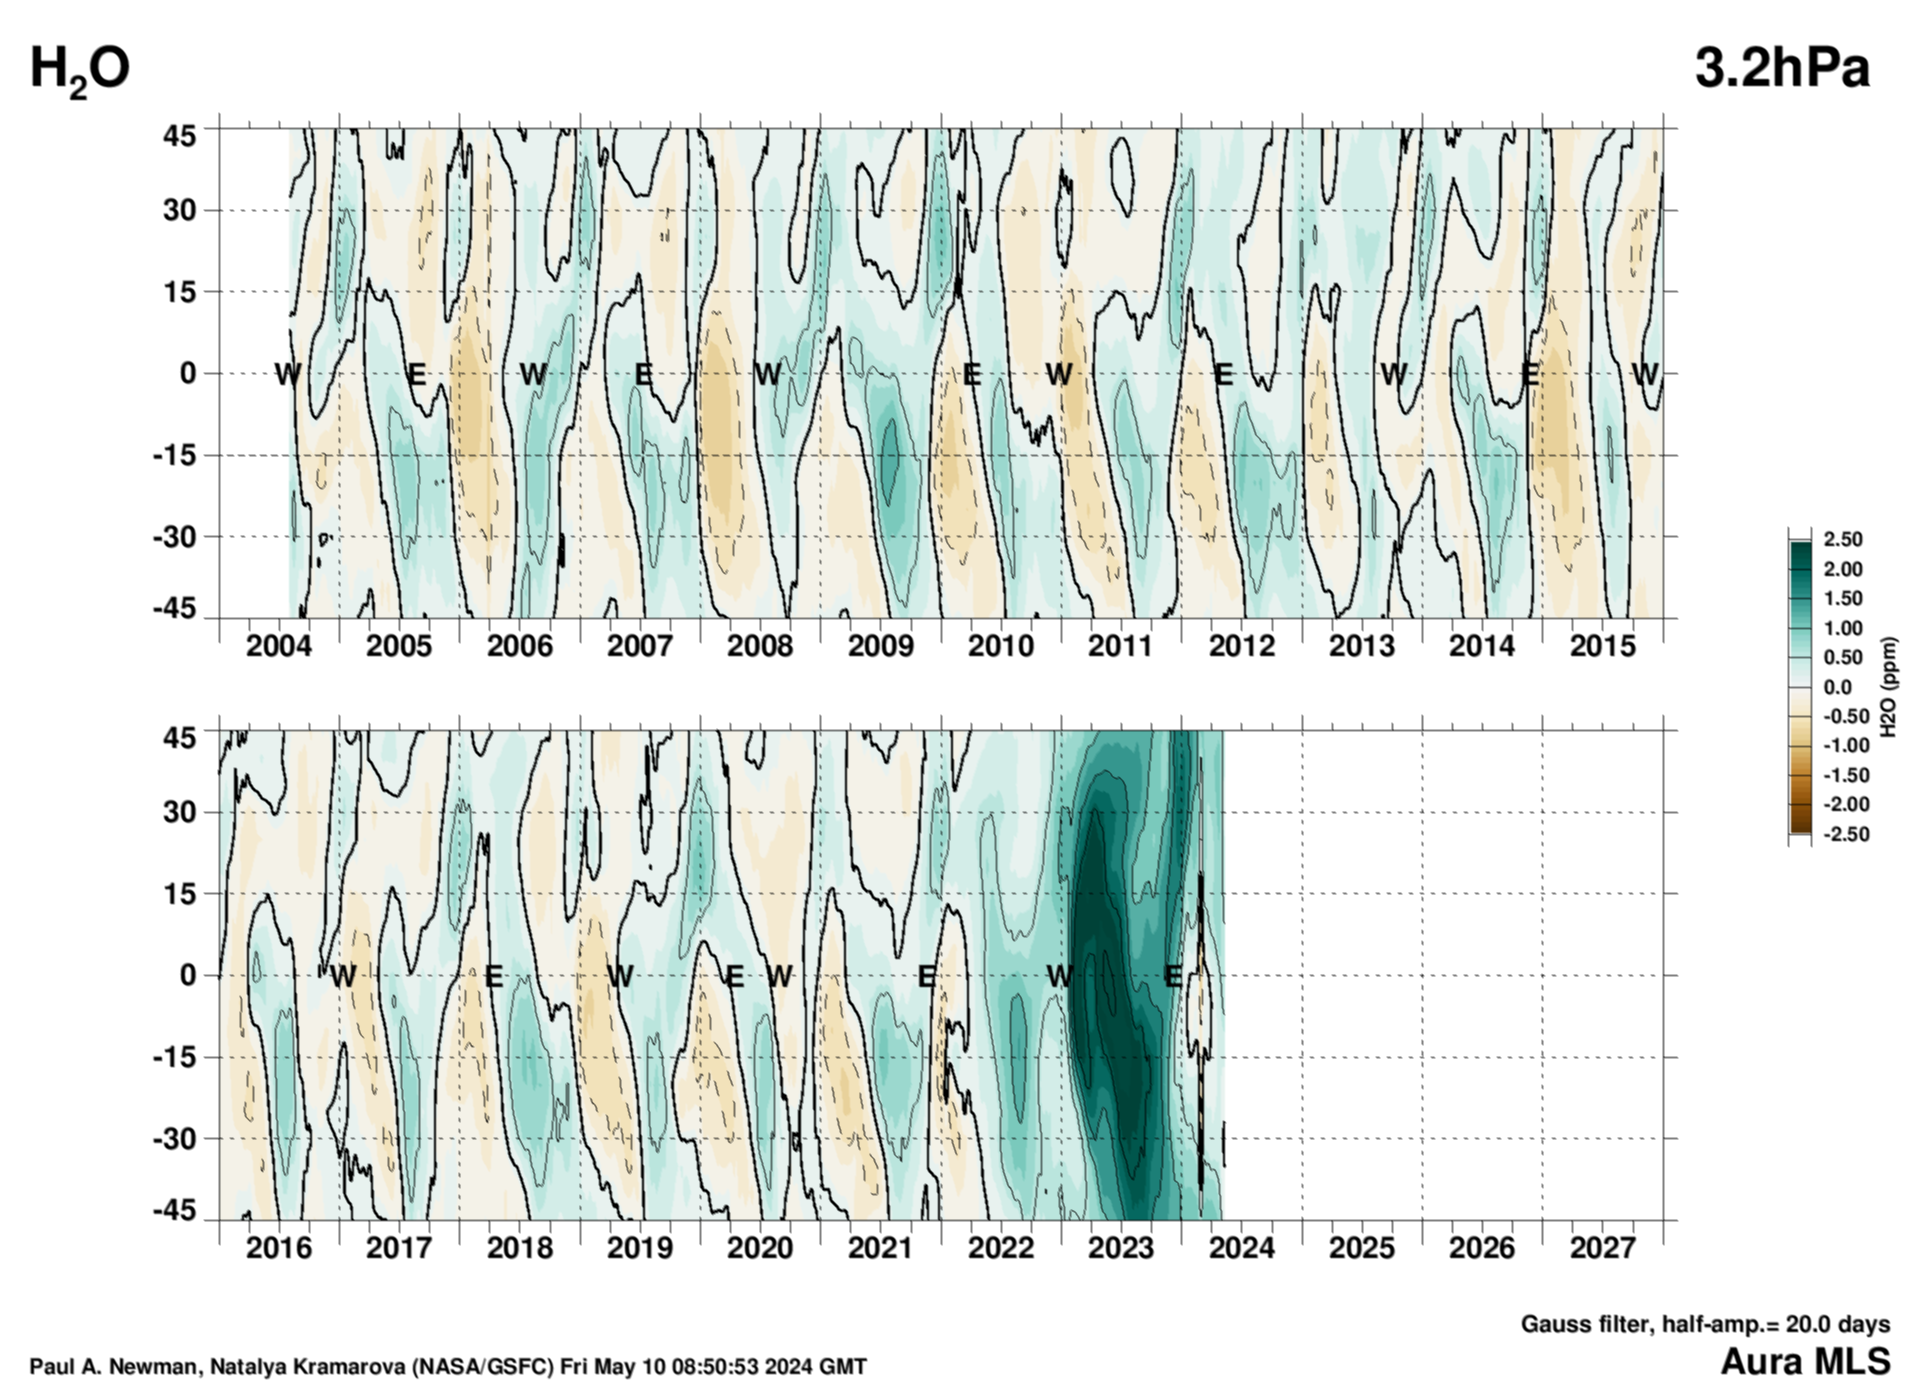
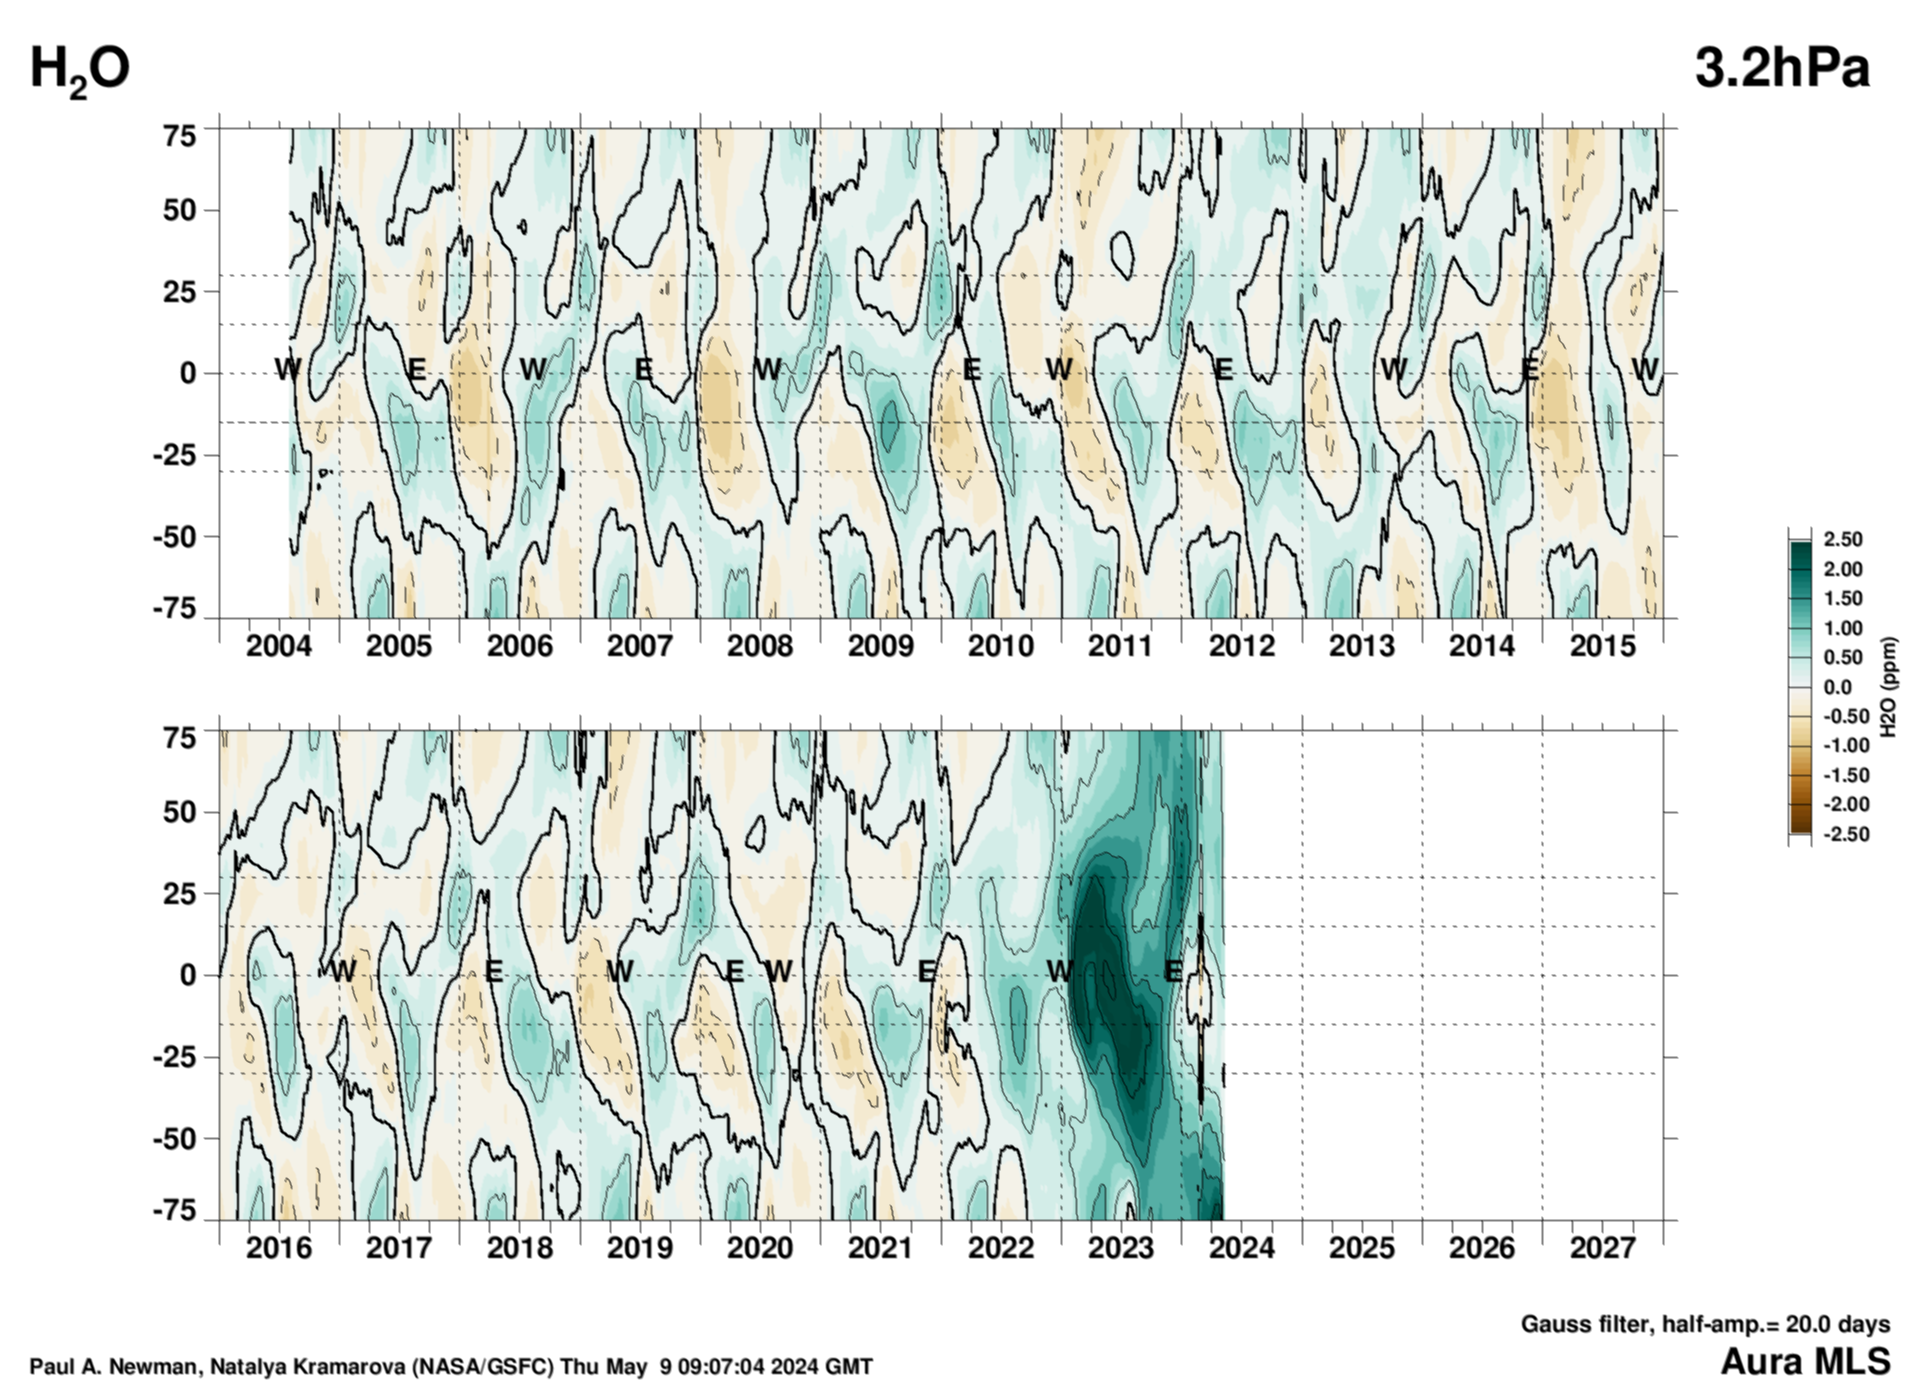
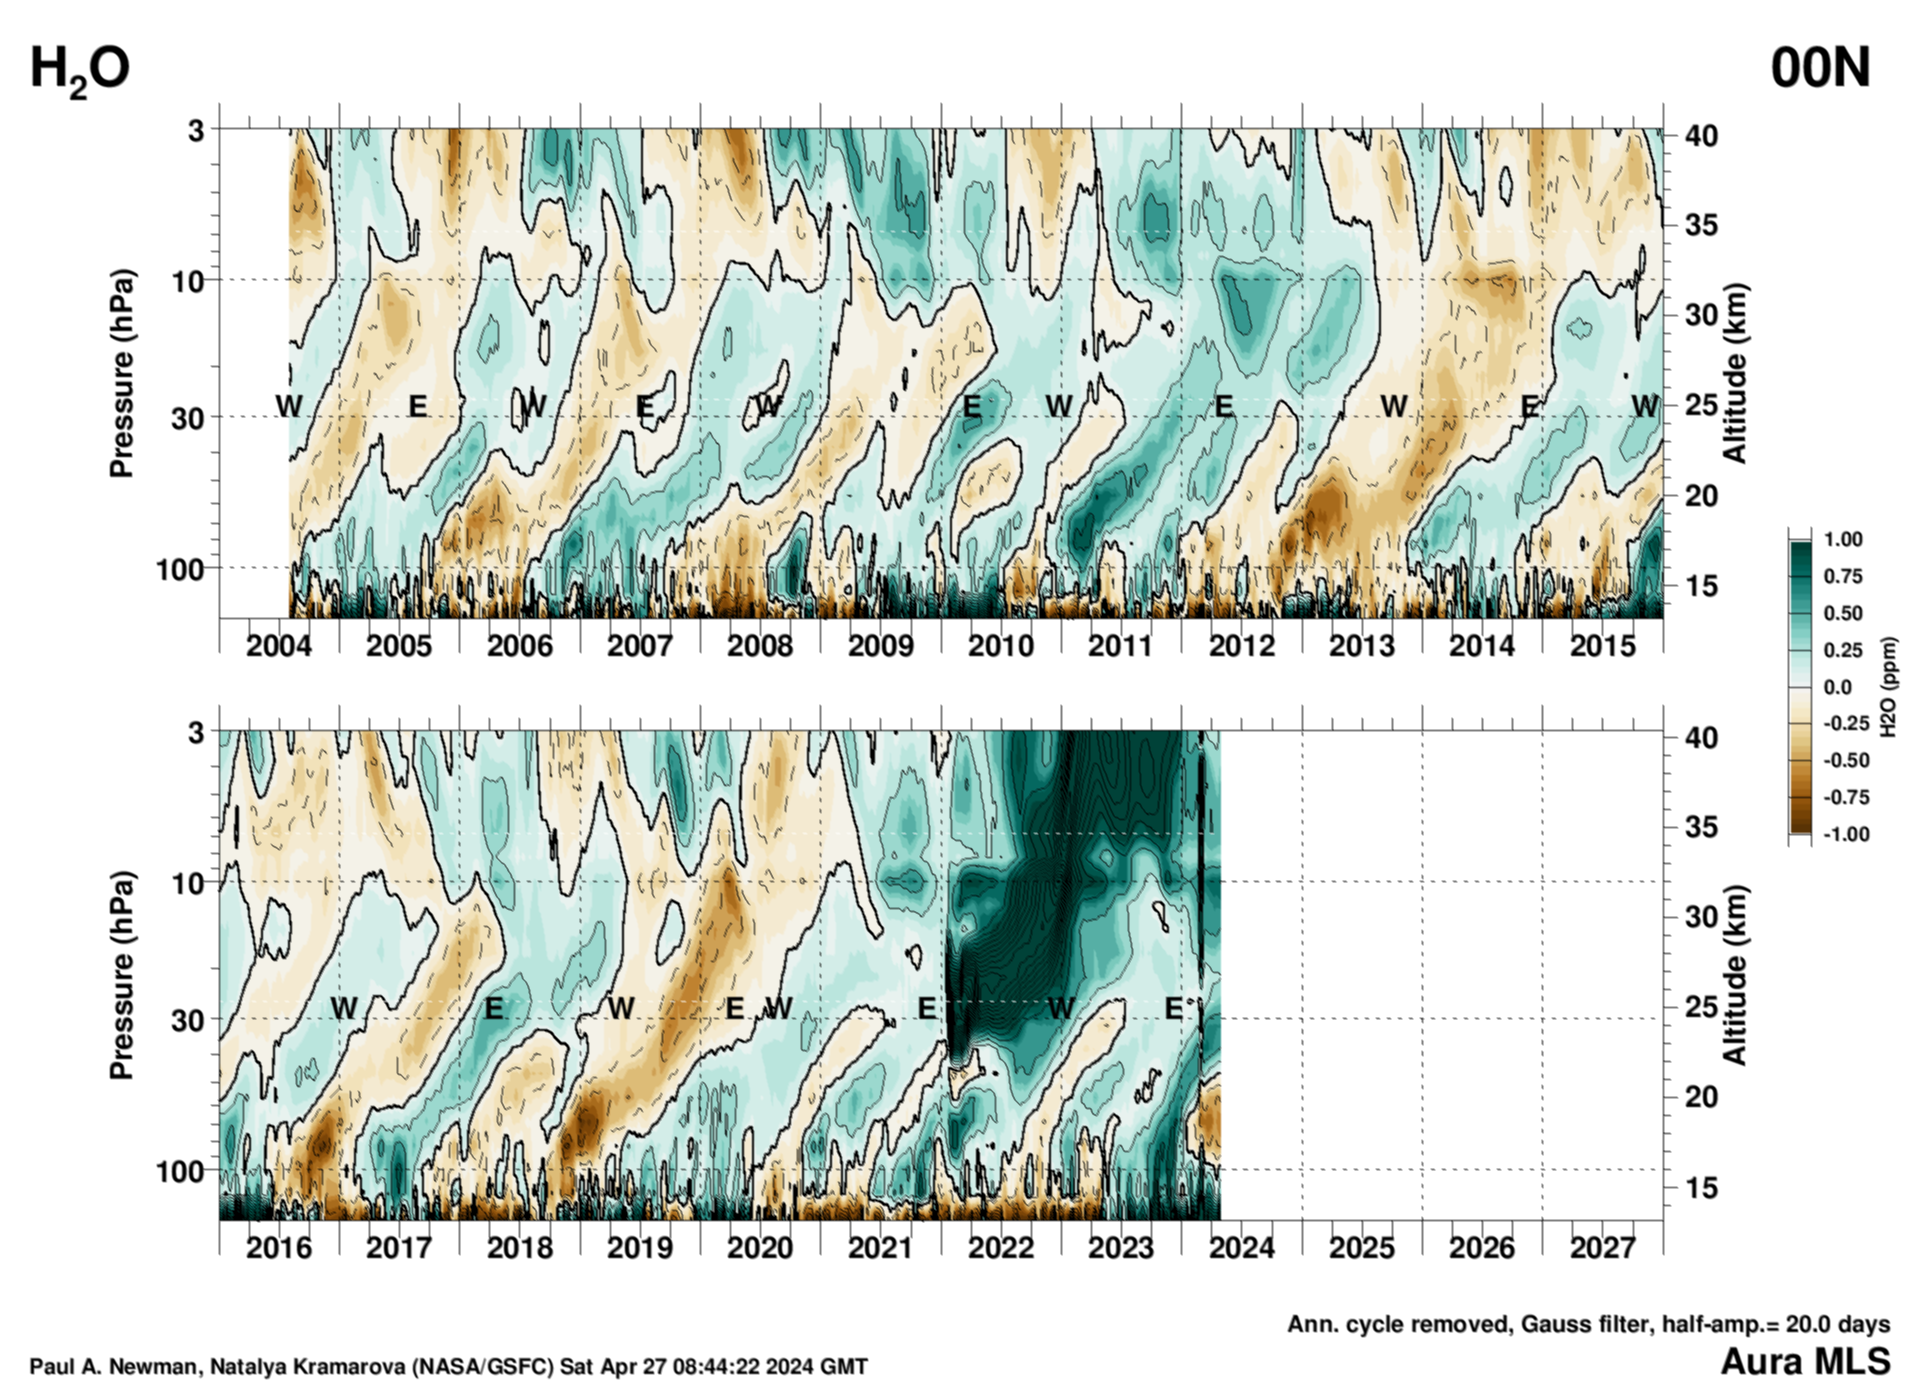
Daily V5 water data from the NASA JPL Microwave Limb Sounder (MLS) on the NASA Aura satellite. Each day's MLS water is read, and all profiles within 2.5 degrees of a latitude are averaged together to produce the daily water zonal mean profiles since launch in 2004. Profiles are temporally interpolated over missing days. For the "Without Annual Cycle" plot, the annual cycle is subtracted from the profile, while the "With Annual Cycle" plots simply have the long-term average removed. All plots are smoothed using a Gaussian filter to remove higher frequency structure. The easterly (E) and westerly points are as shown in the Singapore zonal winds, and are derived (see text with EOF figure) from the EOF-1 and EOF-2 phase diagram above. In all of these plots, the climatology does not include data past 31 December 2021 to avoid the Hunga eruption. Units are parts per million (ppm).
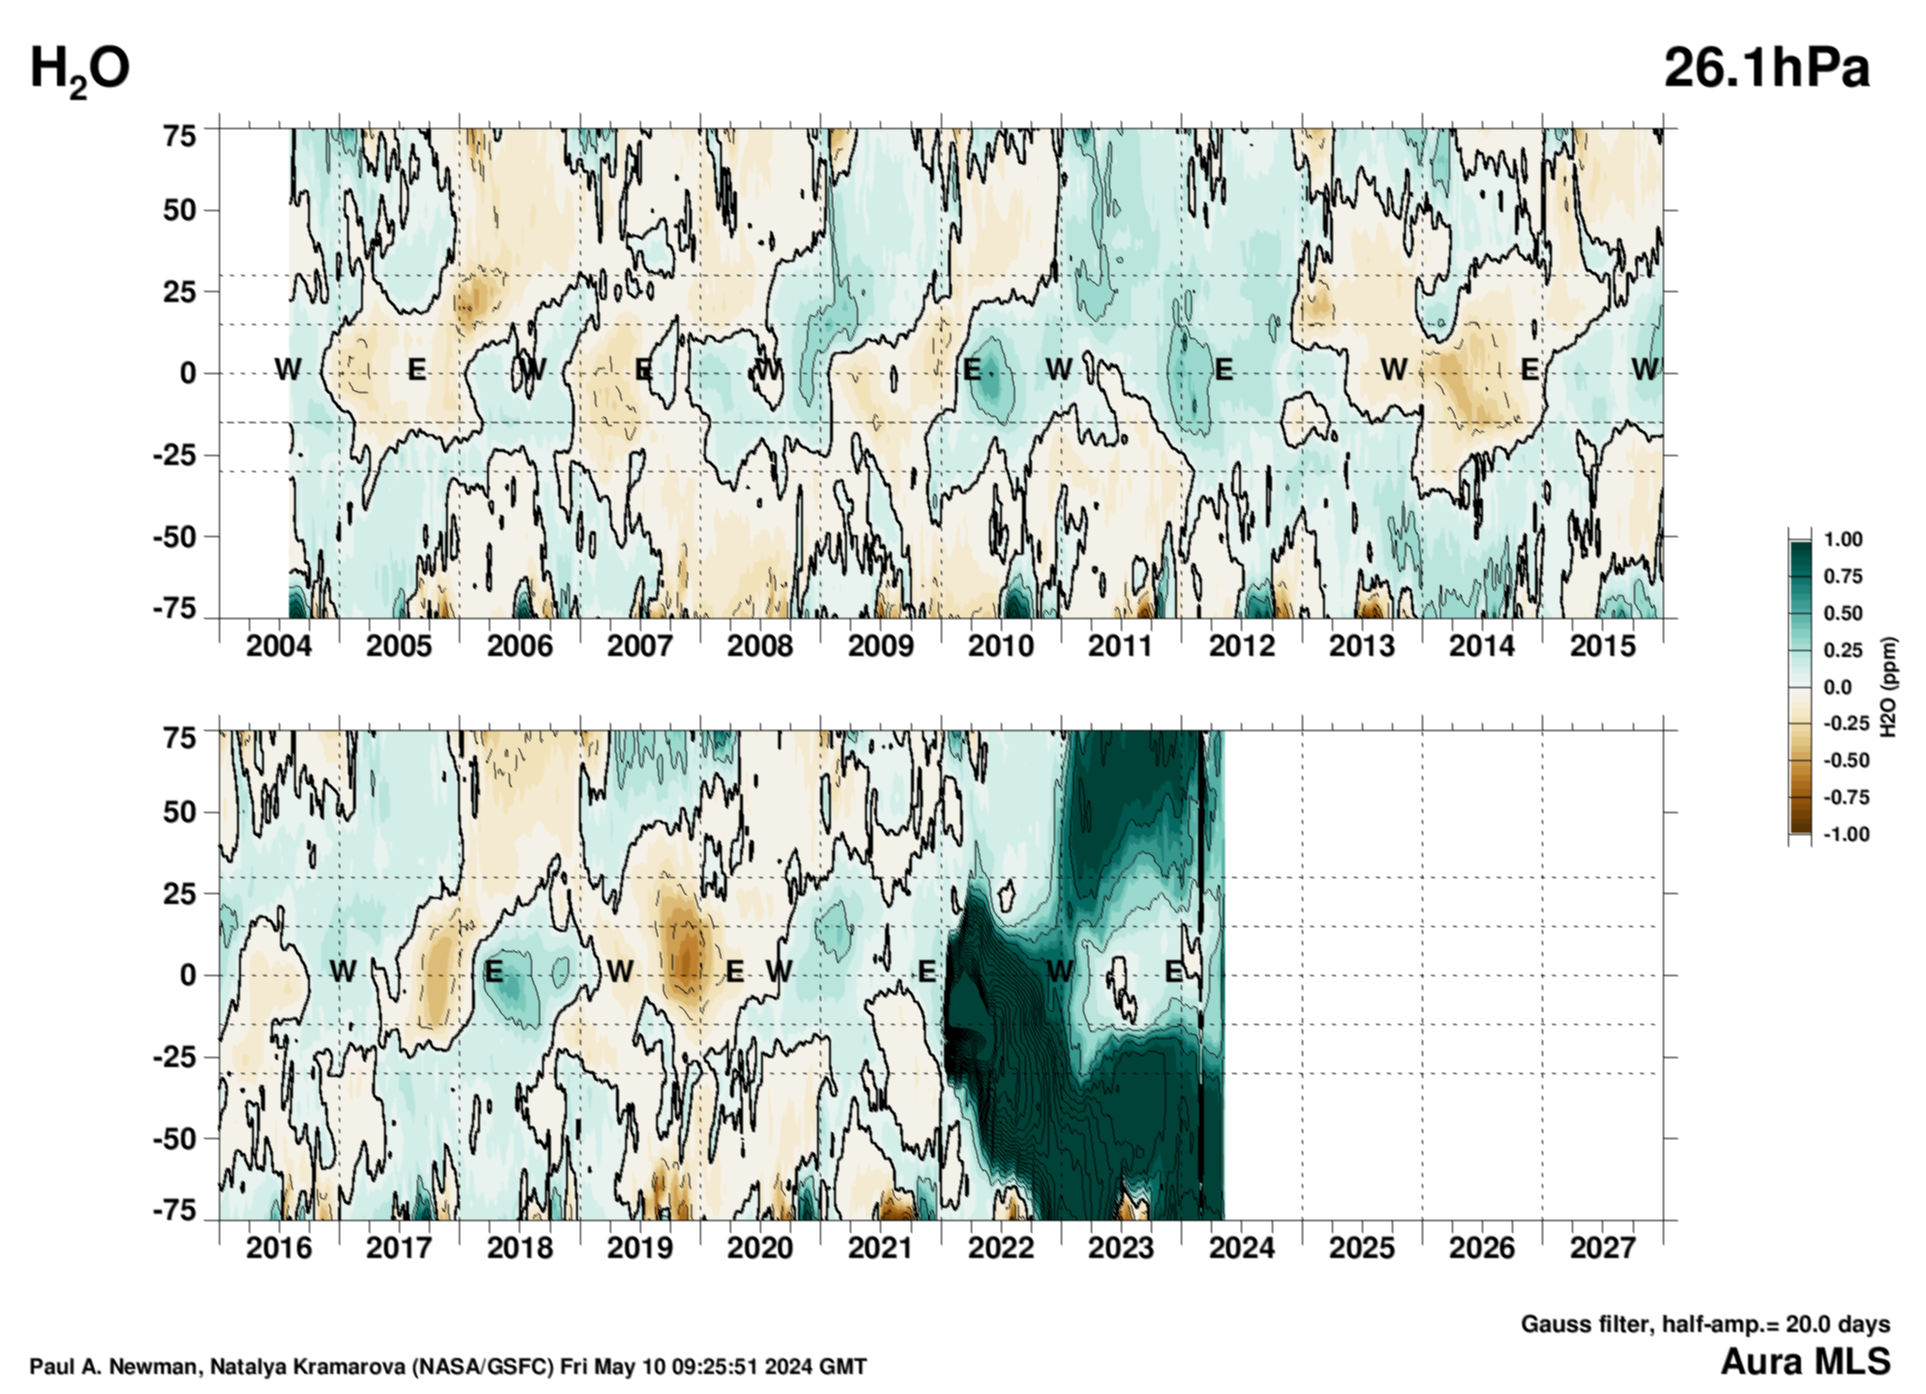
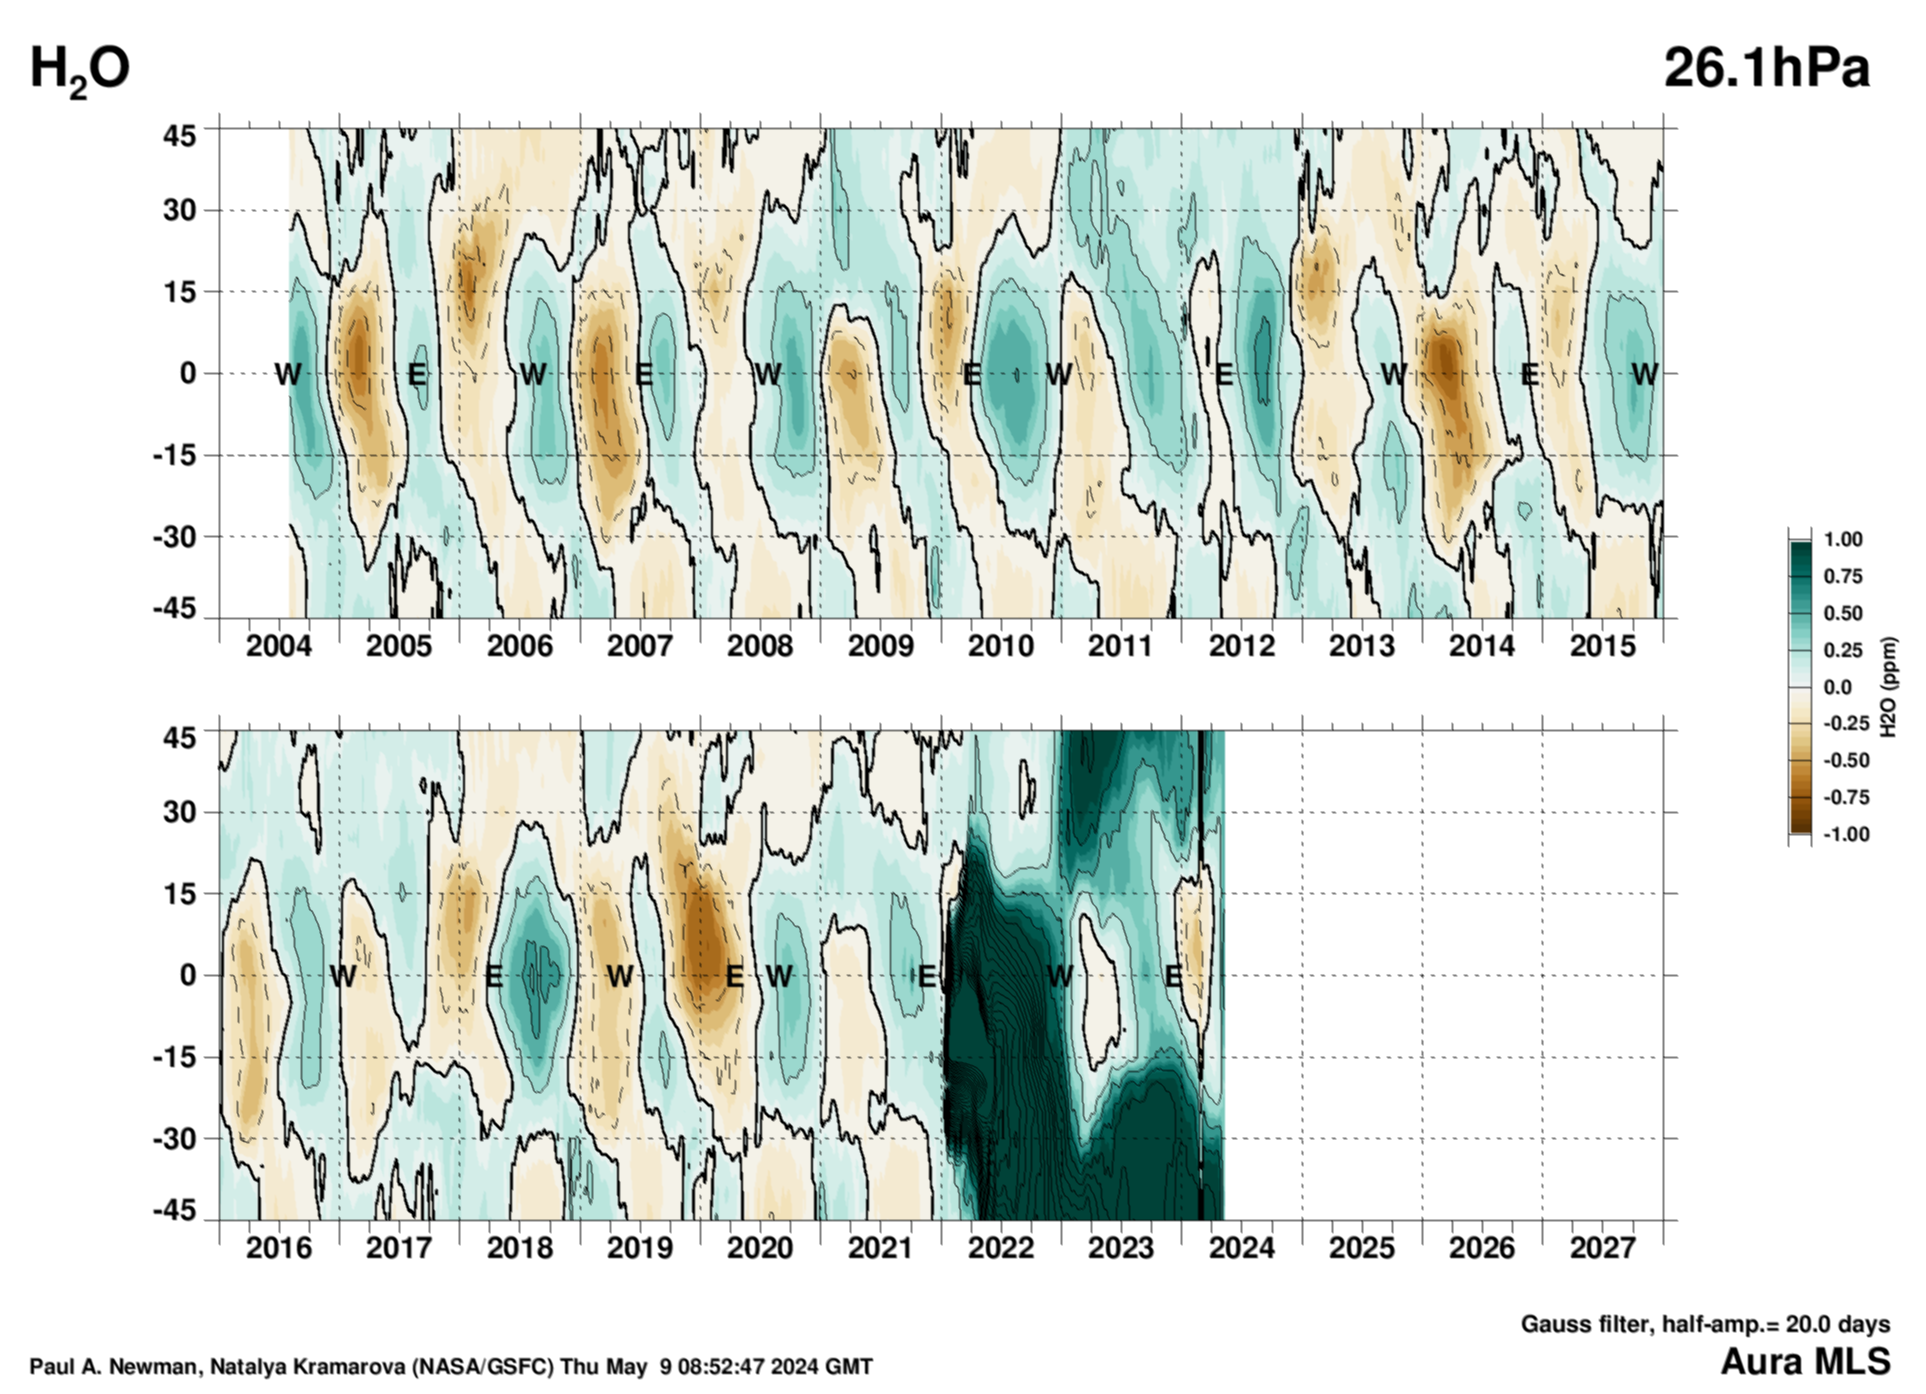
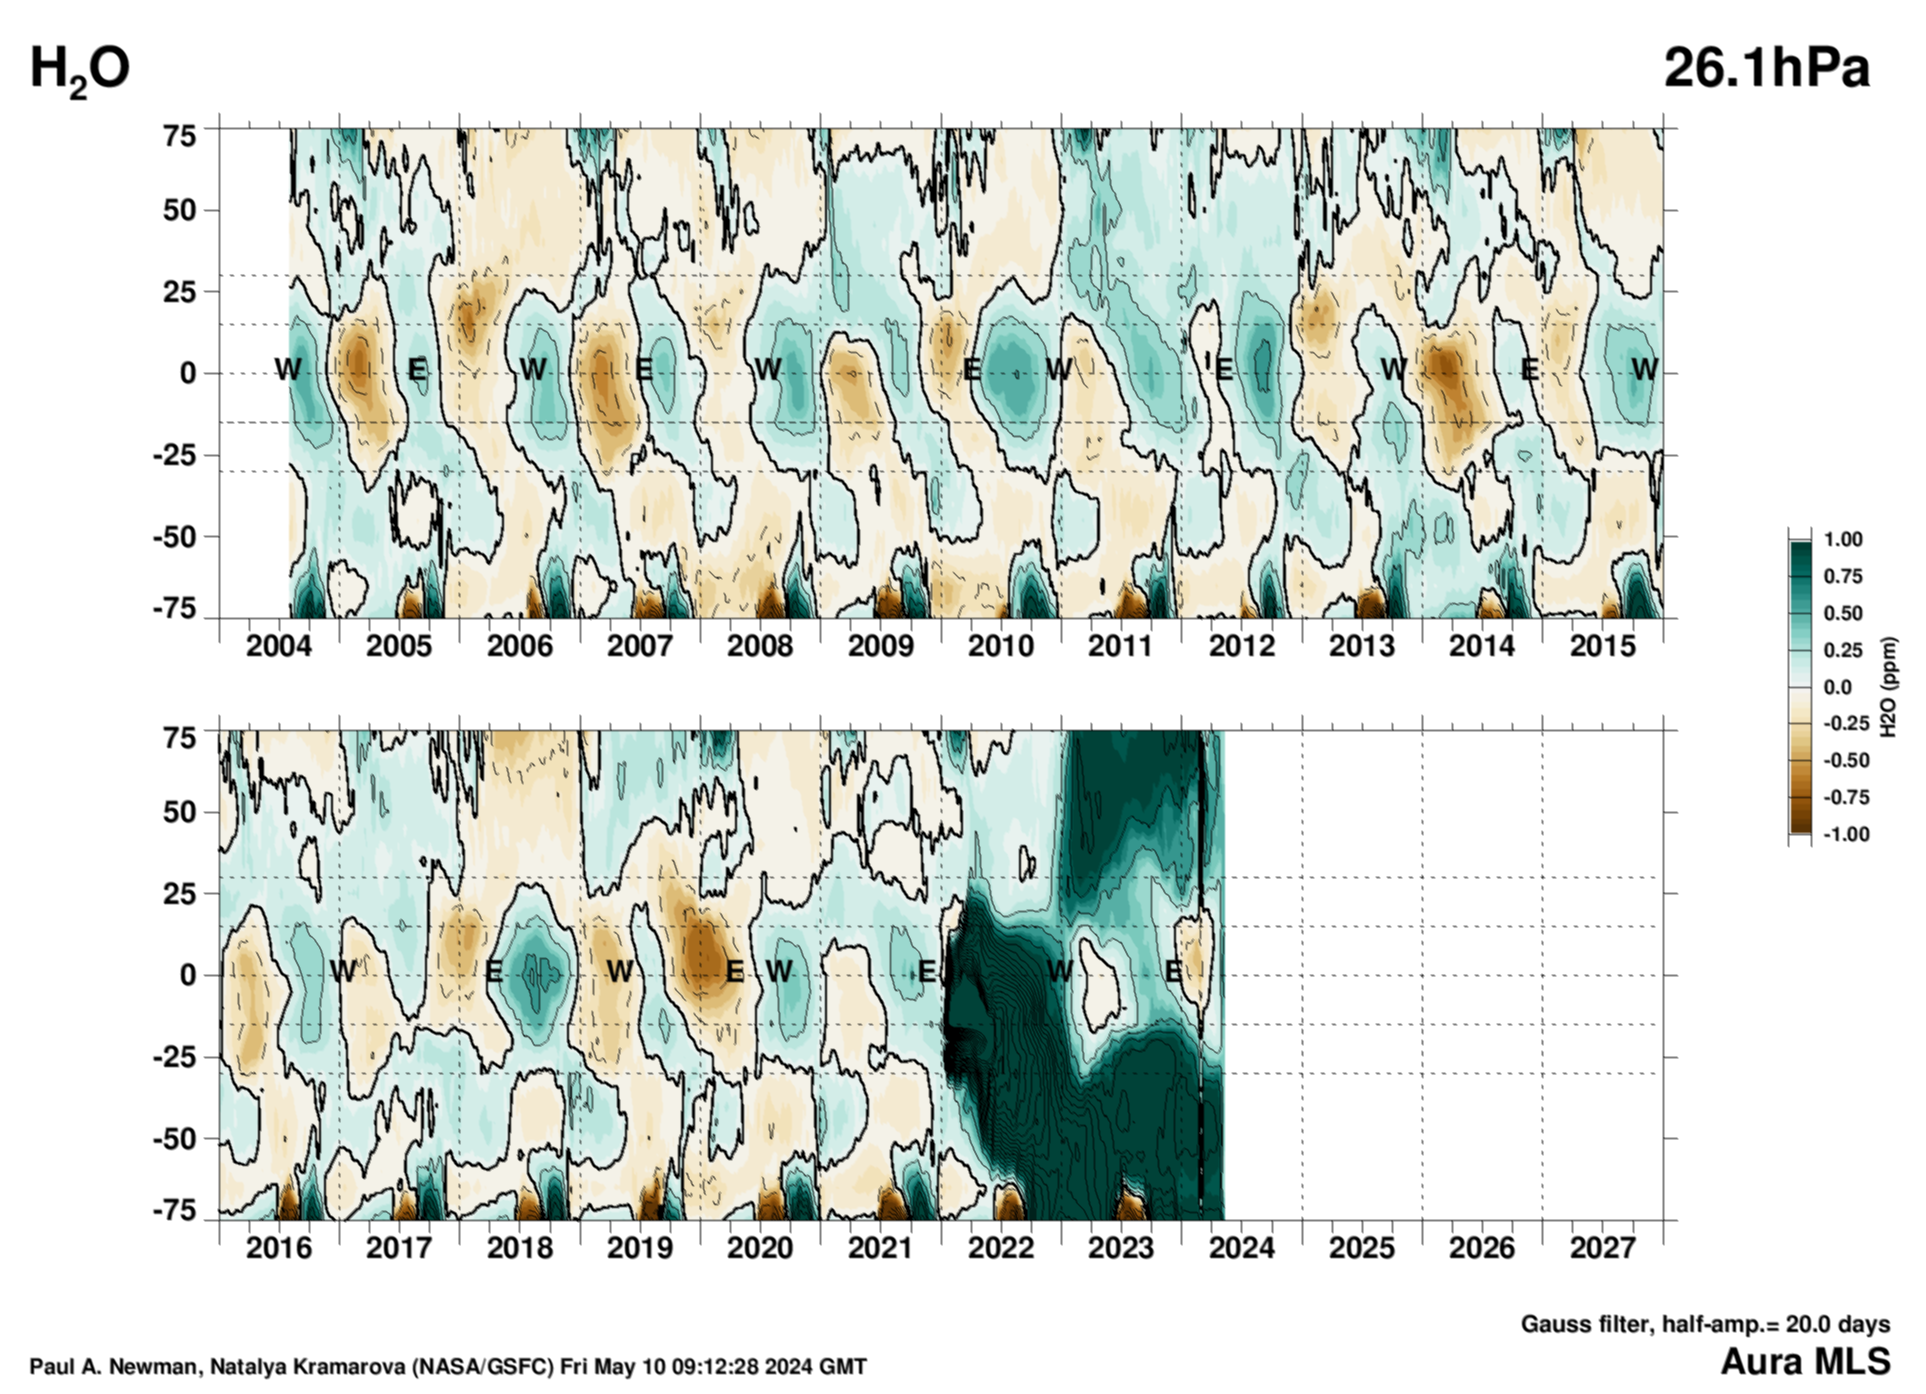
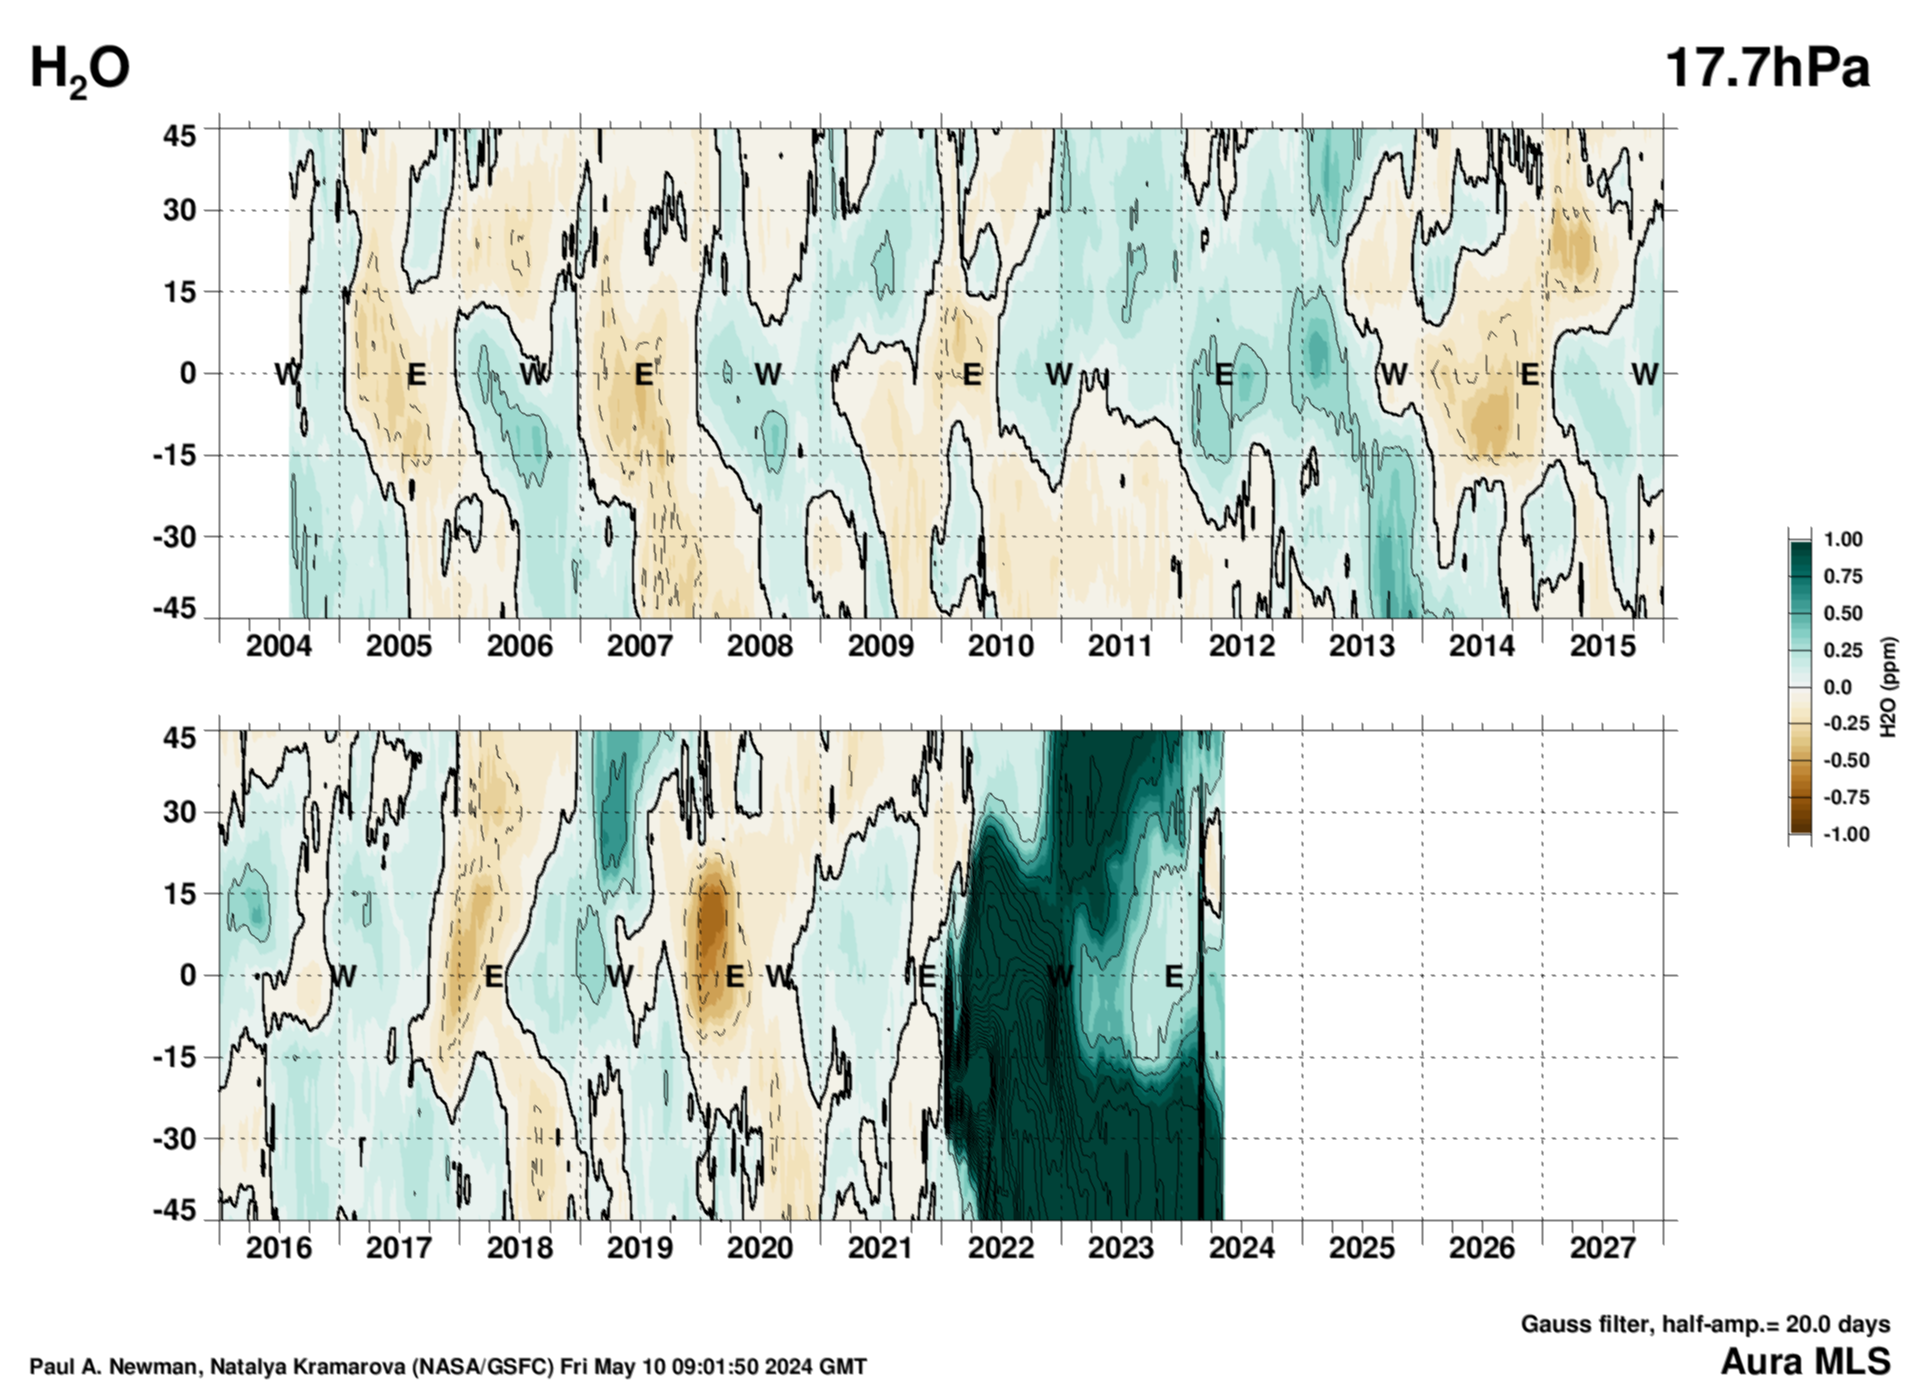
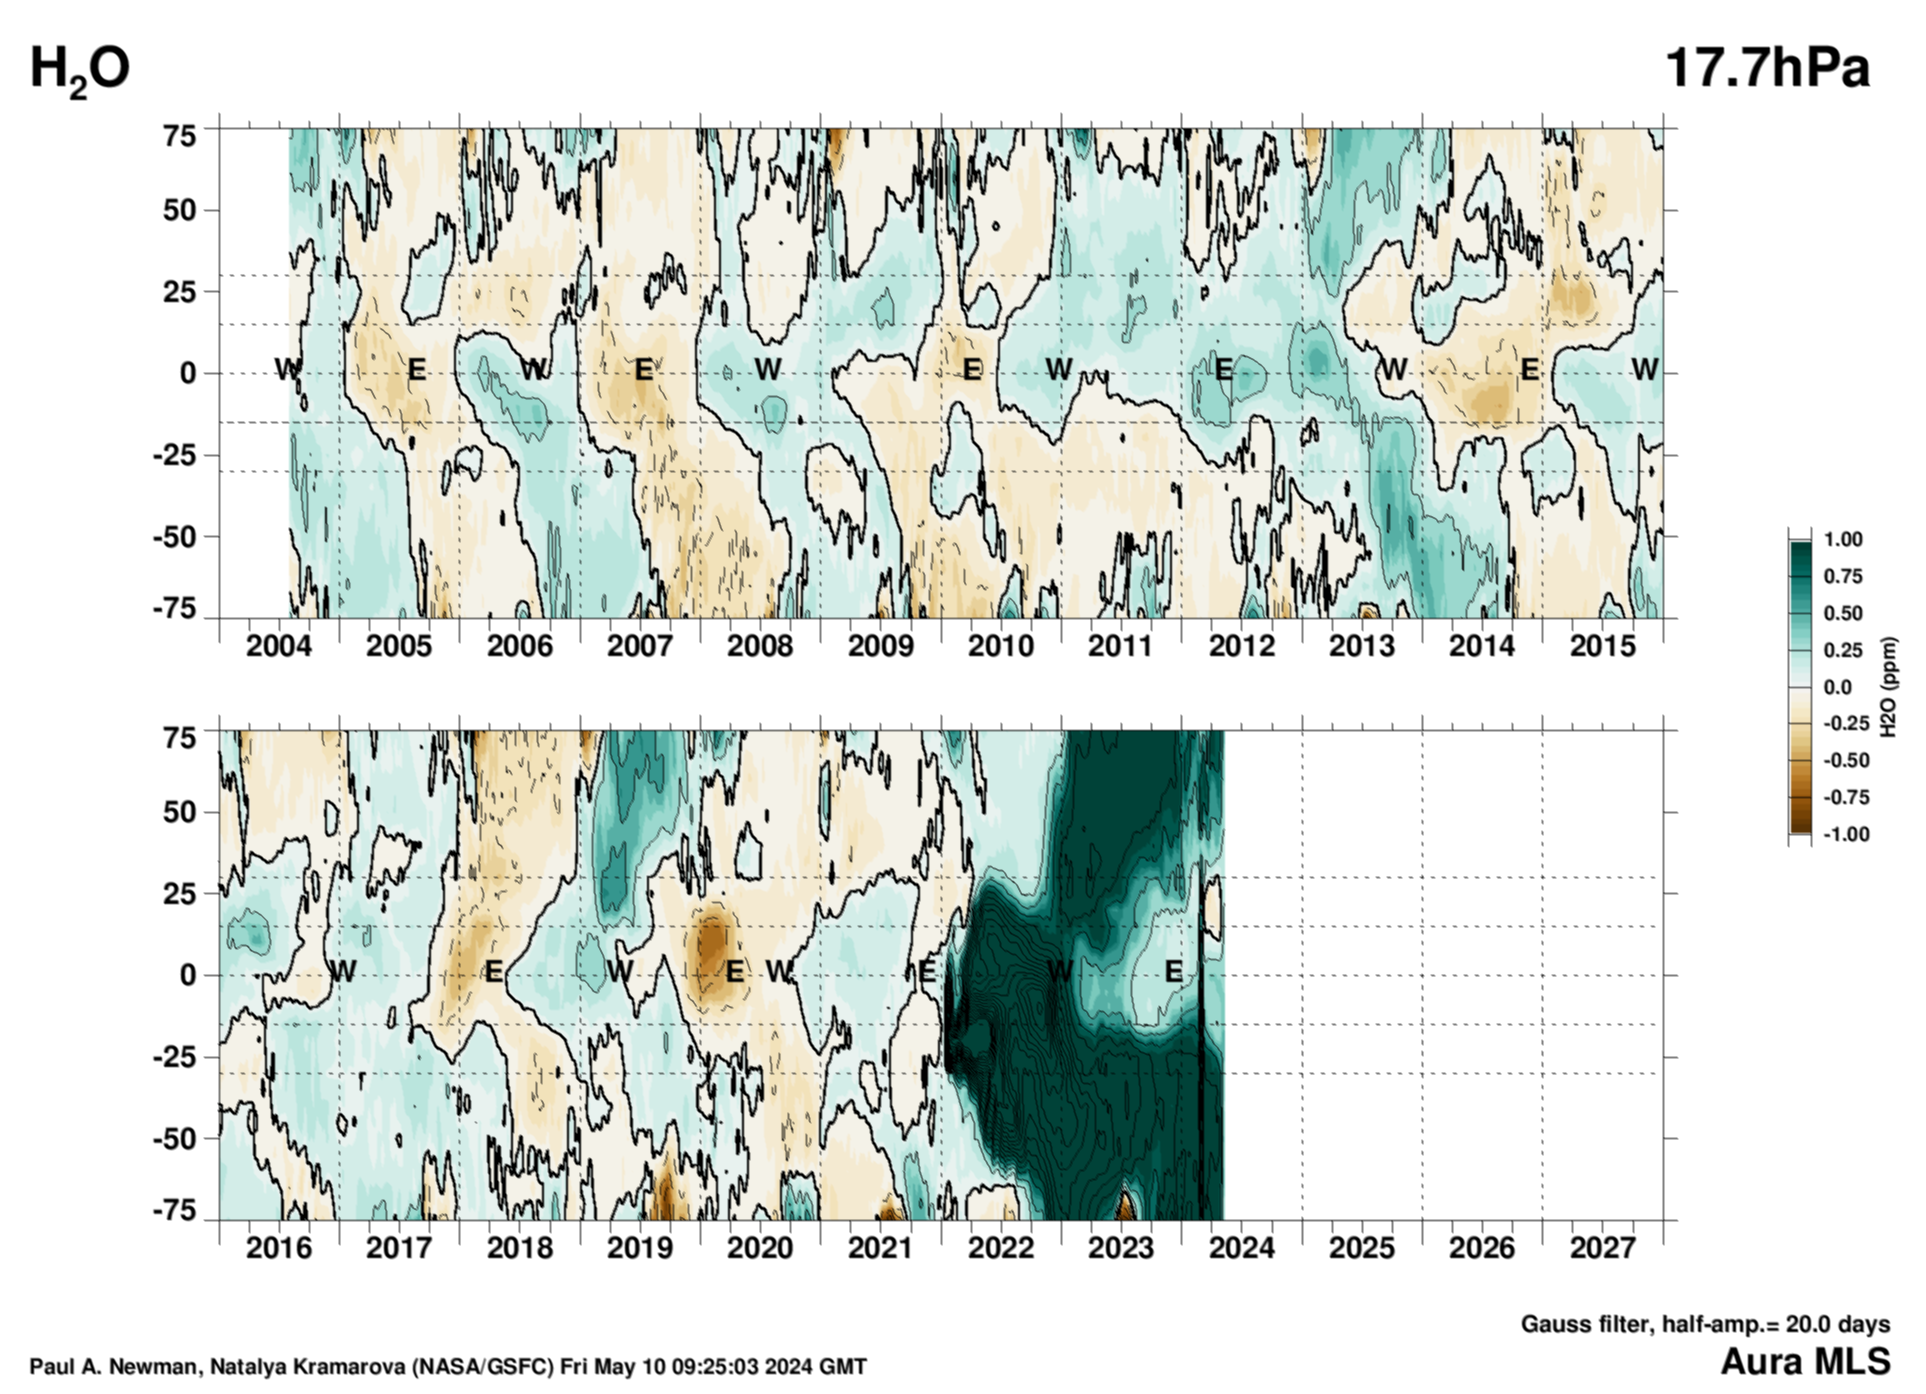
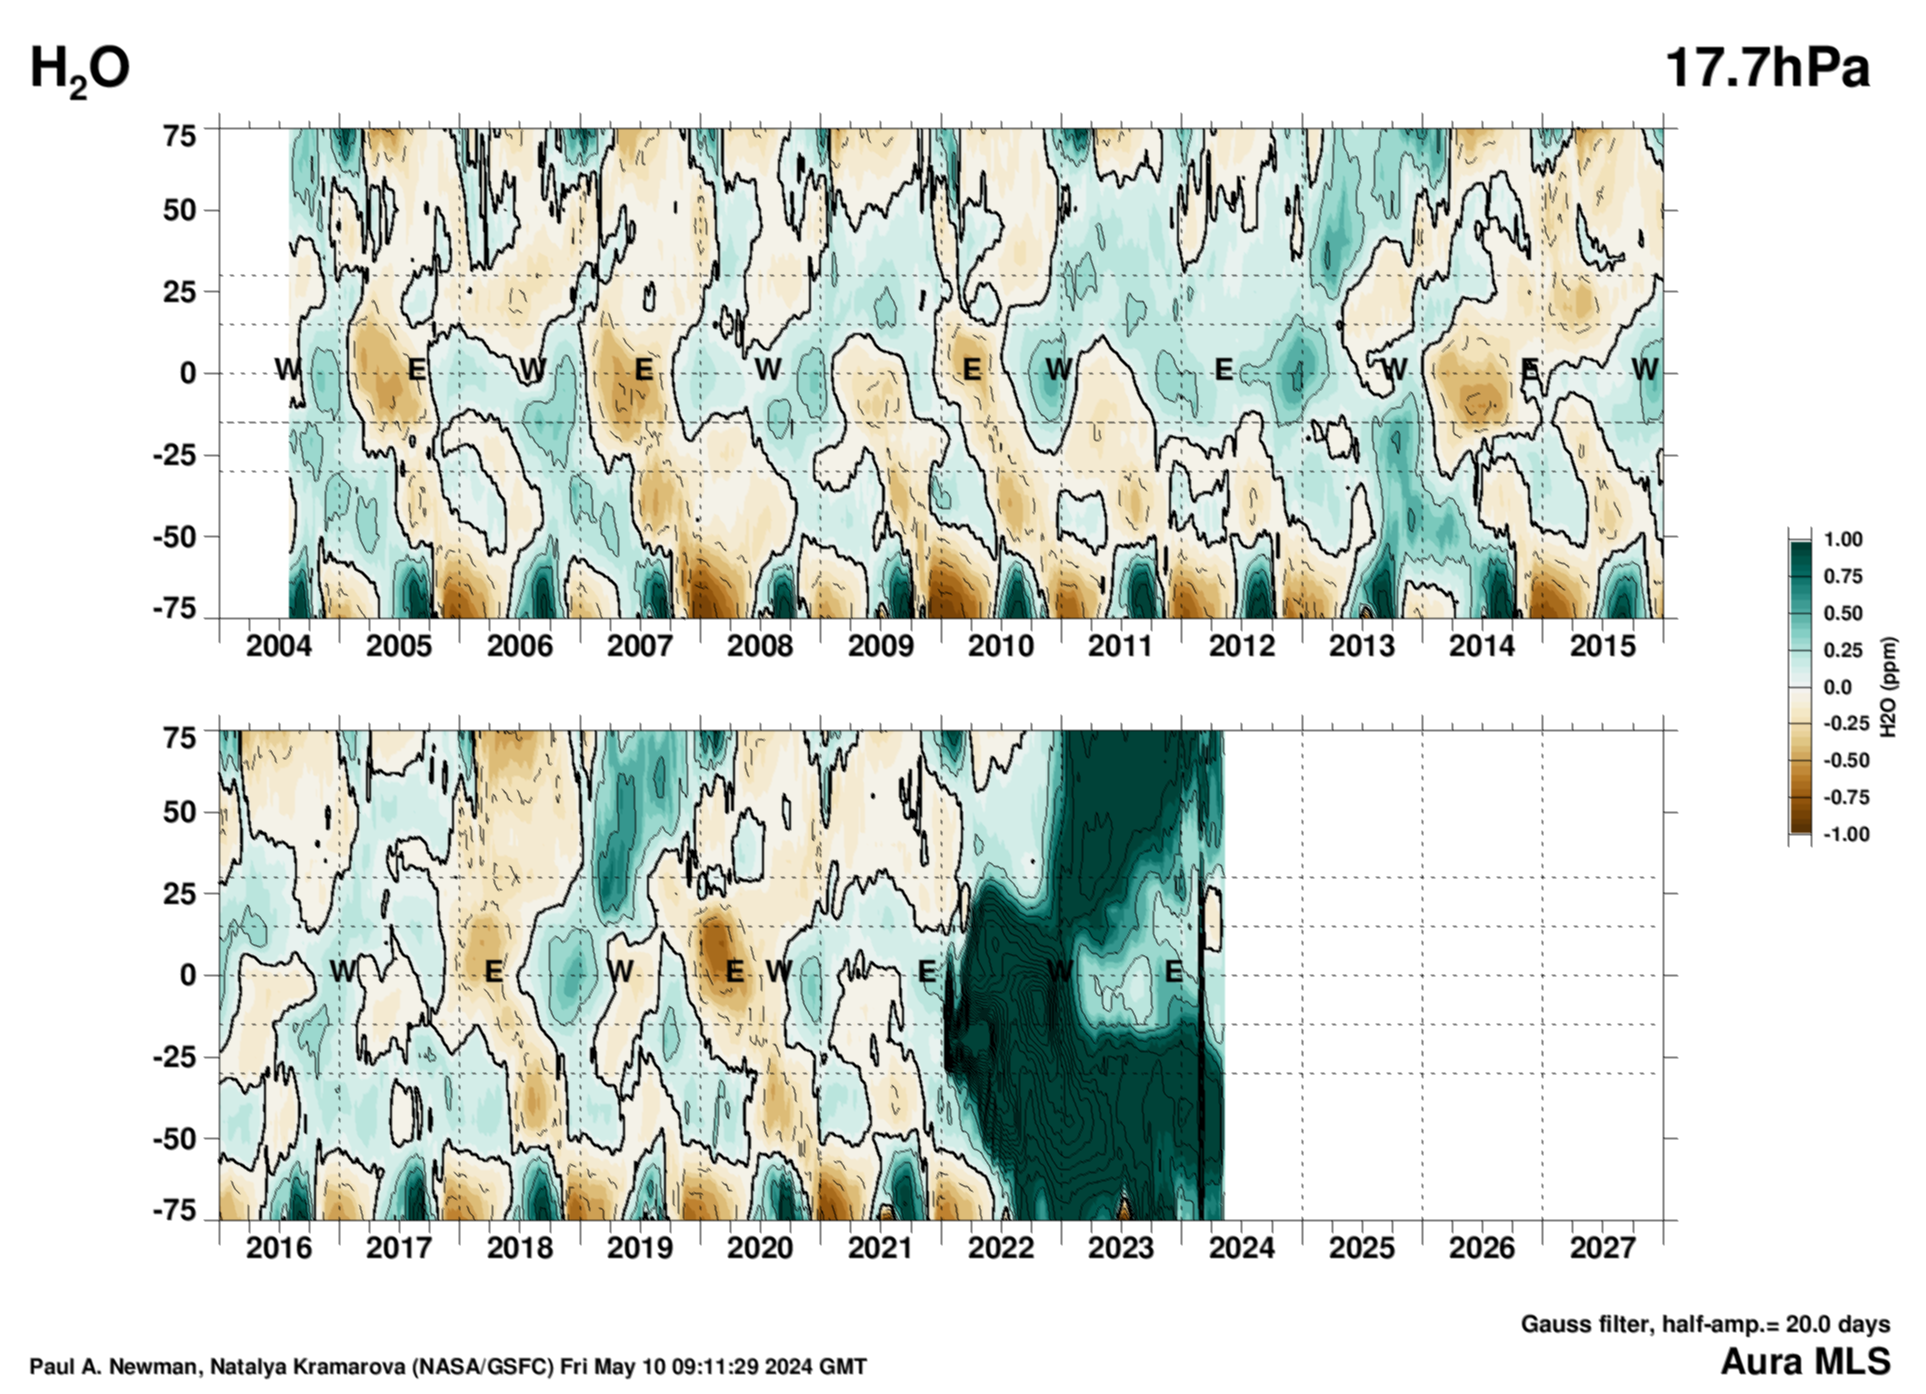
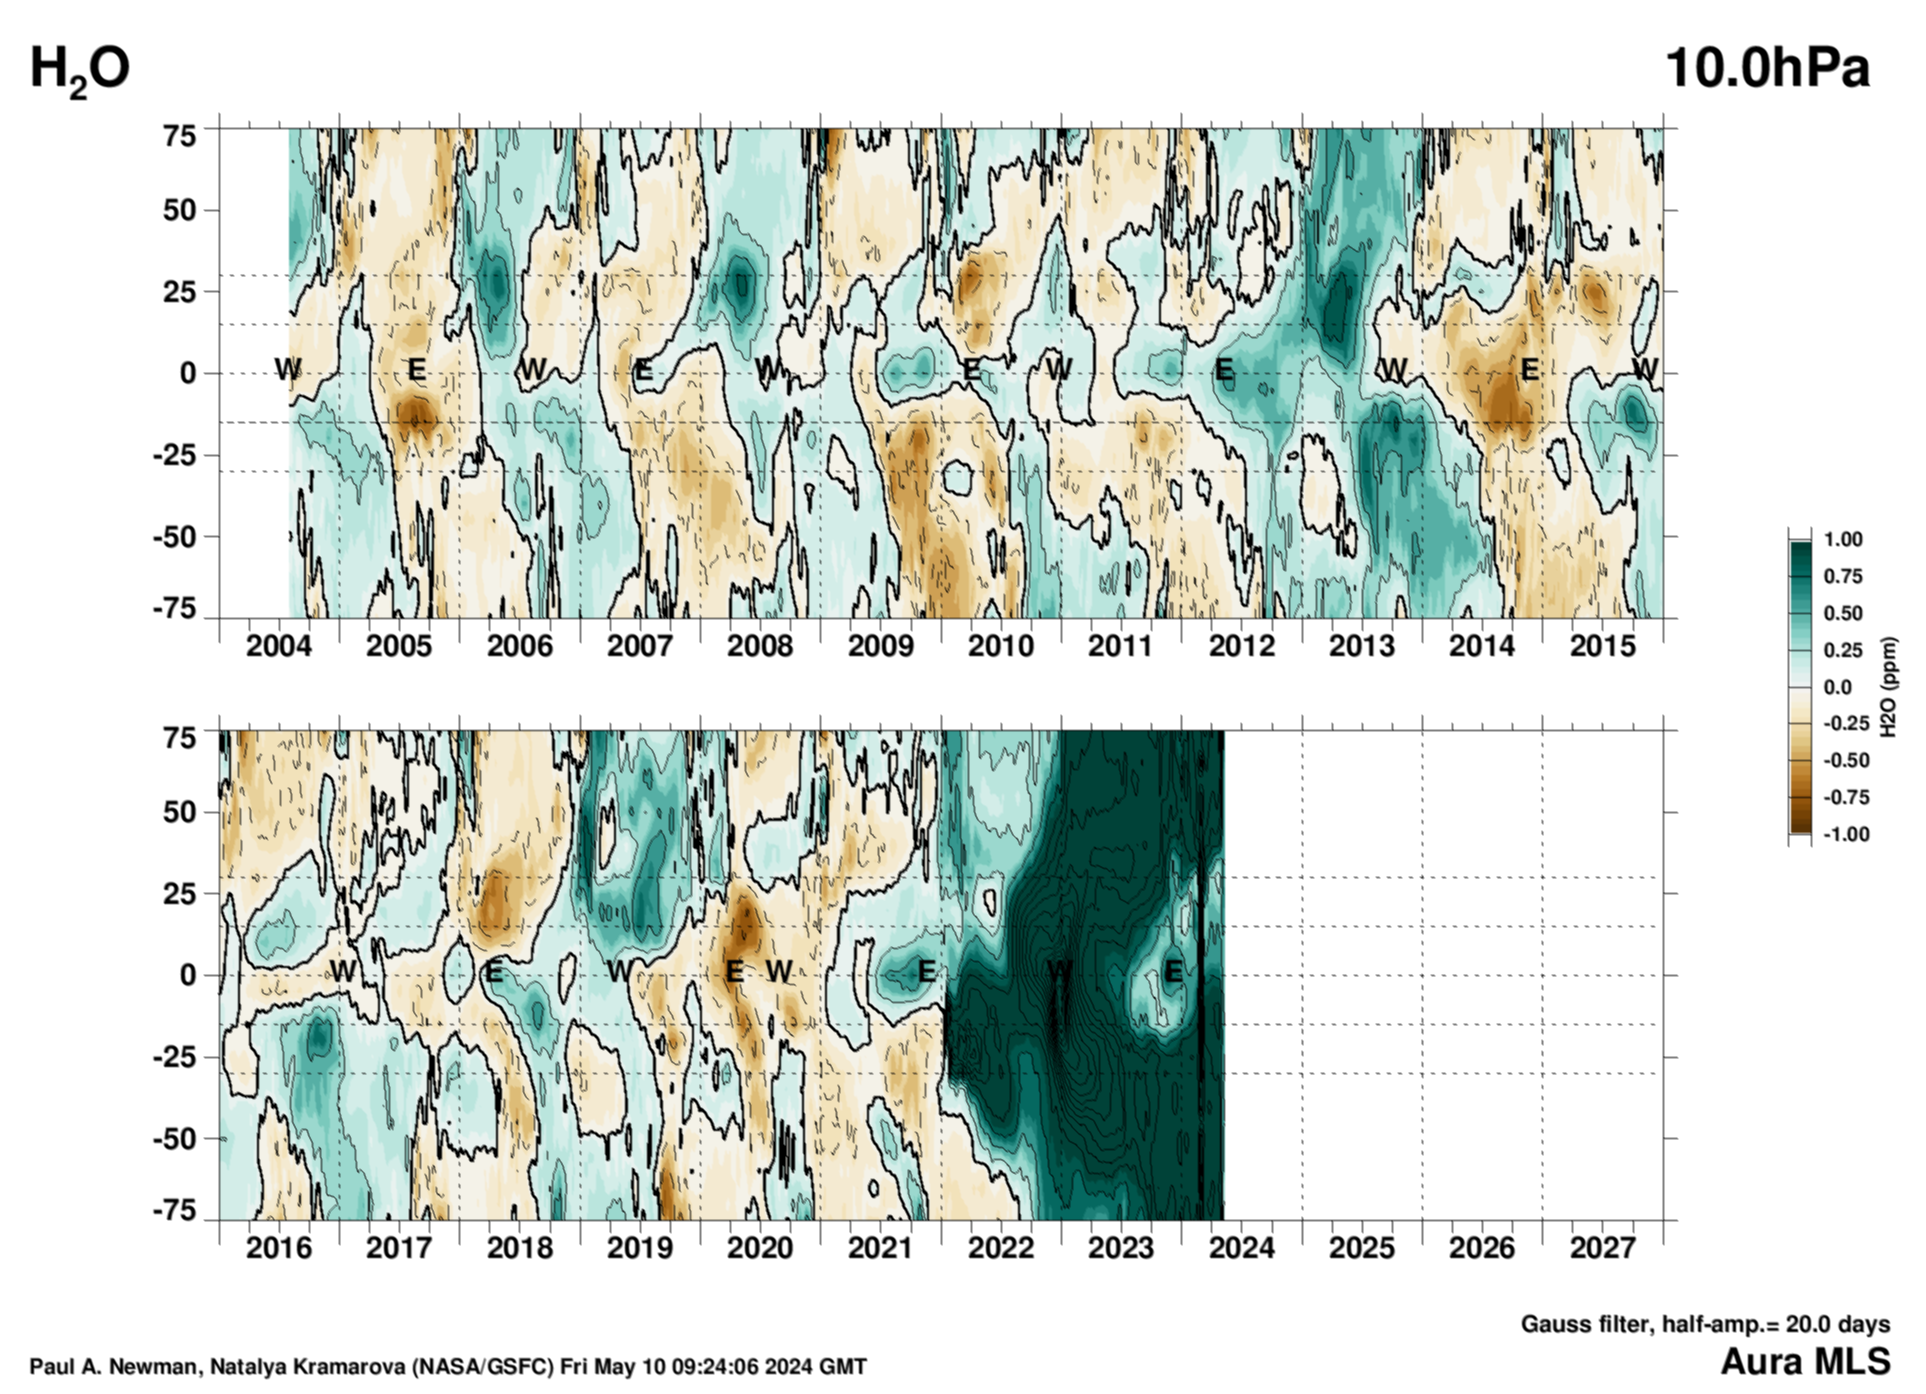
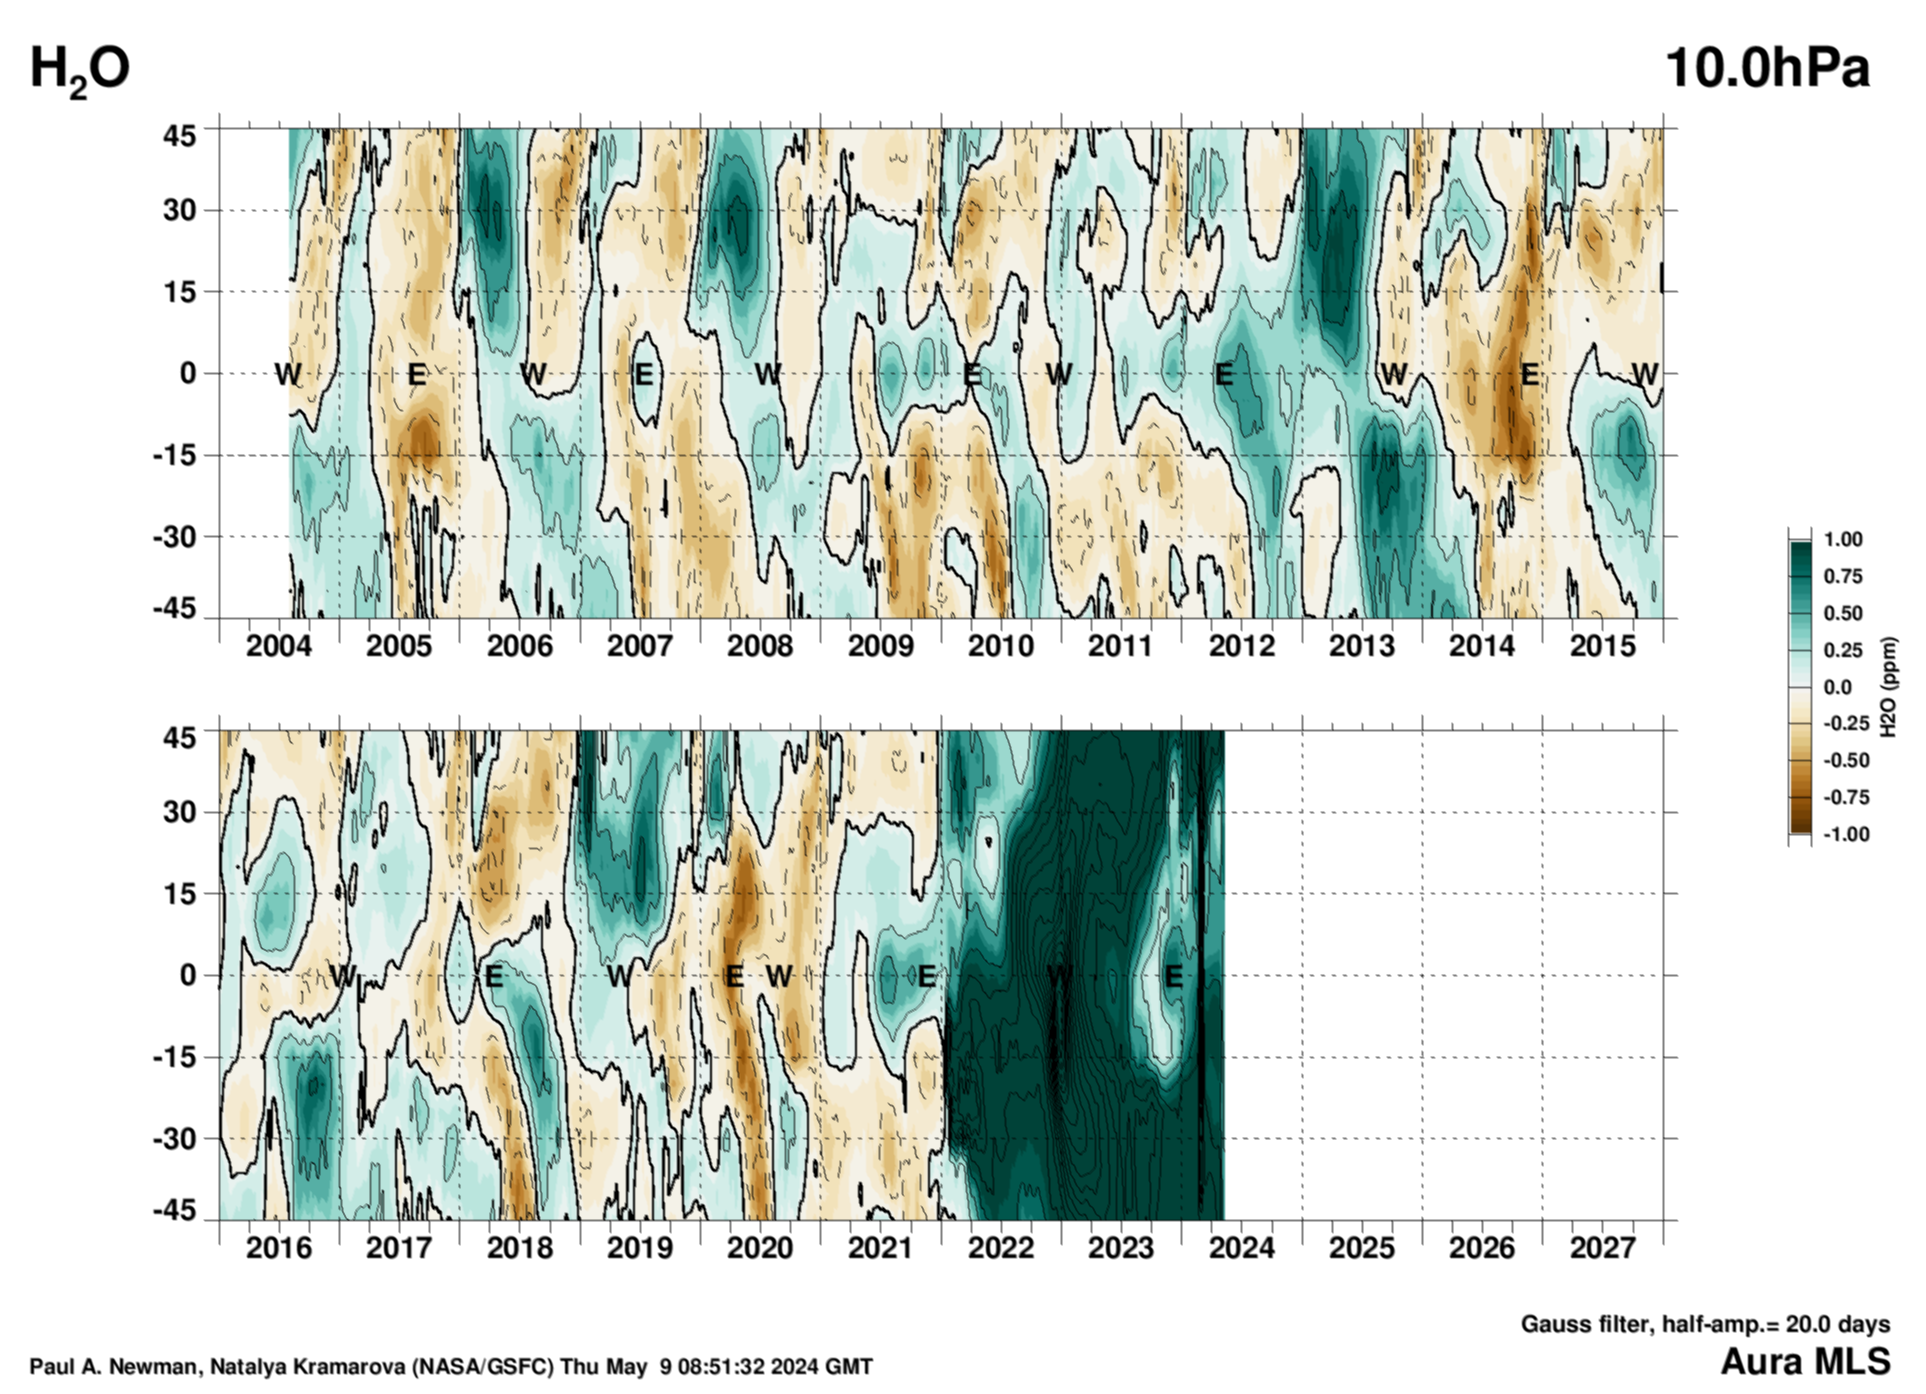
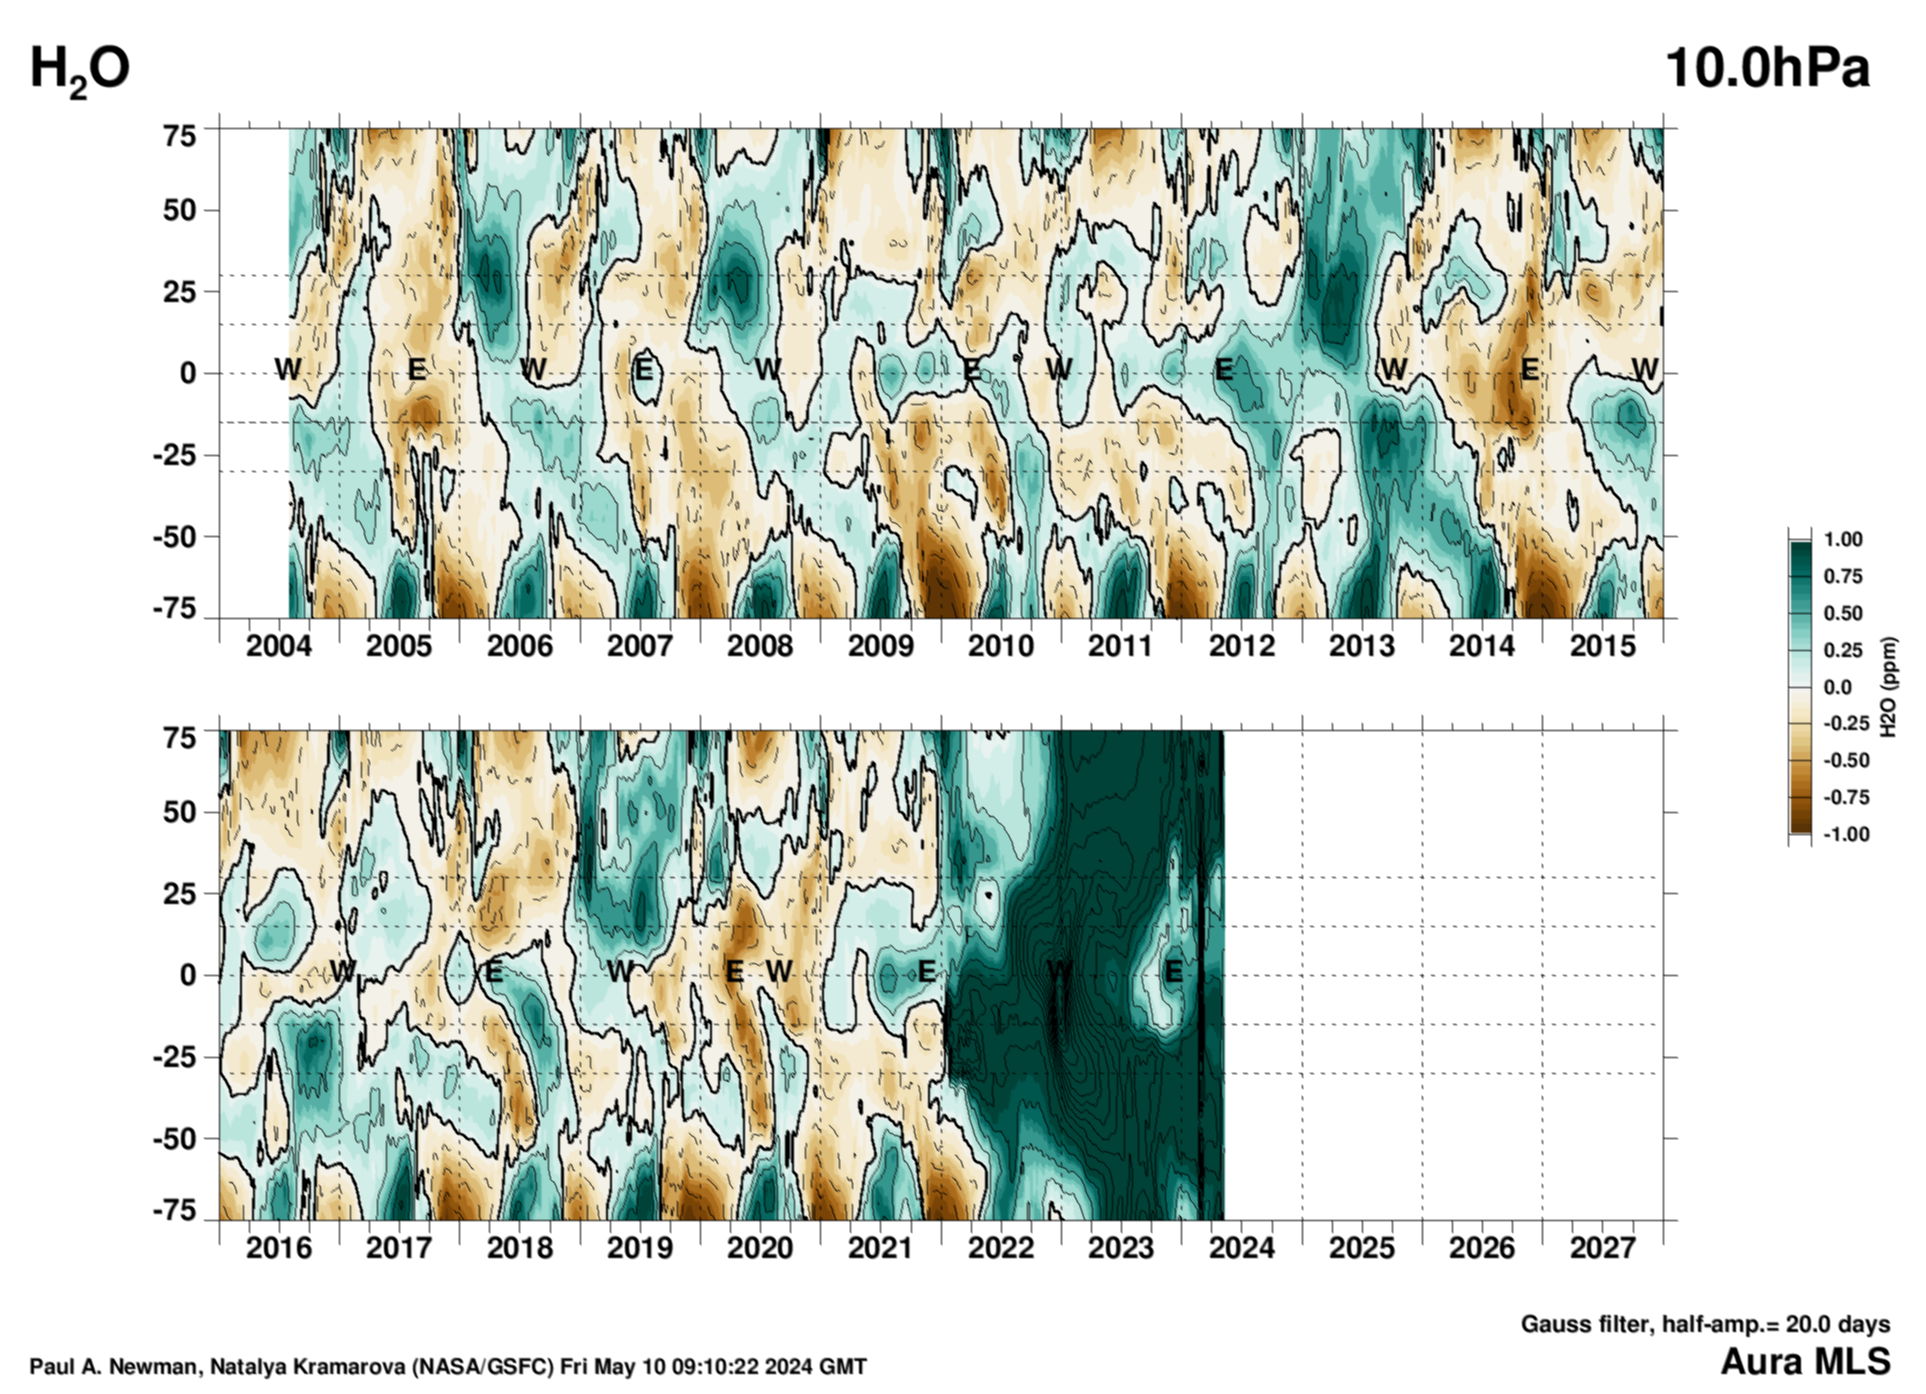
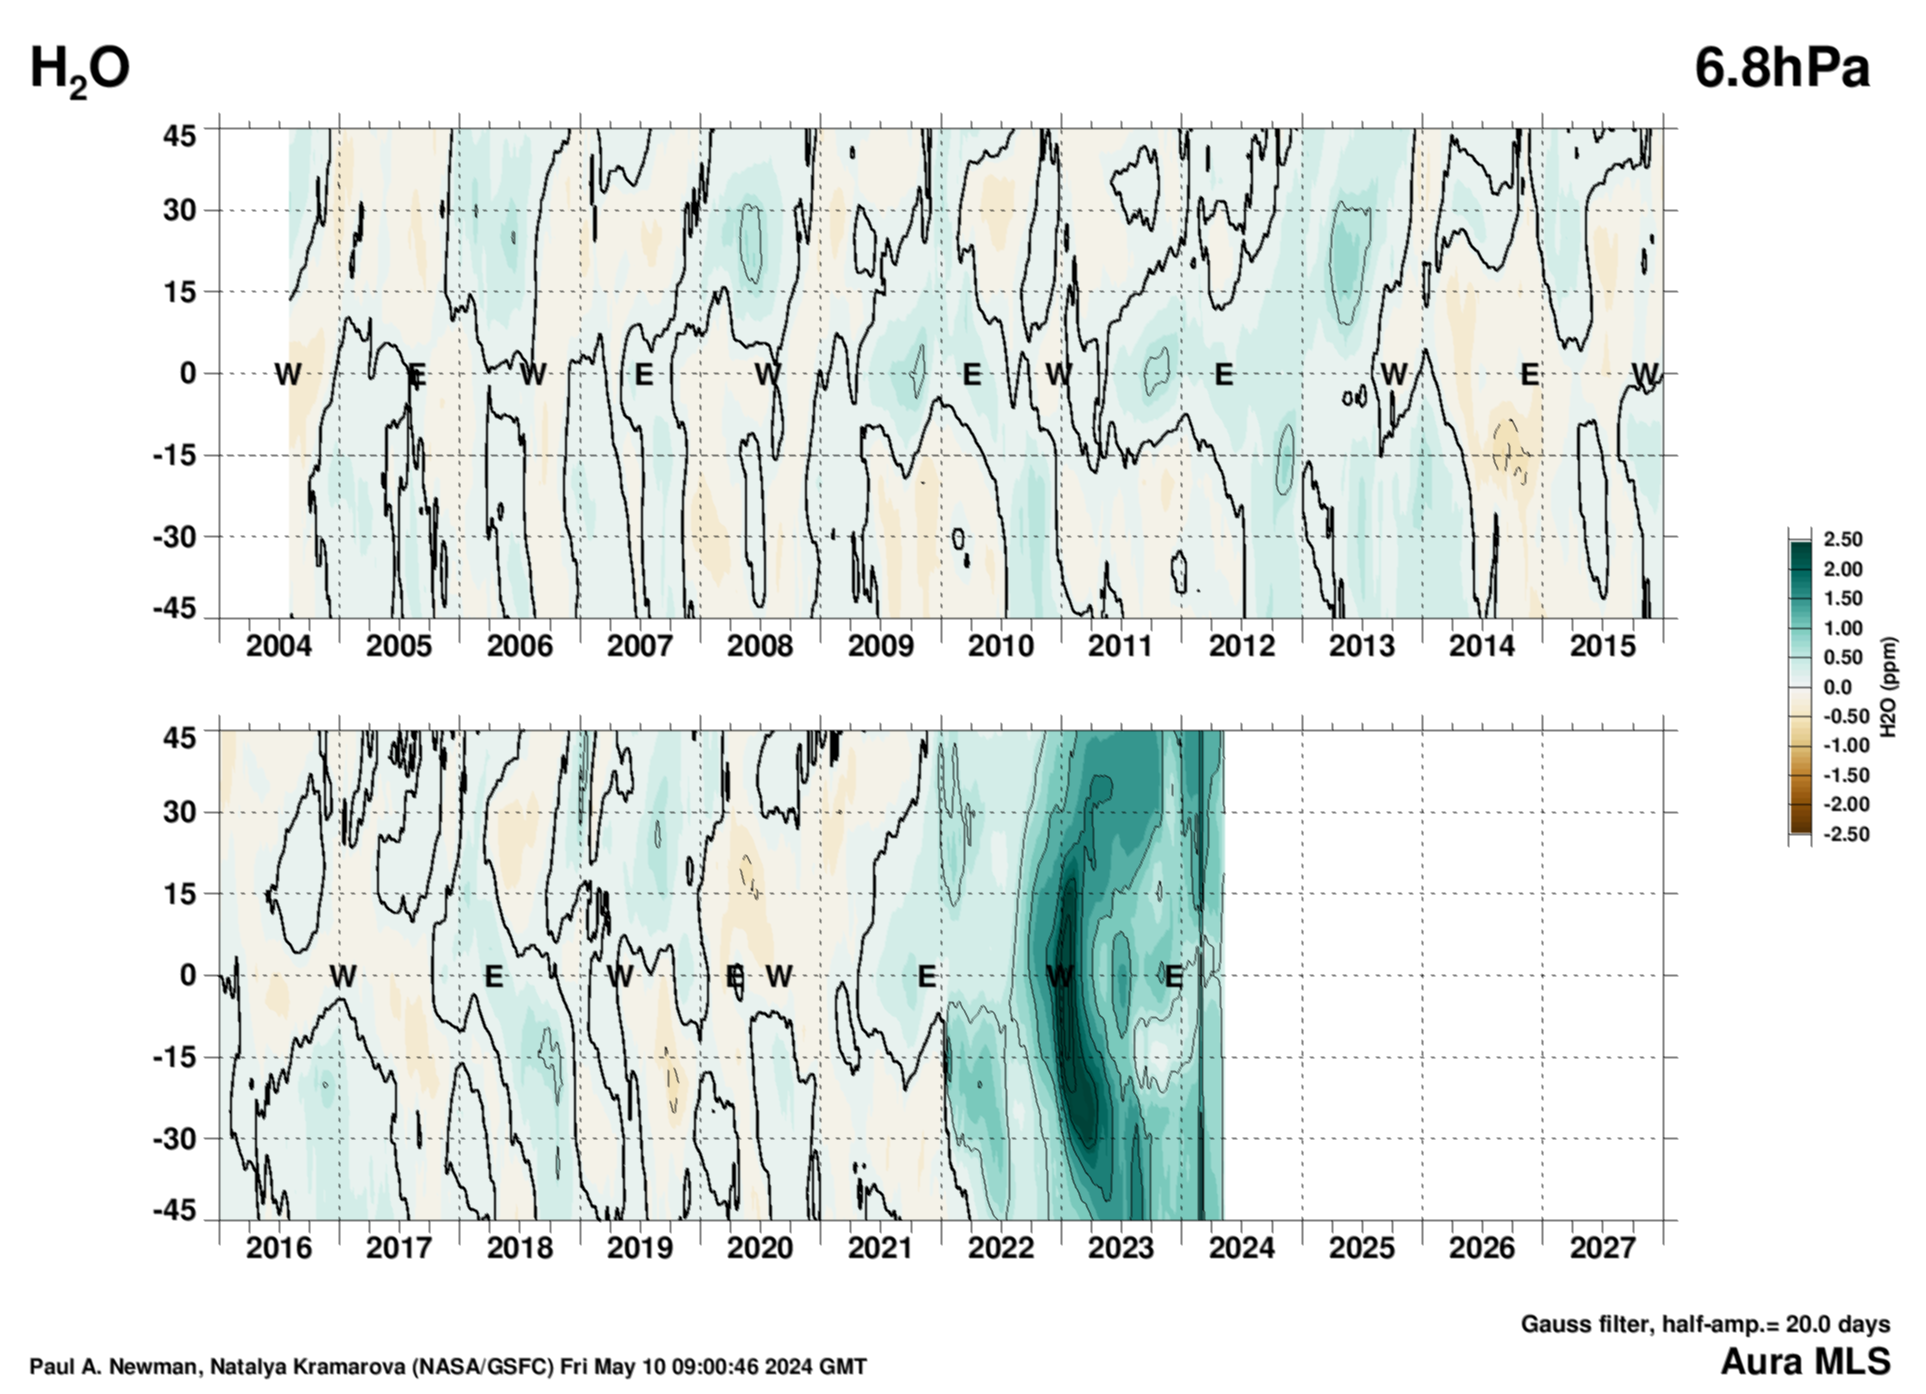
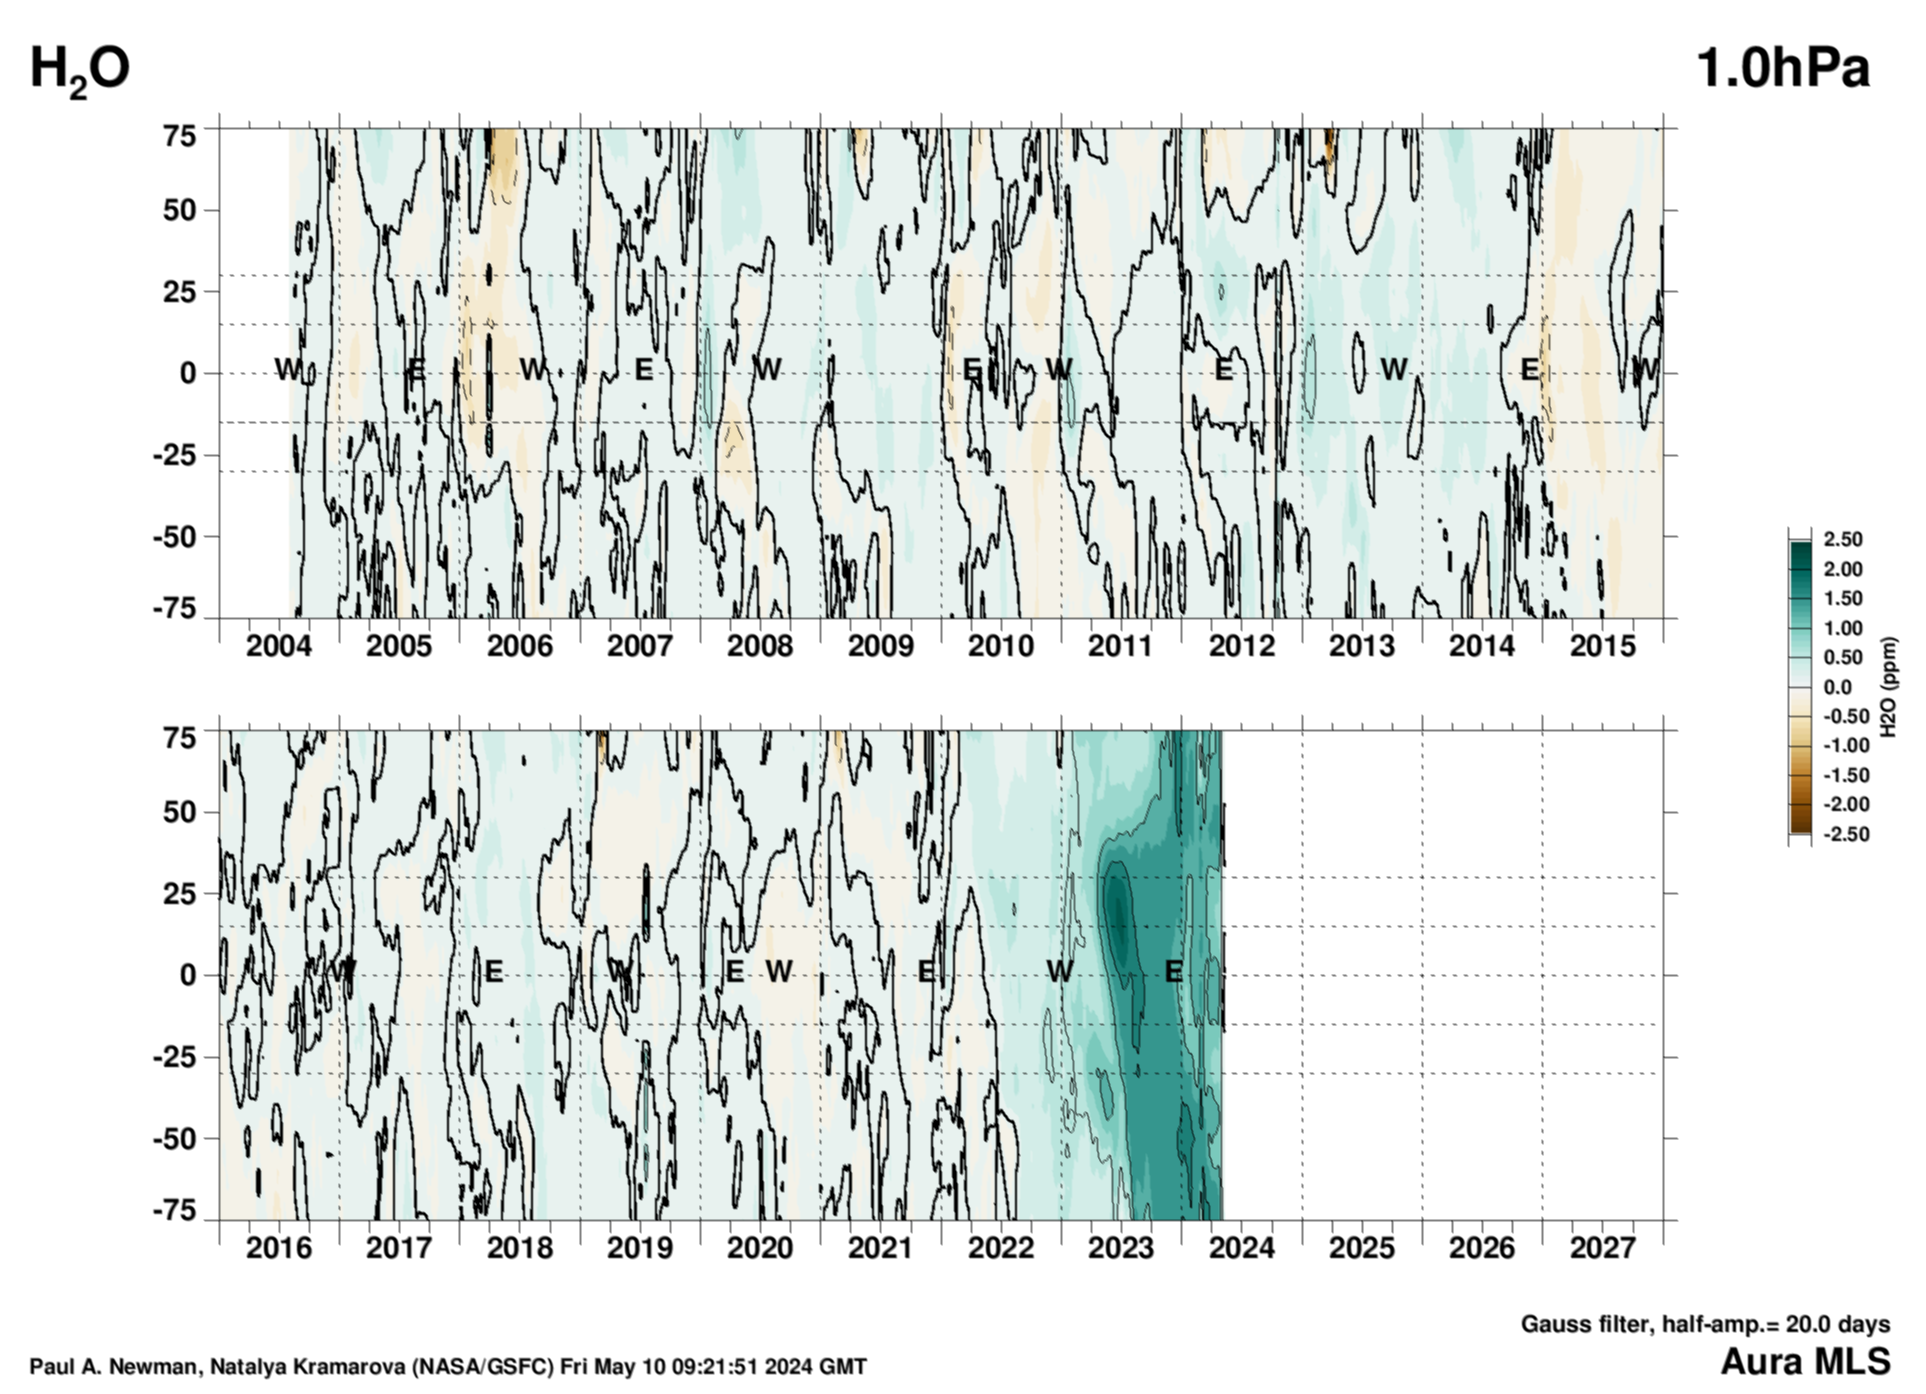
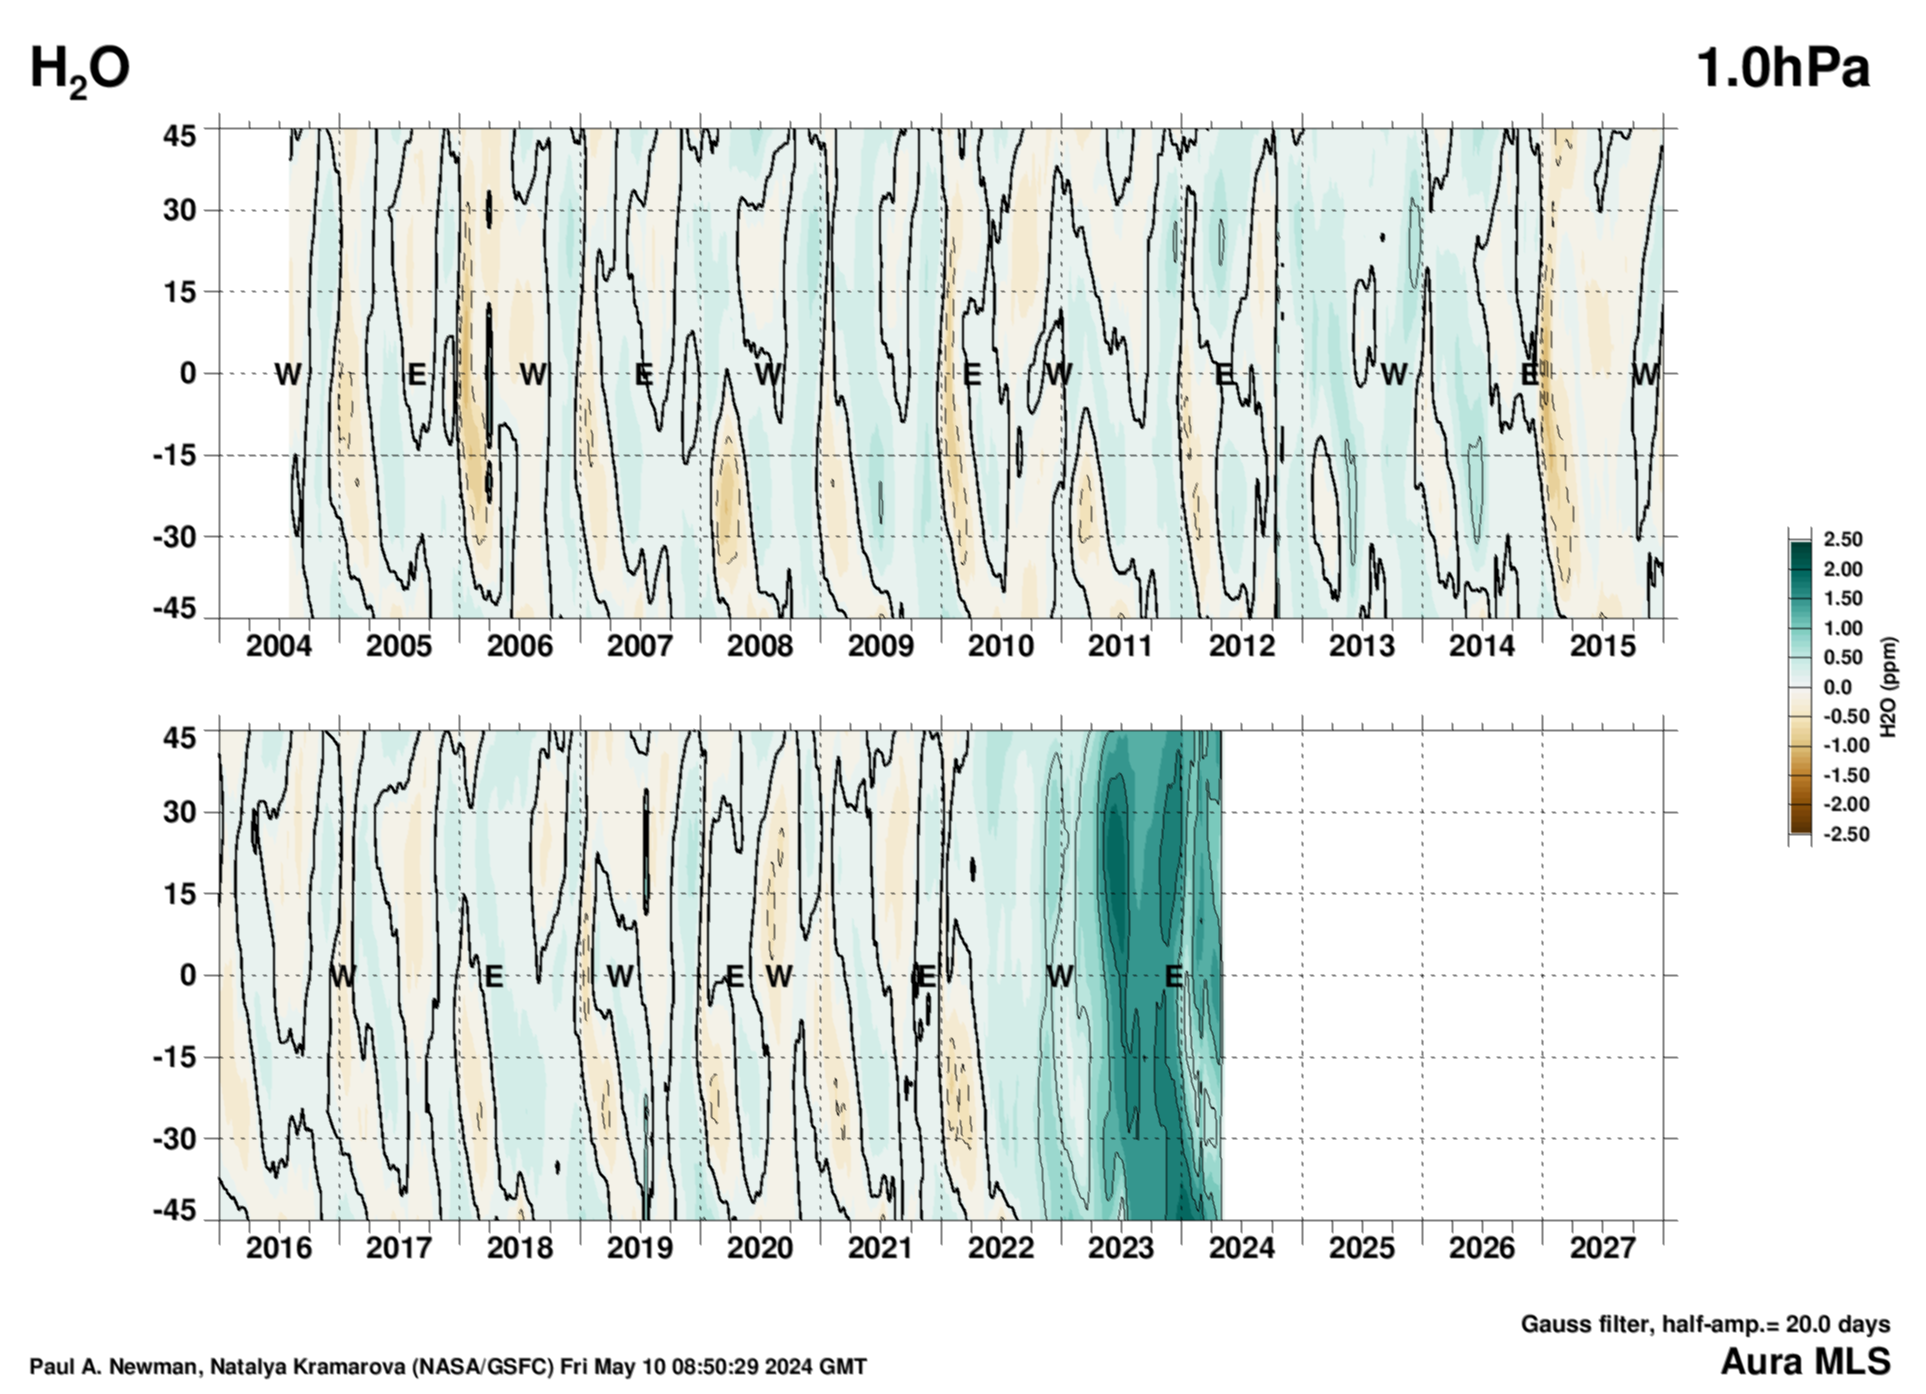
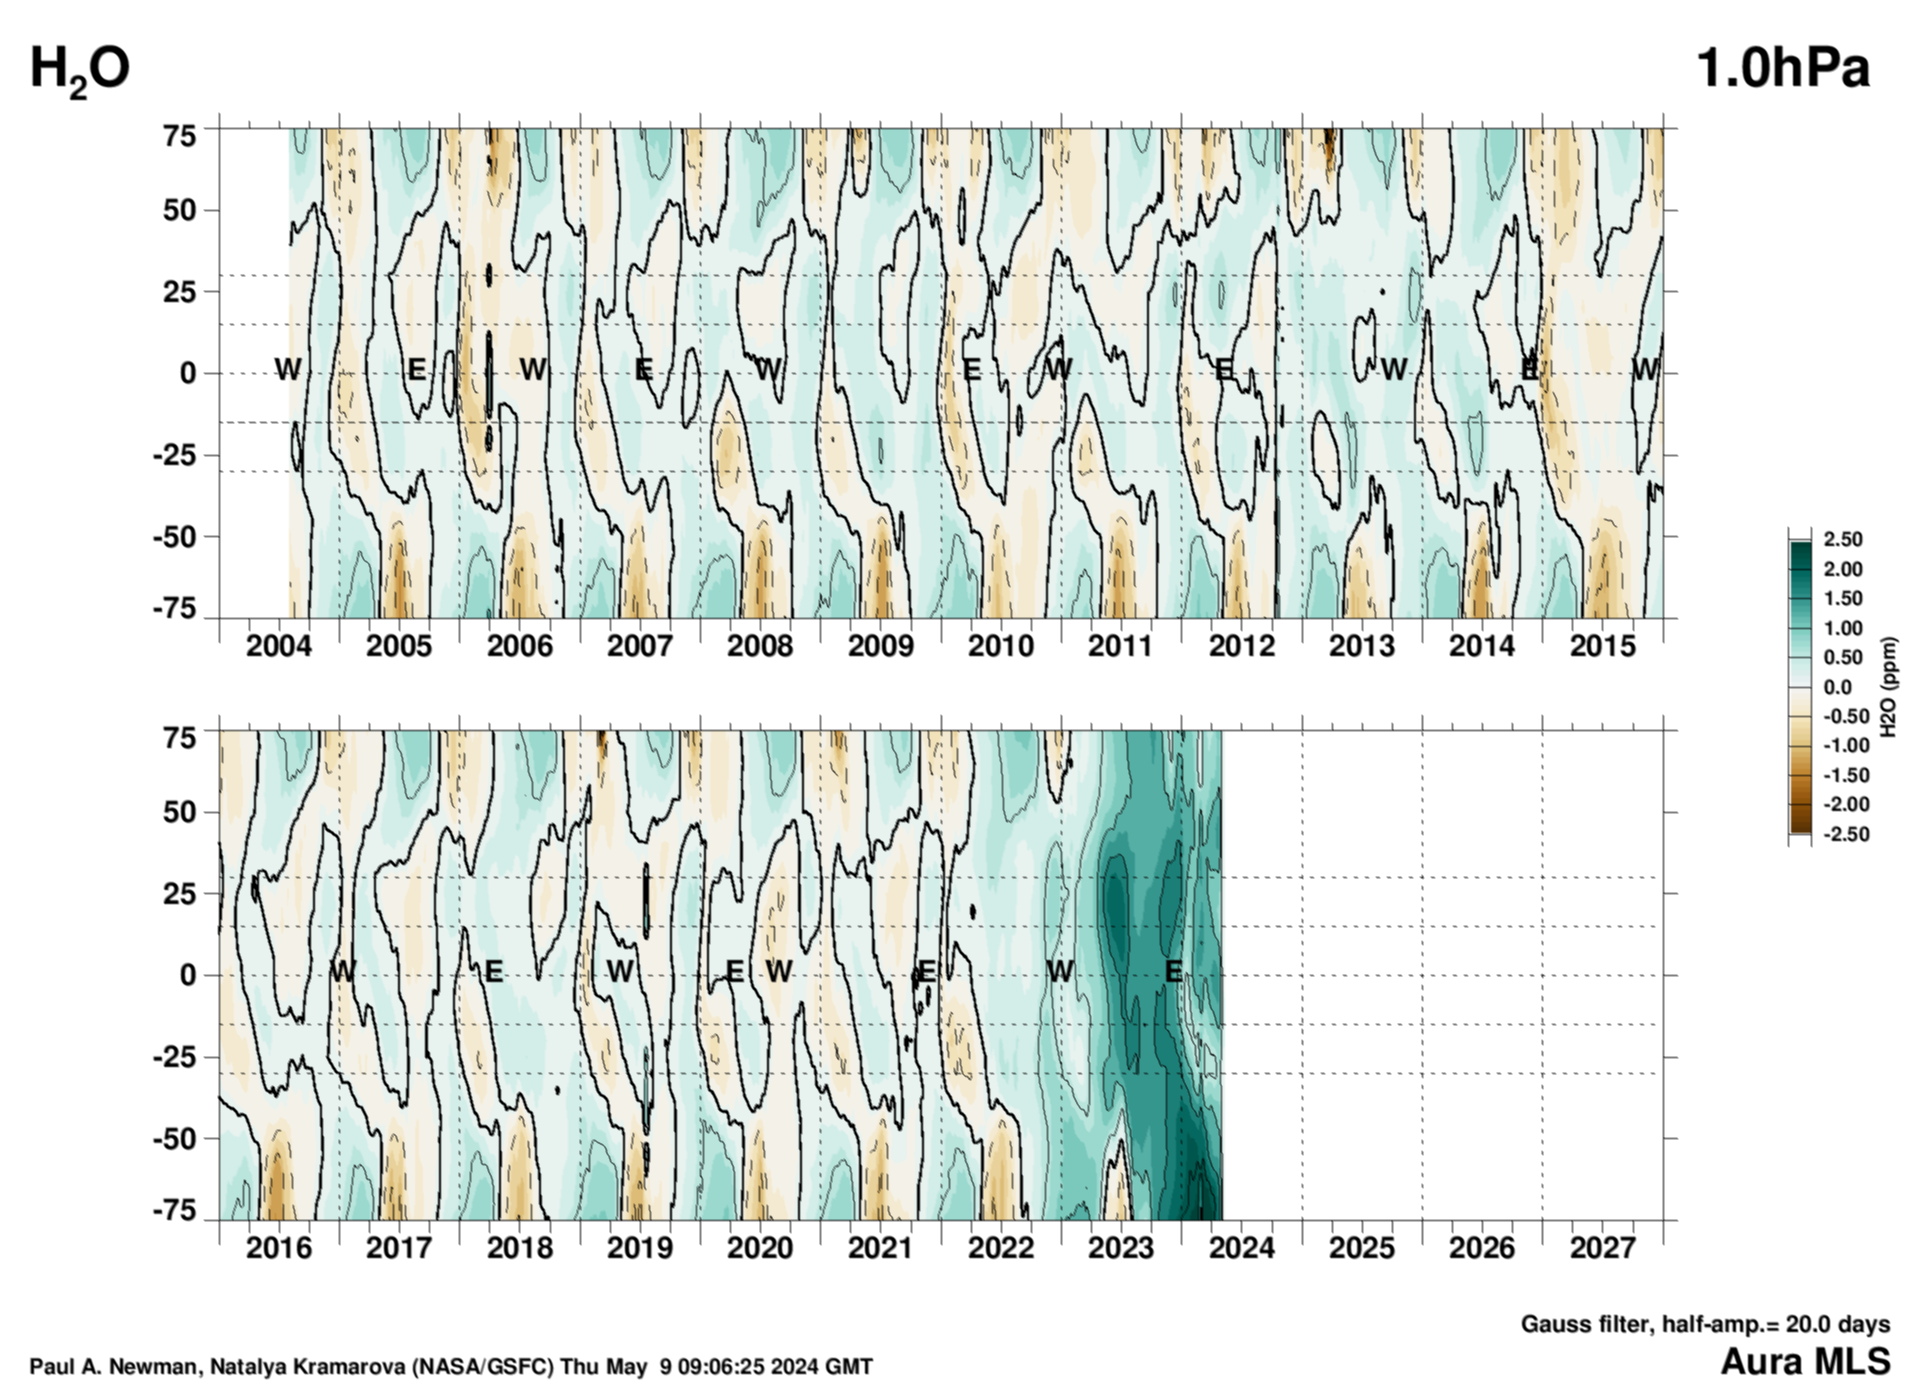
Water at 26.1 hPa
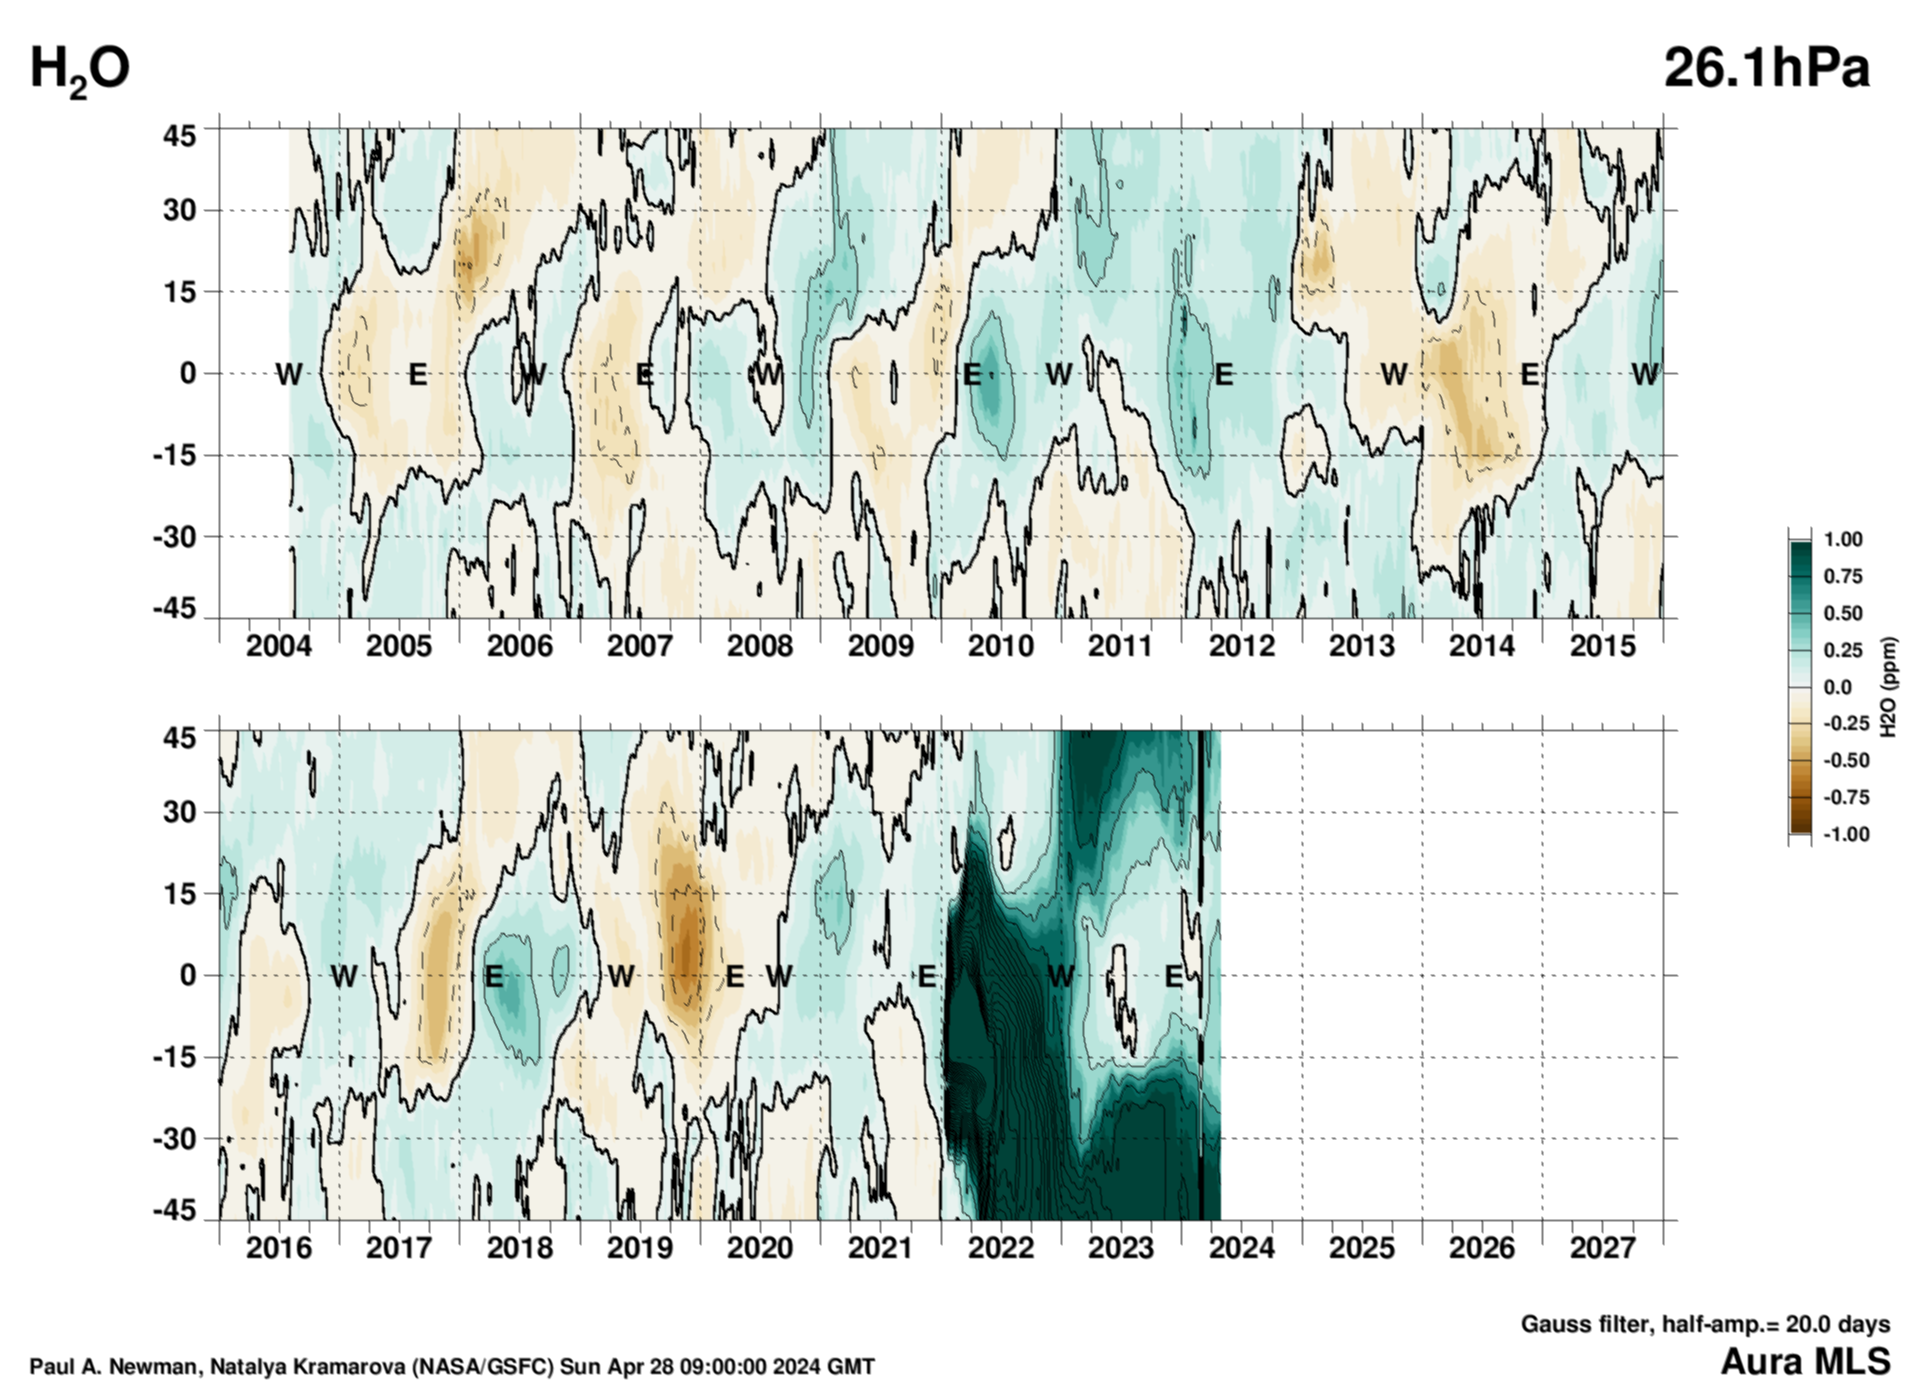
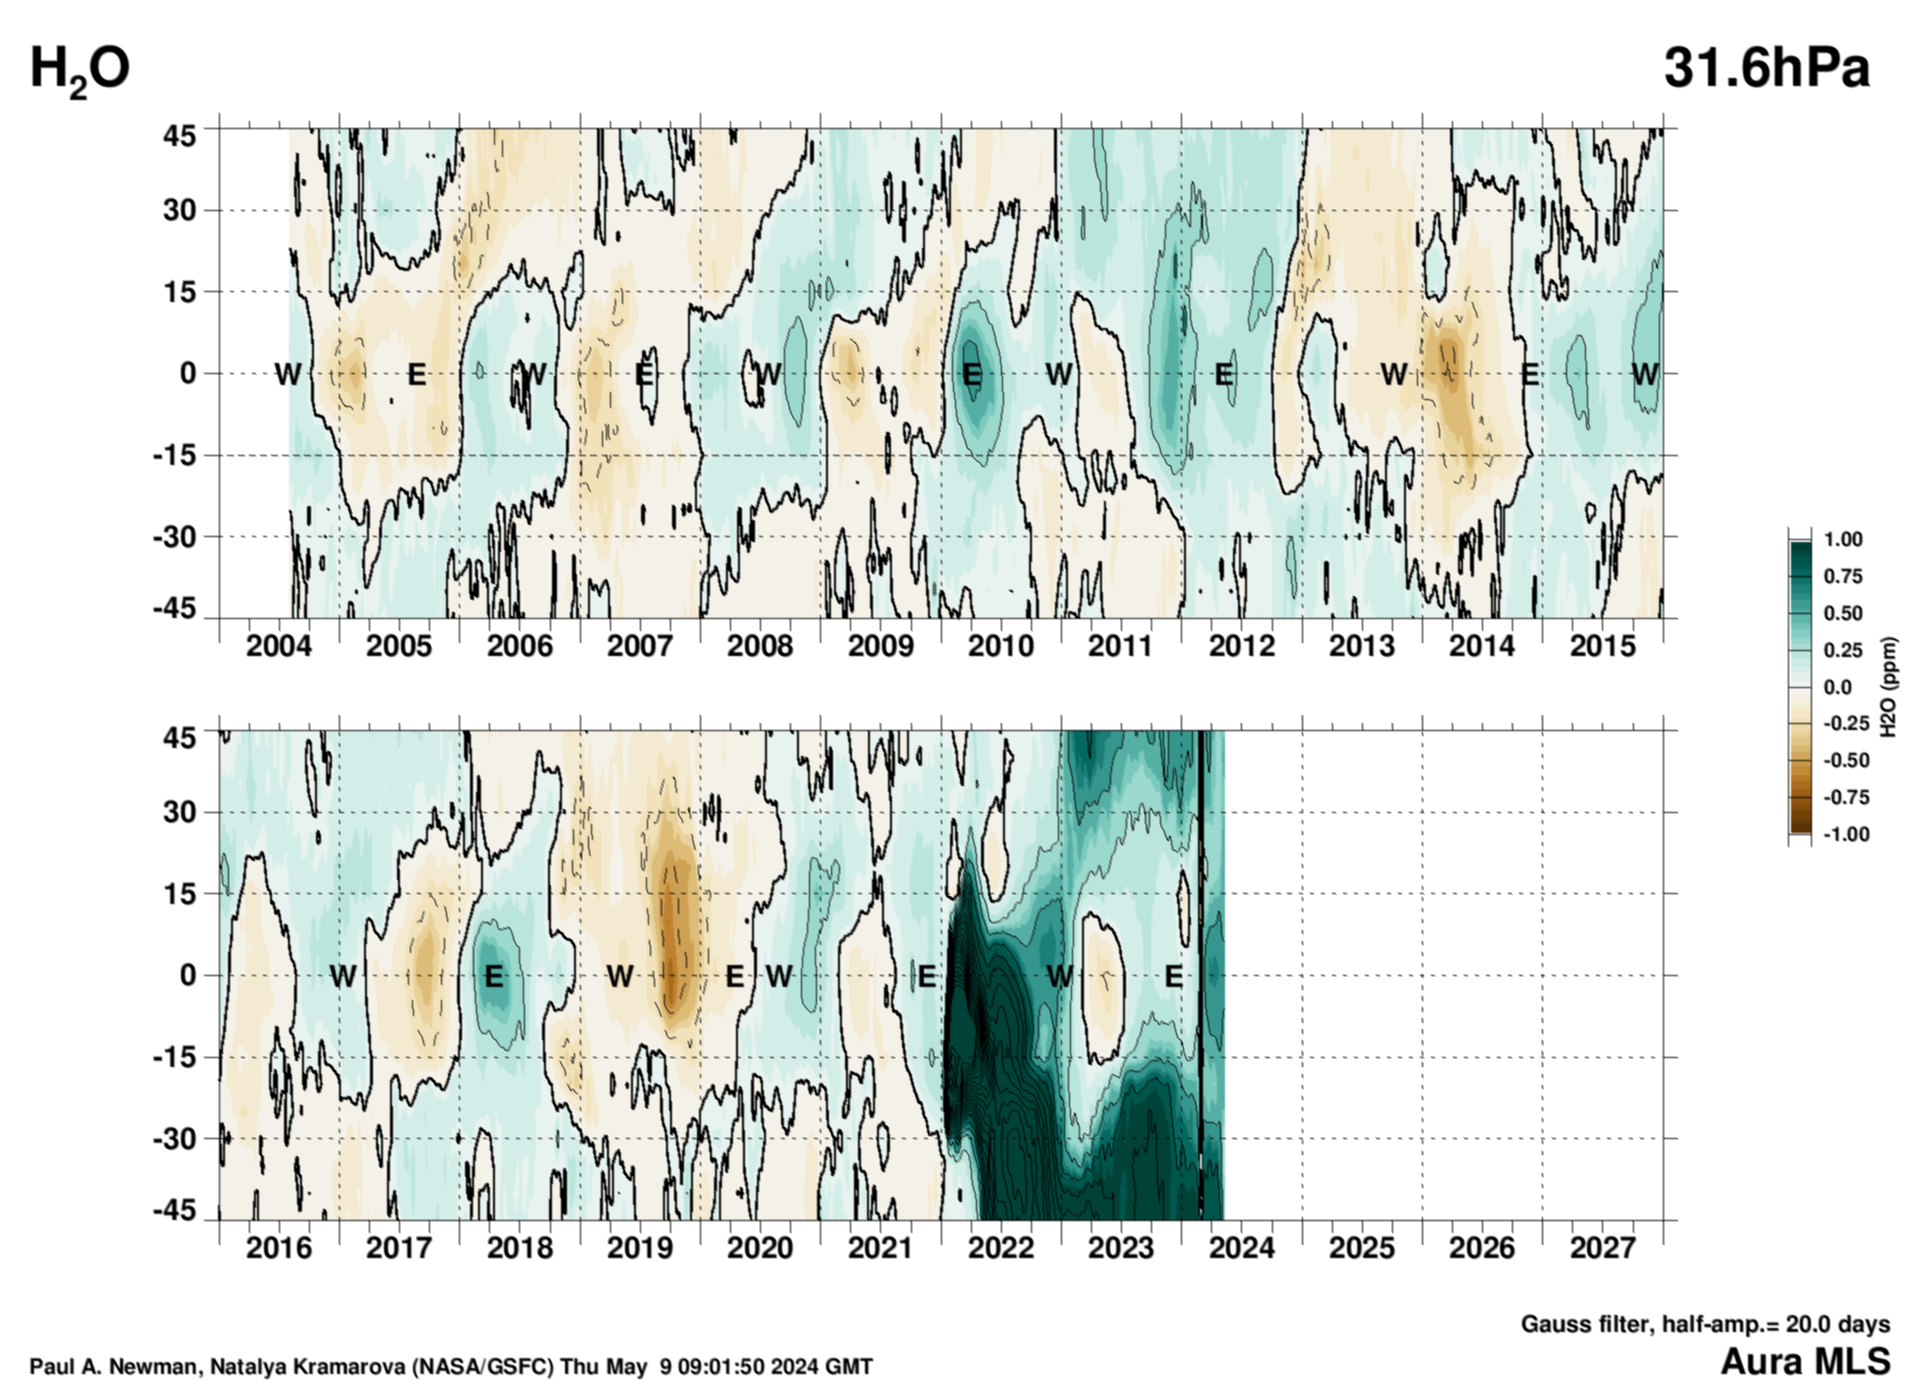
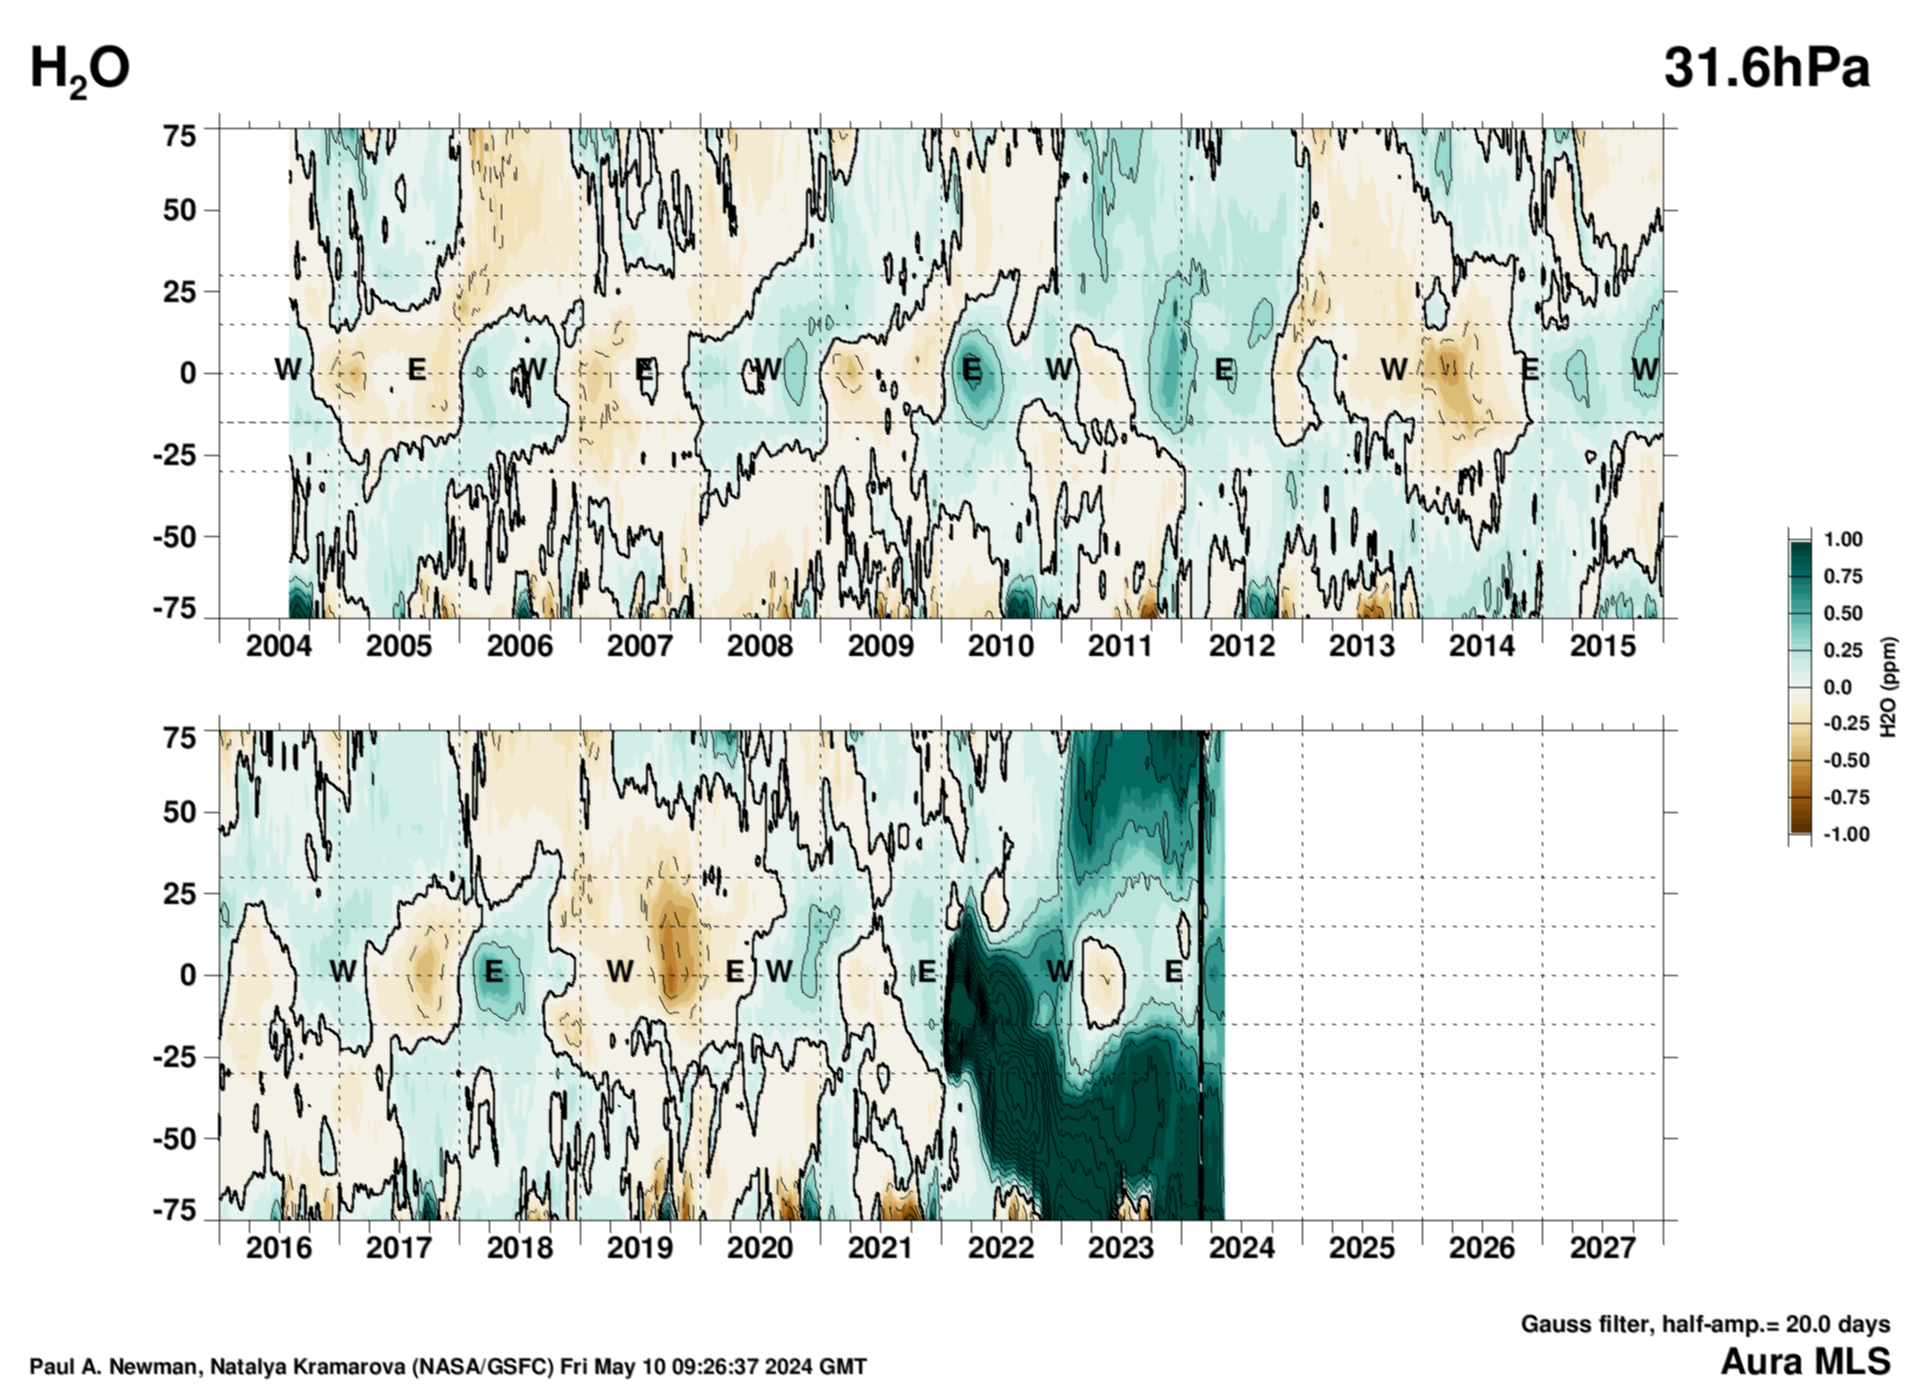
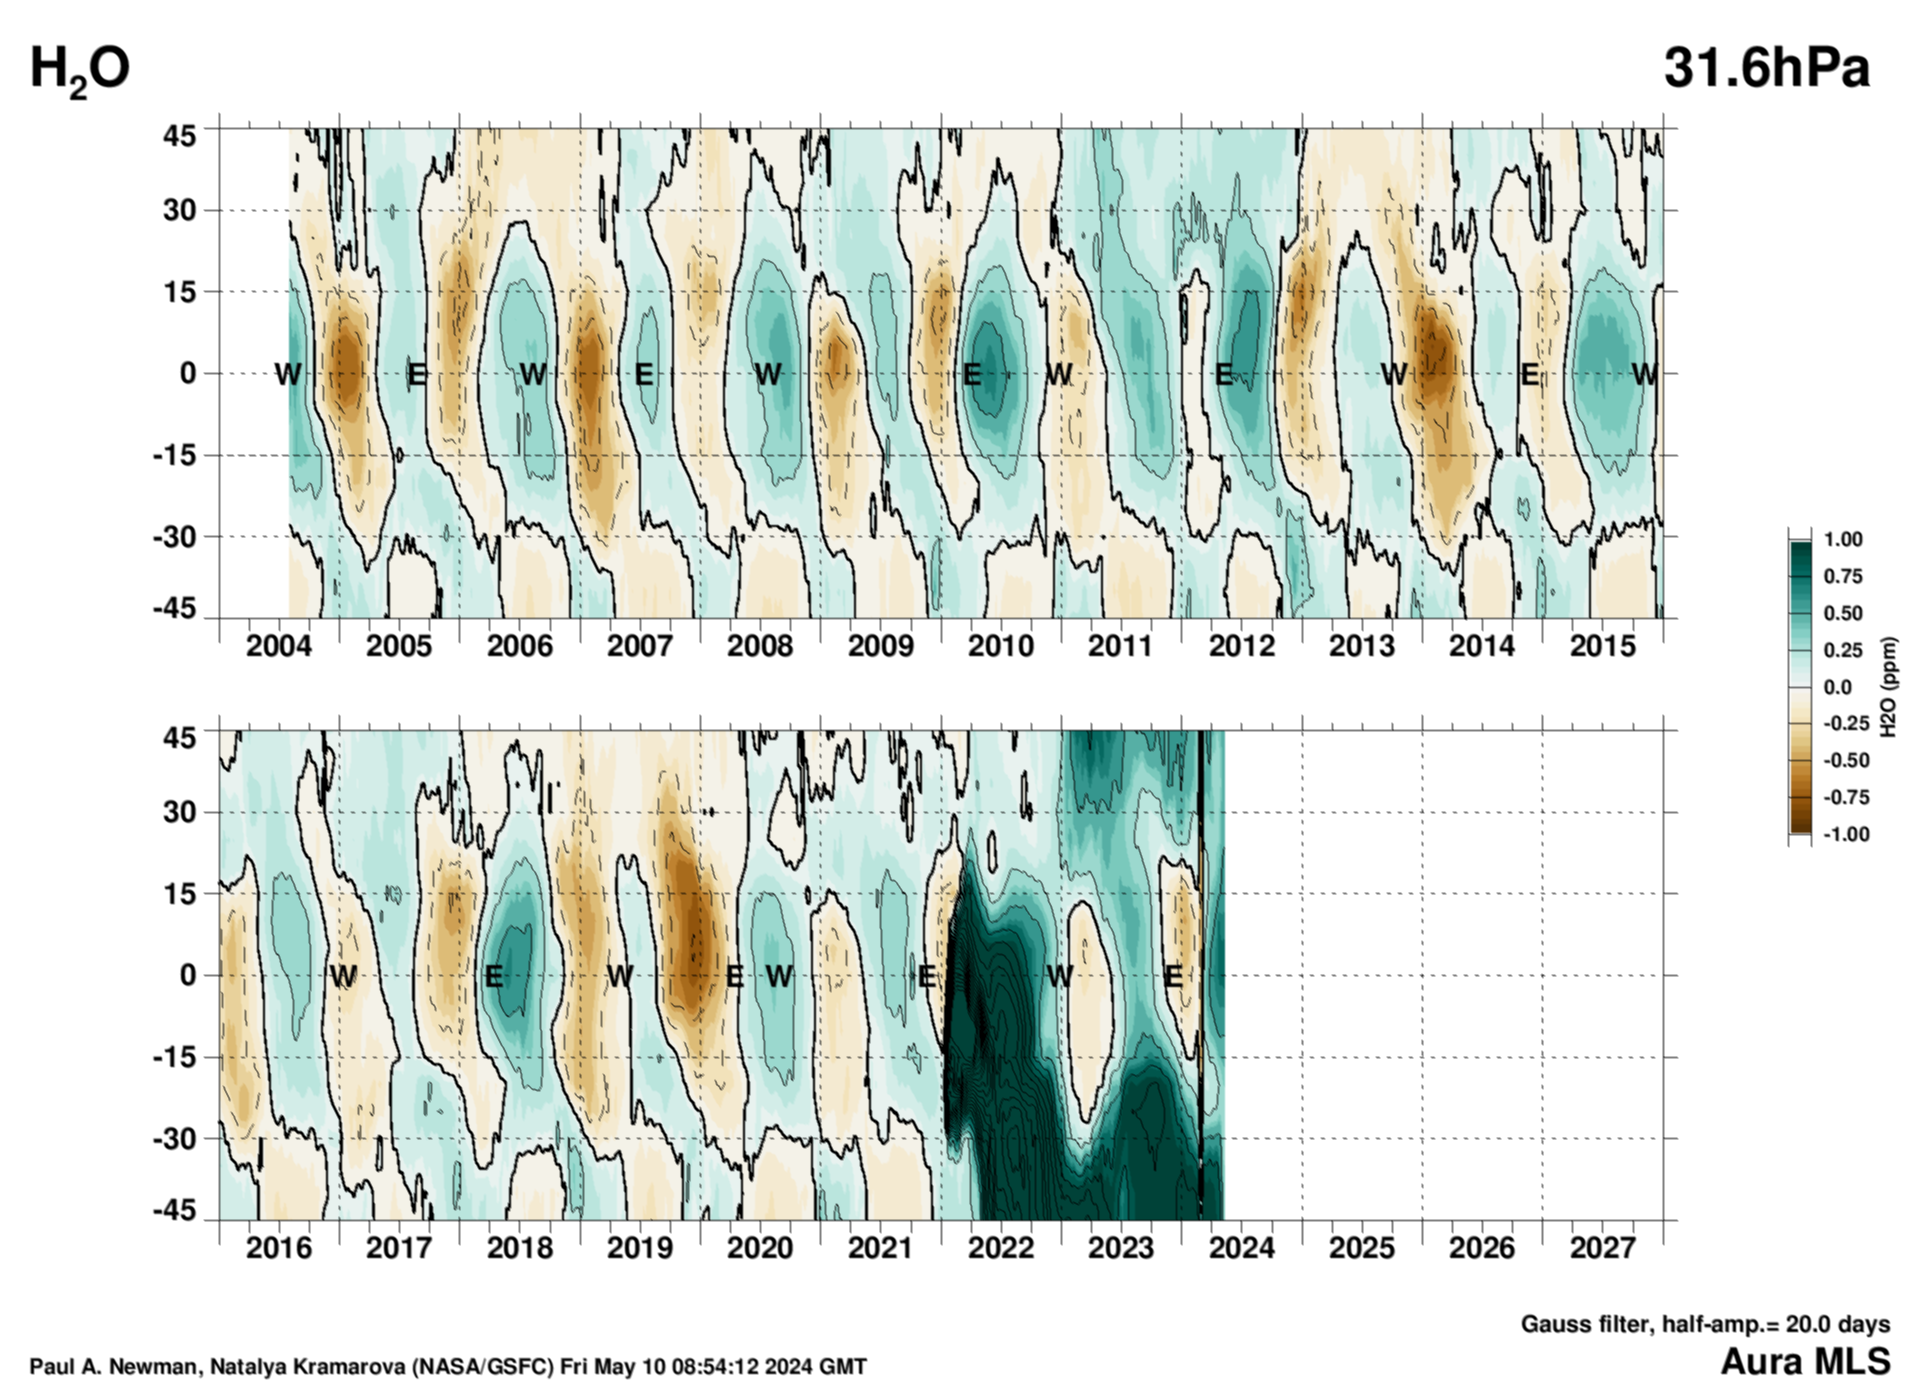
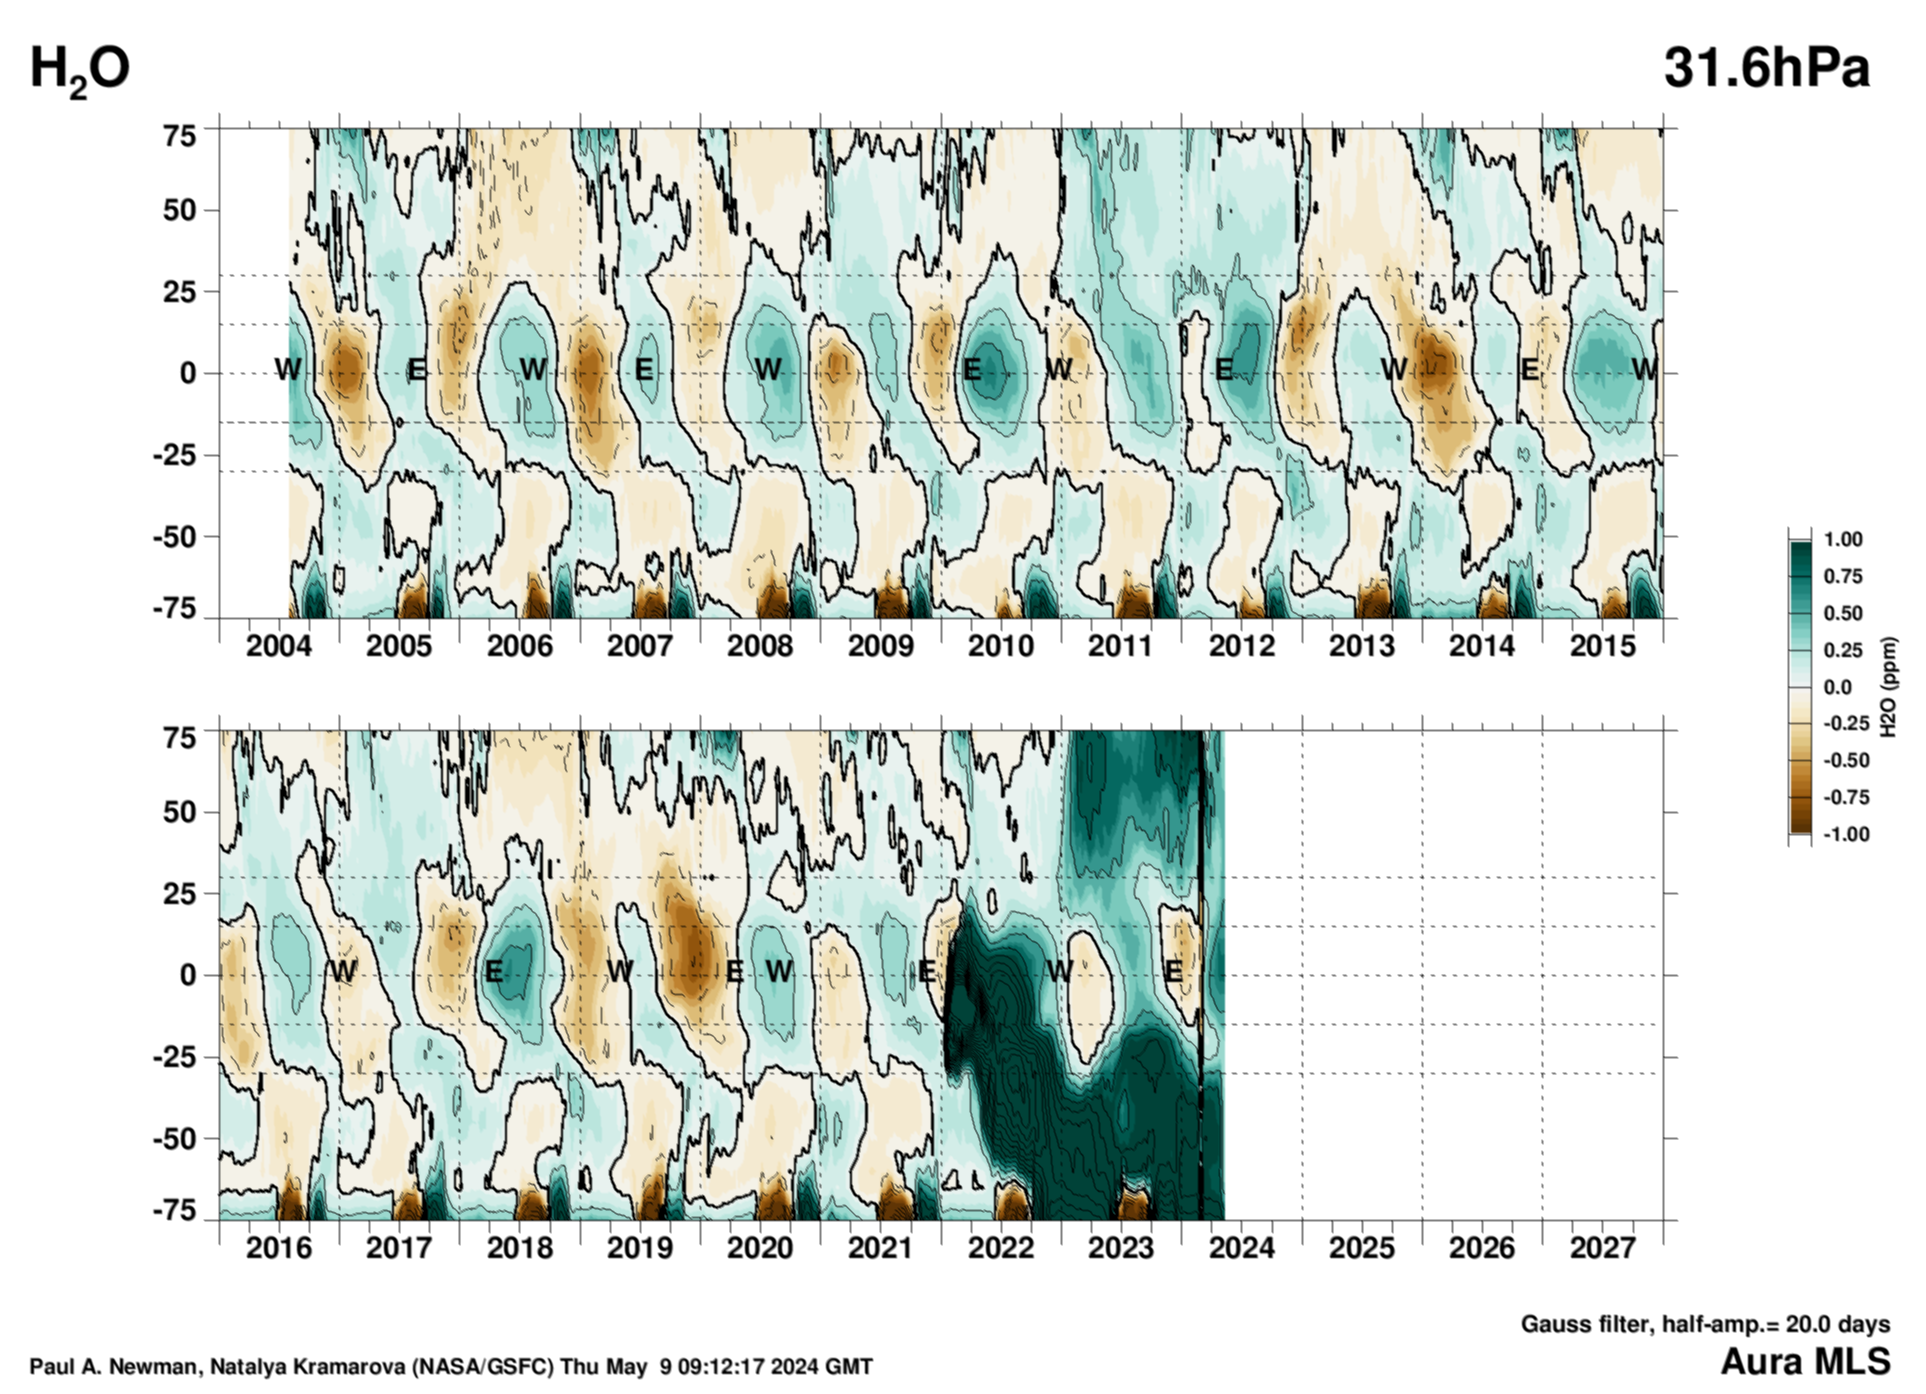
Water zonal mean latitudinal profile versus time. The data are binned into 5 degree boxes from 45S to 45N. The easterly (E) and westerly points are as shown in the Singapore zonal winds, and are derived (see text with EOF figure) from the EOF-1 and EOF-2 phase diagram above. Units are parts per million (ppmv). Units are parts per million (ppm).
| Without Annual Cycle | With Annual Cycle | |||||||
|---|---|---|---|---|---|---|---|---|
| Lat | 45S-45N | 75S-75N | 45S-45N | 75S-75N | ||||
| P (hPa) | PNG | PNG | PNG | PNG | ||||
| 146 | x | x | x | x | x | x | x | x |
| 121 | x | x | x | x | x | x | x | x |
| 100 | x | x | x | x | x | x | x | x |
| 82 | x | x | x | x | x | x | x | x |
| 68 | x | x | x | x | x | x | x | x |
| 56 | x | x | x | x | x | x | x | x |
| 46 | x | x | x | x | x | x | x | x |
| 38 | x | x | x | x | x | x | x | x |
| 31 | x | x | x | x | x | x | x | x |
| 26 | x | x | x | x | x | x | x | x |
| 17 | x | x | x | x | x | x | x | x |
| 10 | x | x | x | x | x | x | x | x |
| 6 | x | x | x | x | x | x | x | x |
| 3 | x | x | x | x | x | x | x | x |
| 1 | x | x | x | x | x | x | x | x |
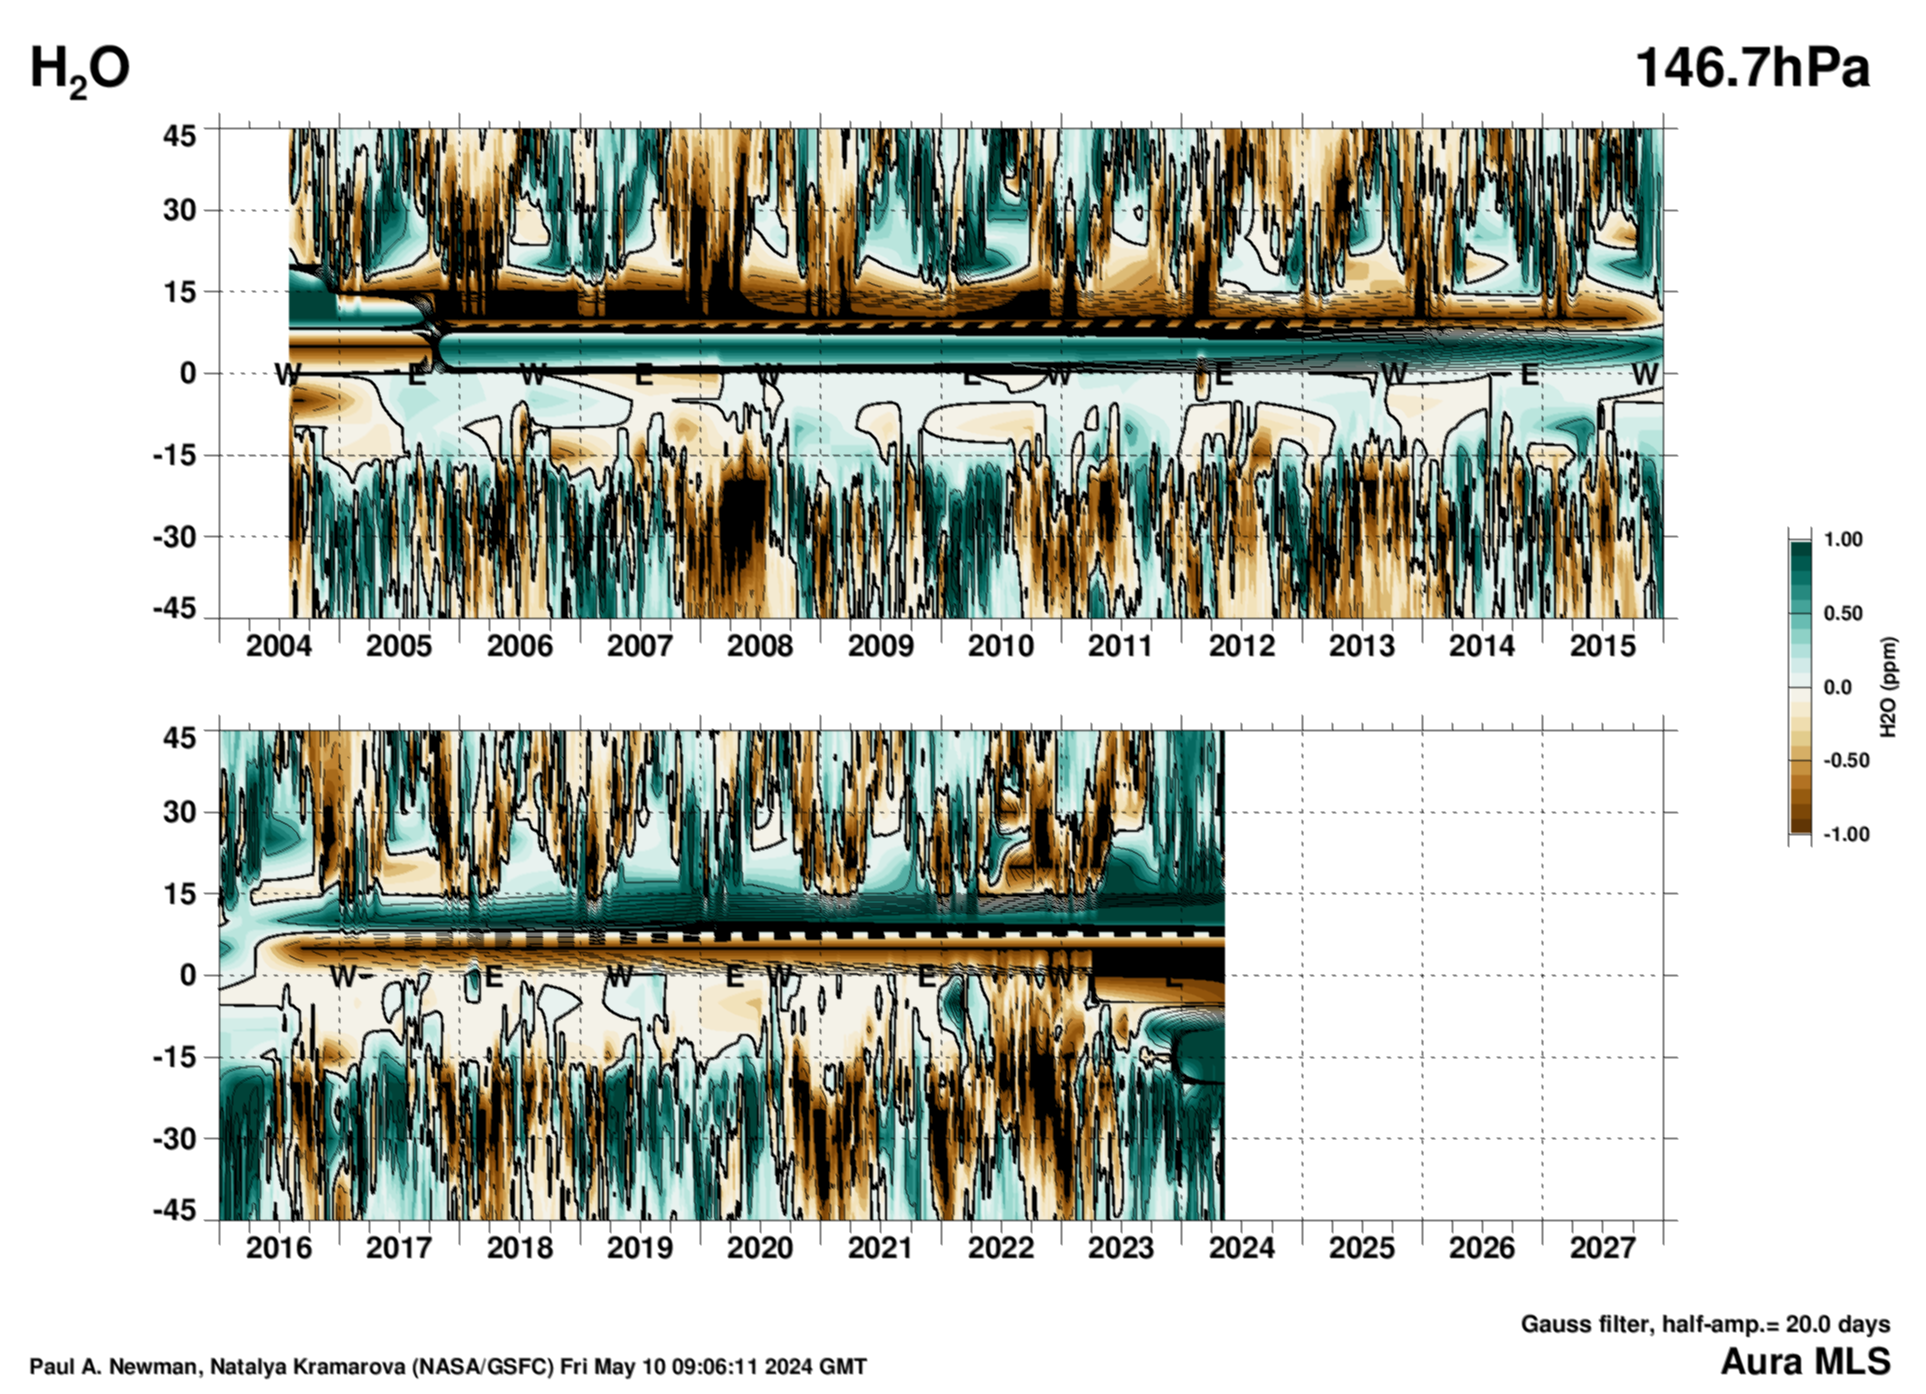
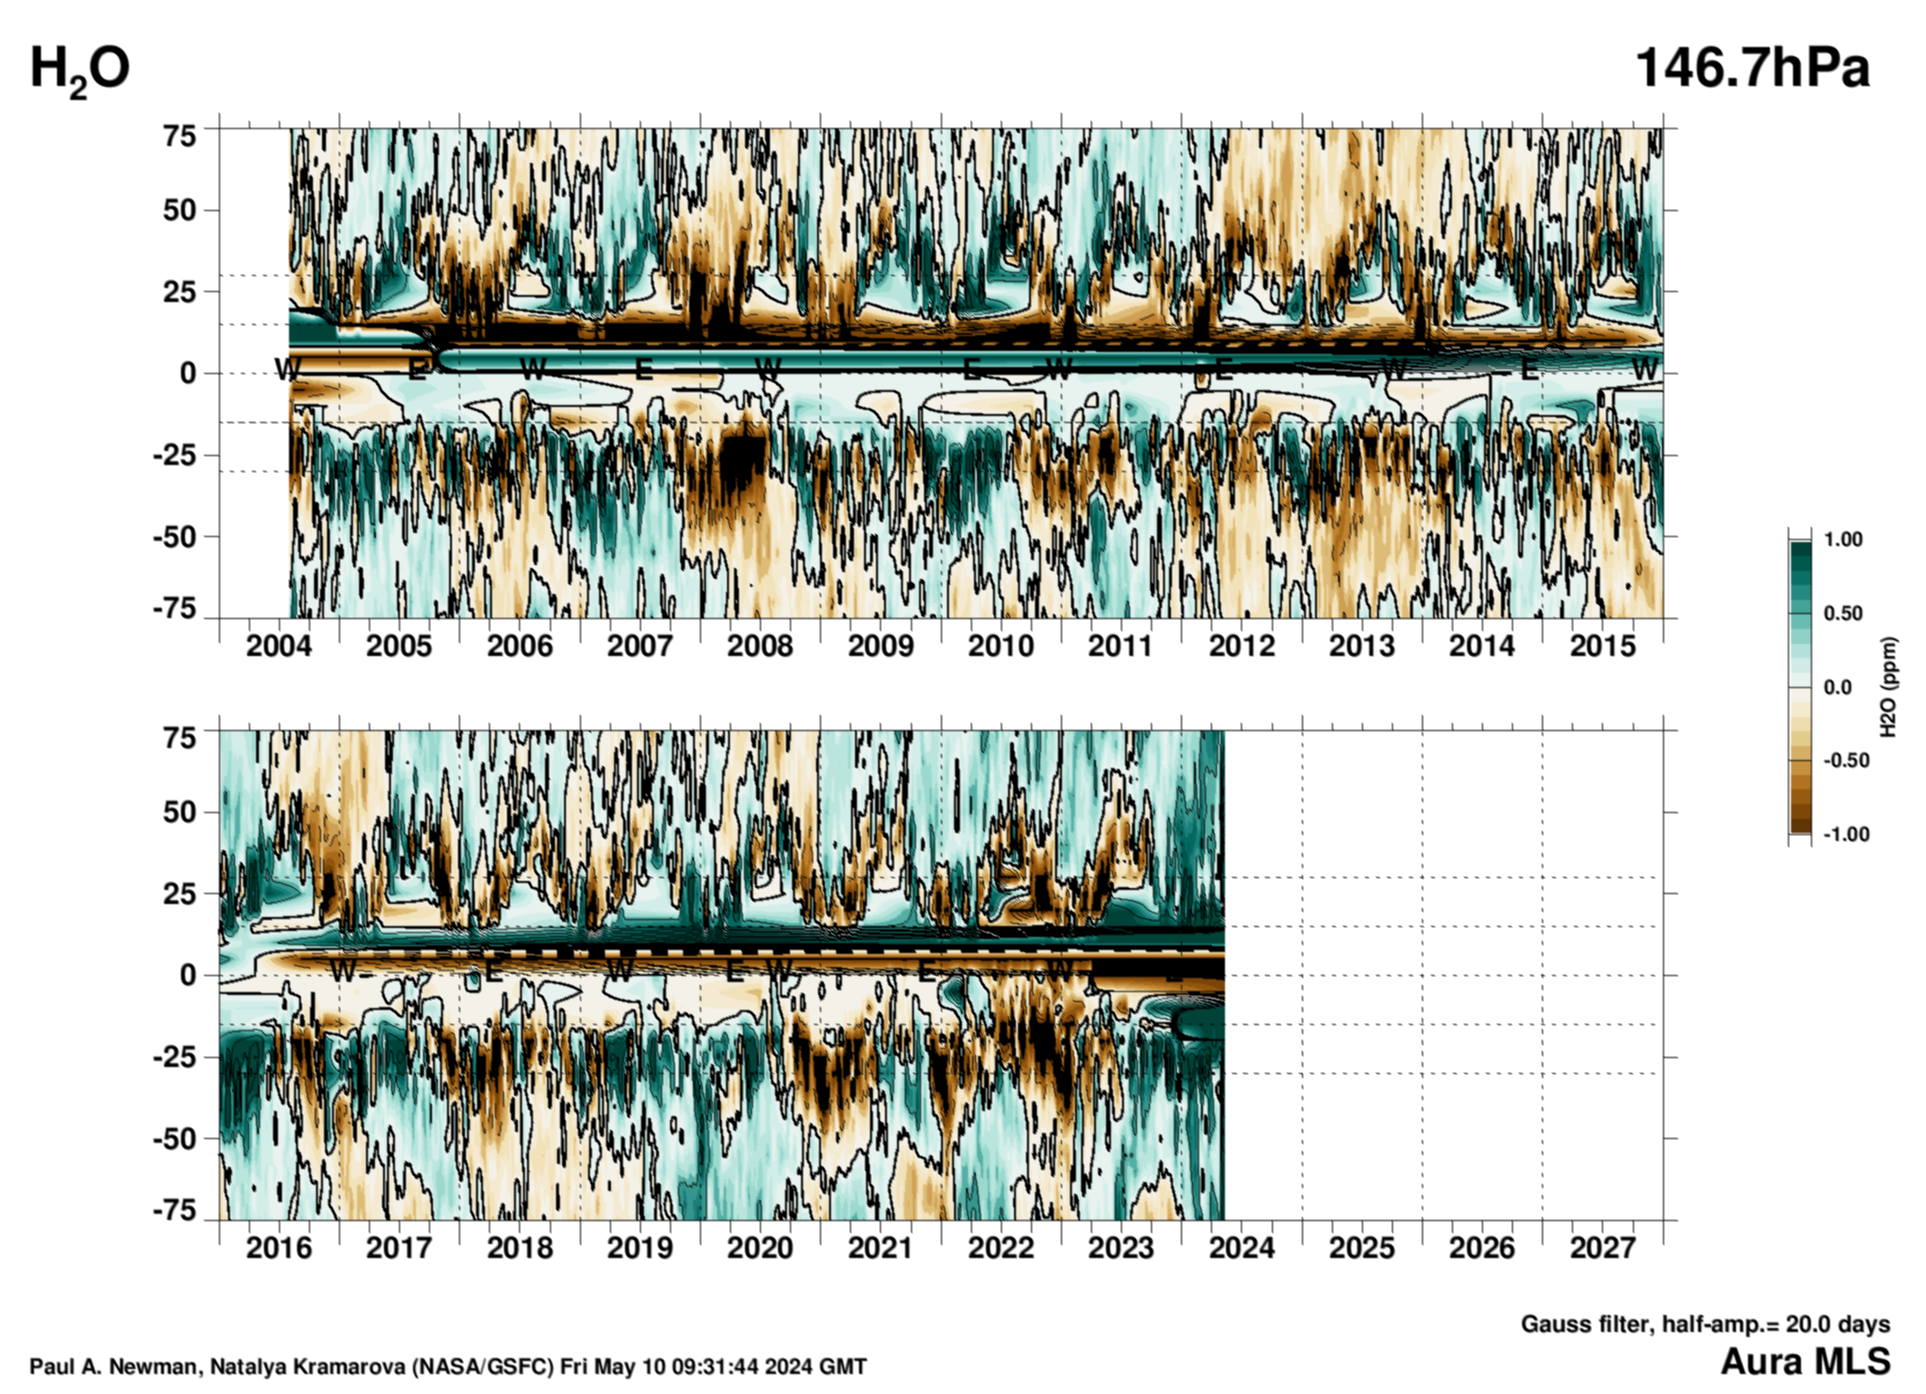
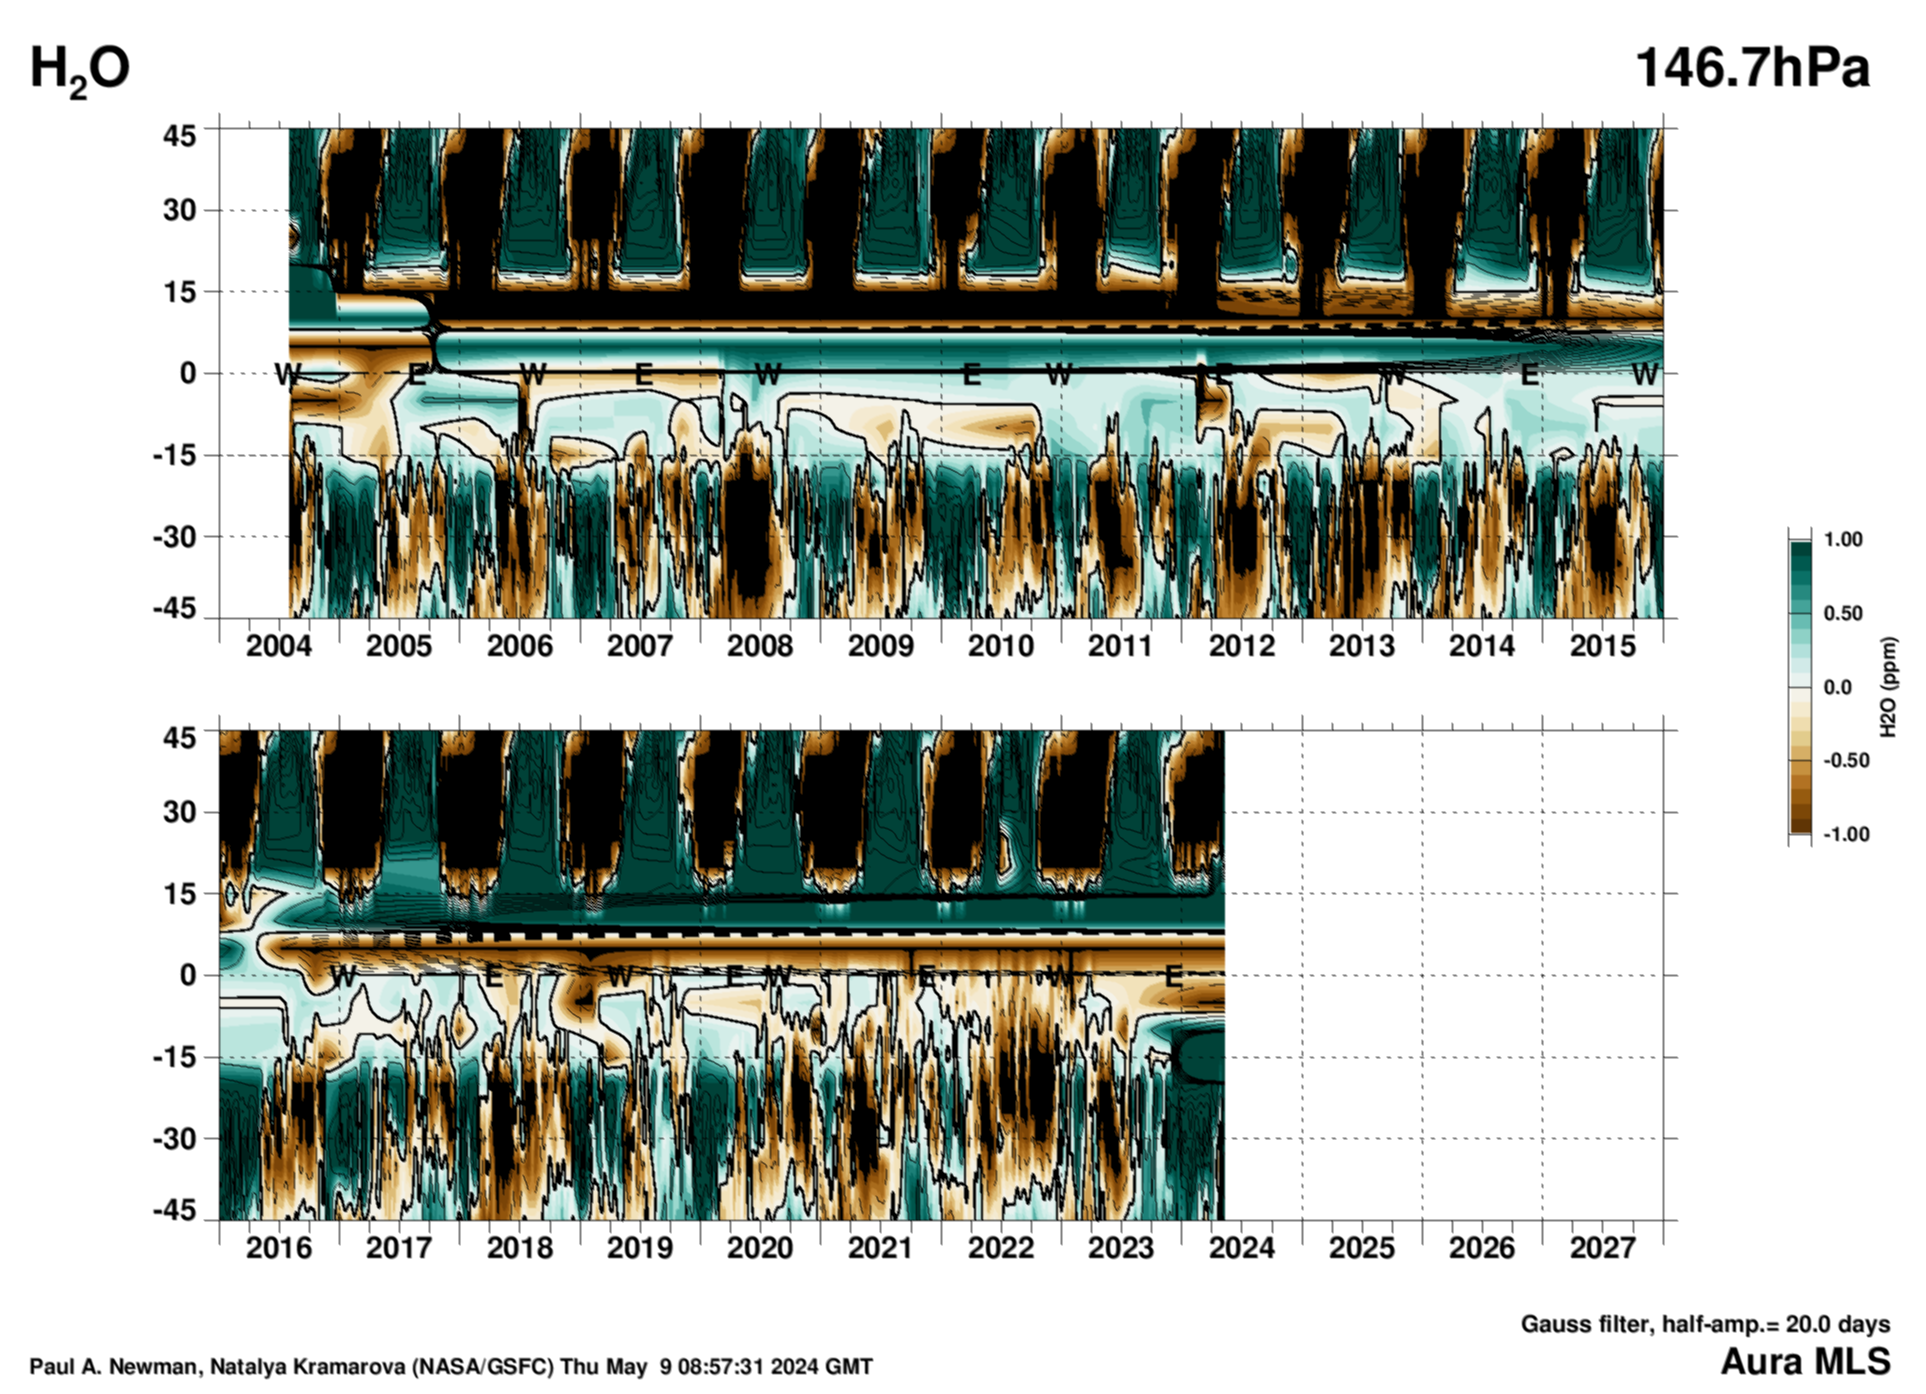
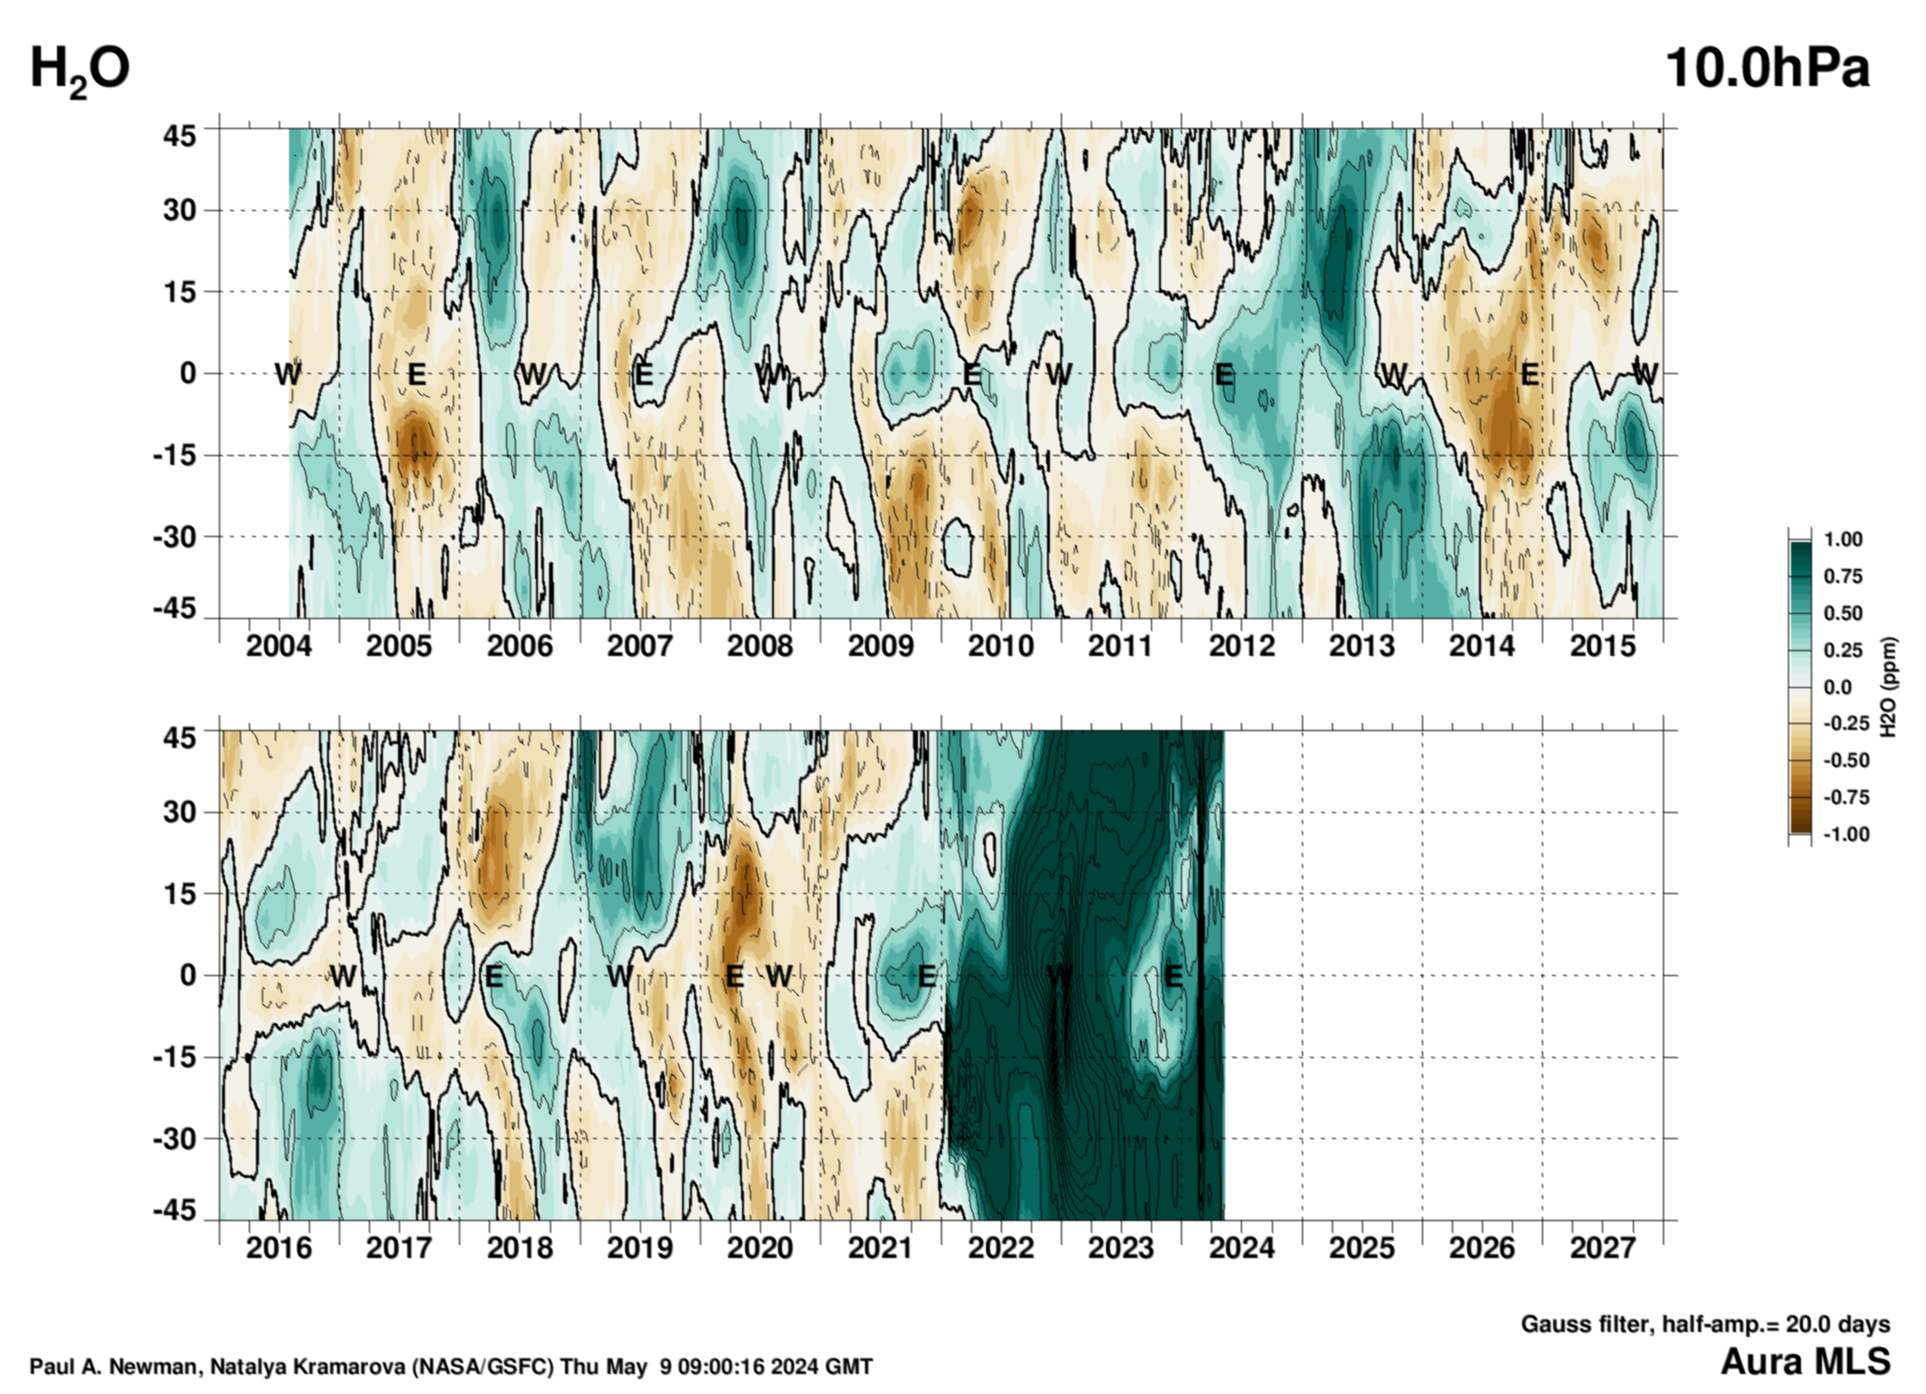
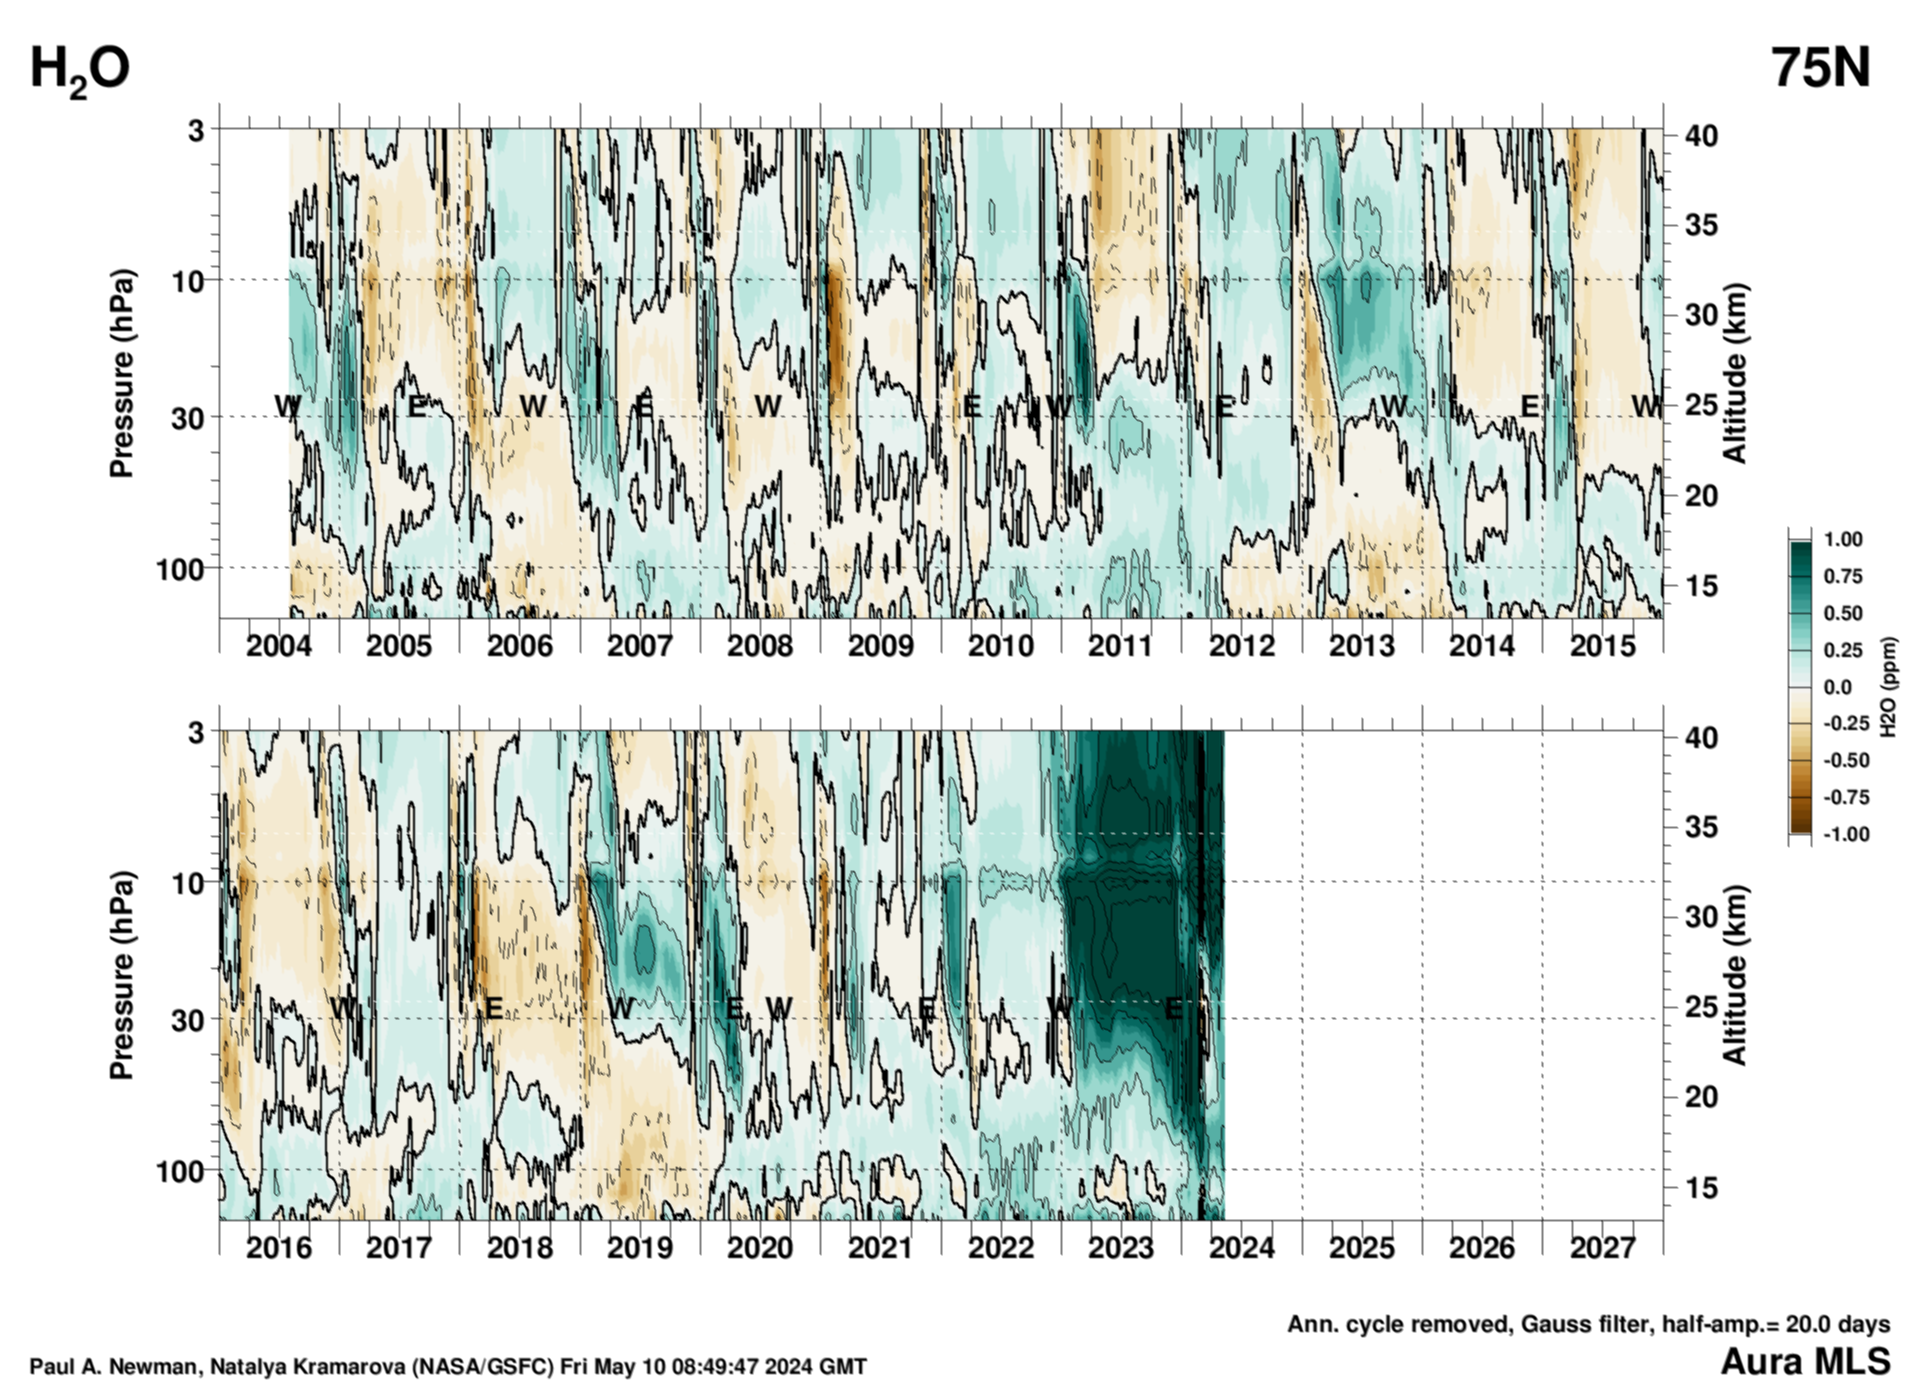
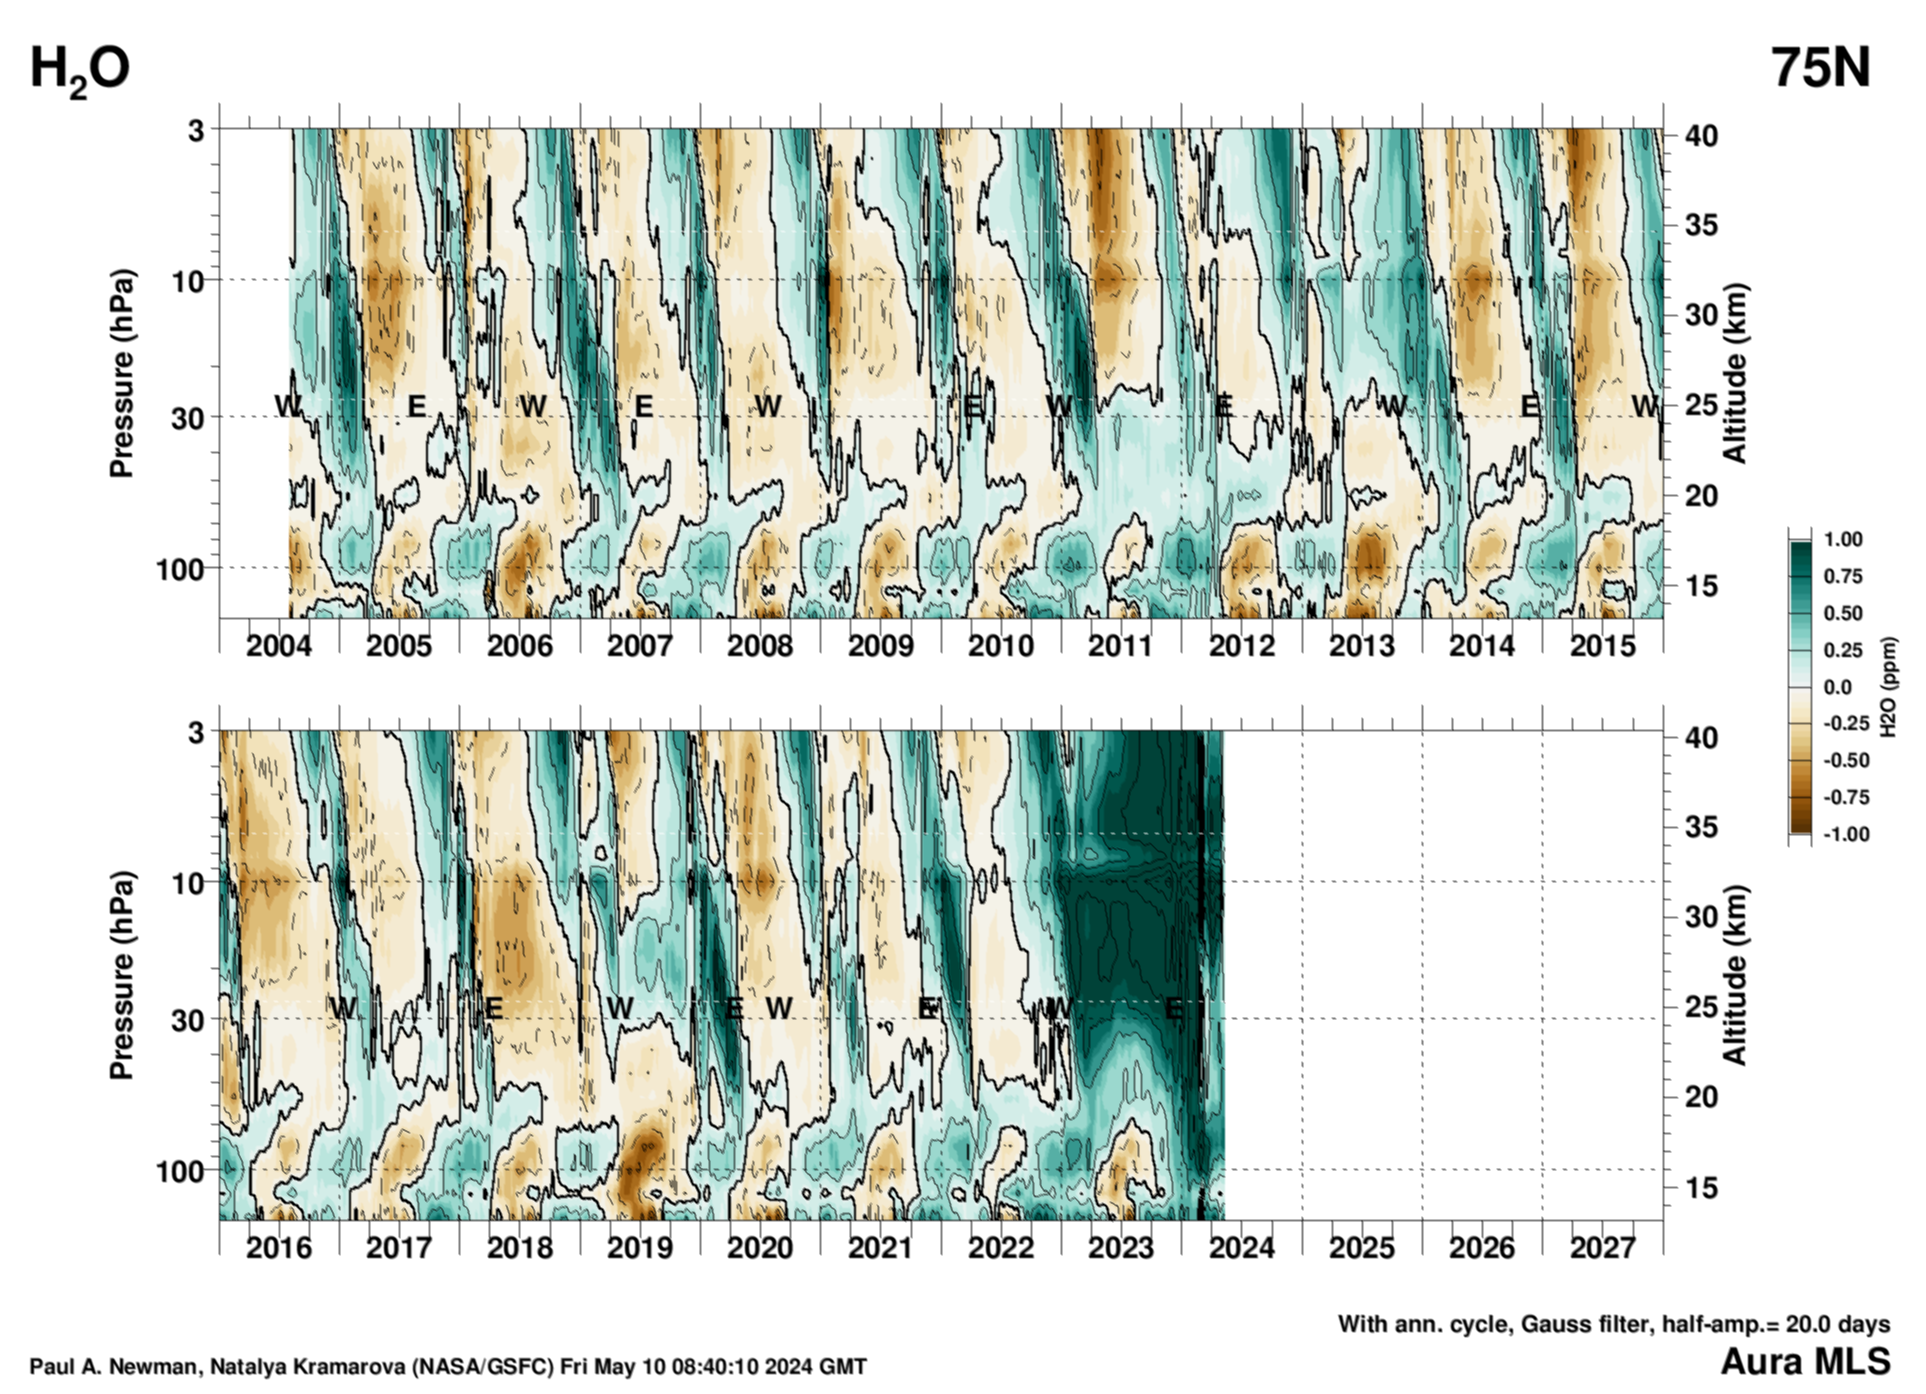
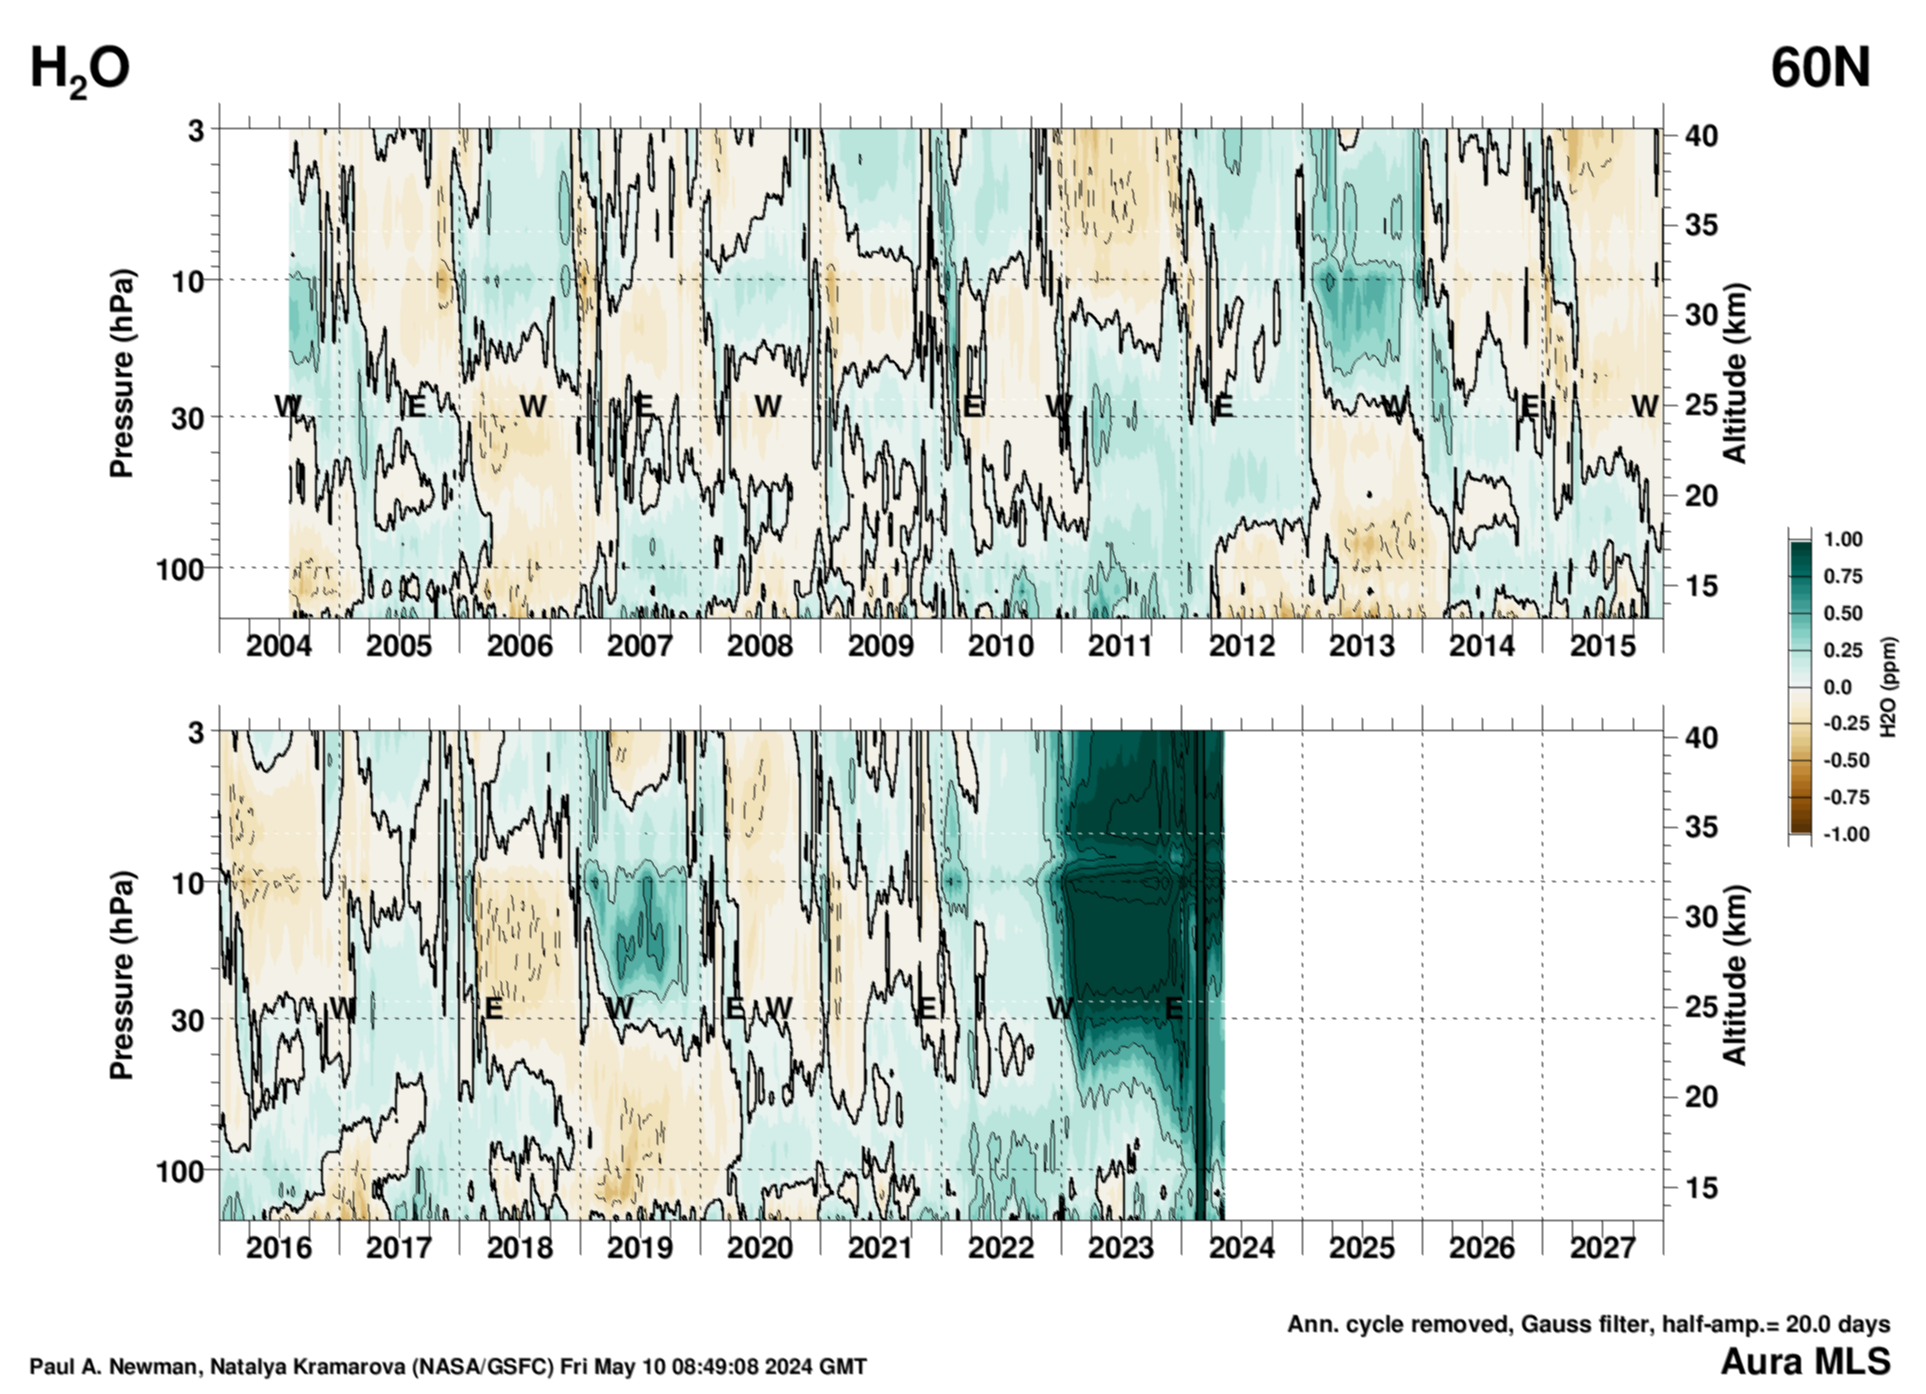
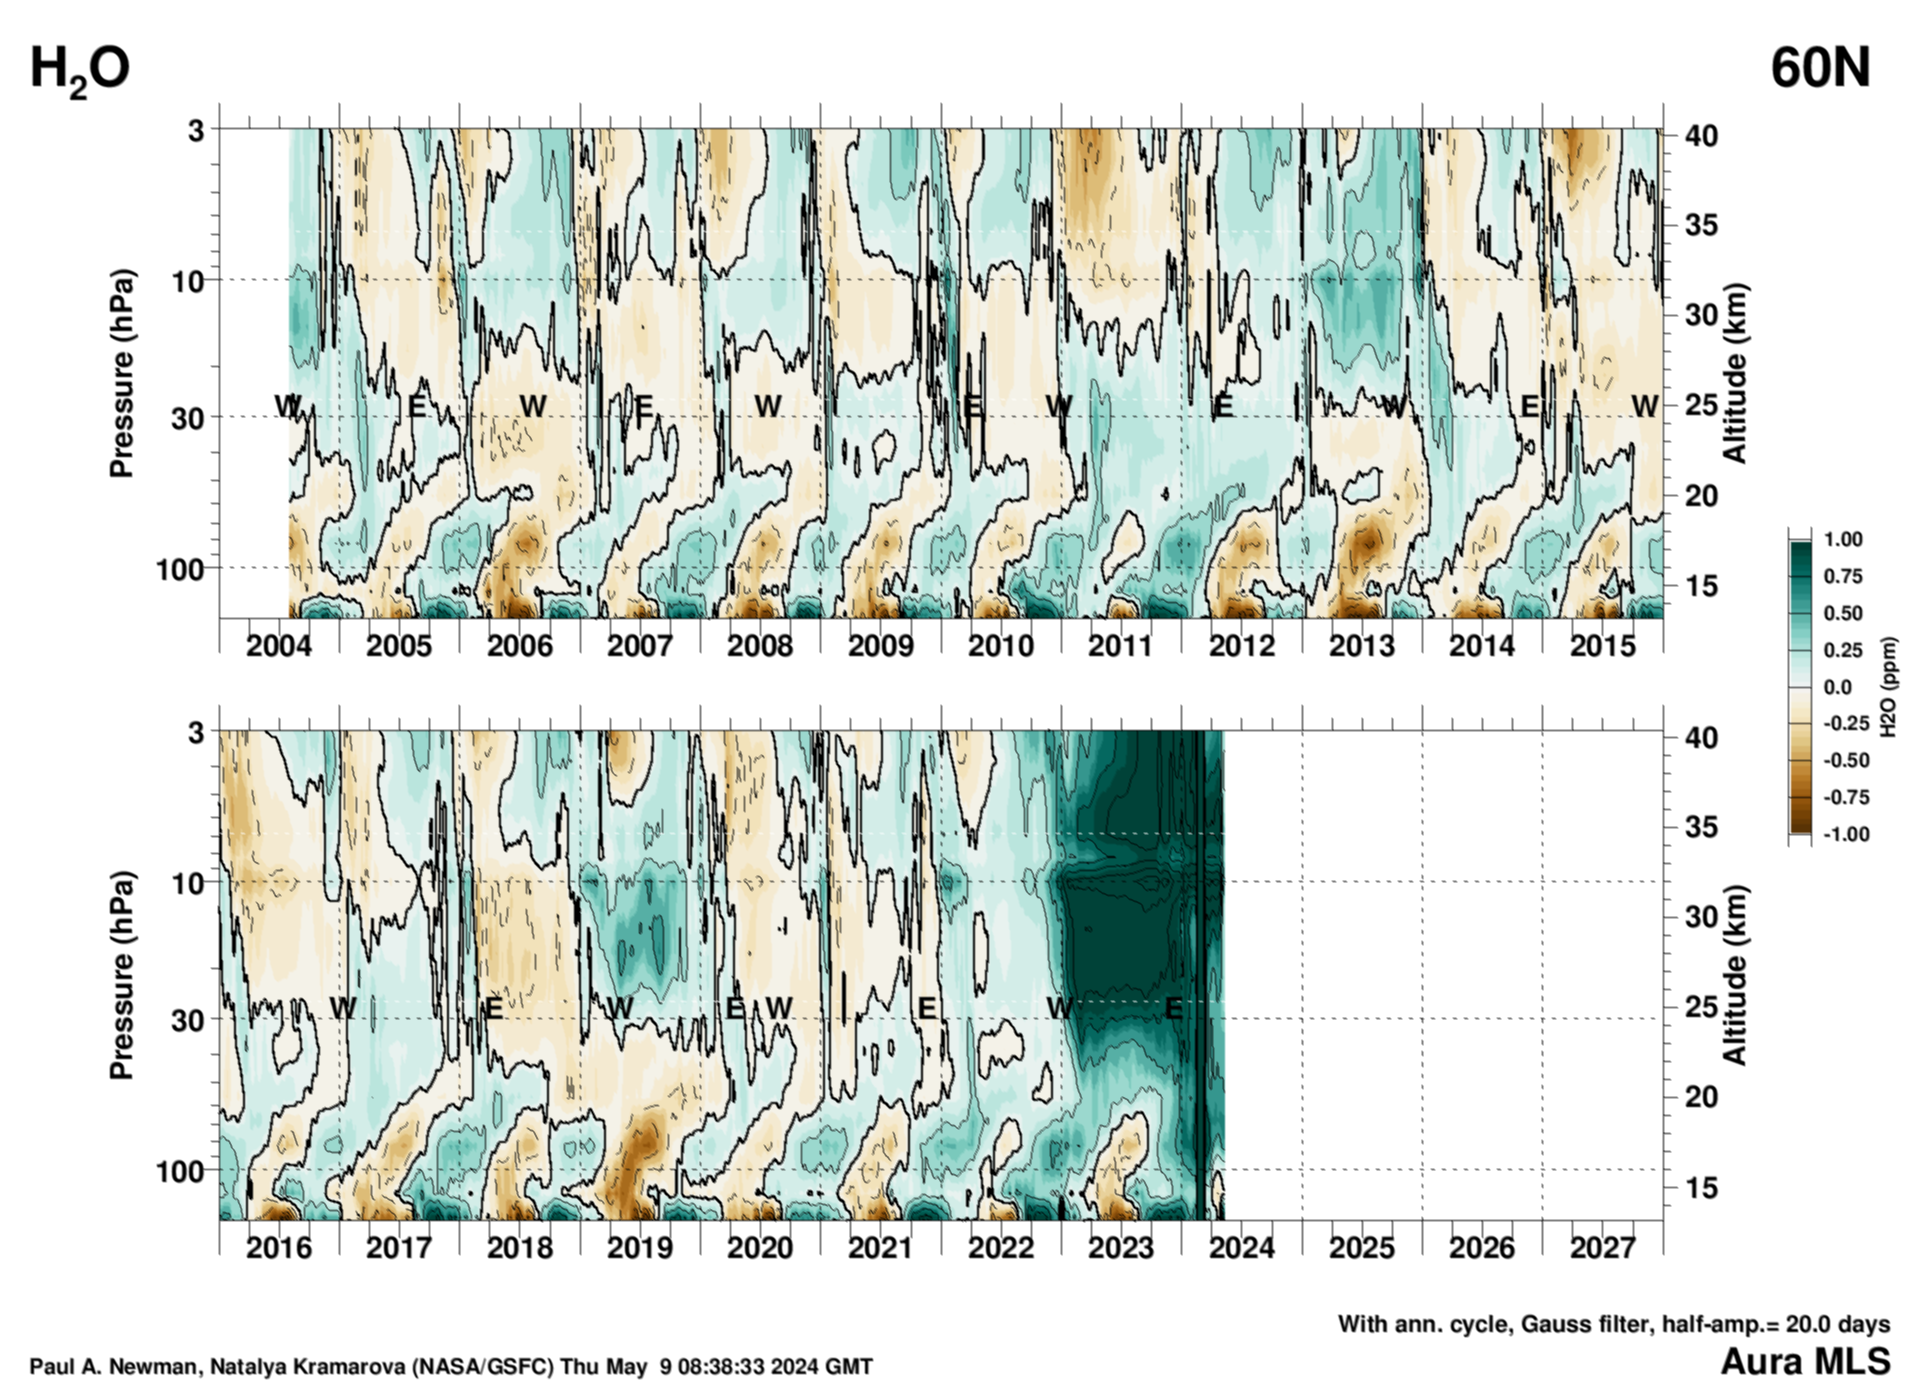
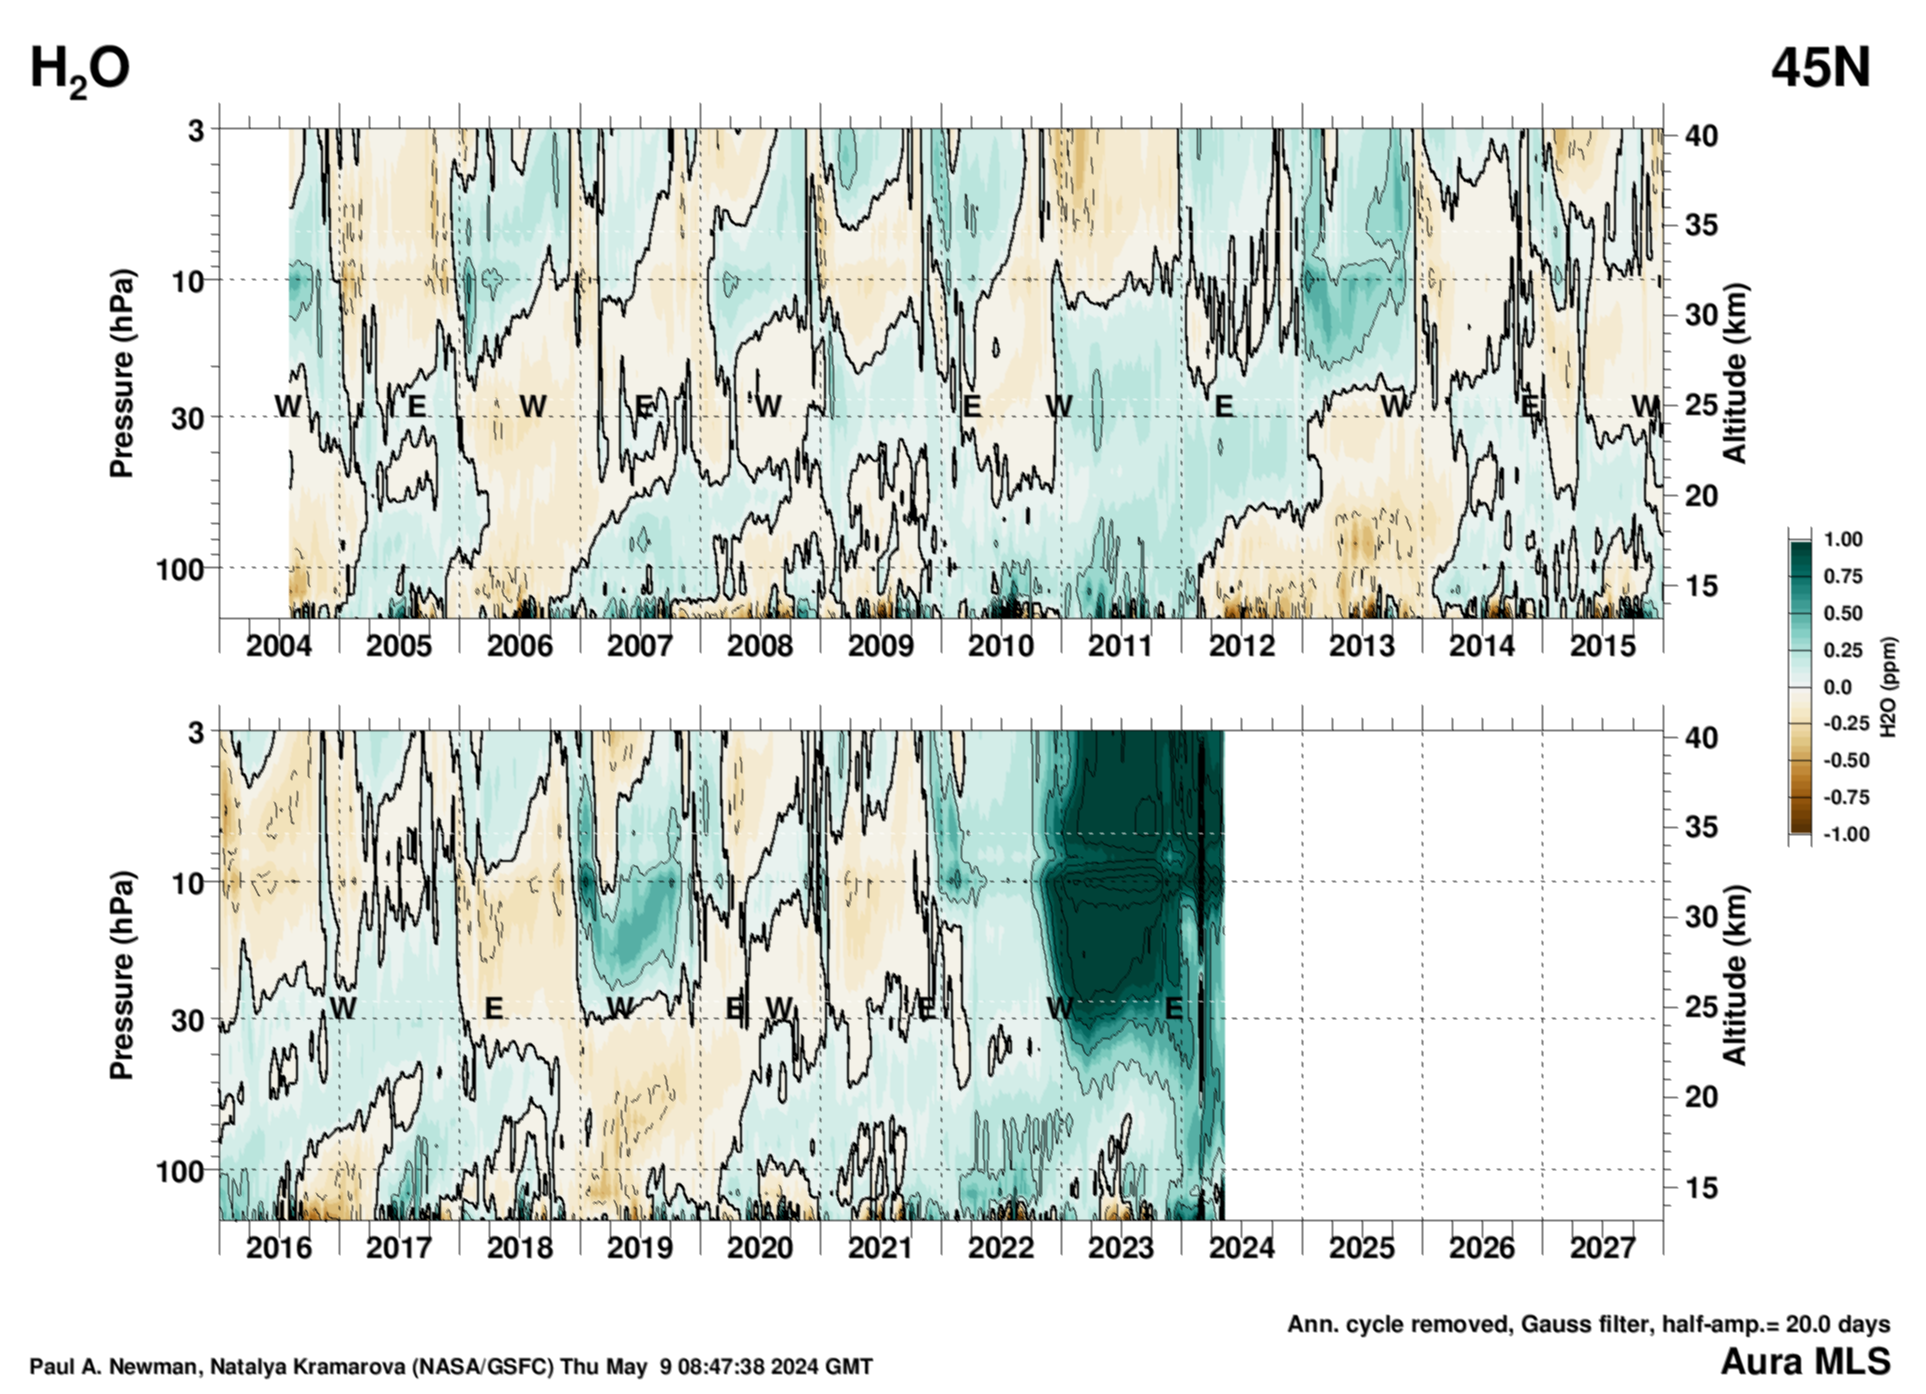
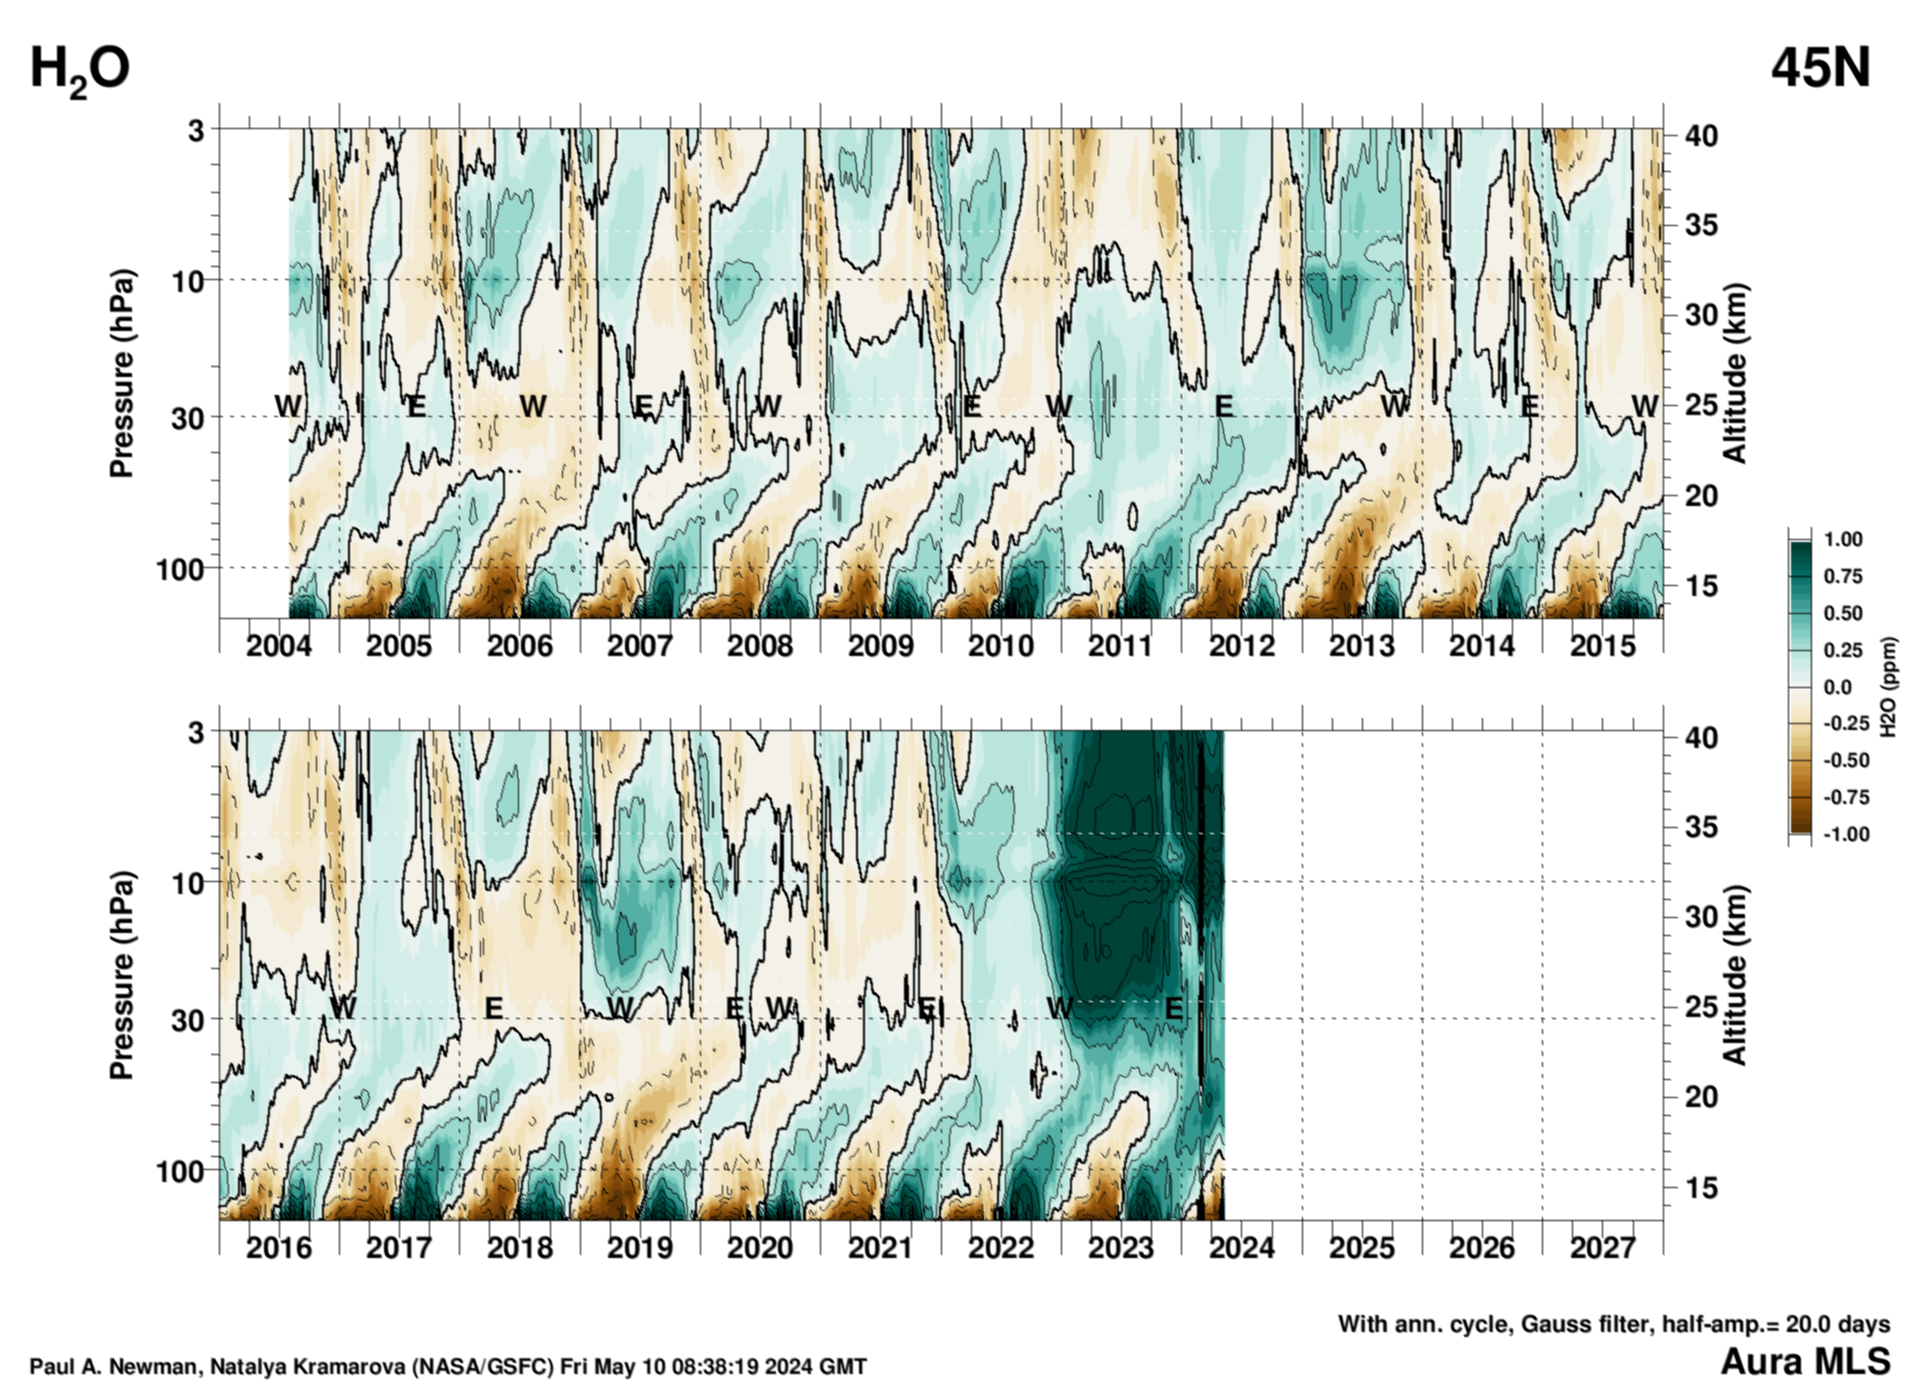
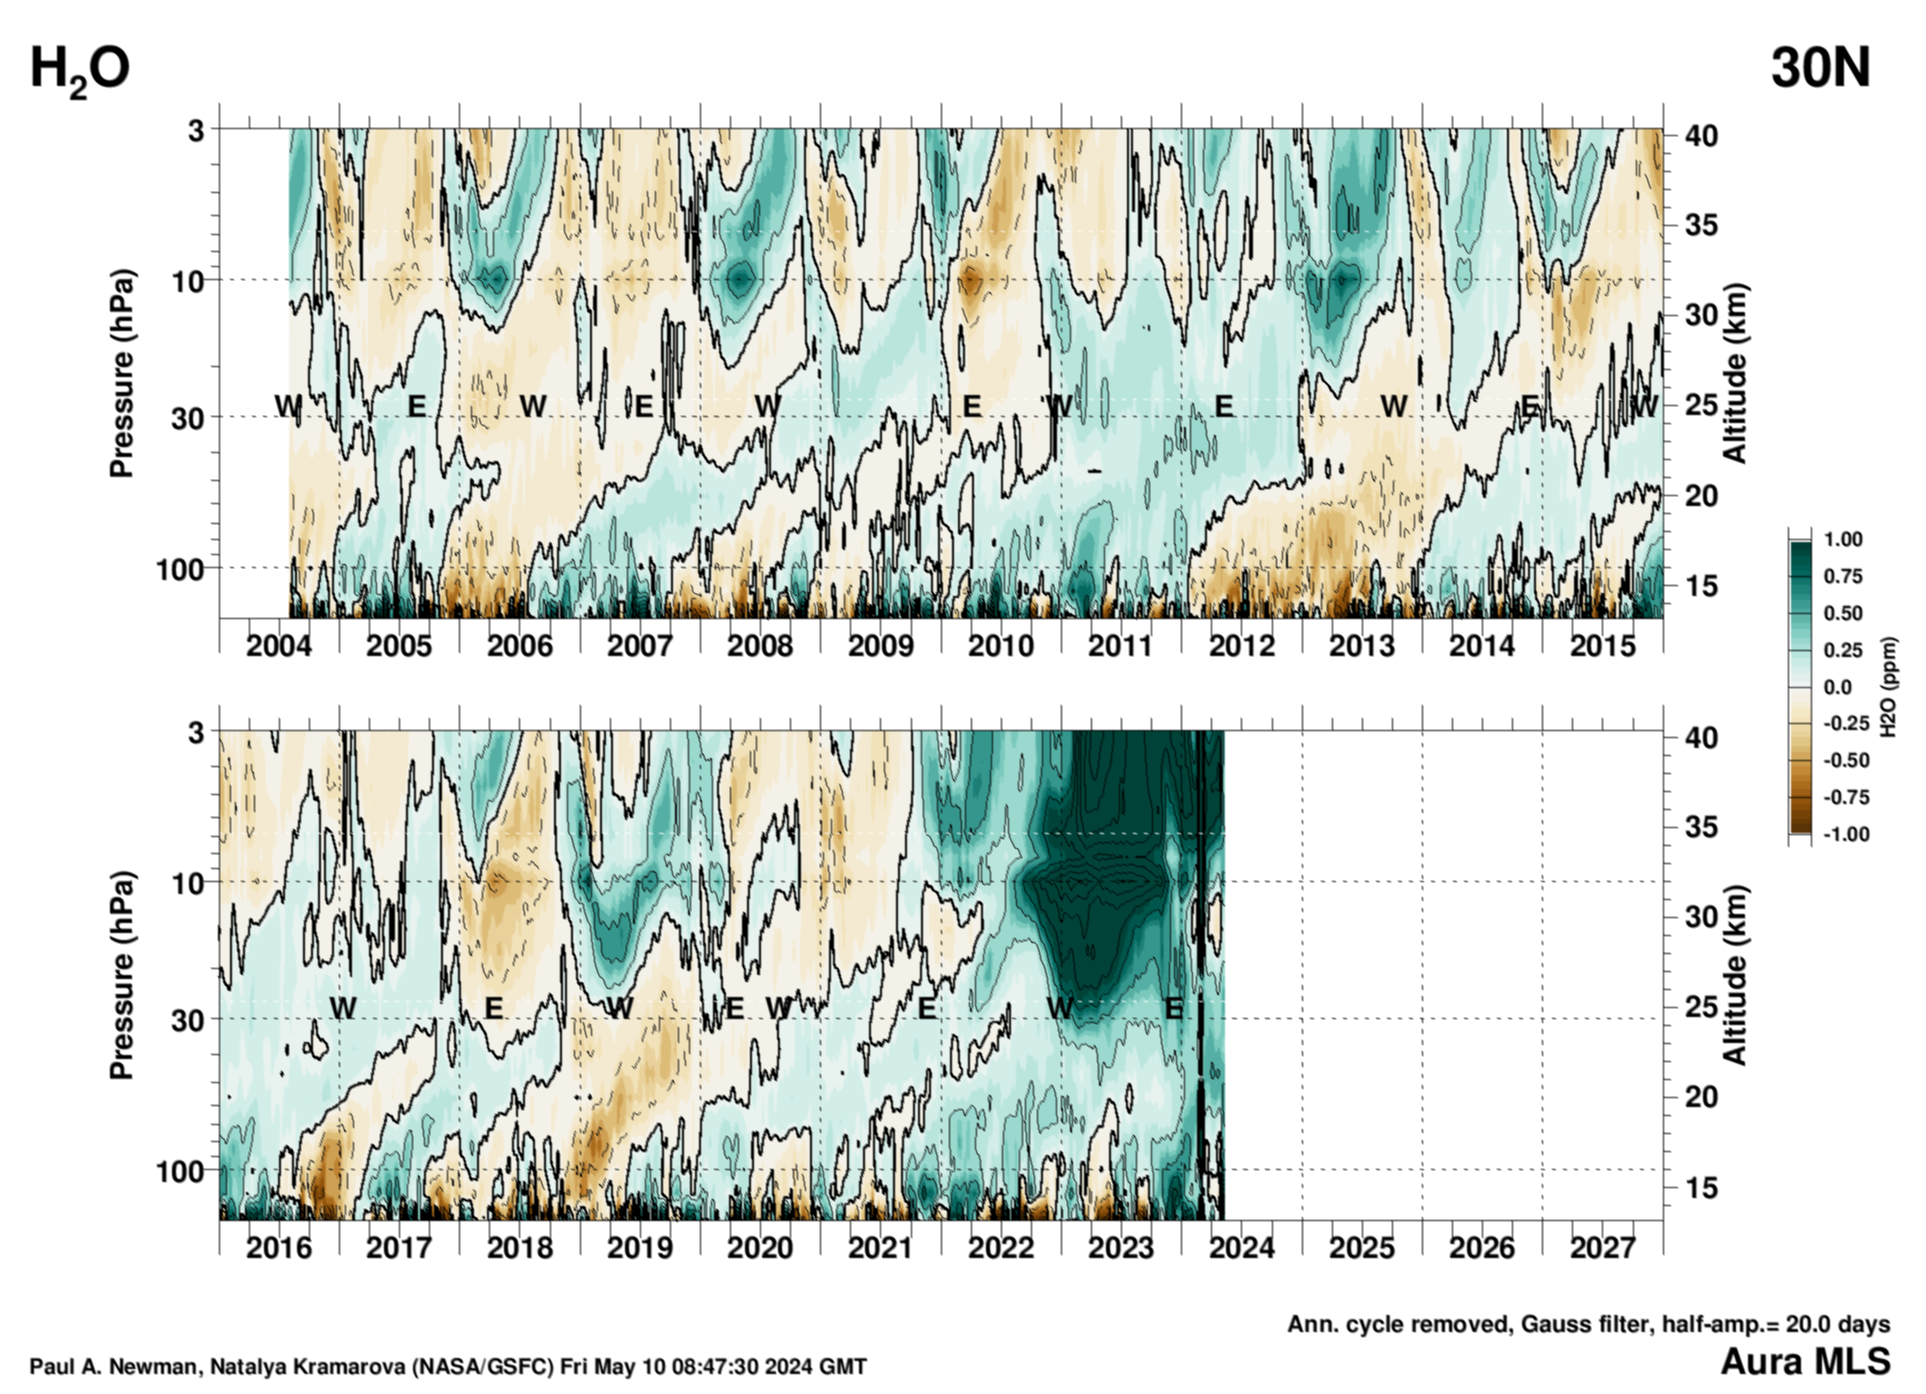
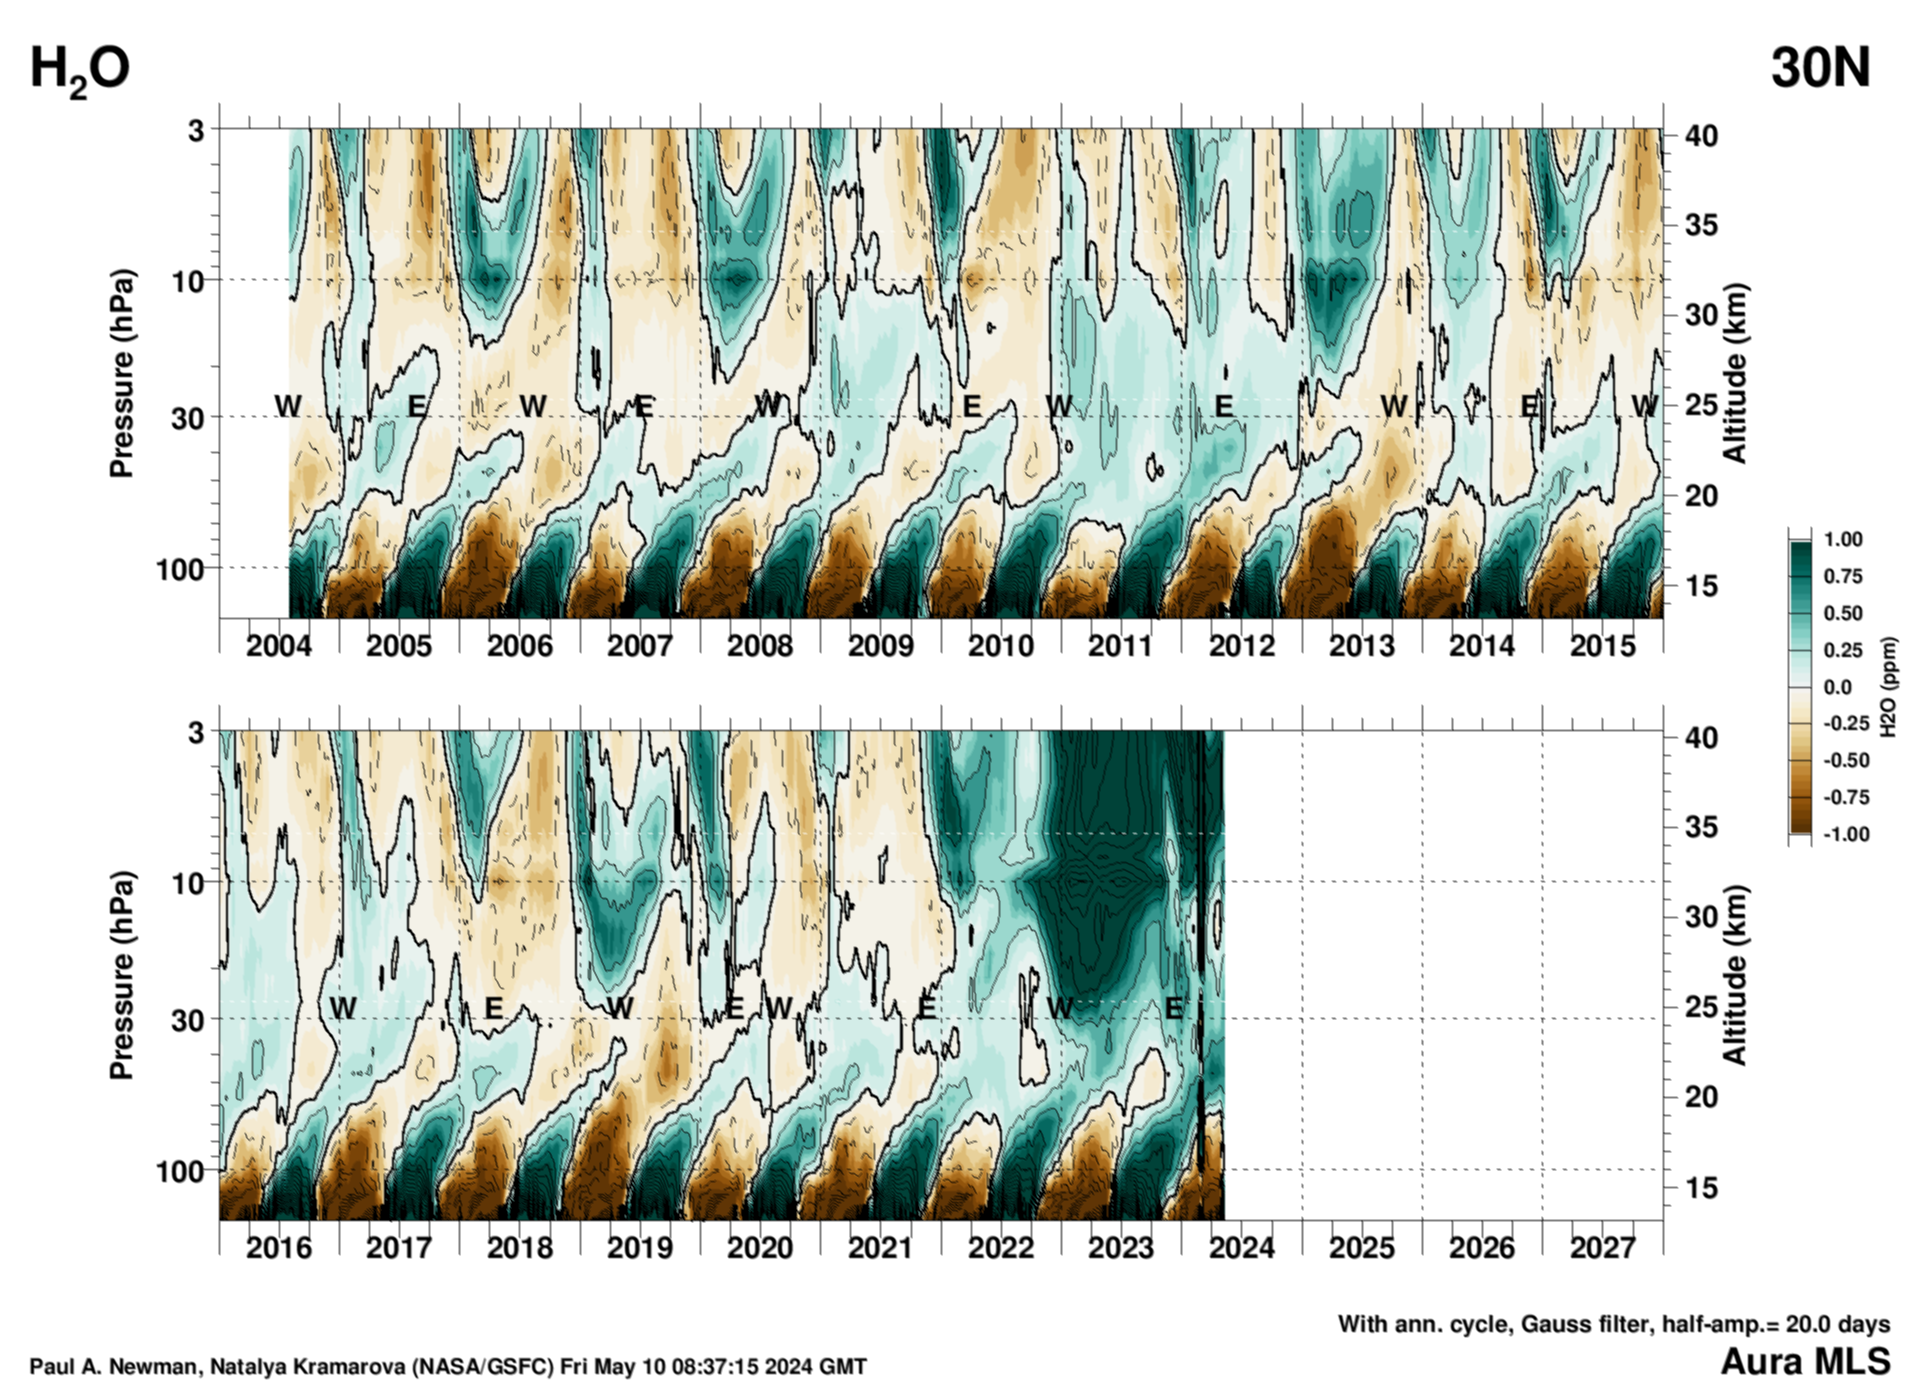
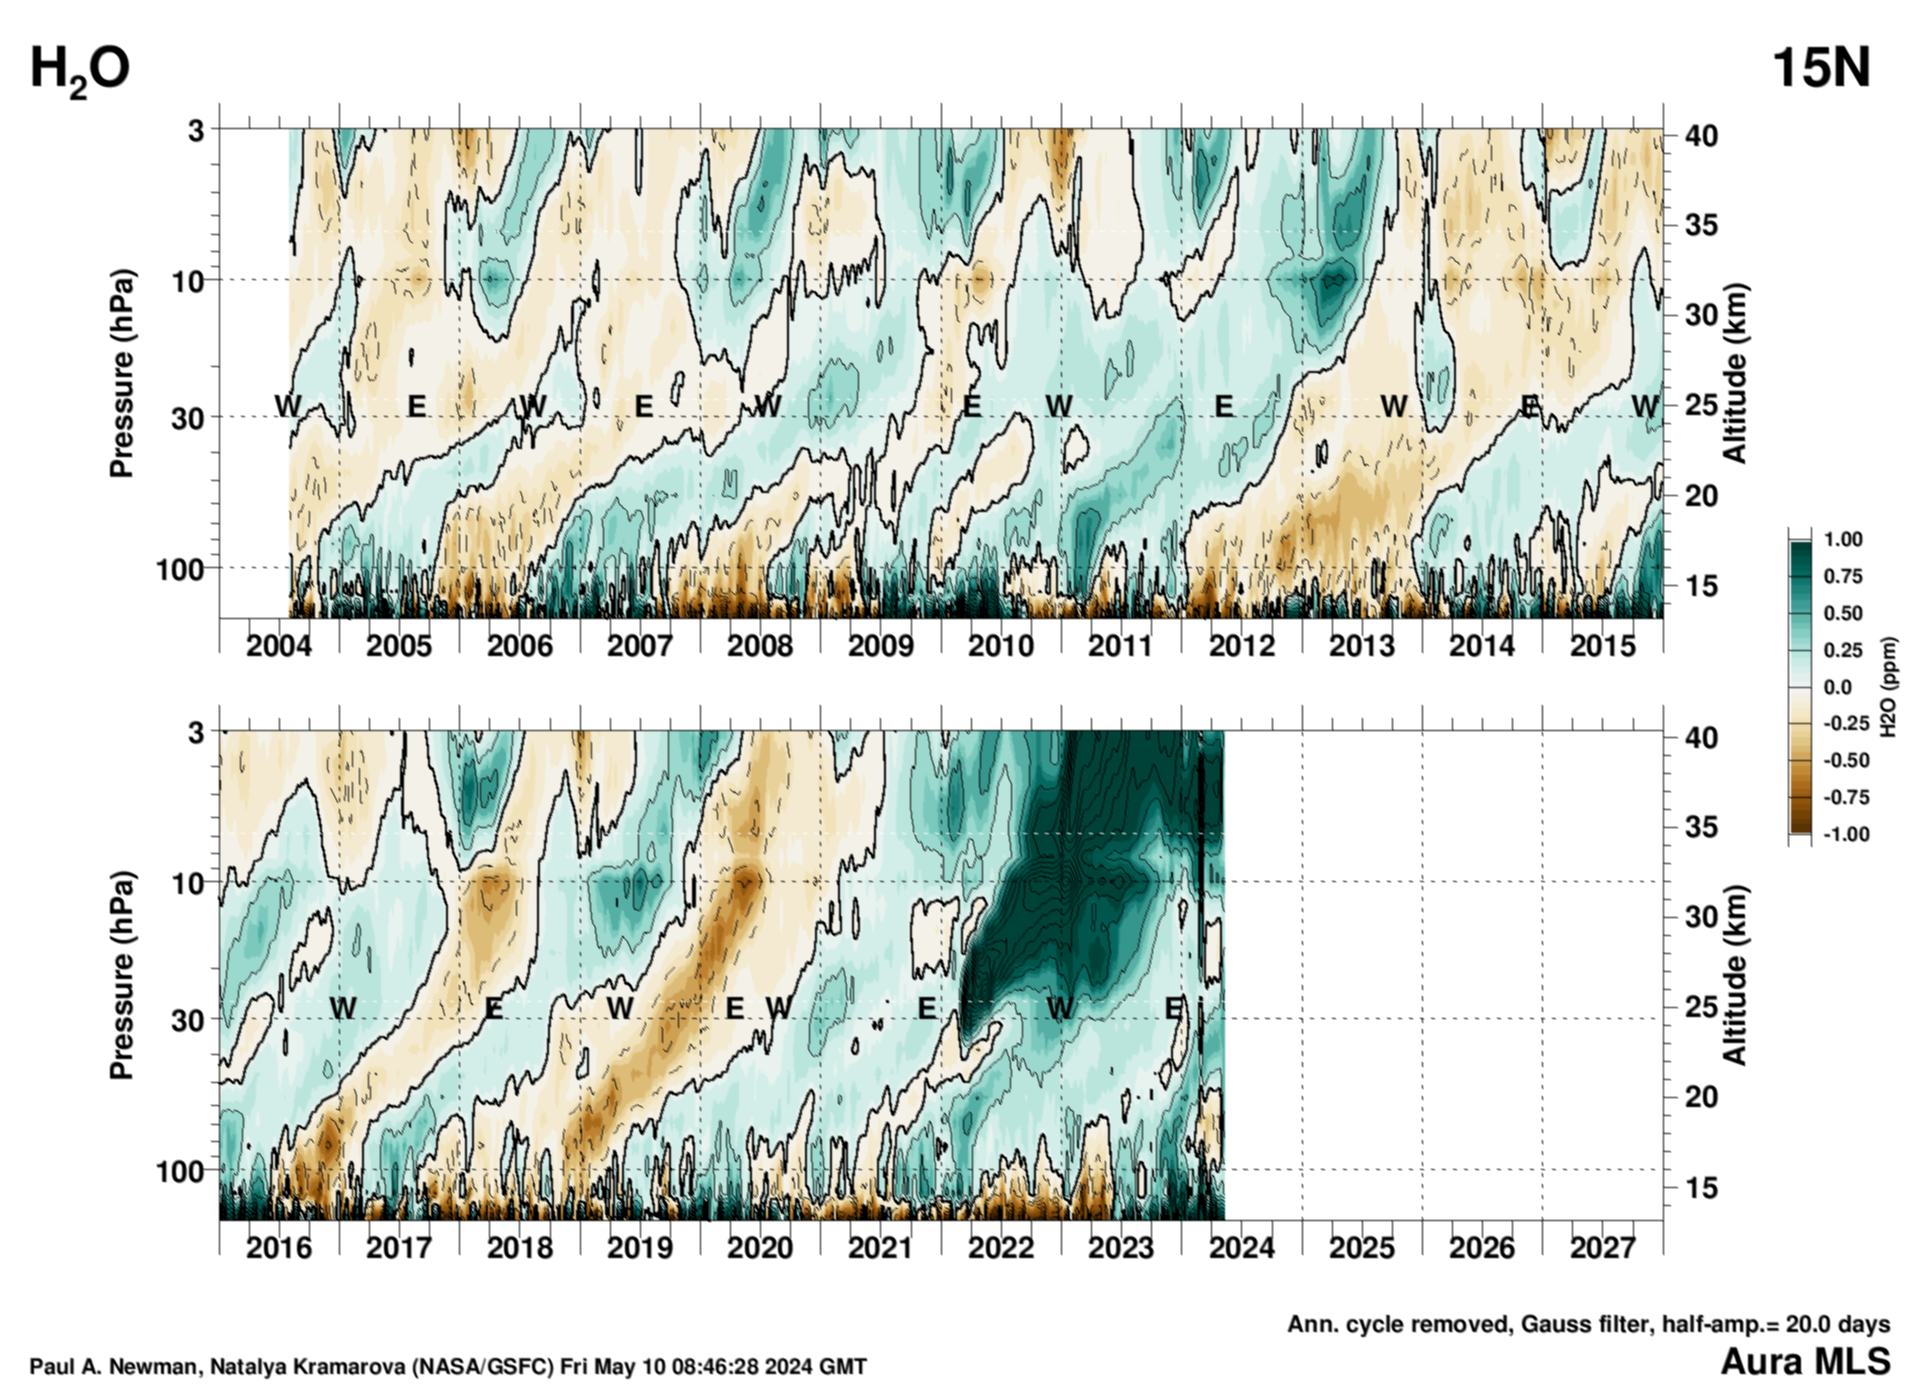
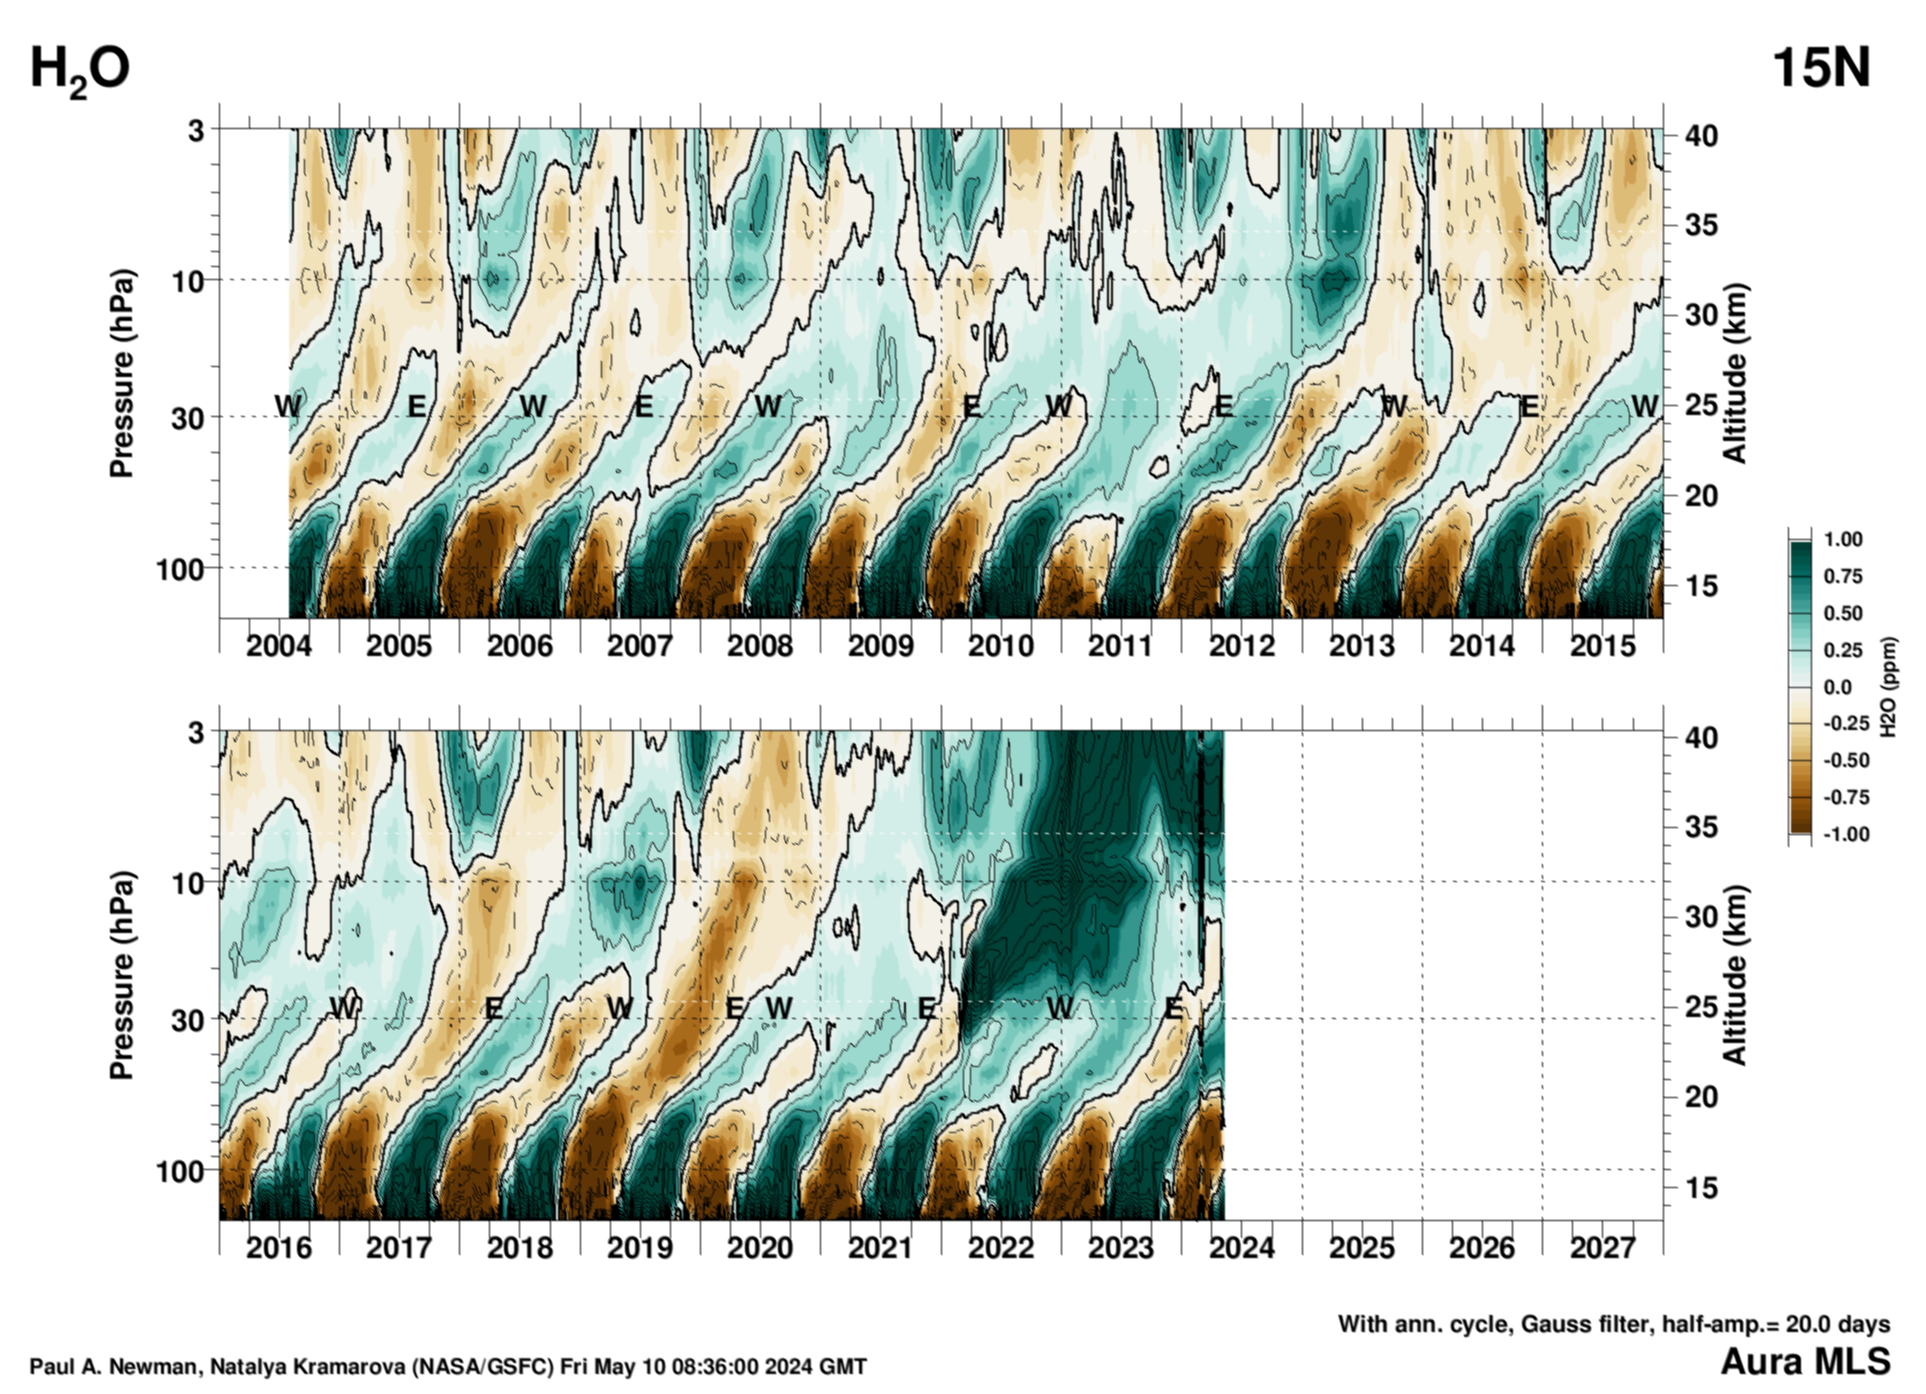
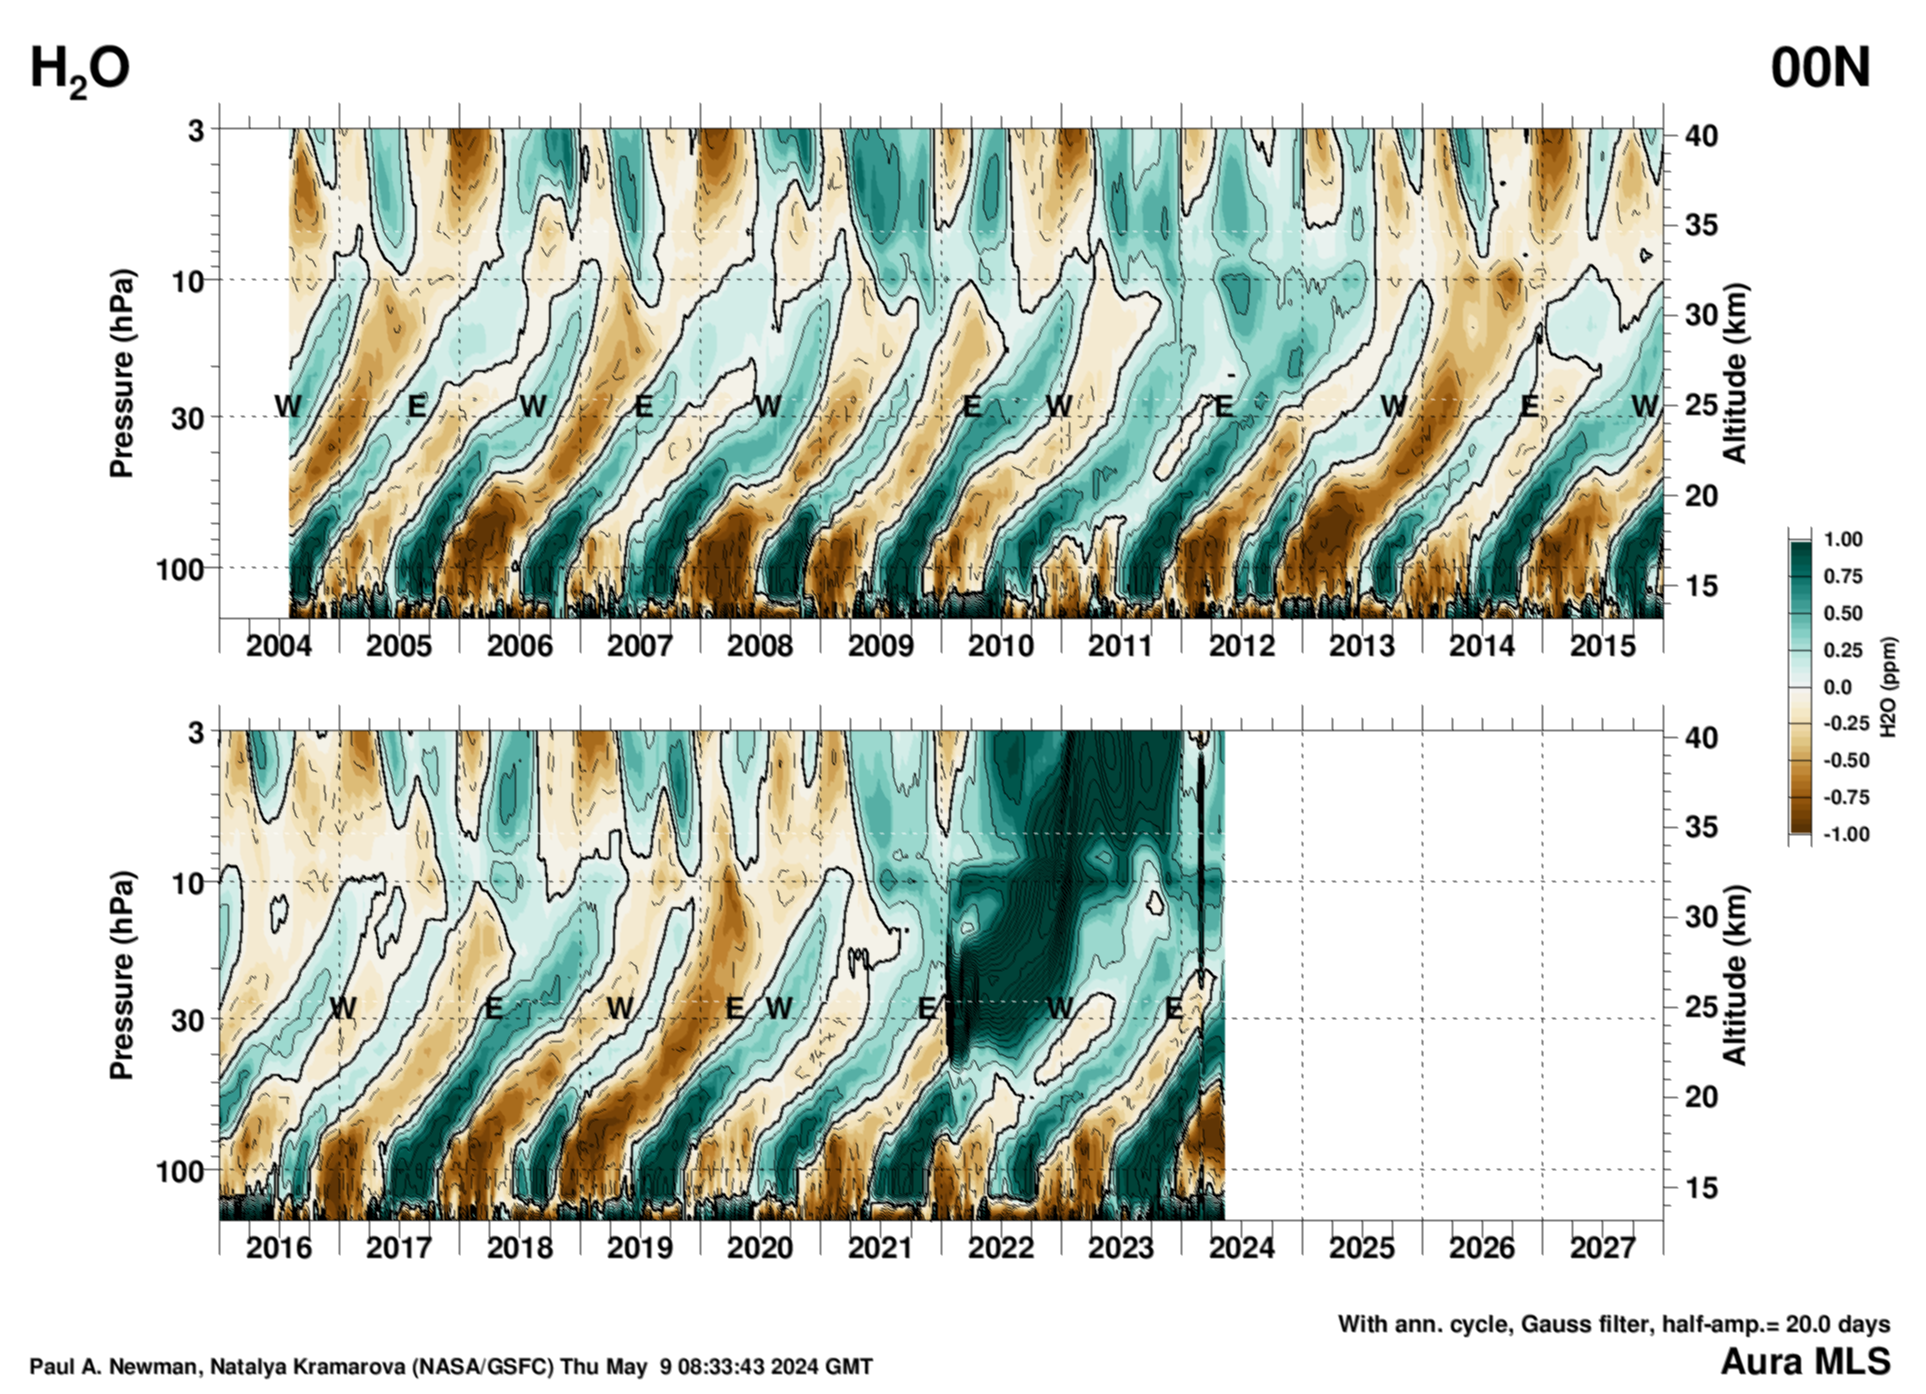
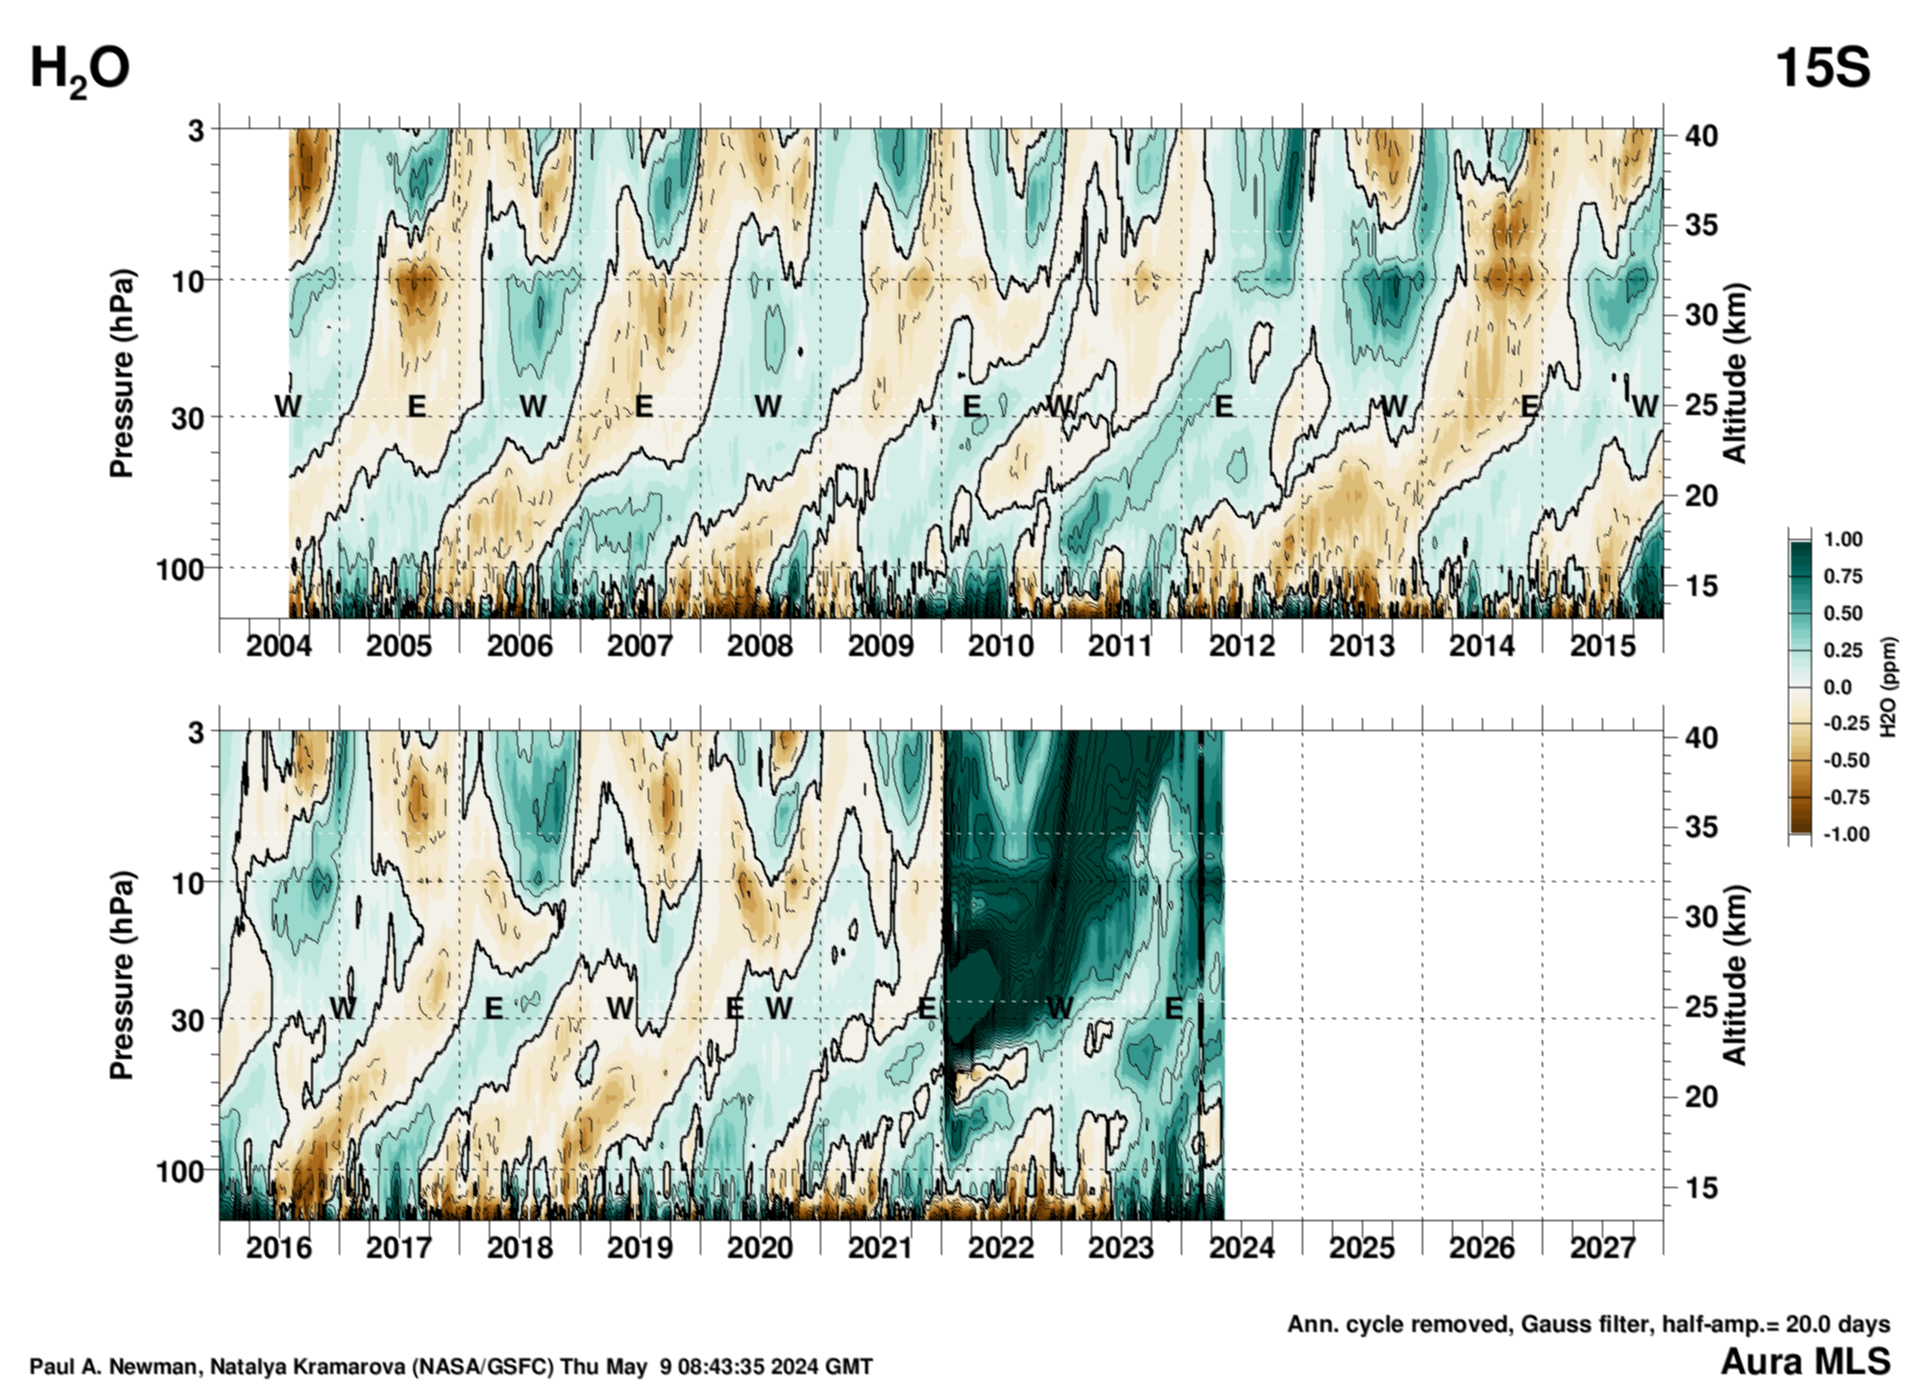
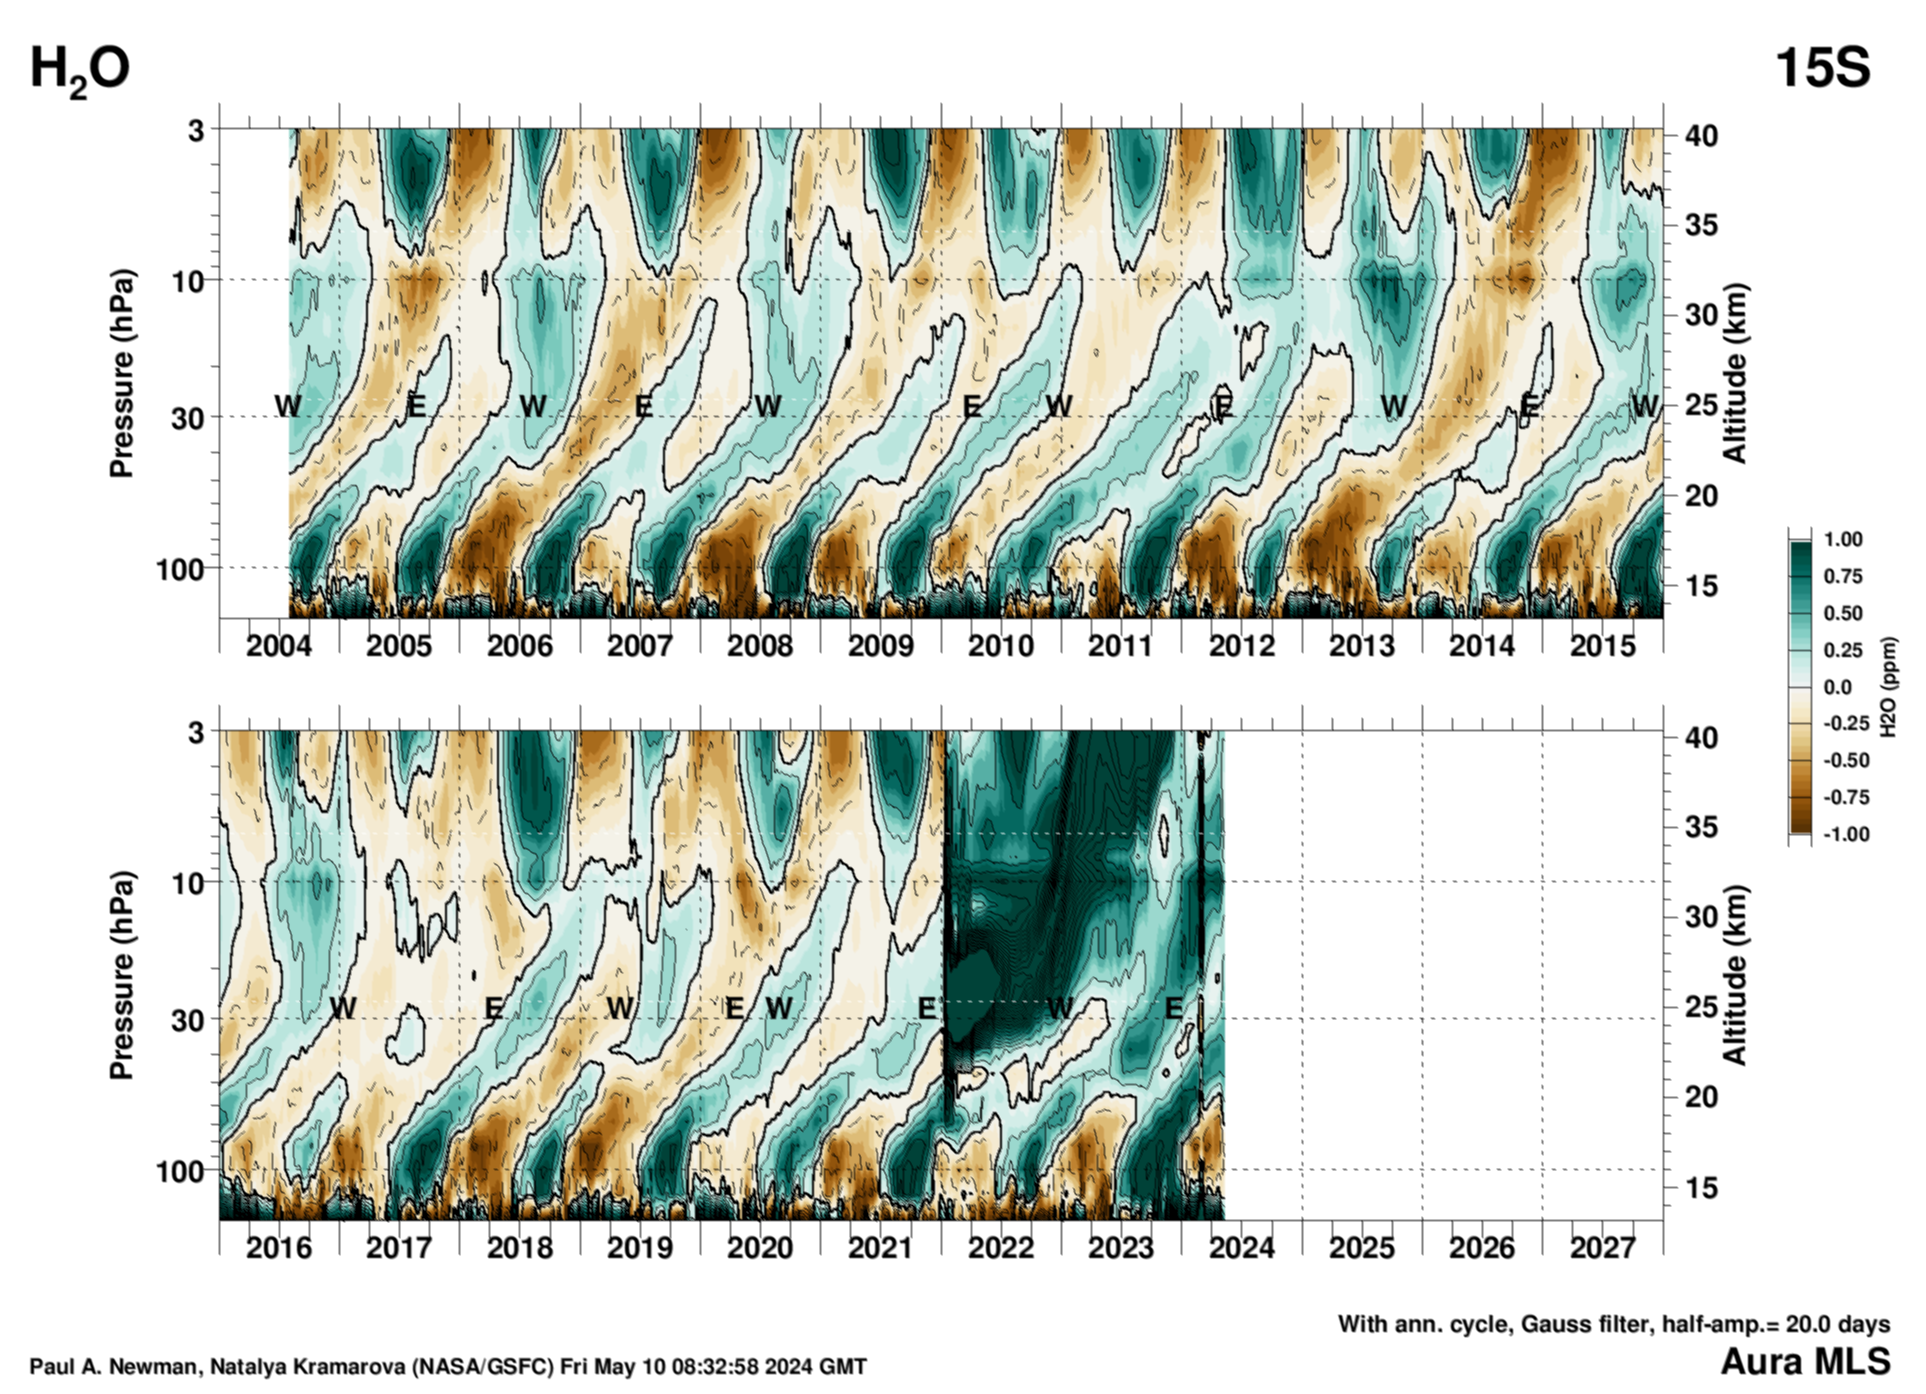
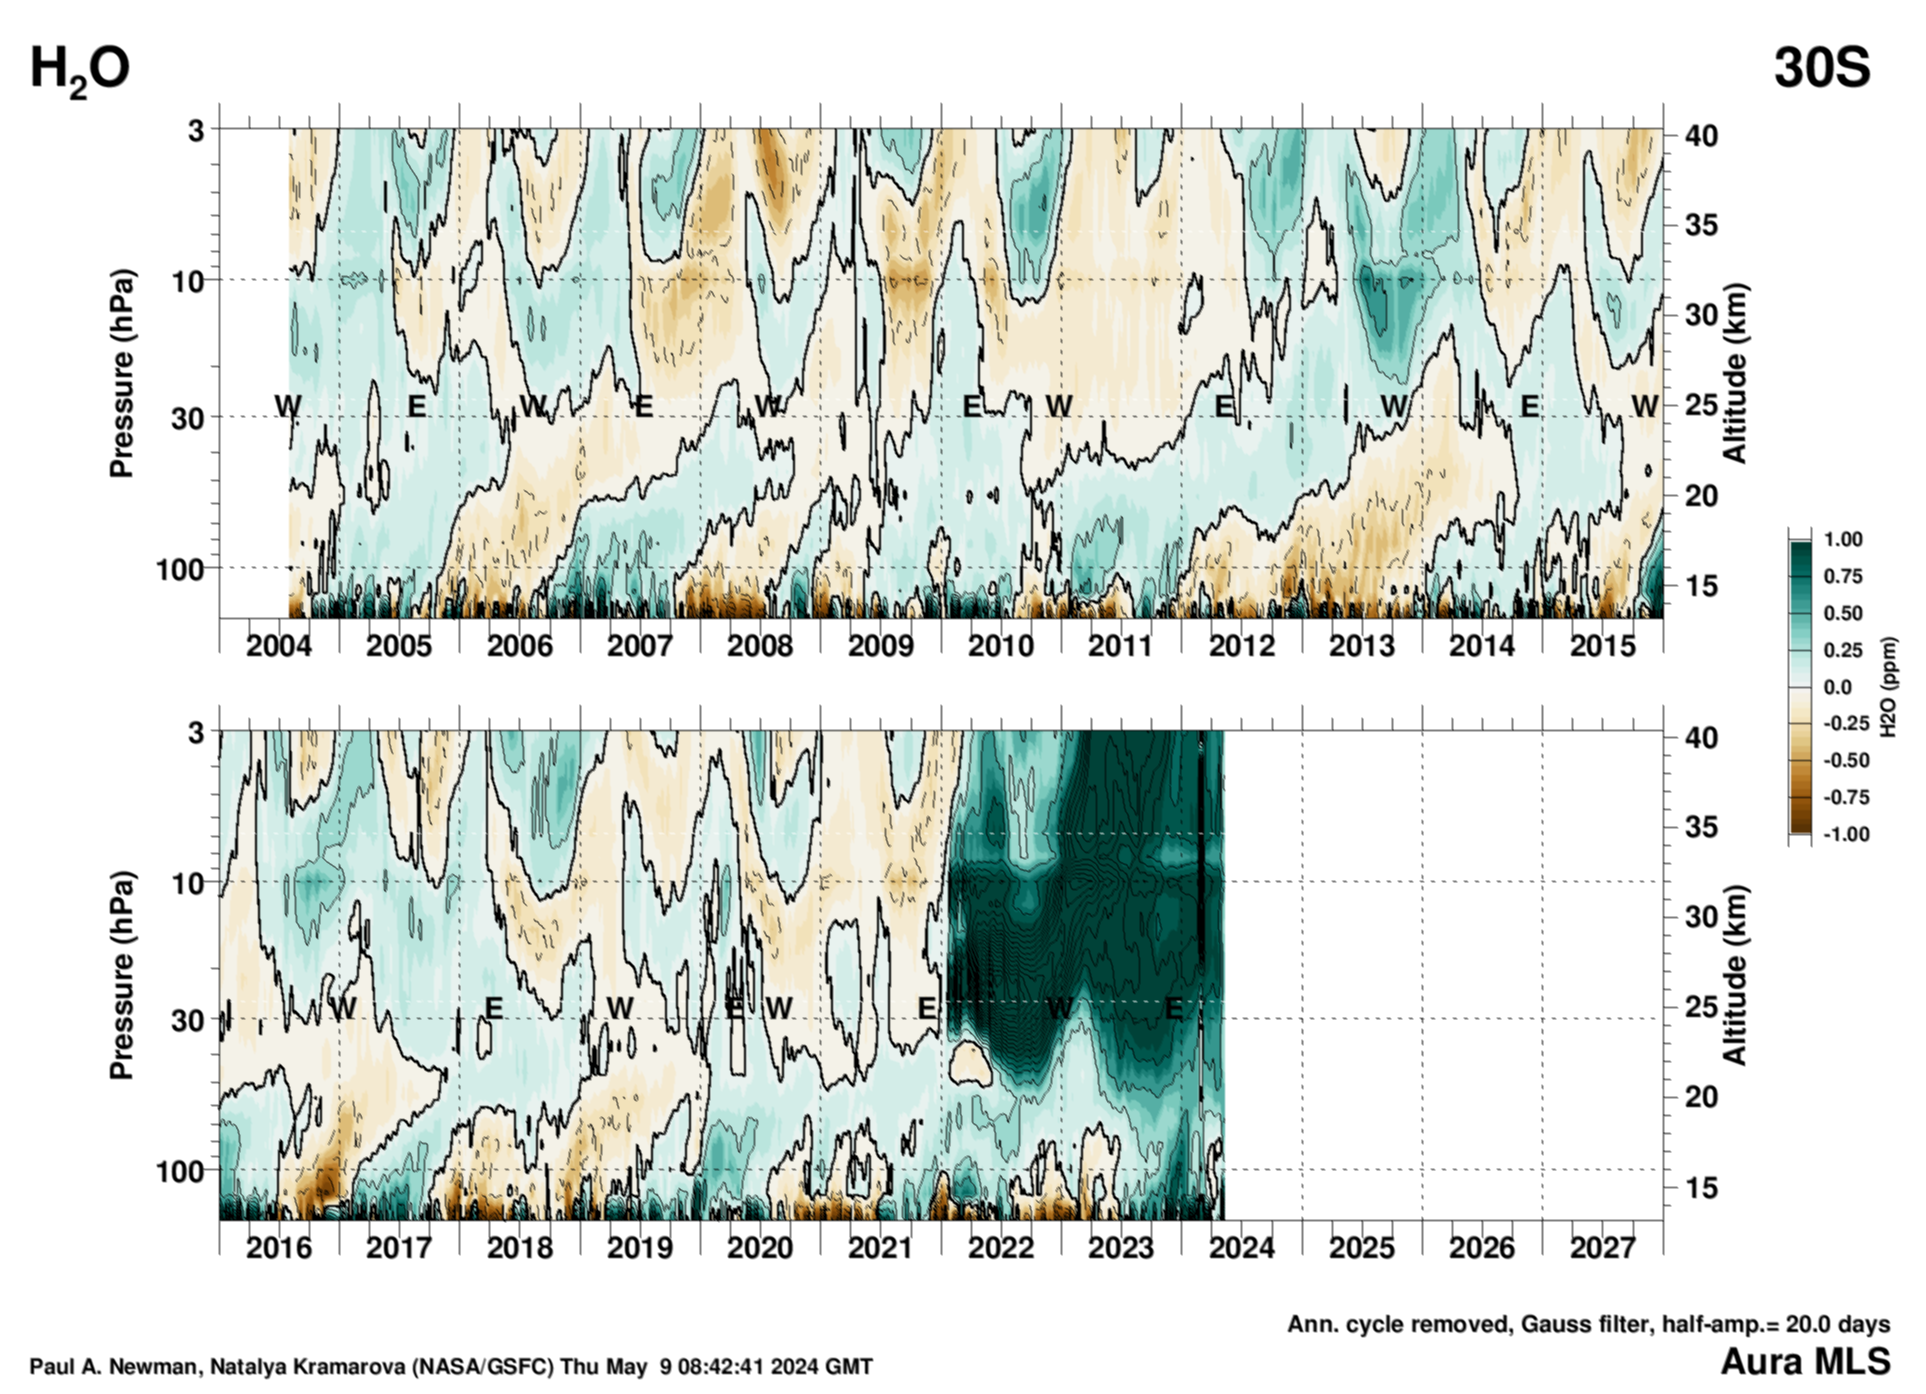
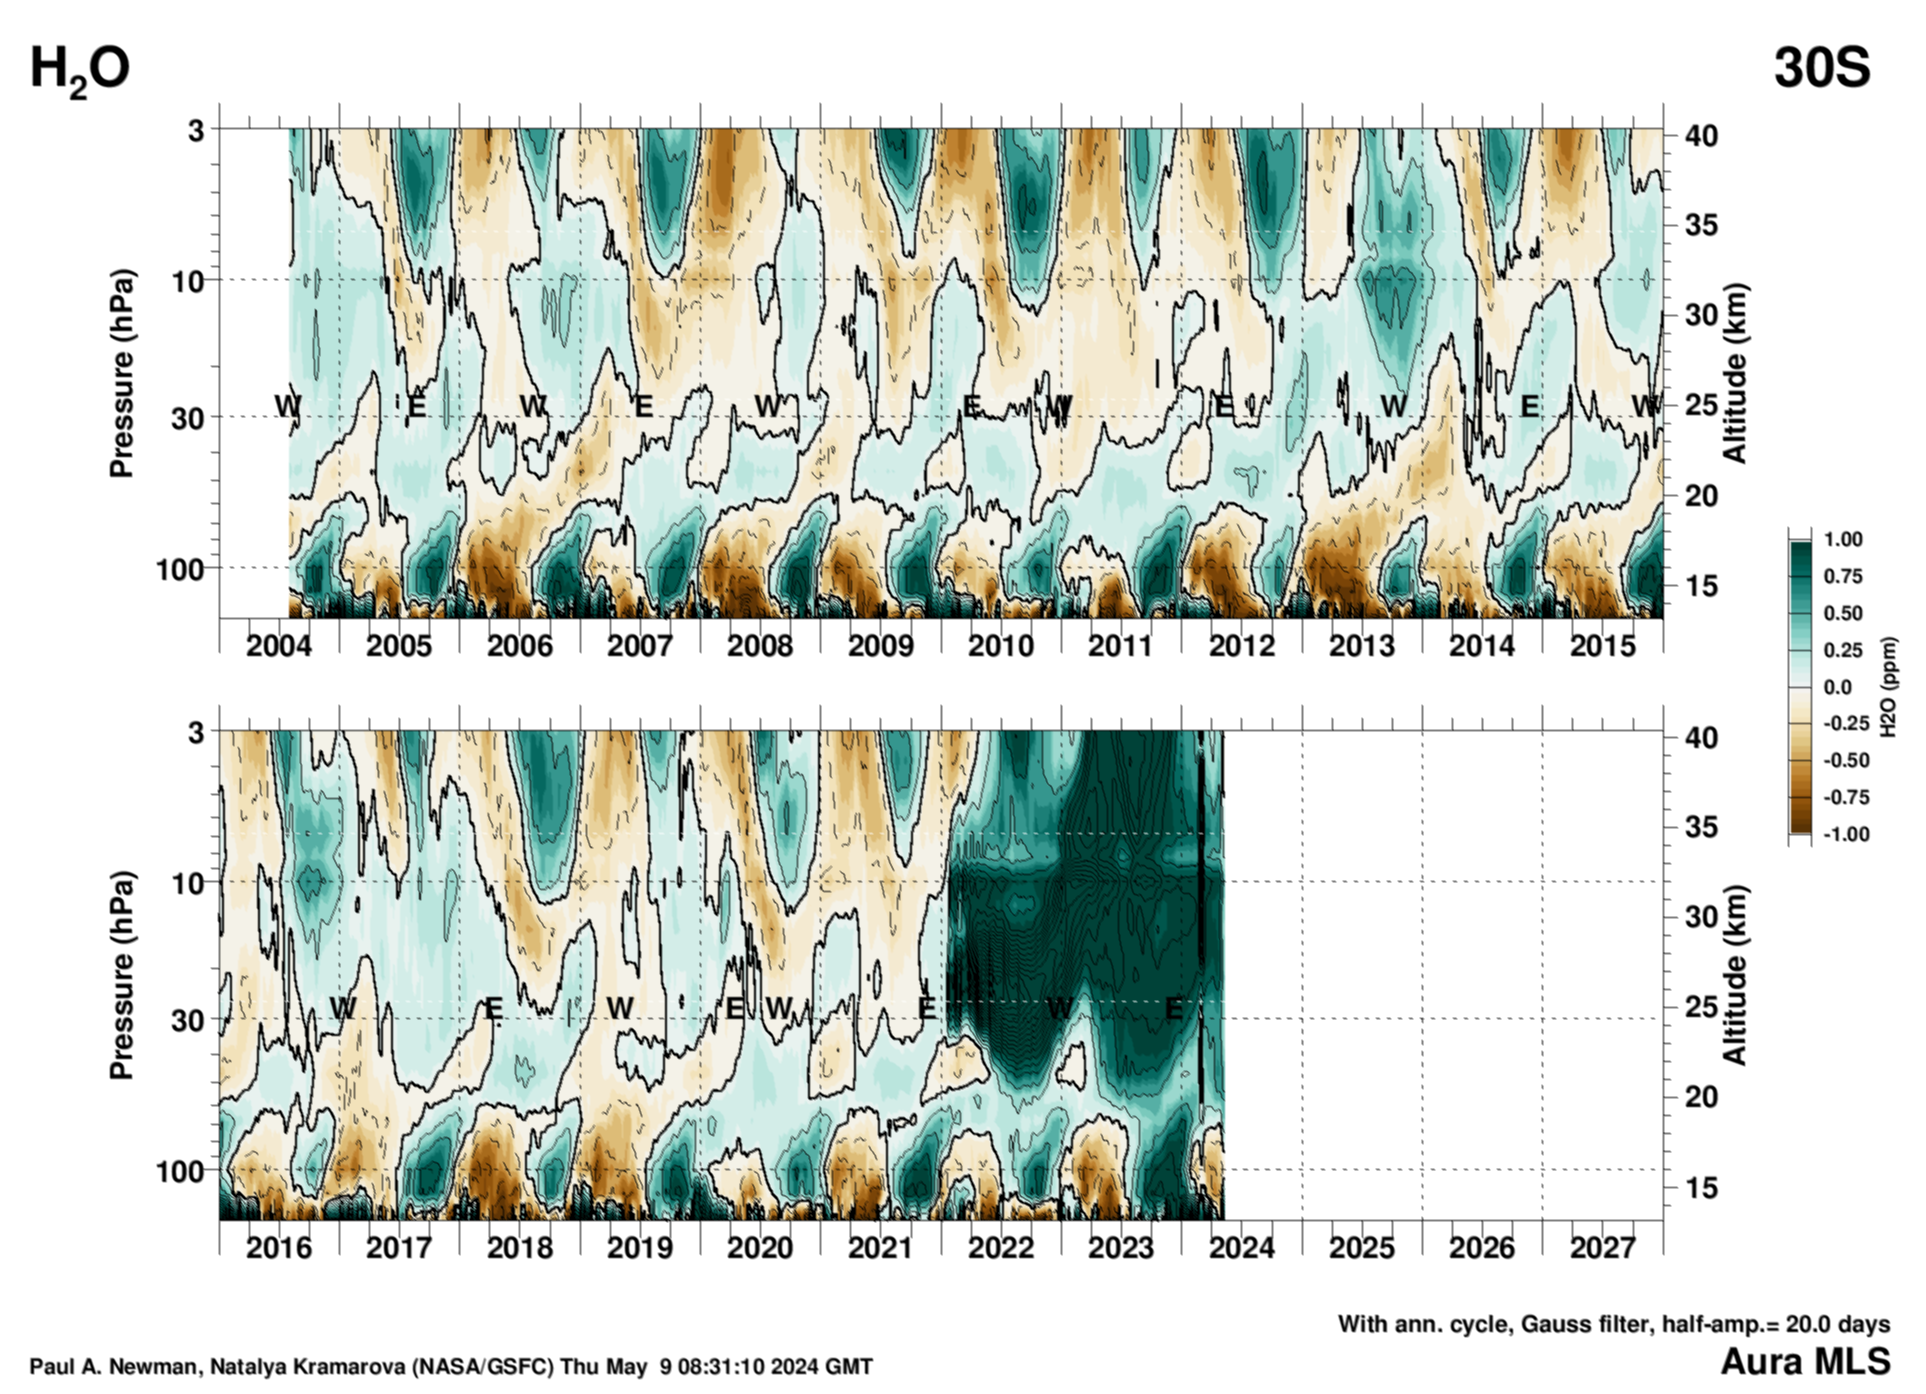
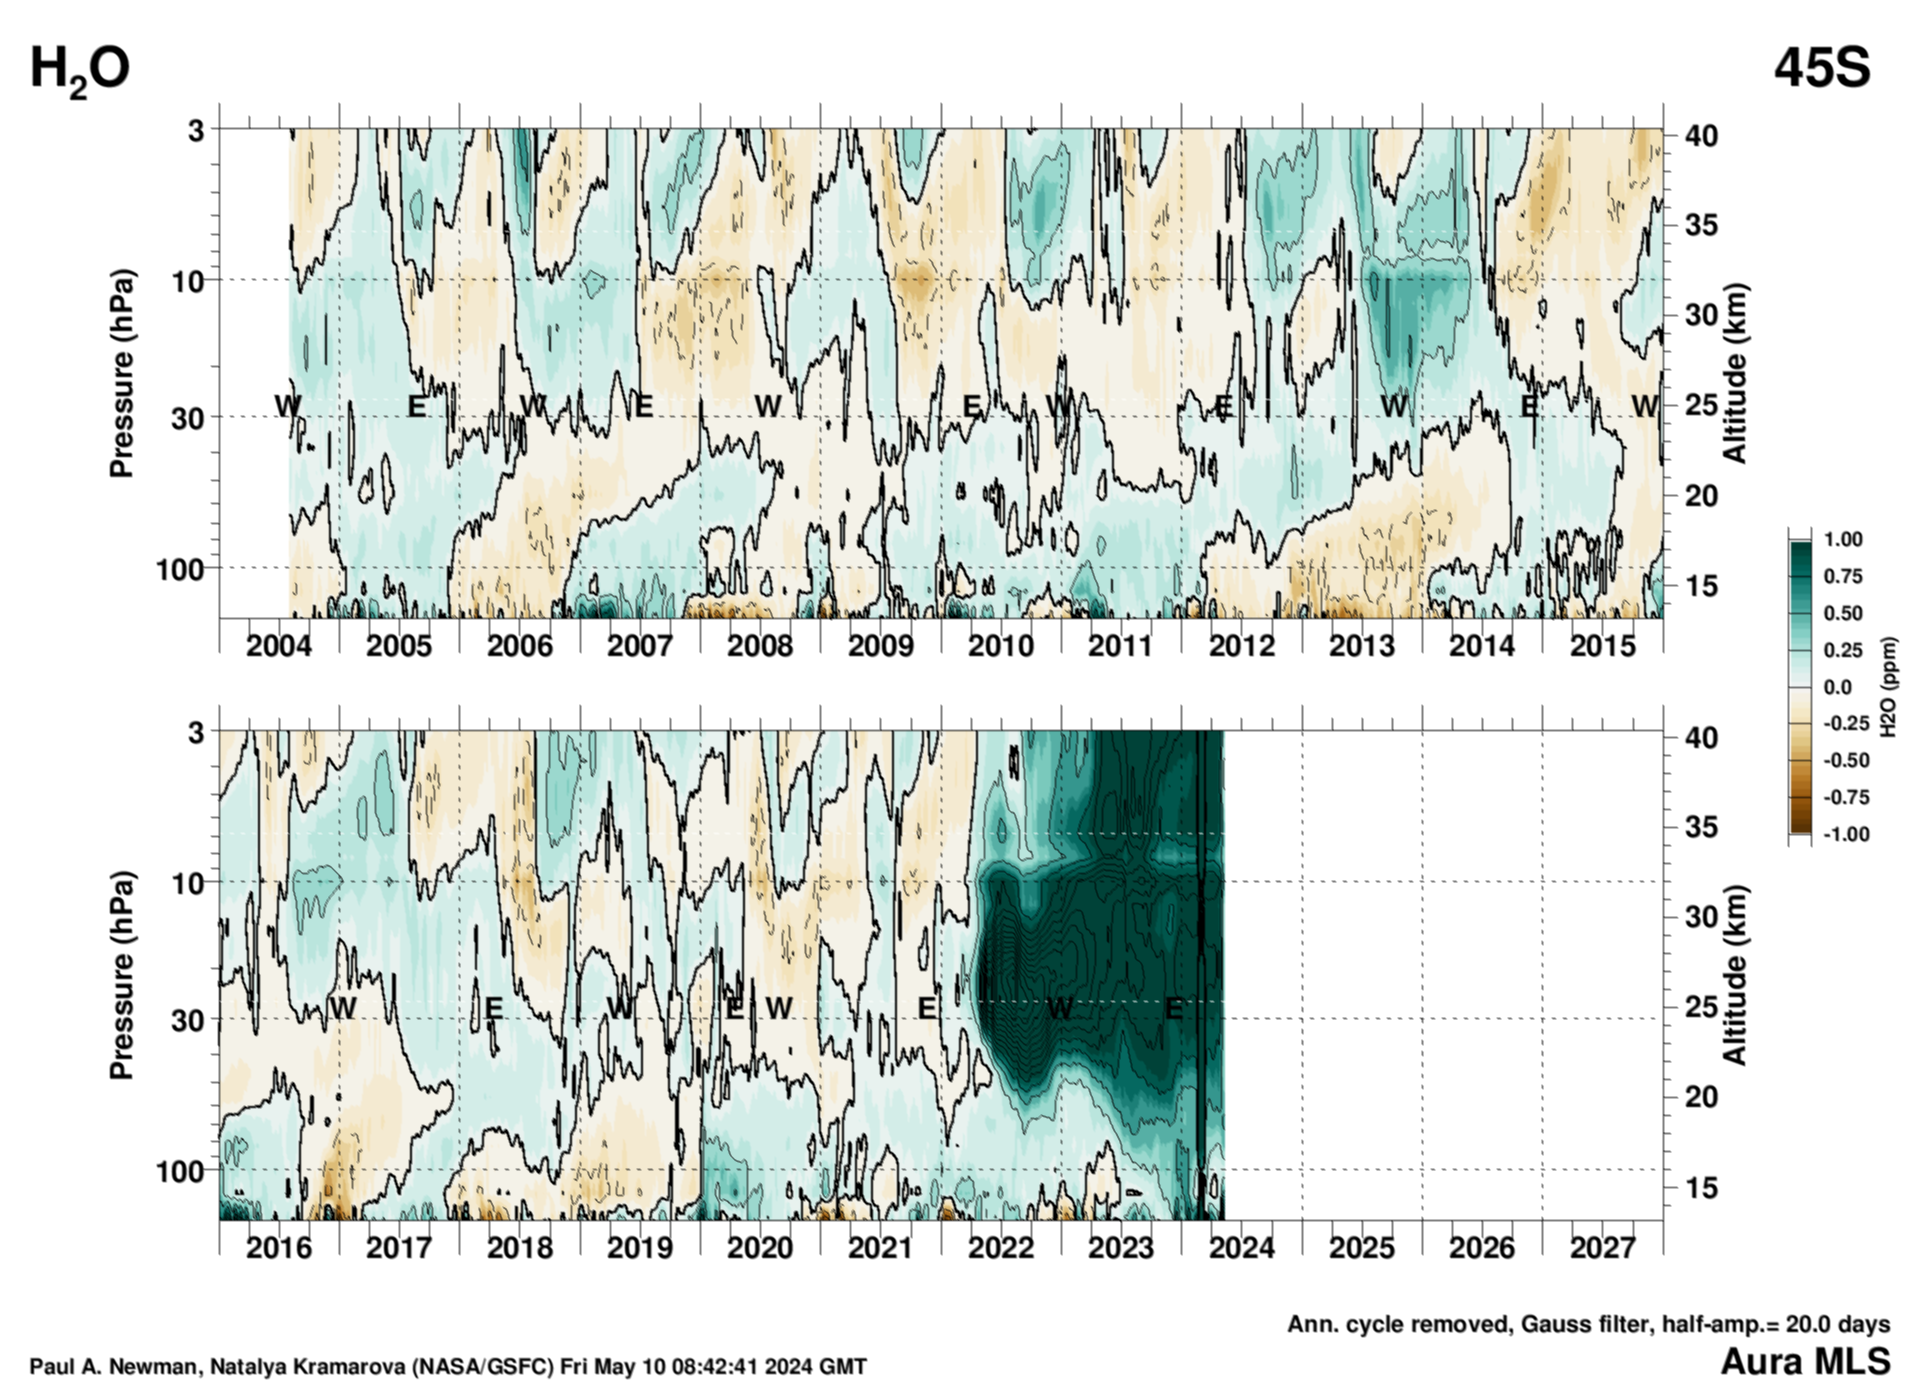
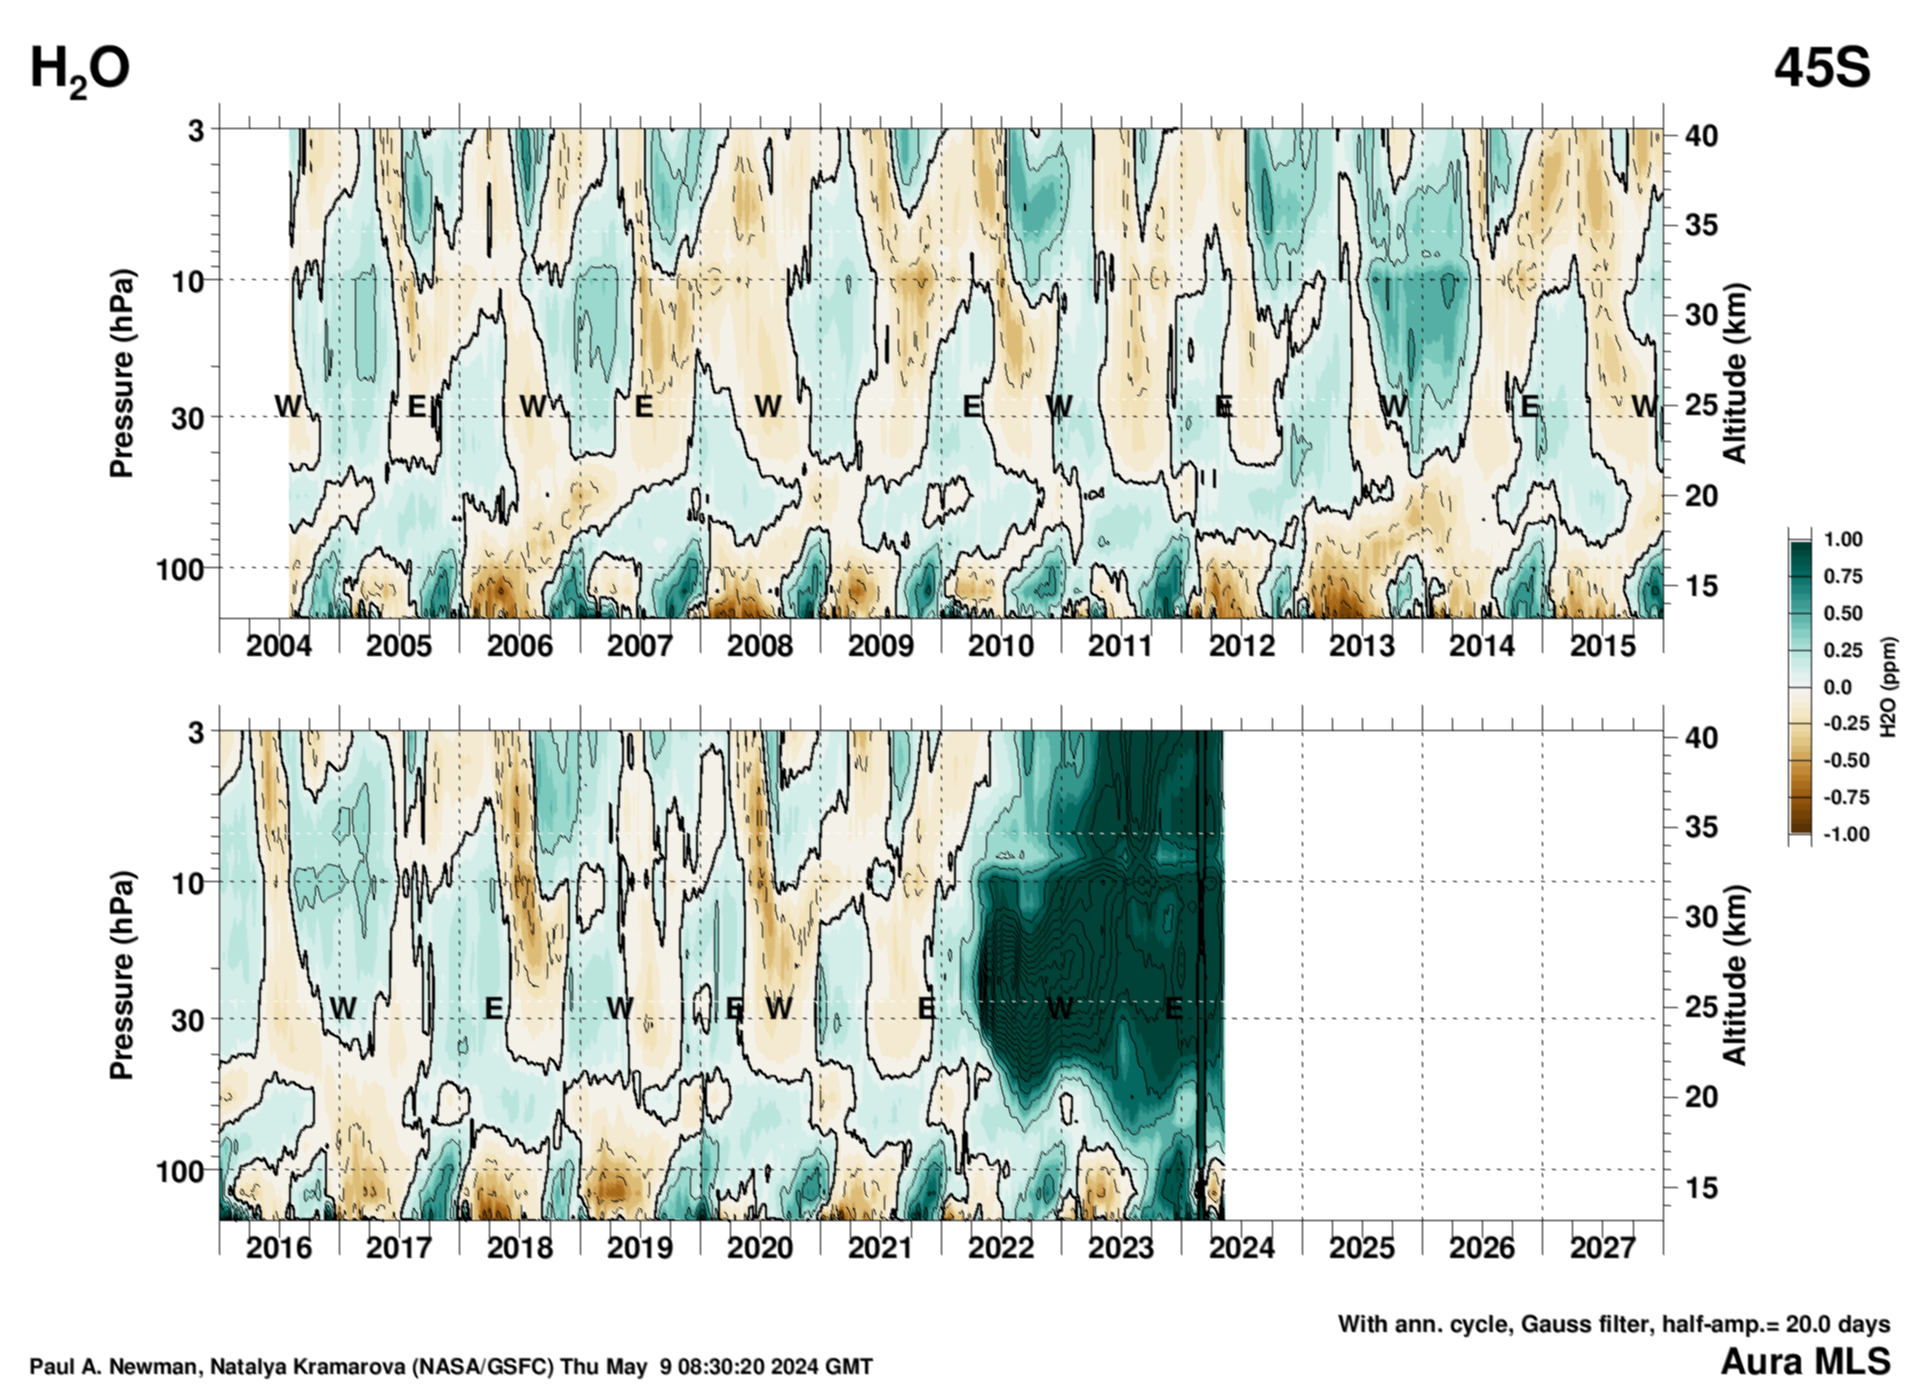
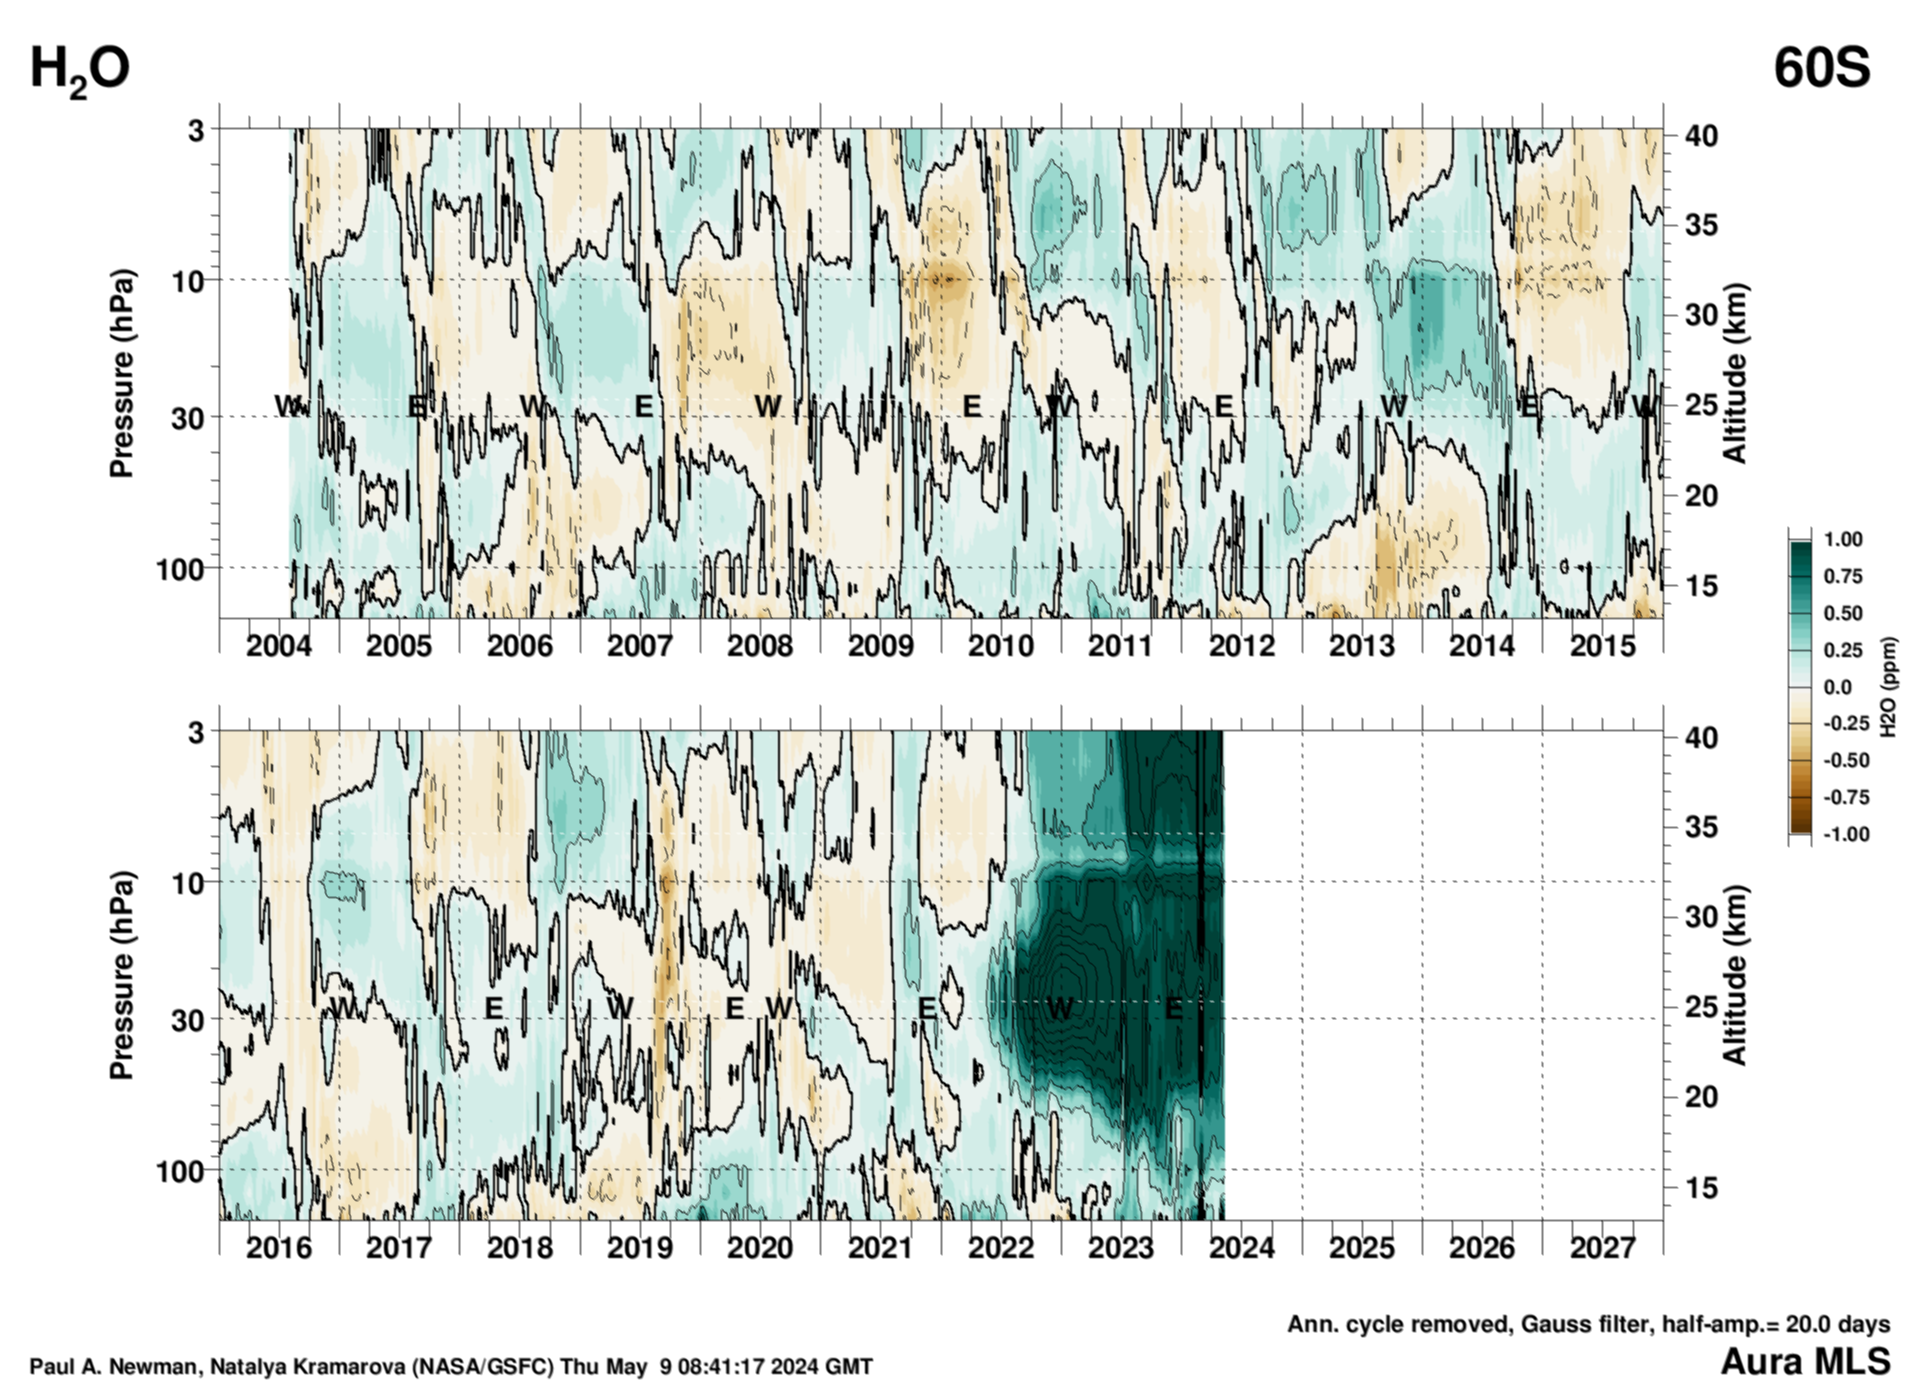
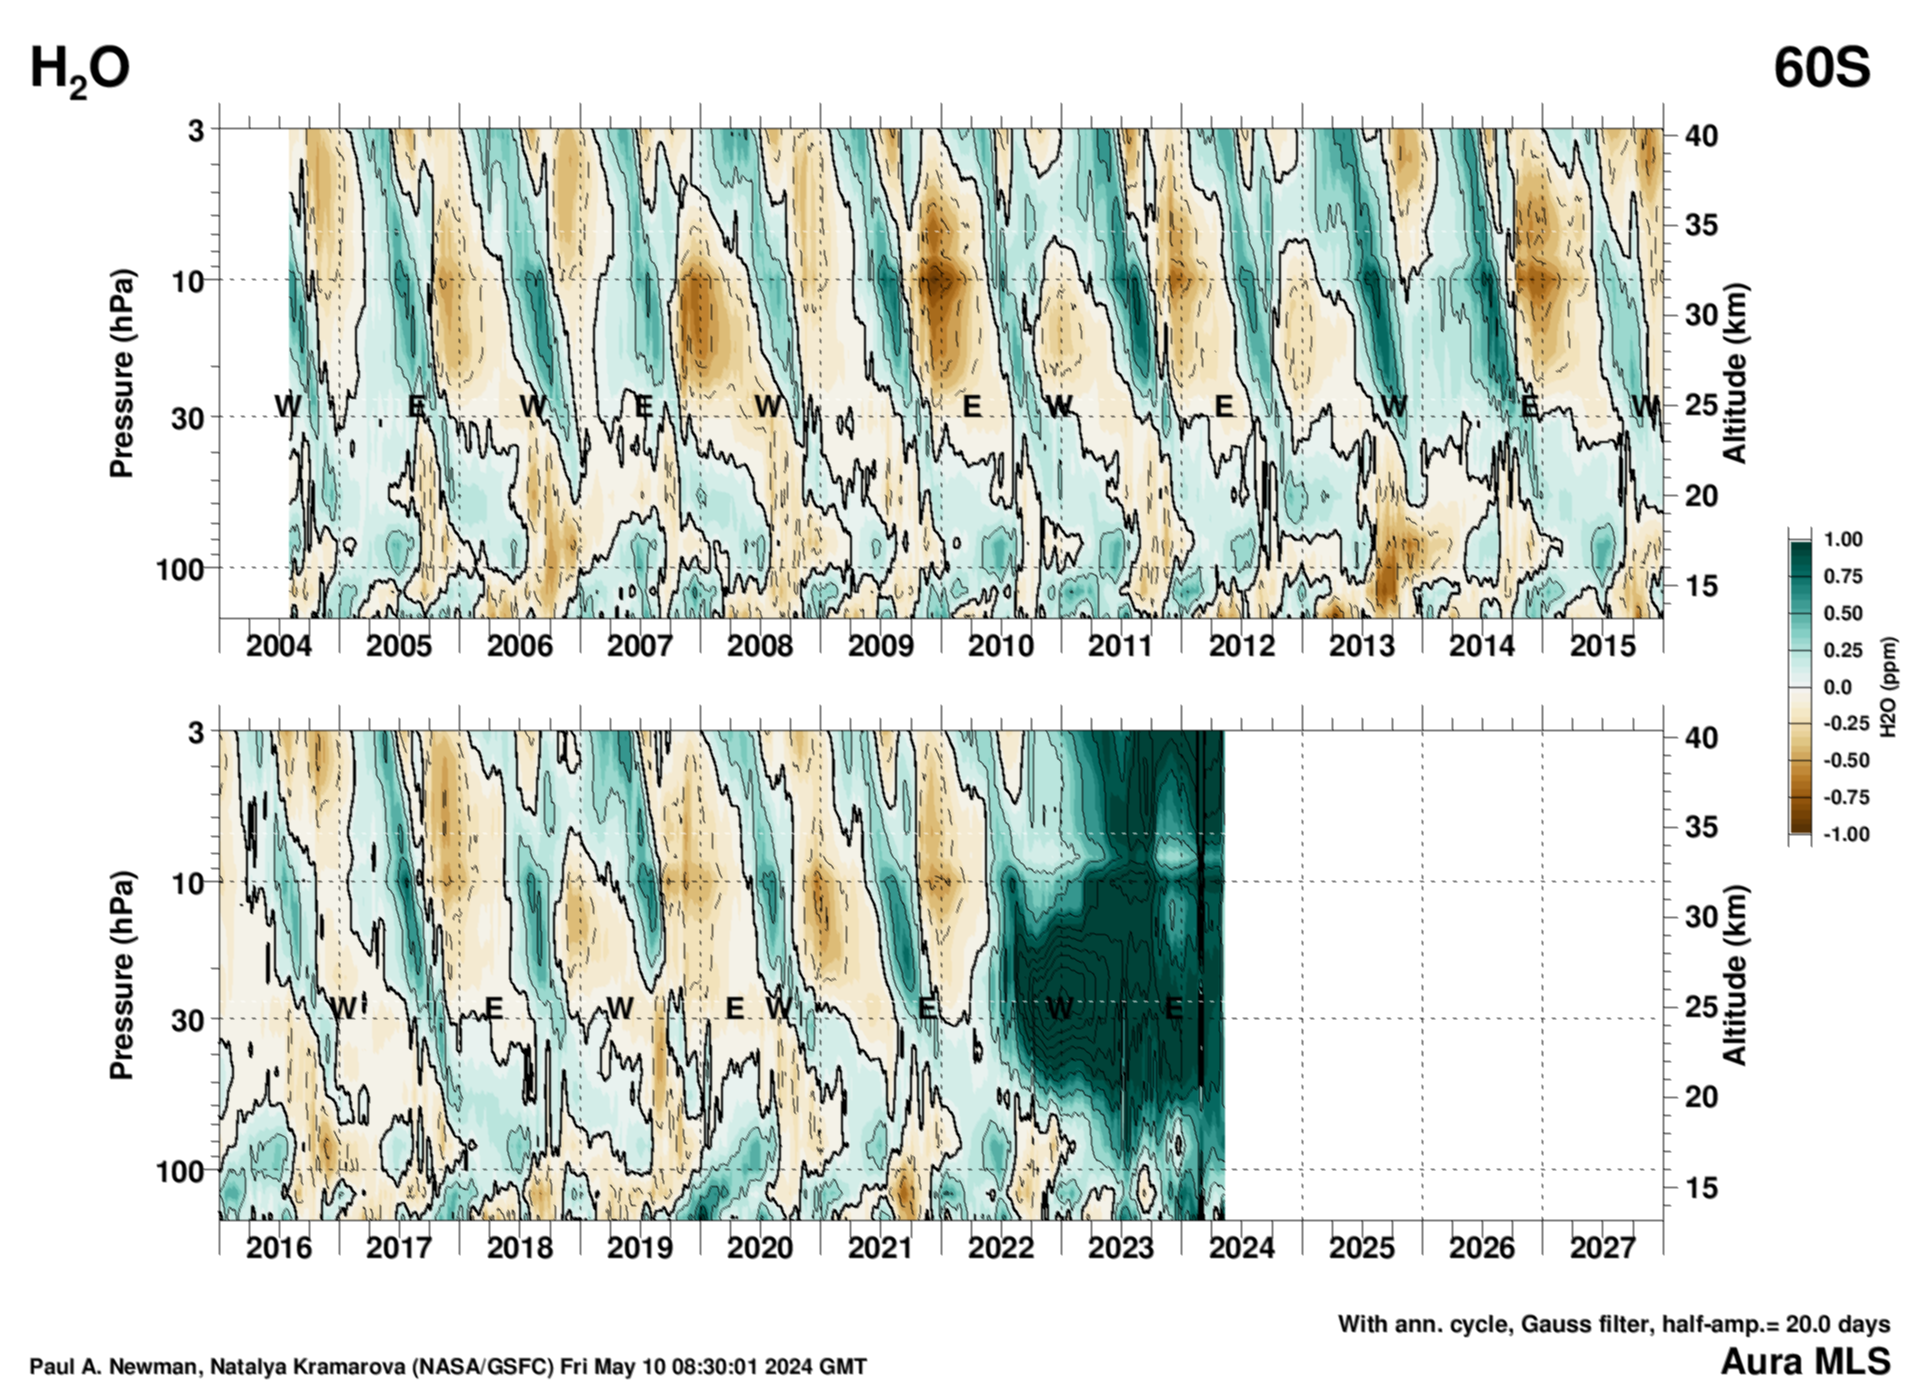
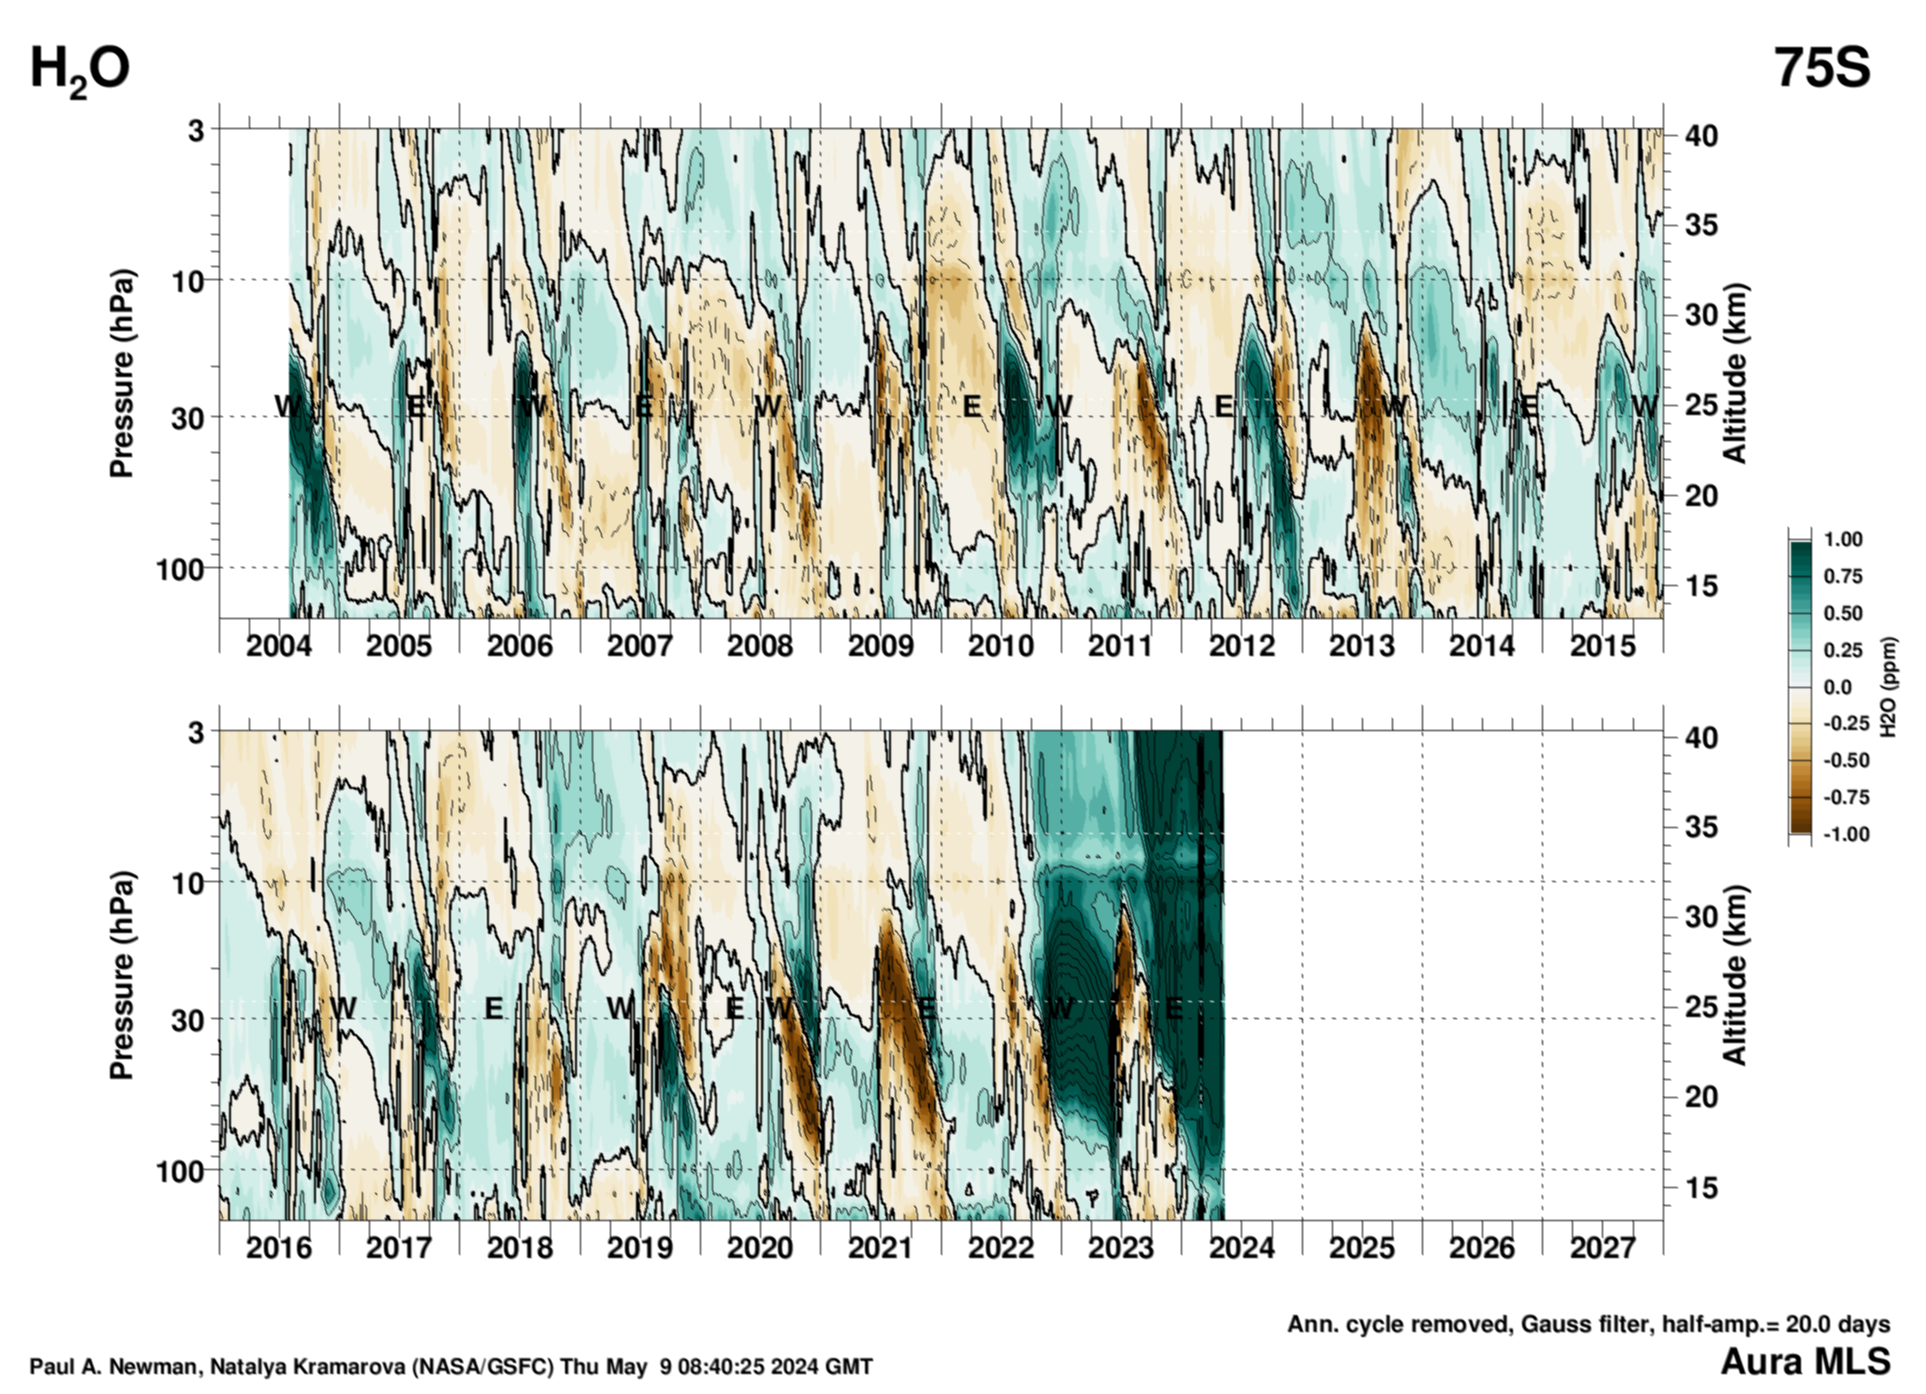
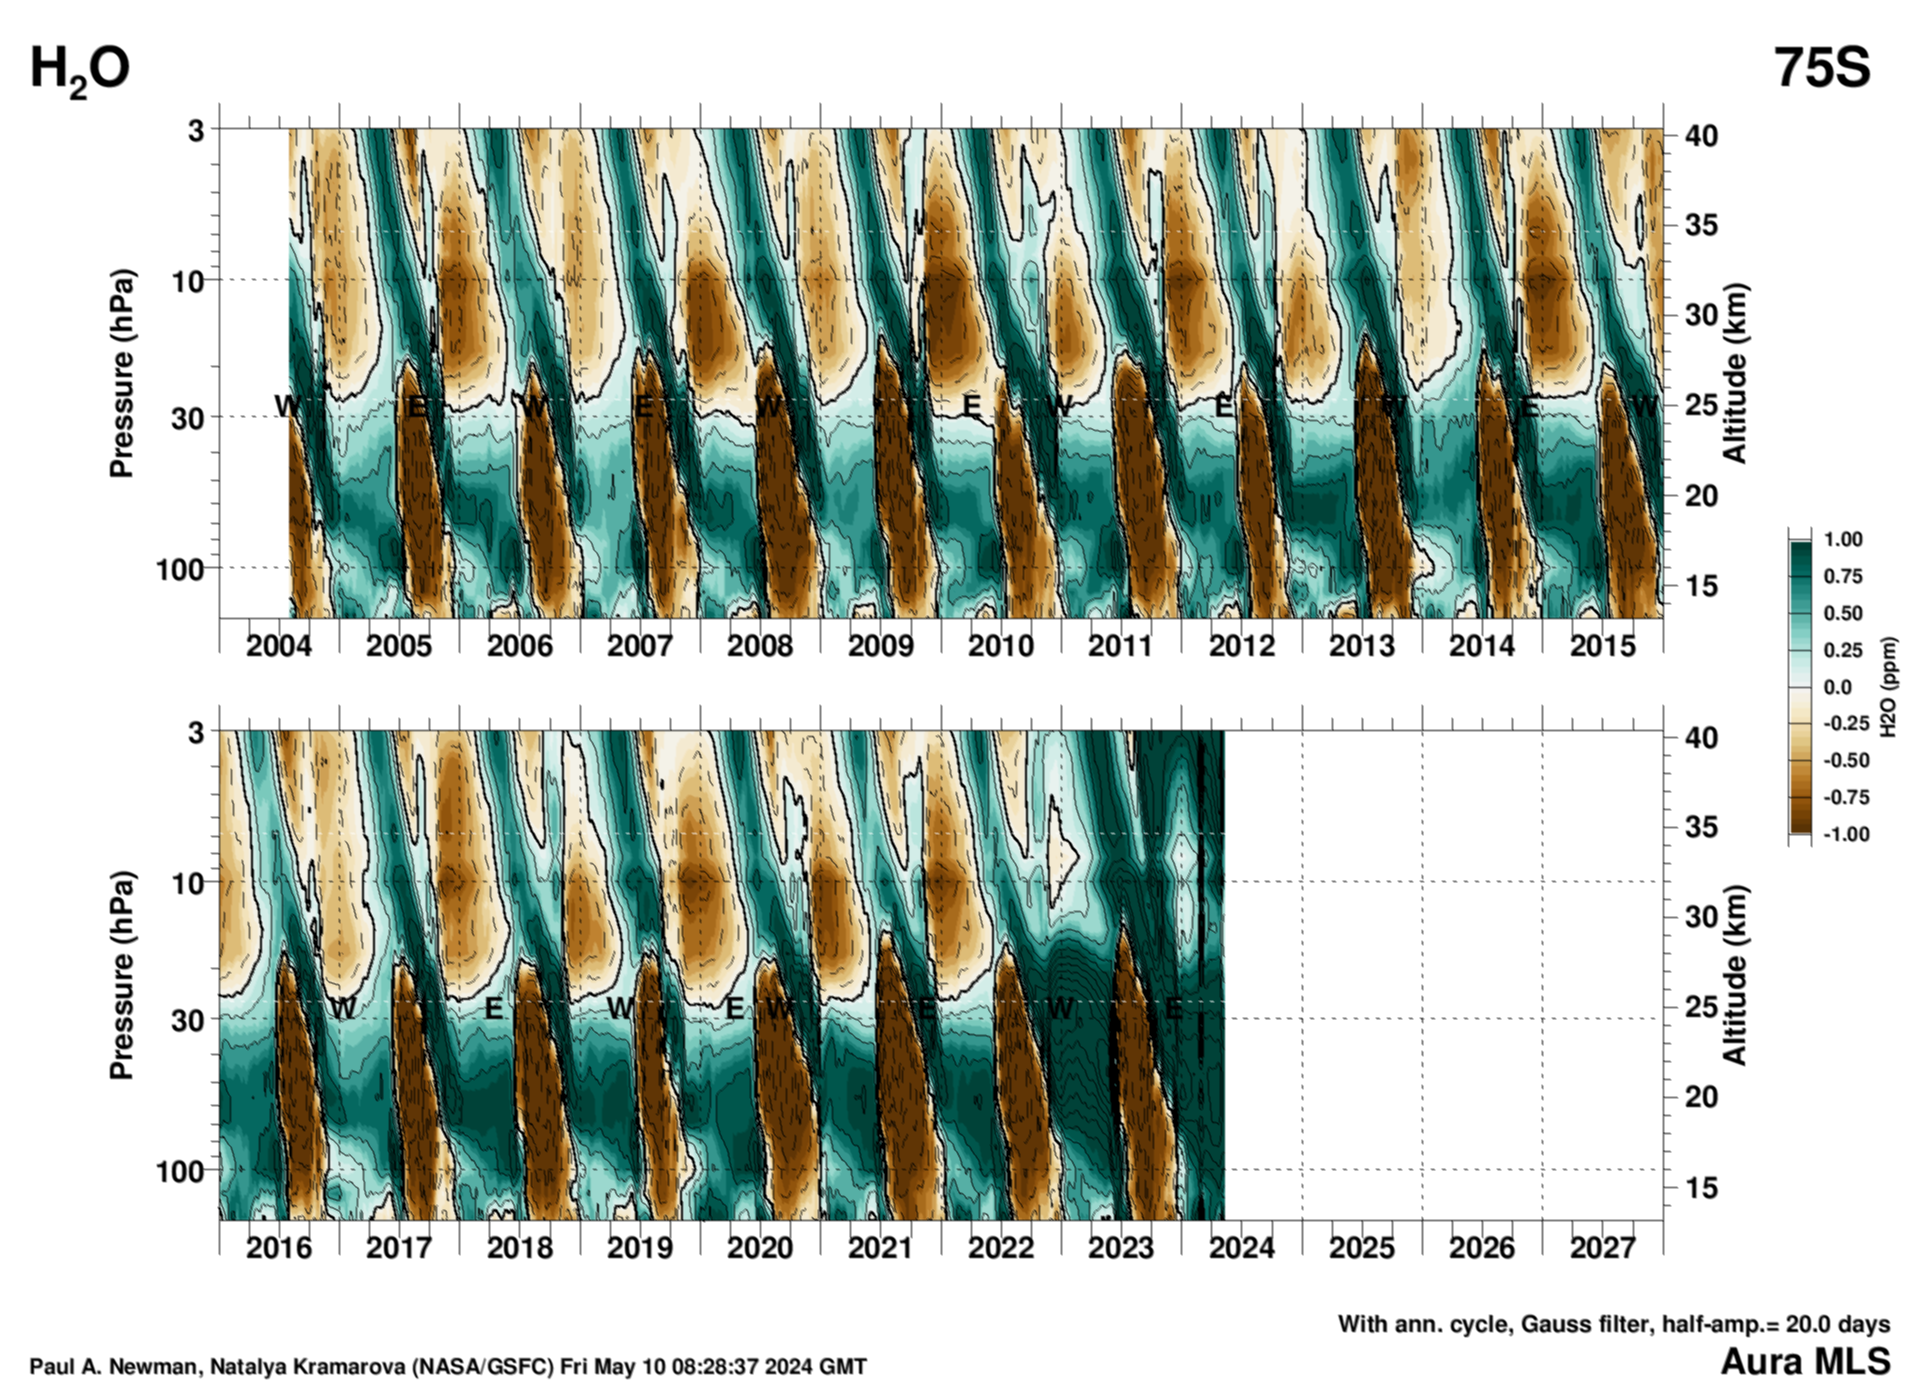
Water versus pressure
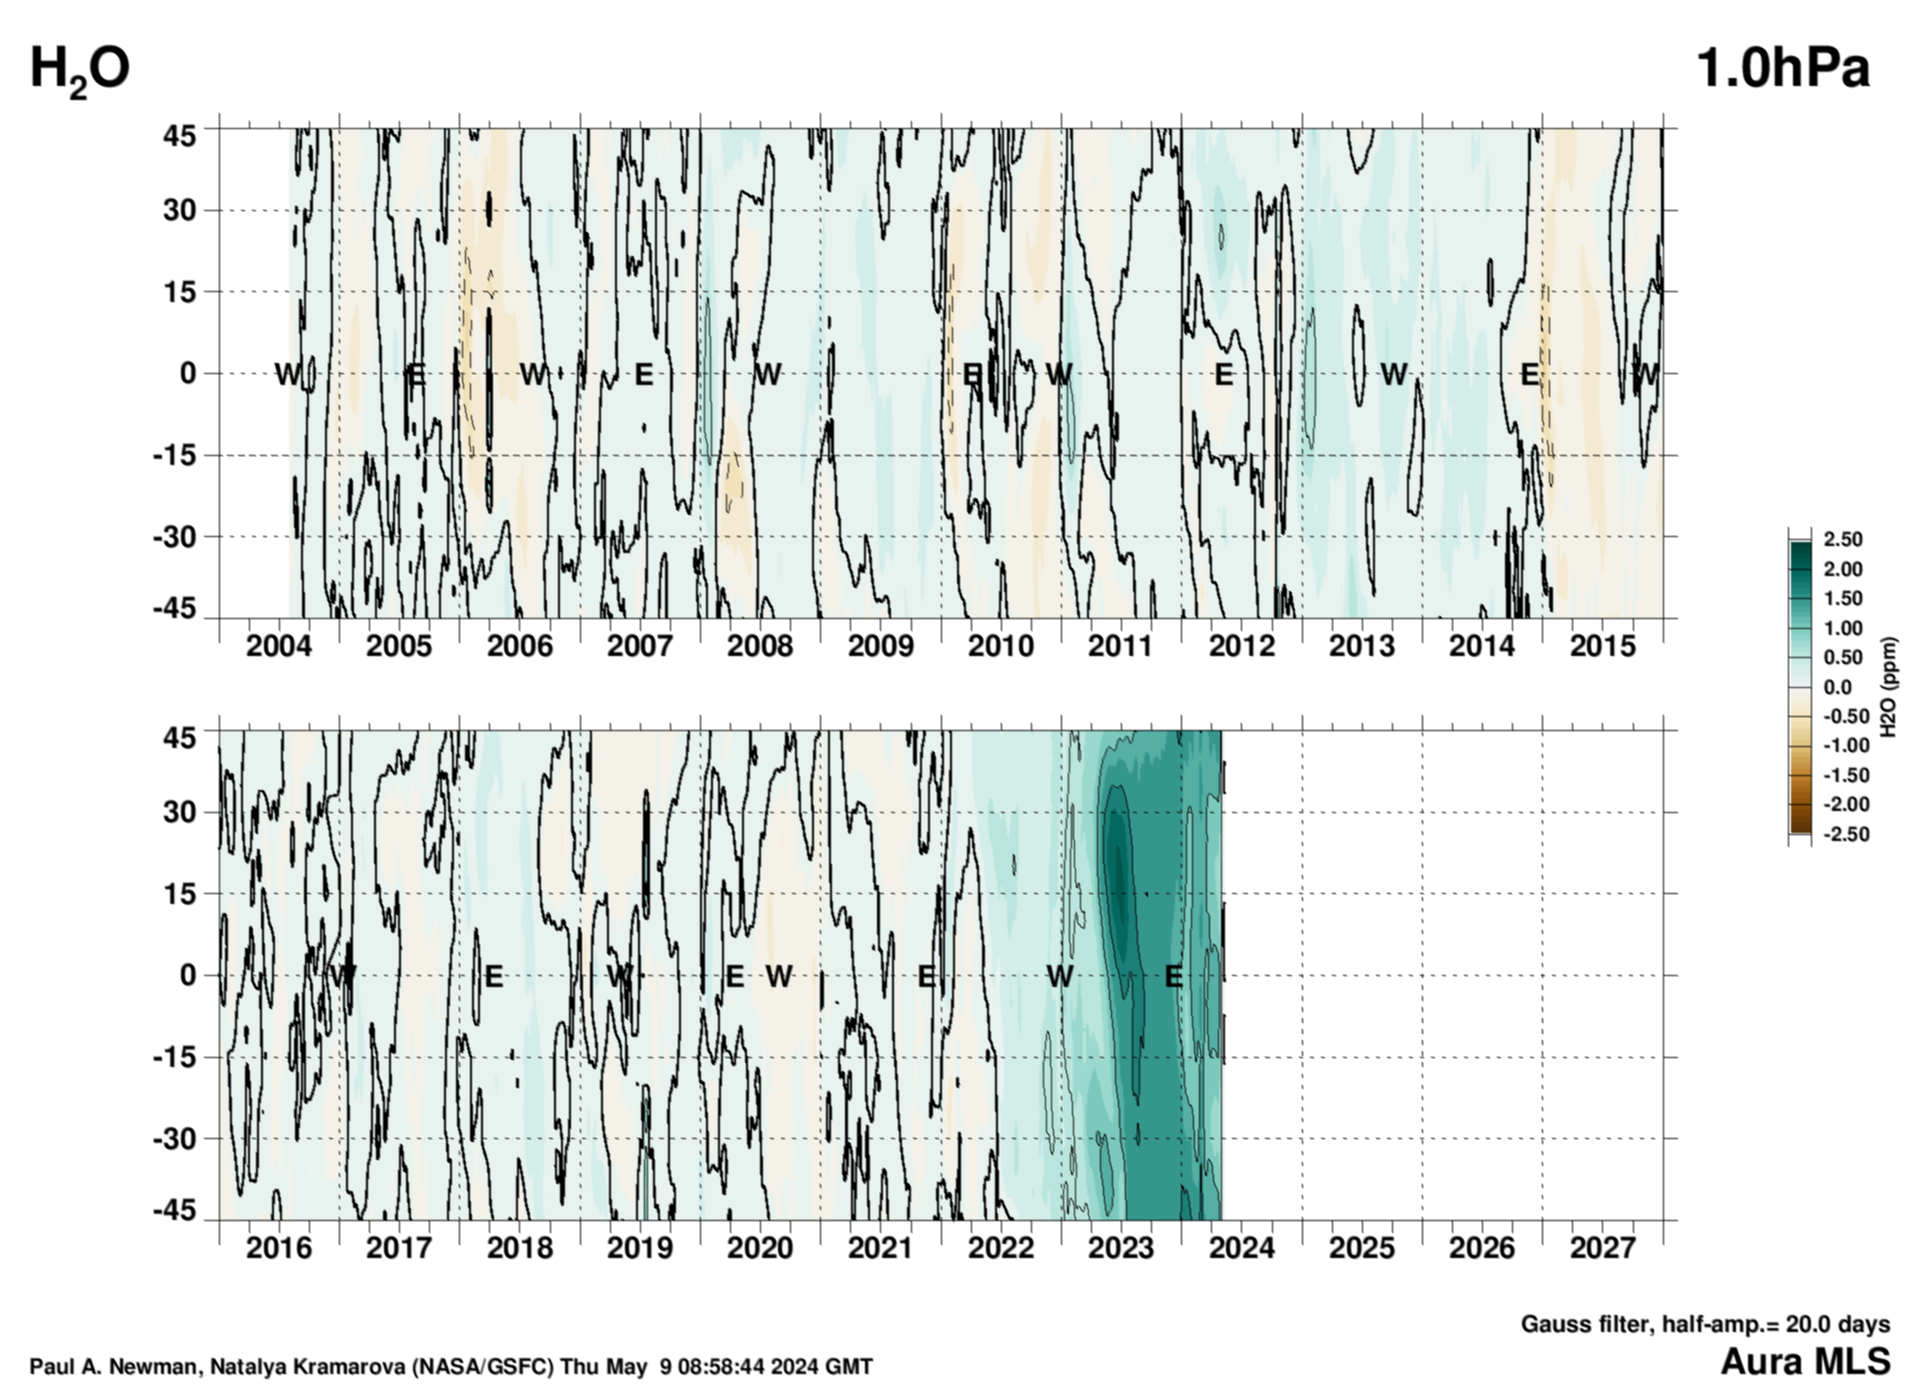
Water versus pressure at the equator from the NASA JPL Microwave Limb Sounder (MLS) on the NASA Aura satellite. Each day's MLS water is read, and all profiles within 2.5 degrees of the equator are averaged together to produce the daily water profiles. The annual cycle is subtracted from the profiles, and missed profiles are added by temporal linear interpolation. A Gaussian smoothing is applied (1/2 amplitude = 20 days) to remove higher frequency structure. The easterly (E) and westerly points are as shown in the Singapore zonal winds, and are derived (see text with EOF figure) from the EOF-1 and EOF-2 phase diagram above. Units are parts per million (ppm).
| Without Annual Cycle | With Annual Cycle | |||
|---|---|---|---|---|
| PNG | PNG | |||
| 75N | x | x | x | x |
| 60N | x | x | x | x |
| 45N | x | x | x | x |
| 30N | x | x | x | x |
| 15N | x | x | x | x |
| Eq. | x | x | x | x |
| 15S | x | x | x | x |
| 30S | x | x | x | x |
| 45S | x | x | x | x |
| 60S | x | x | x | x |
| 75S | x | x | x | x |

- NASA Official: Dr. Paul Newman
- Web Content: Dr. Paul Newman
- Last Updated: 2019-06-10