
| Plot | 2017-01-11 | 2017-01-24 | 2017-01-26 | 2017-01-29 | 2017-02-01 | 2017-02-03 | 2017-02-05 | 2017-02-10 | 2017-02-13 | 2017-02-15 | 2017-02-18 | 2017-02-19 | 2017-02-21 | Plot |
|---|---|---|---|---|---|---|---|---|---|---|---|---|---|---|
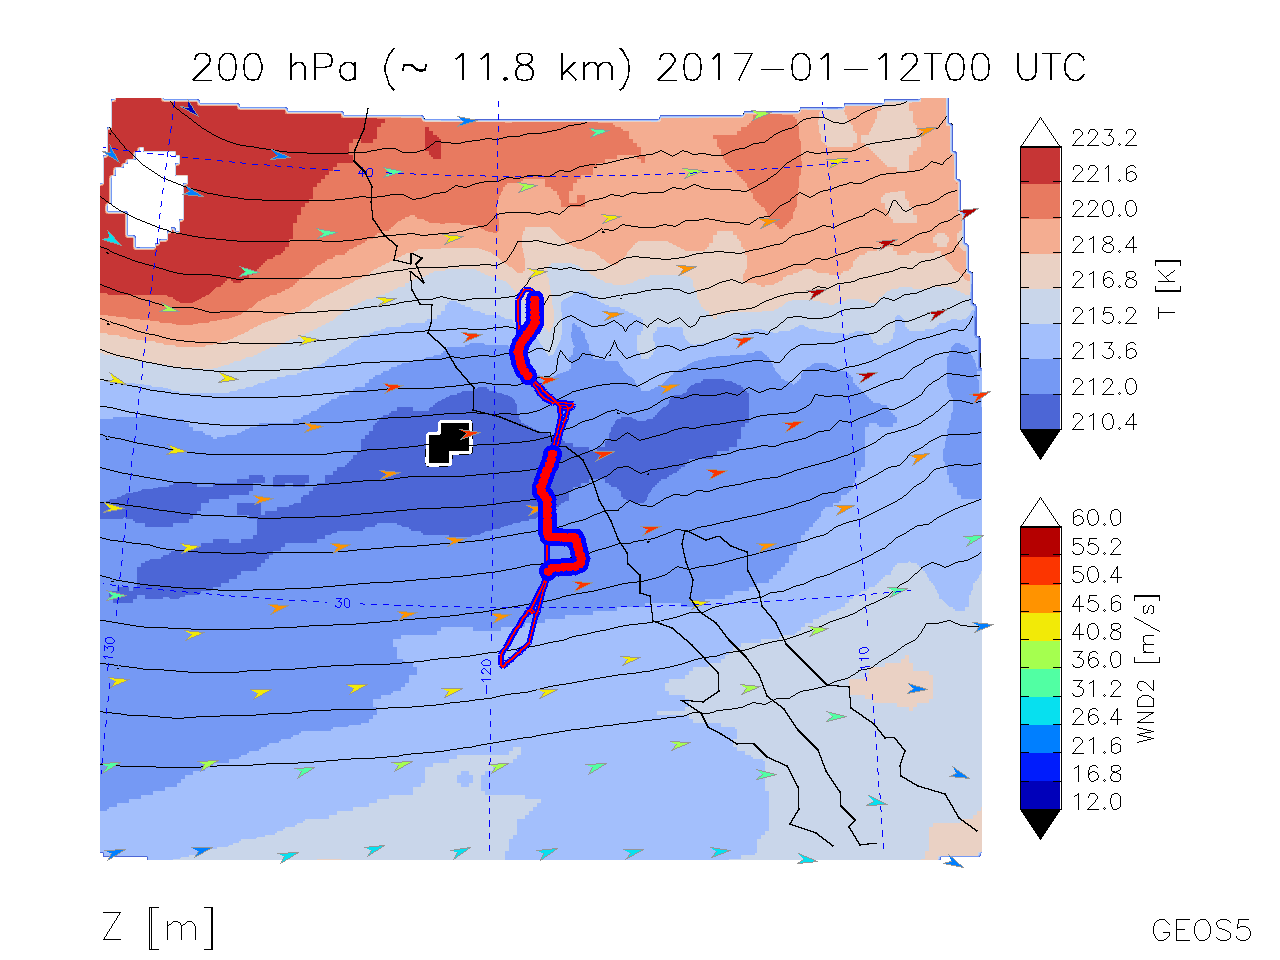
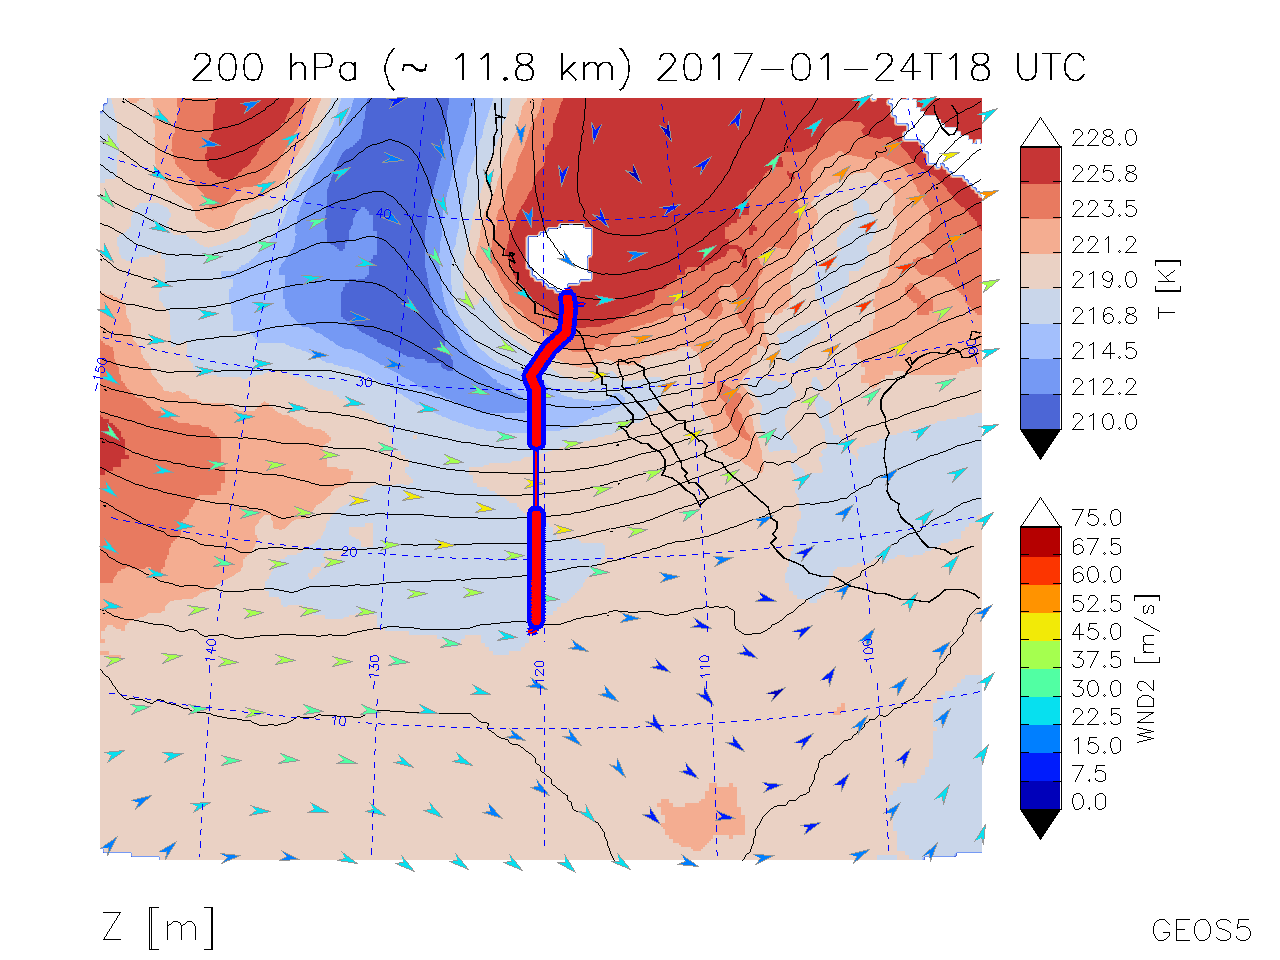
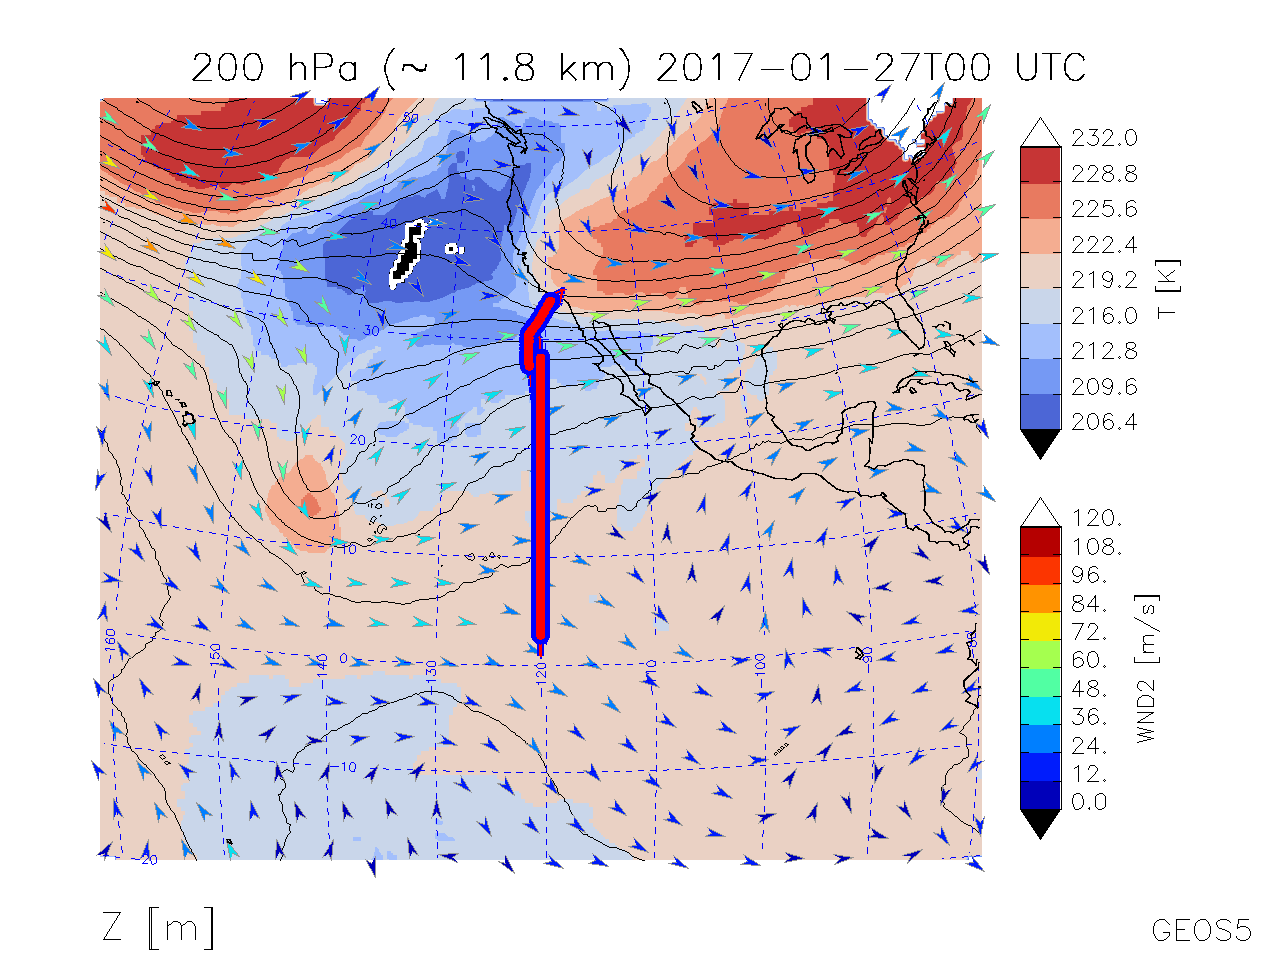
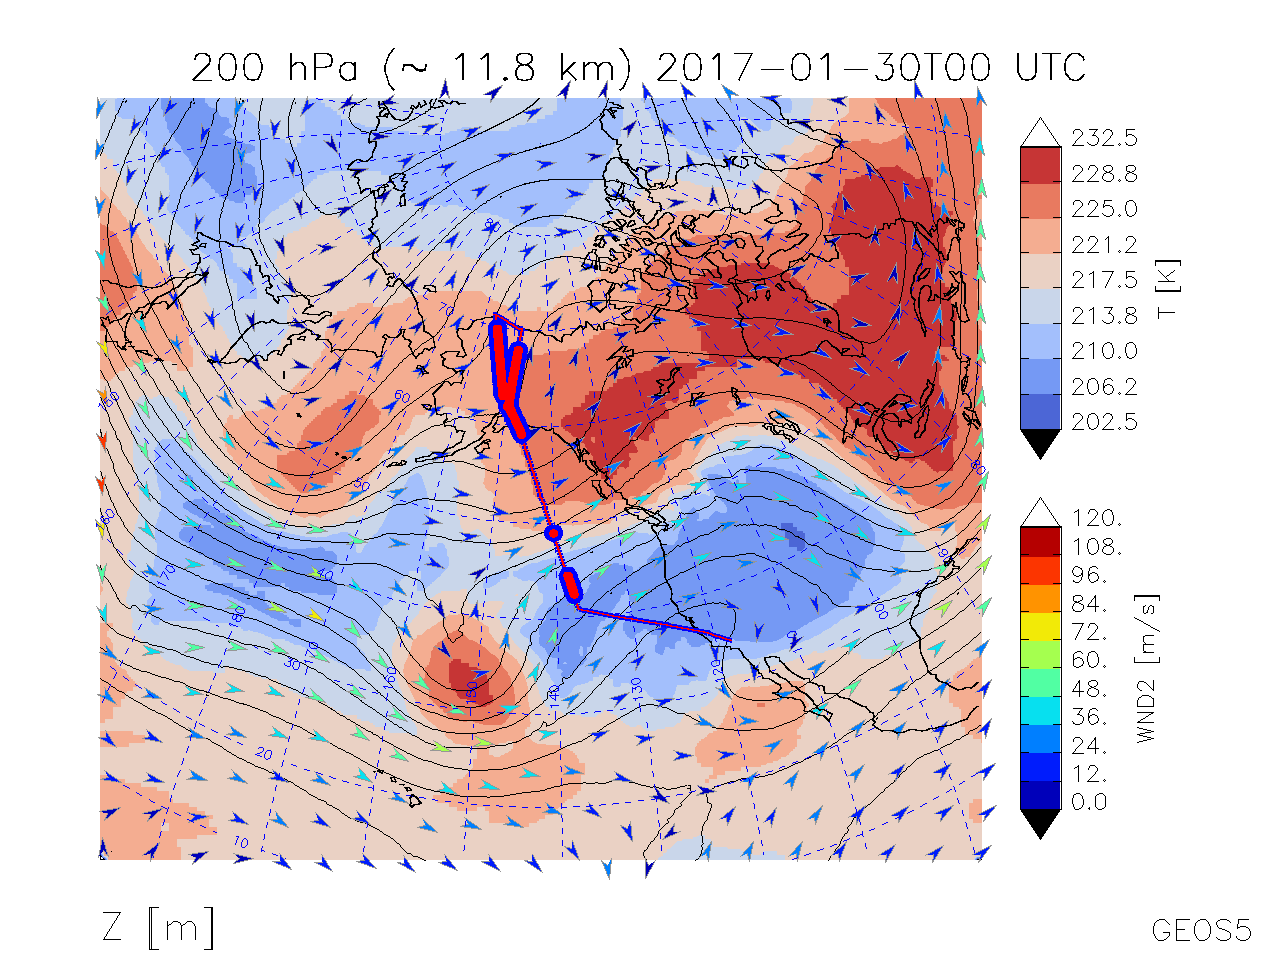
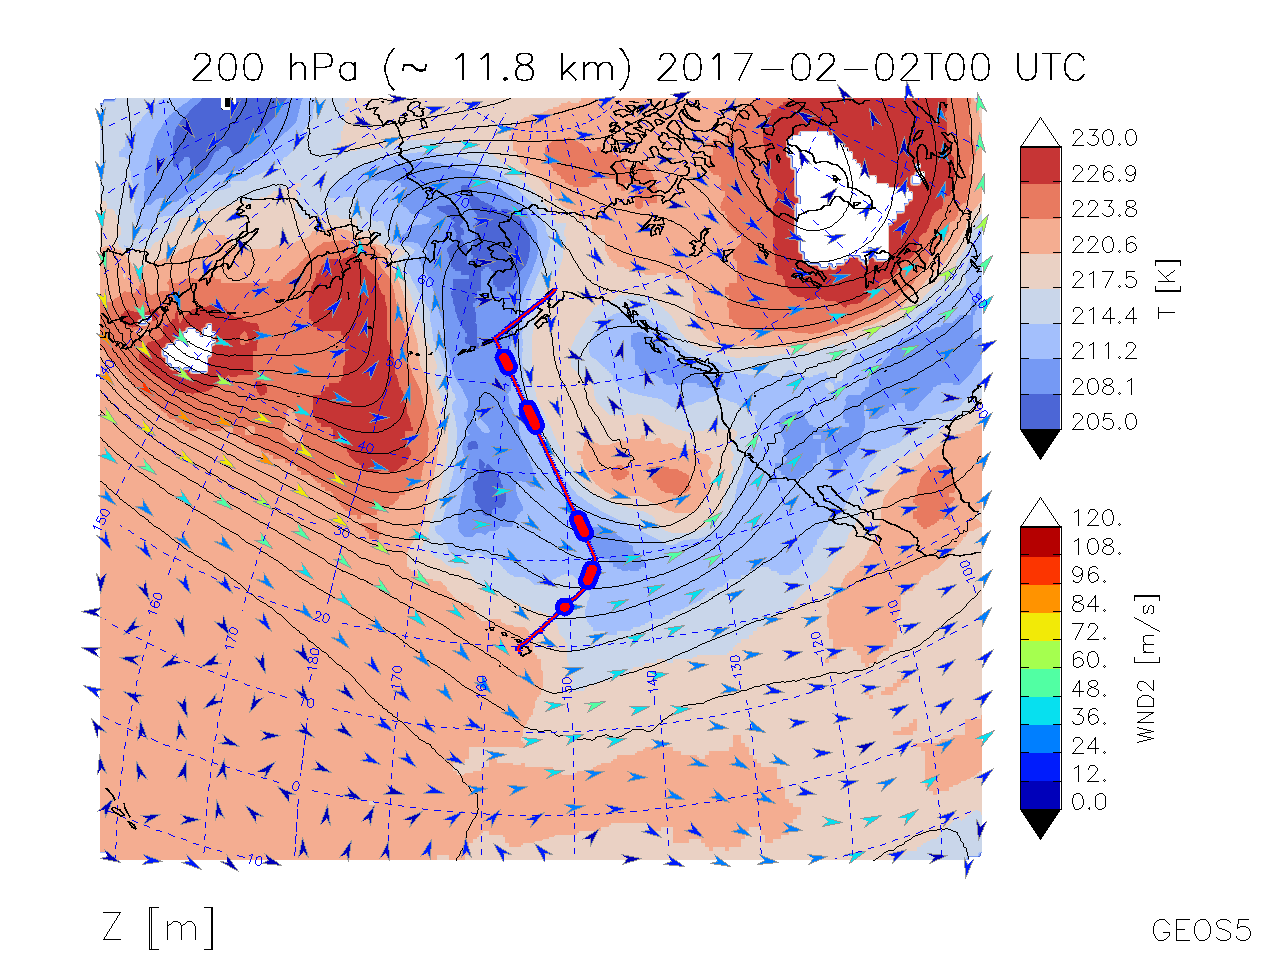
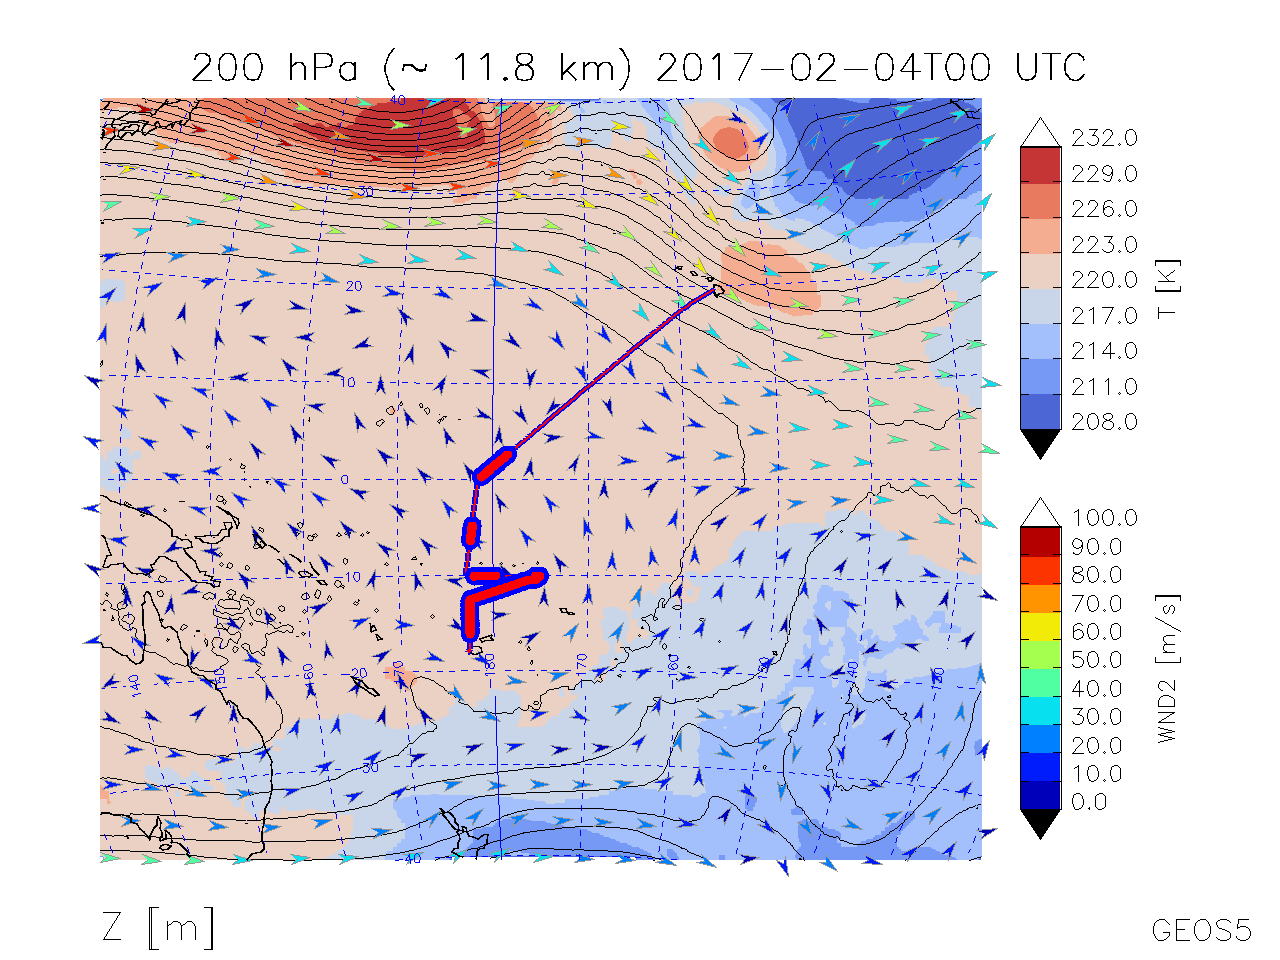
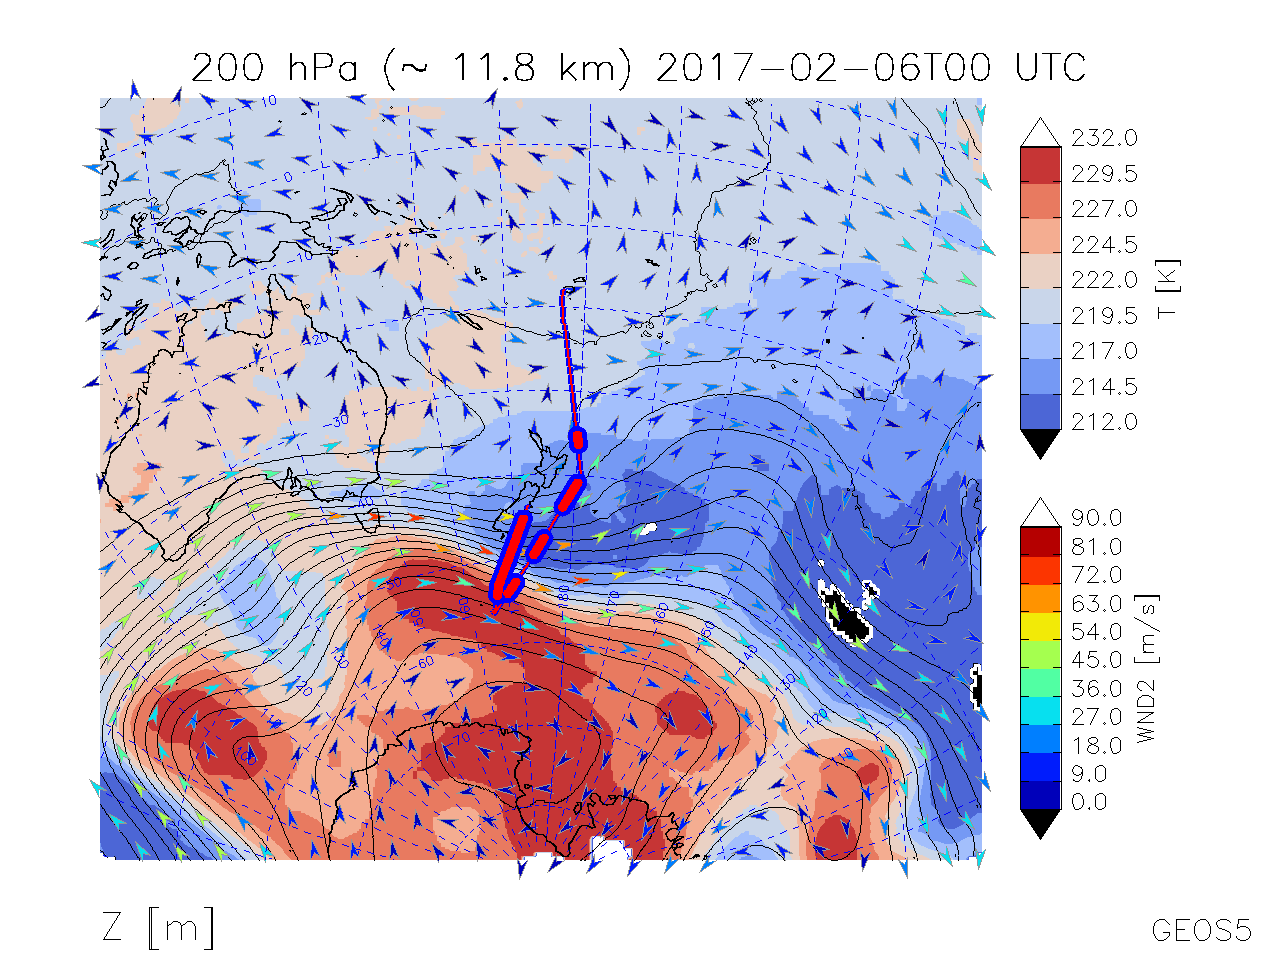
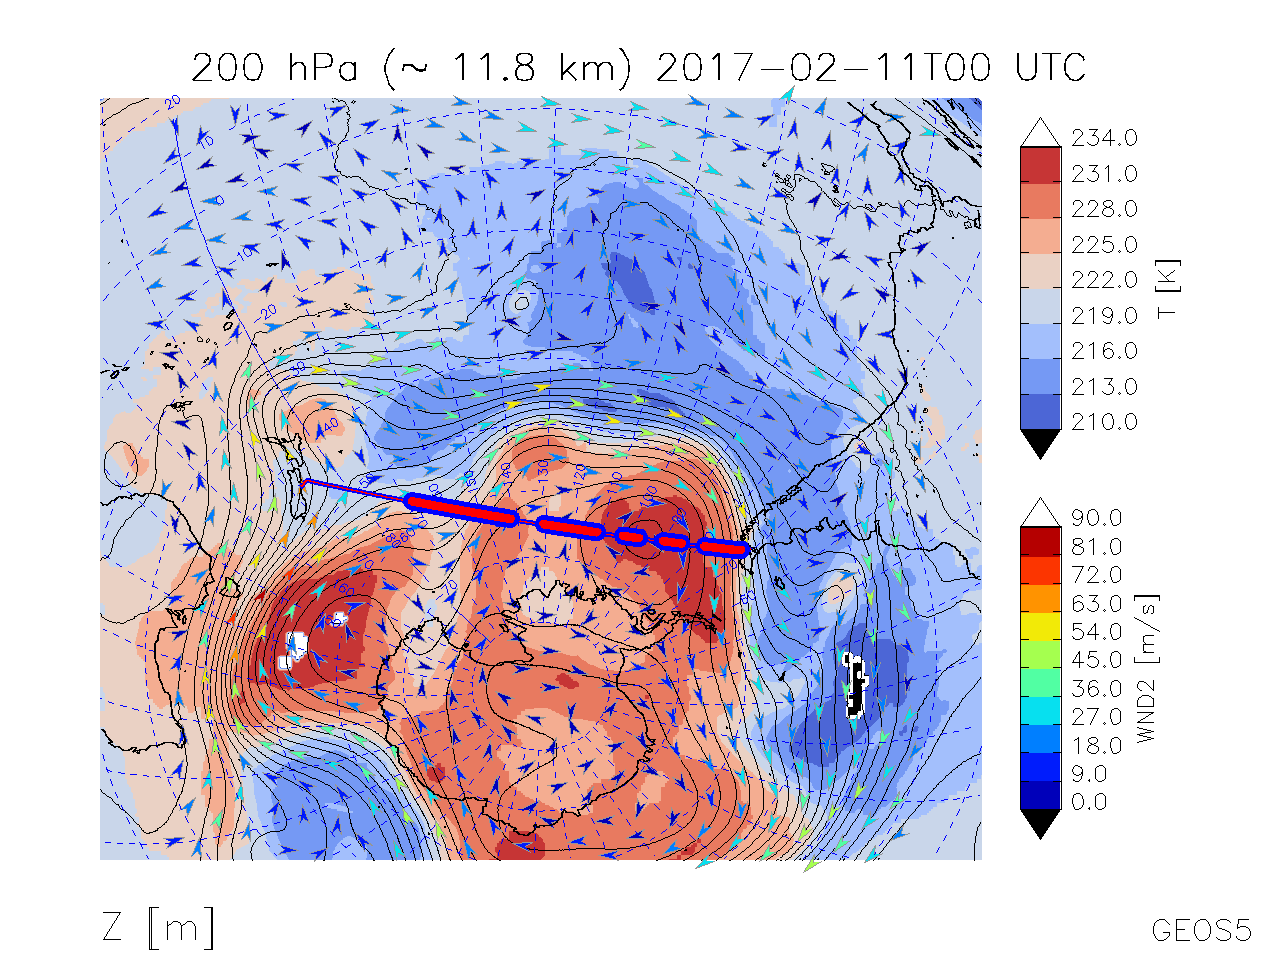
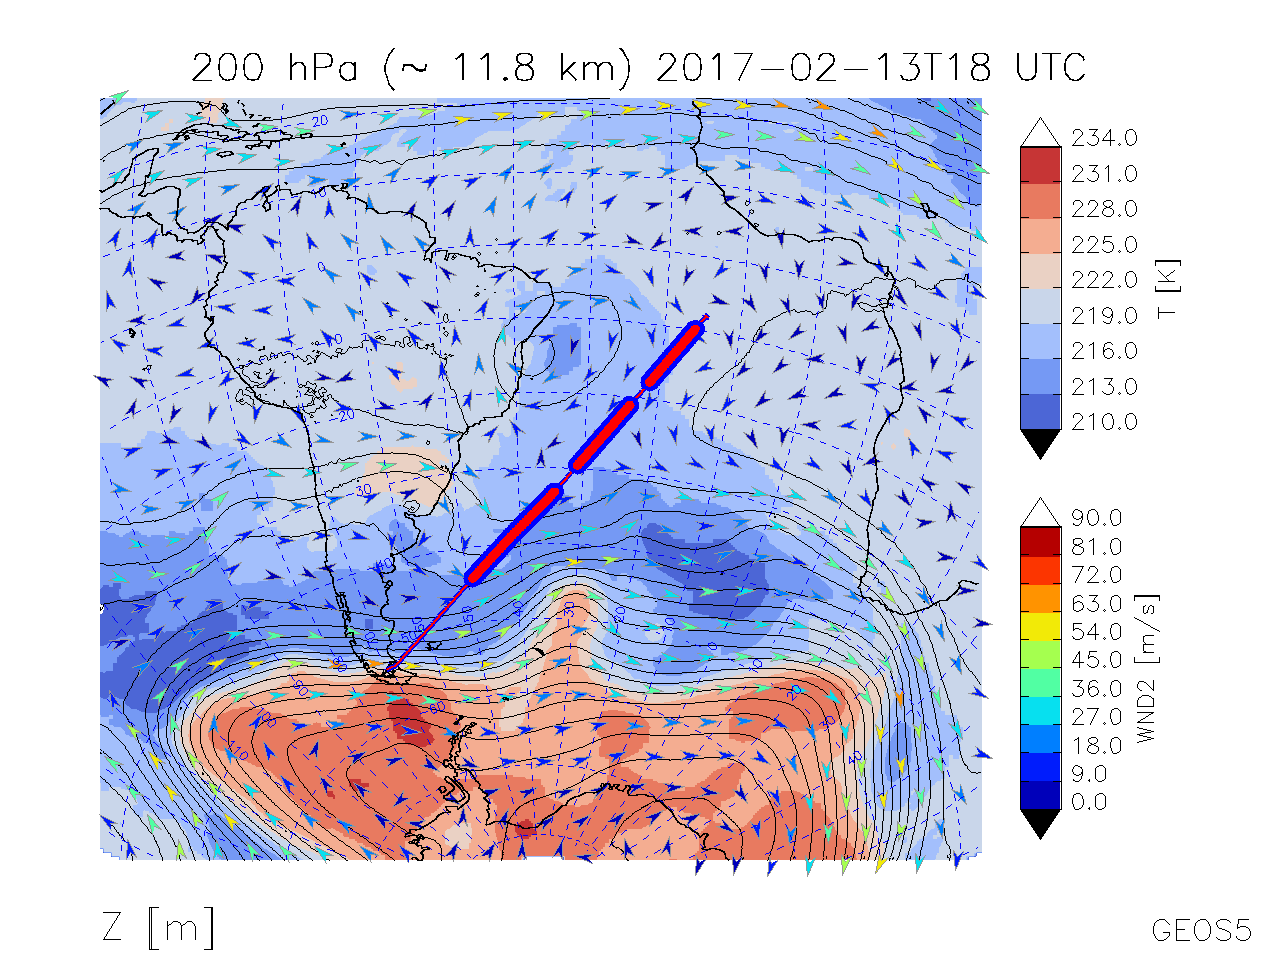
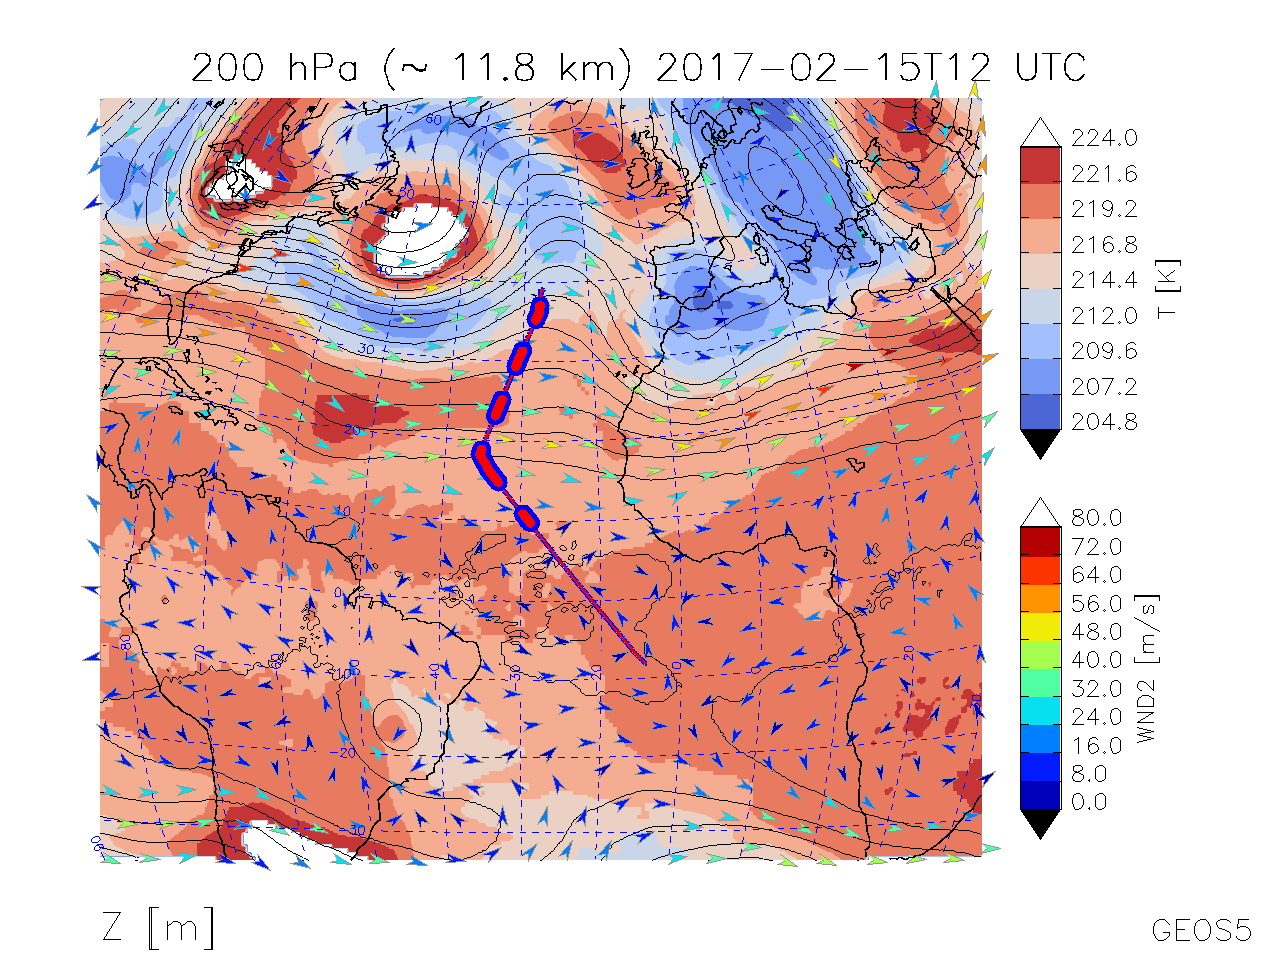
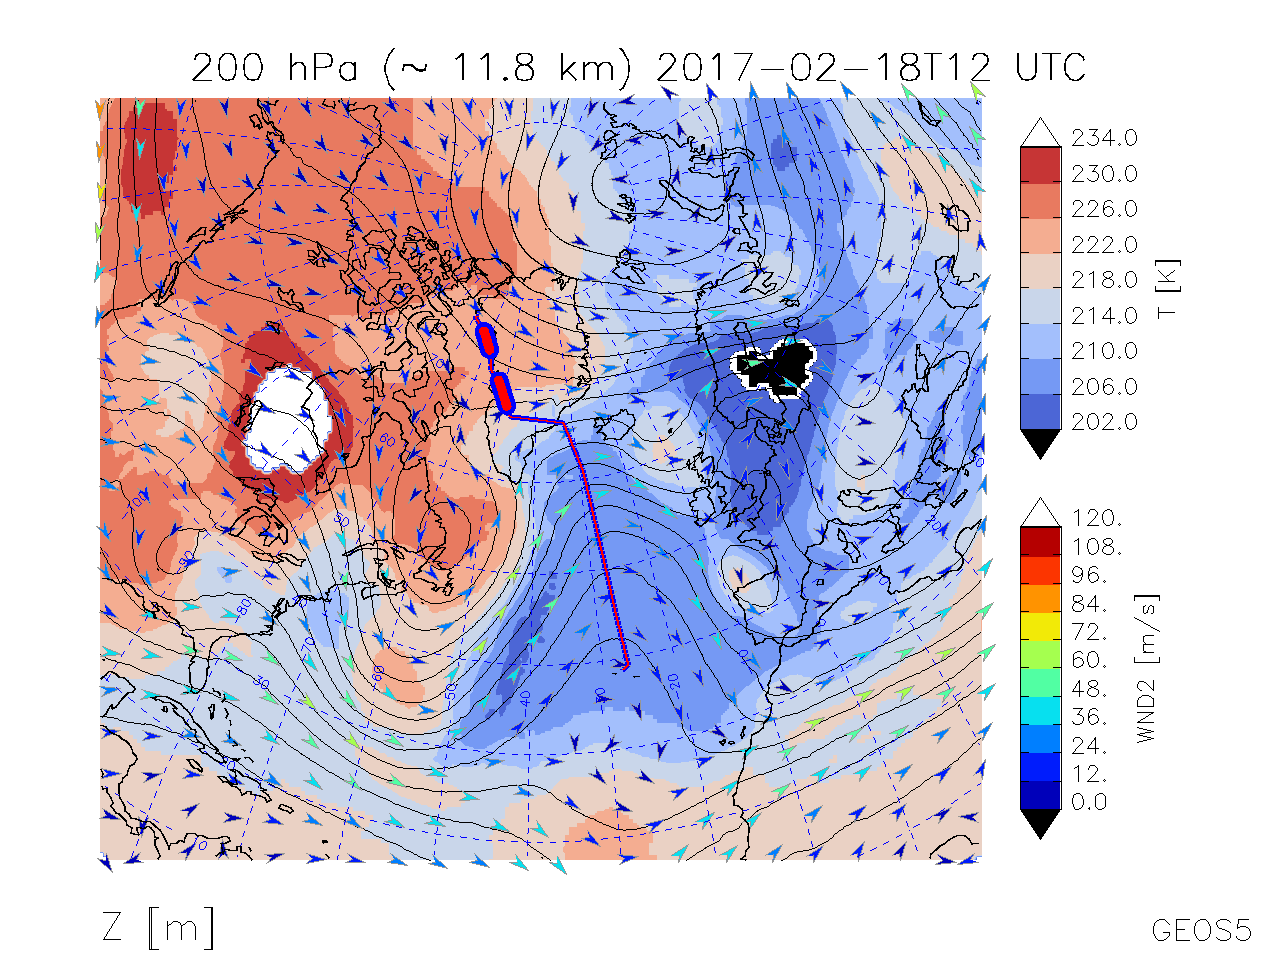
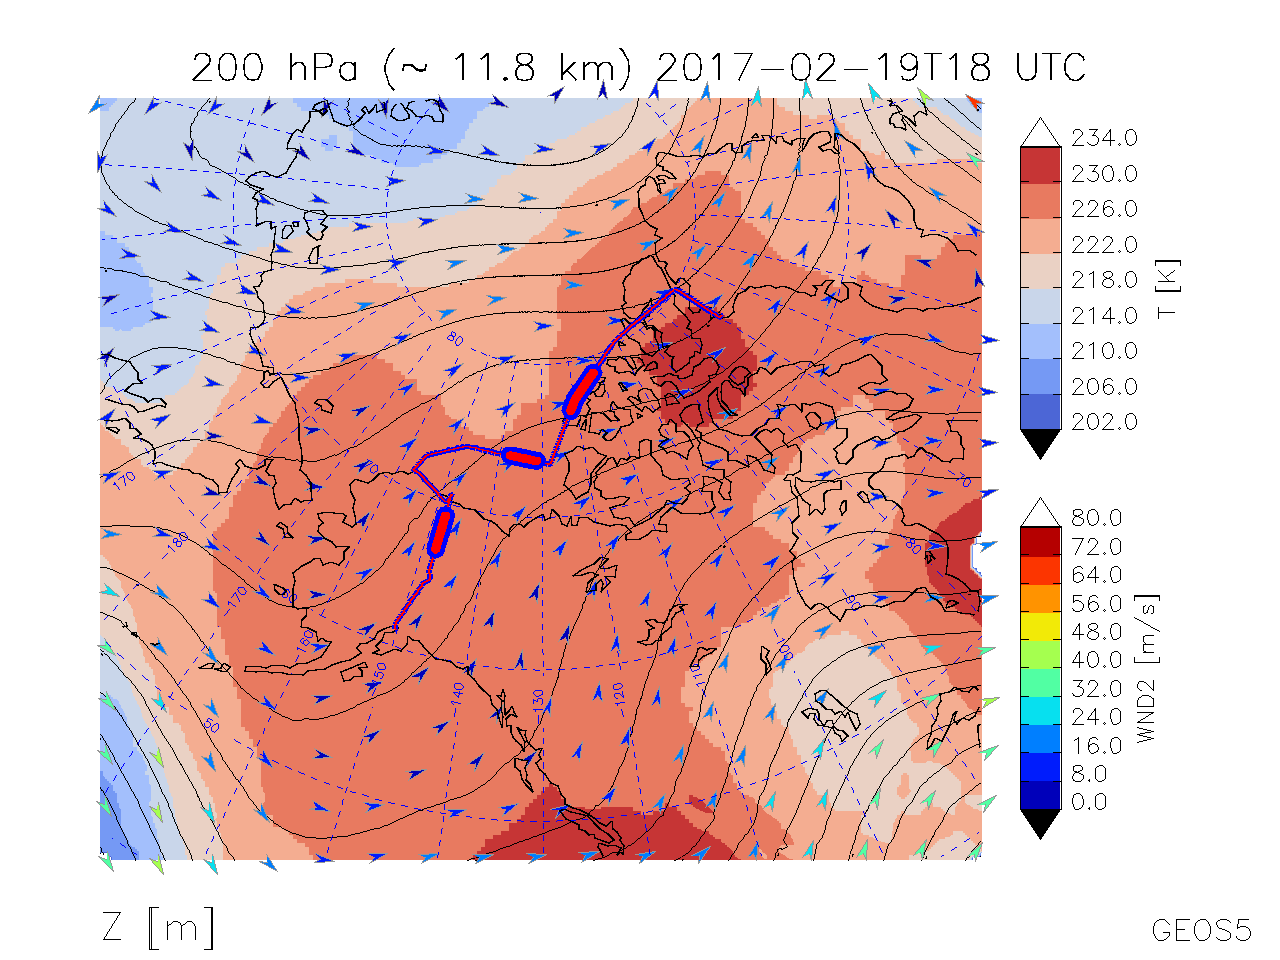
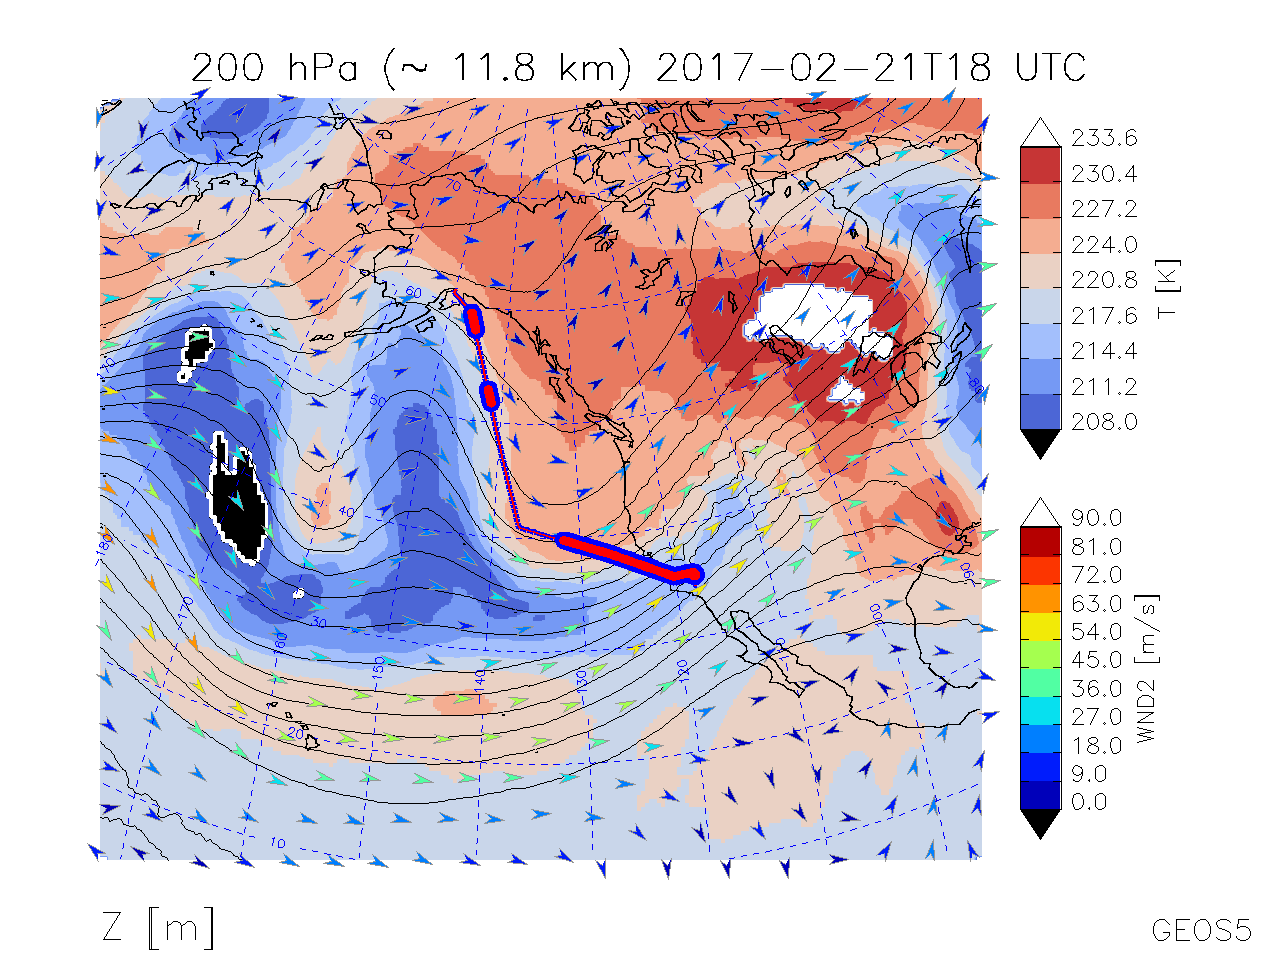
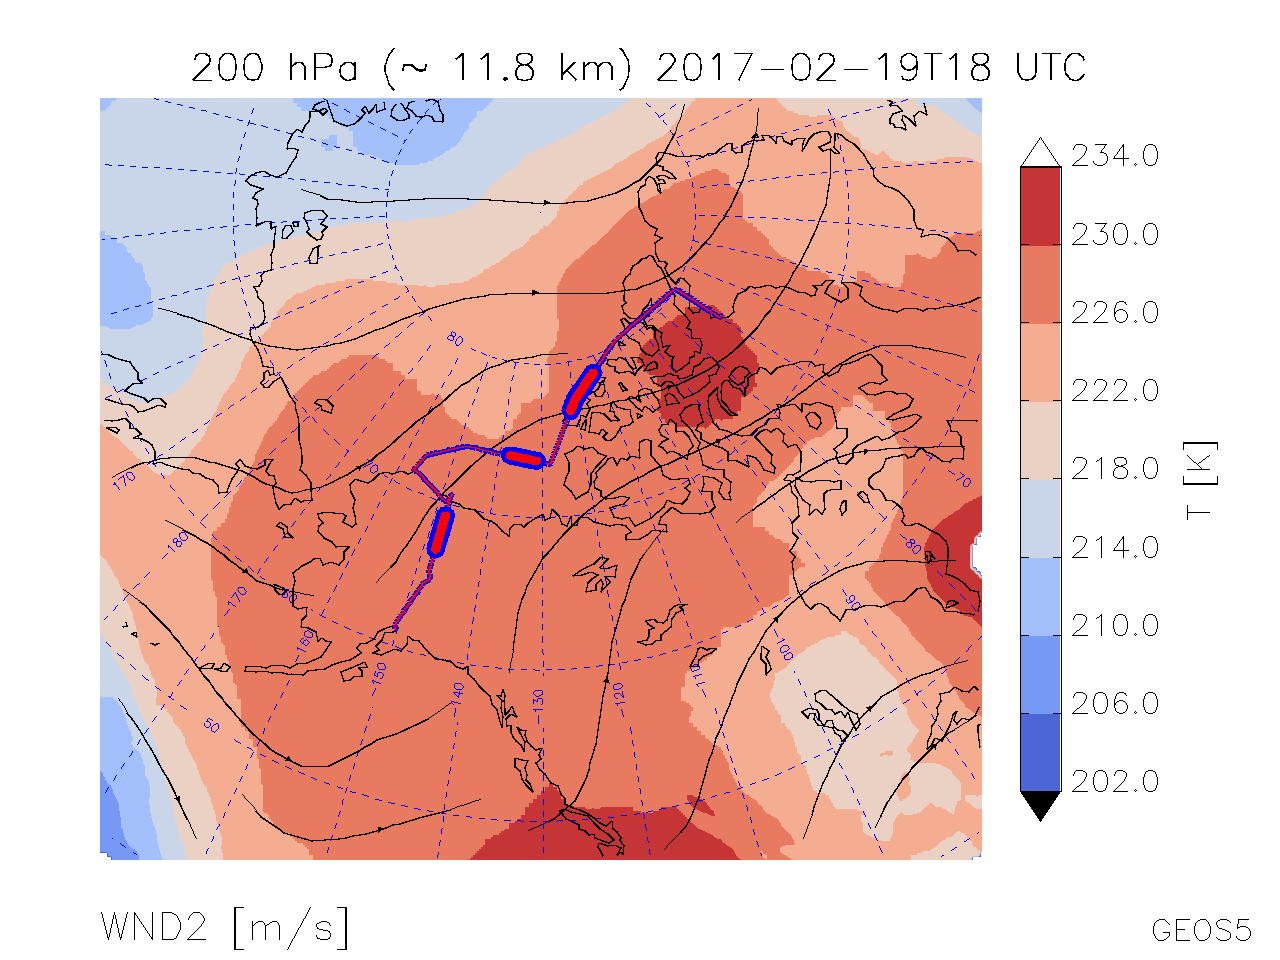
| Map of T, Winds, Geopot. Hgt. @ 200 hPa | |
|
|
|
|
|
|
|
|
|
|
|
|
Map of T, Winds, Geopot. Hgt. @ 200 hPa |
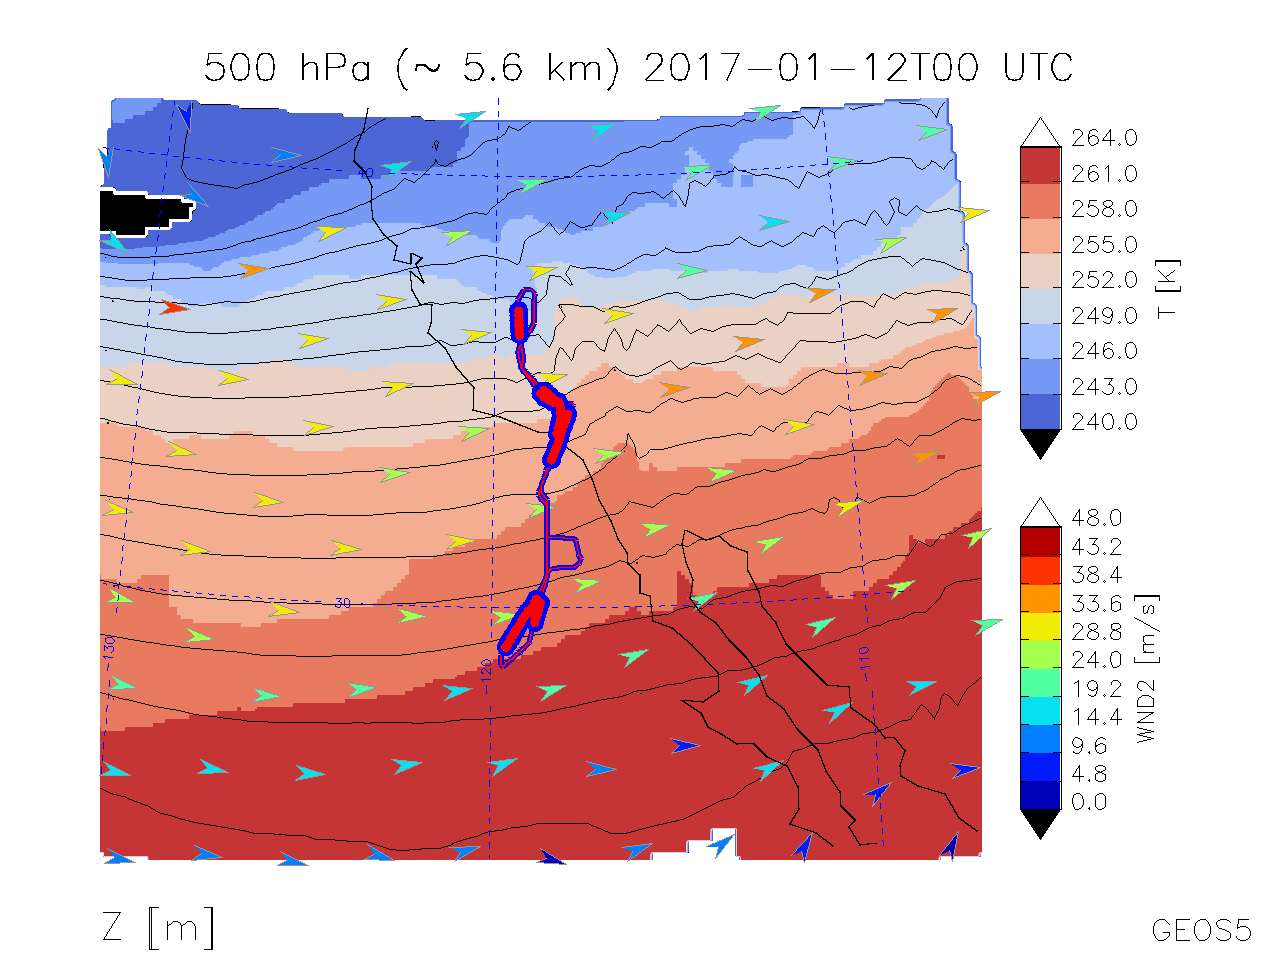
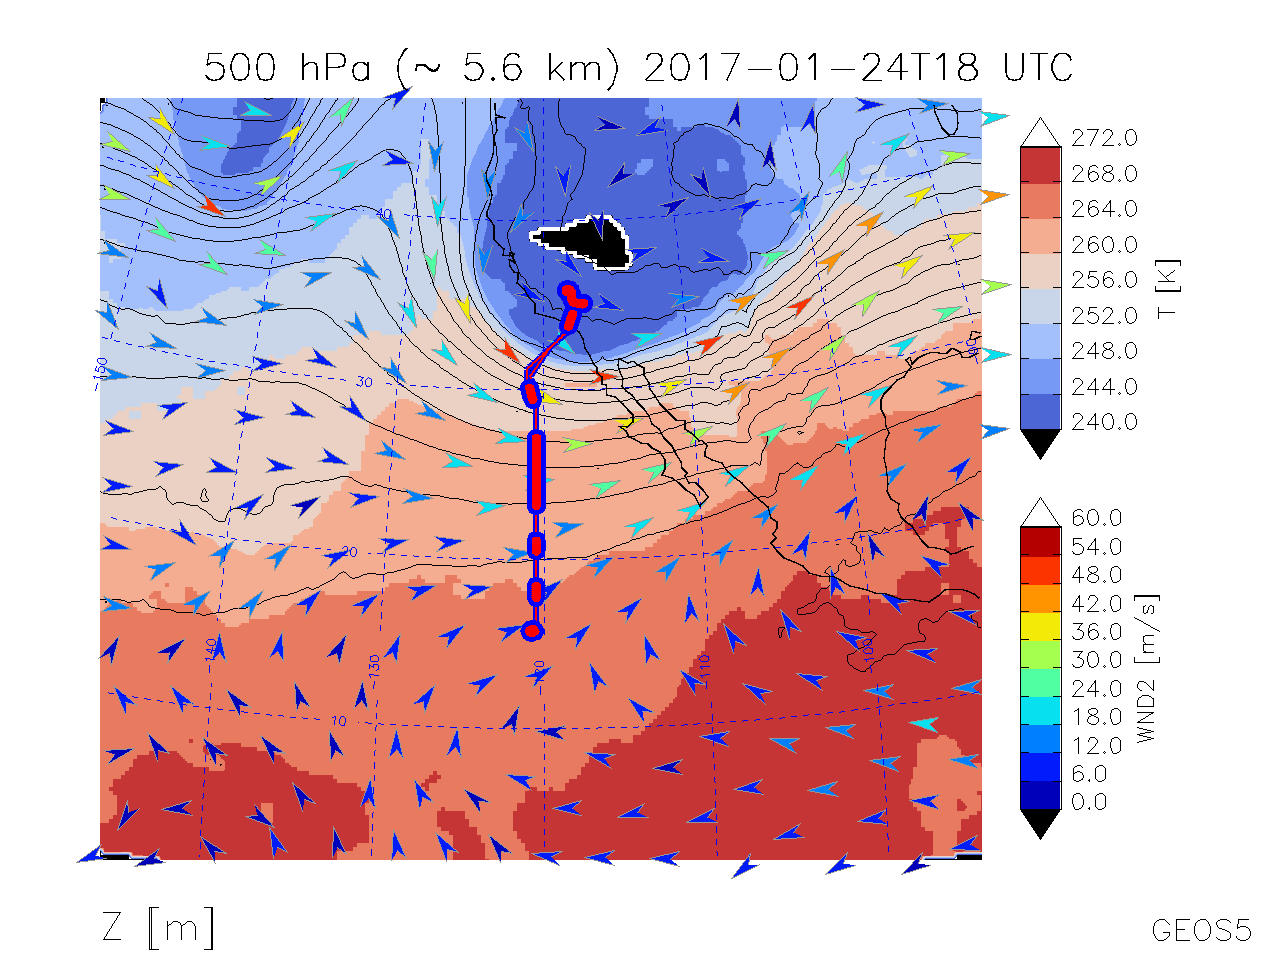
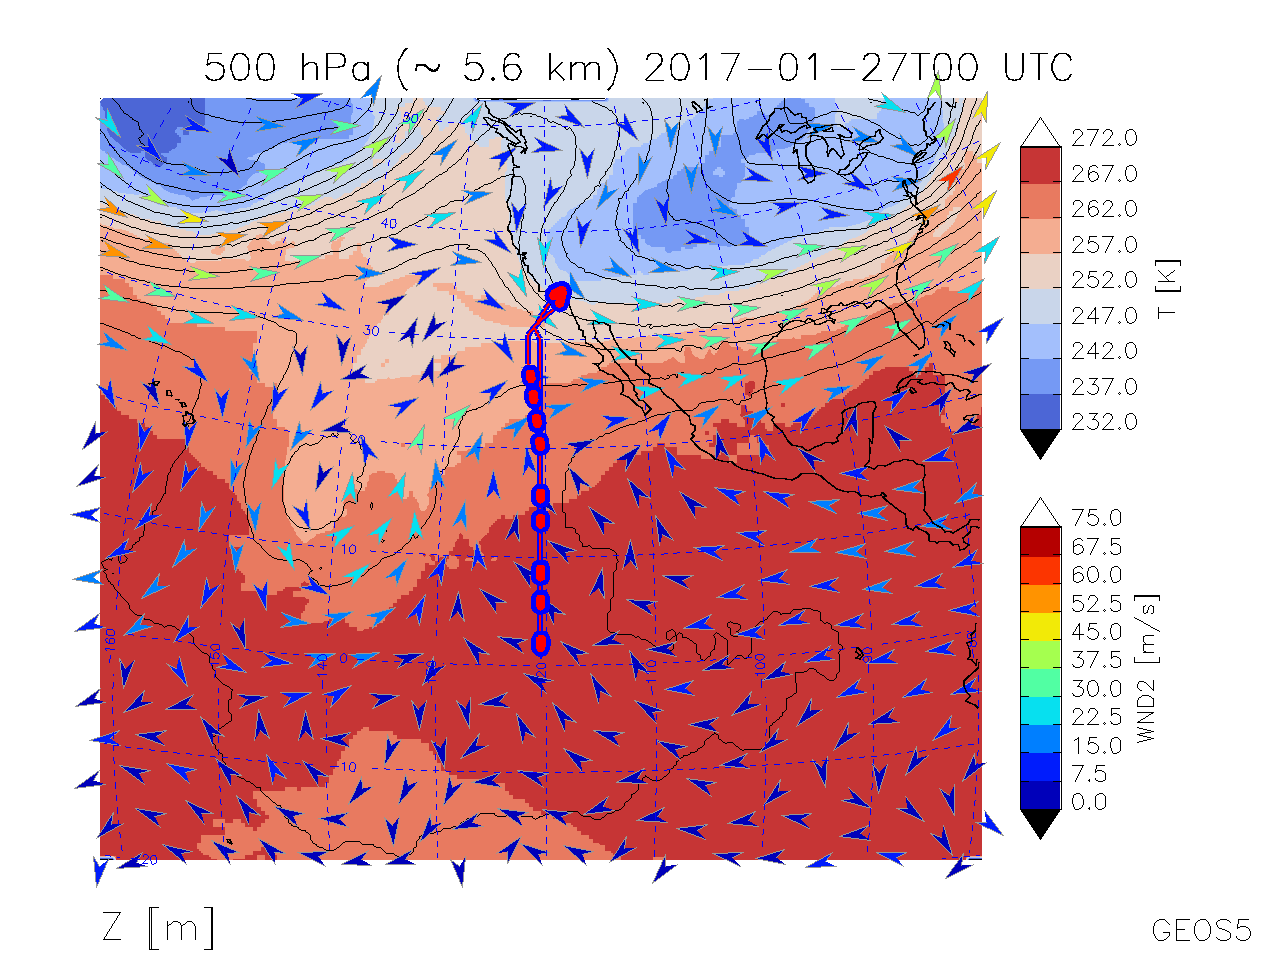
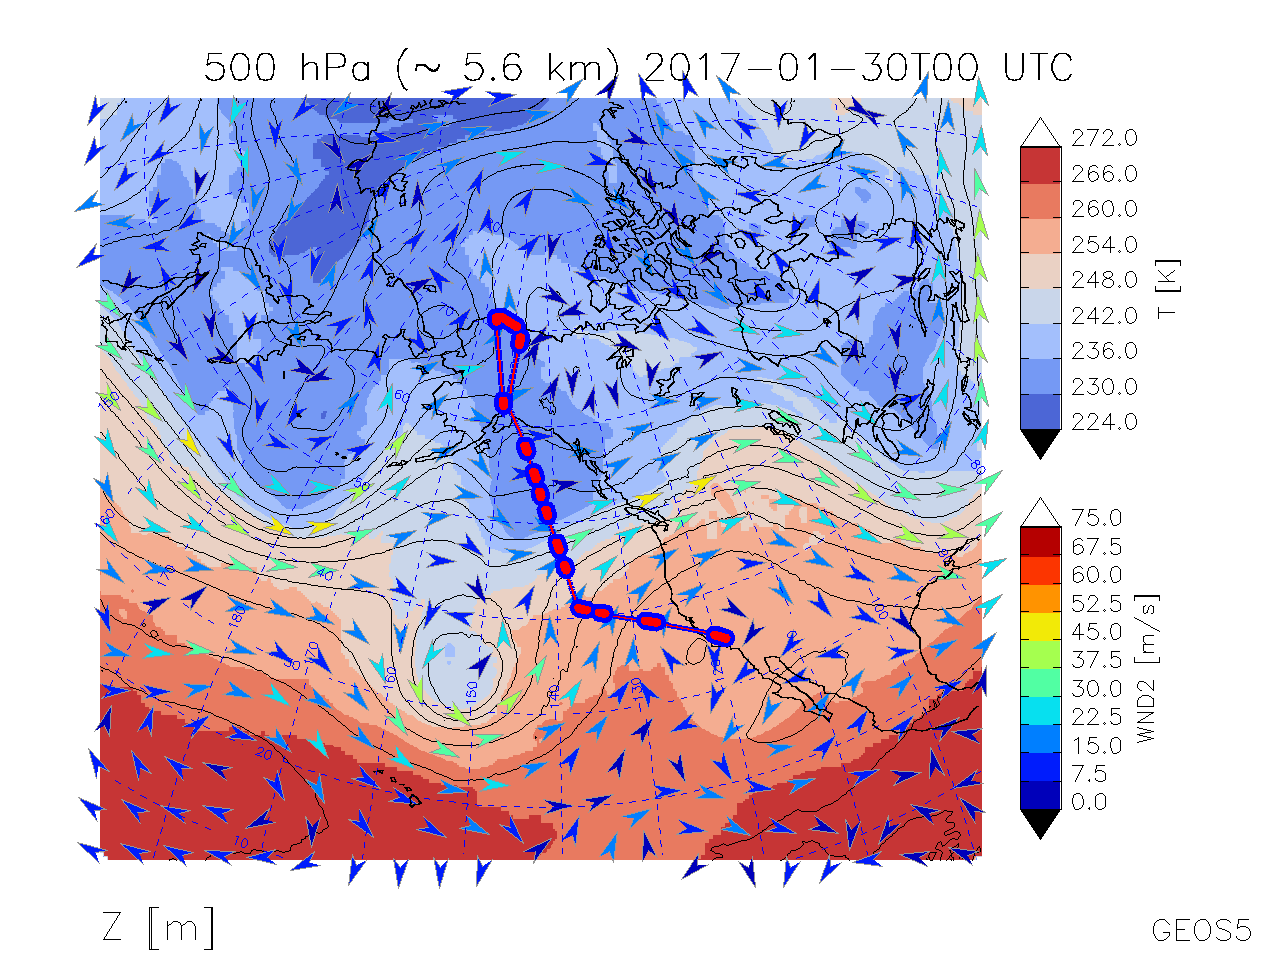
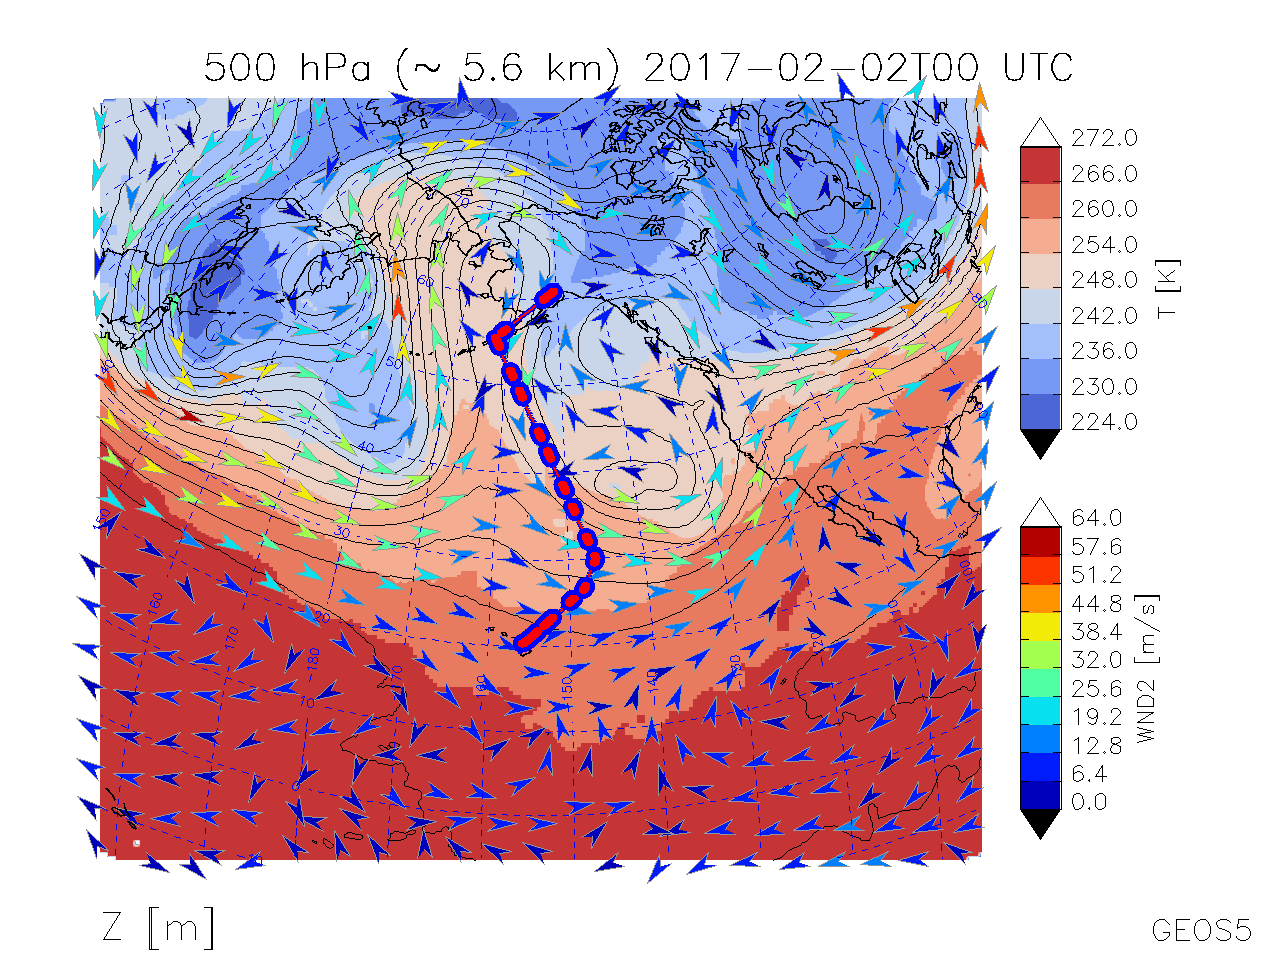
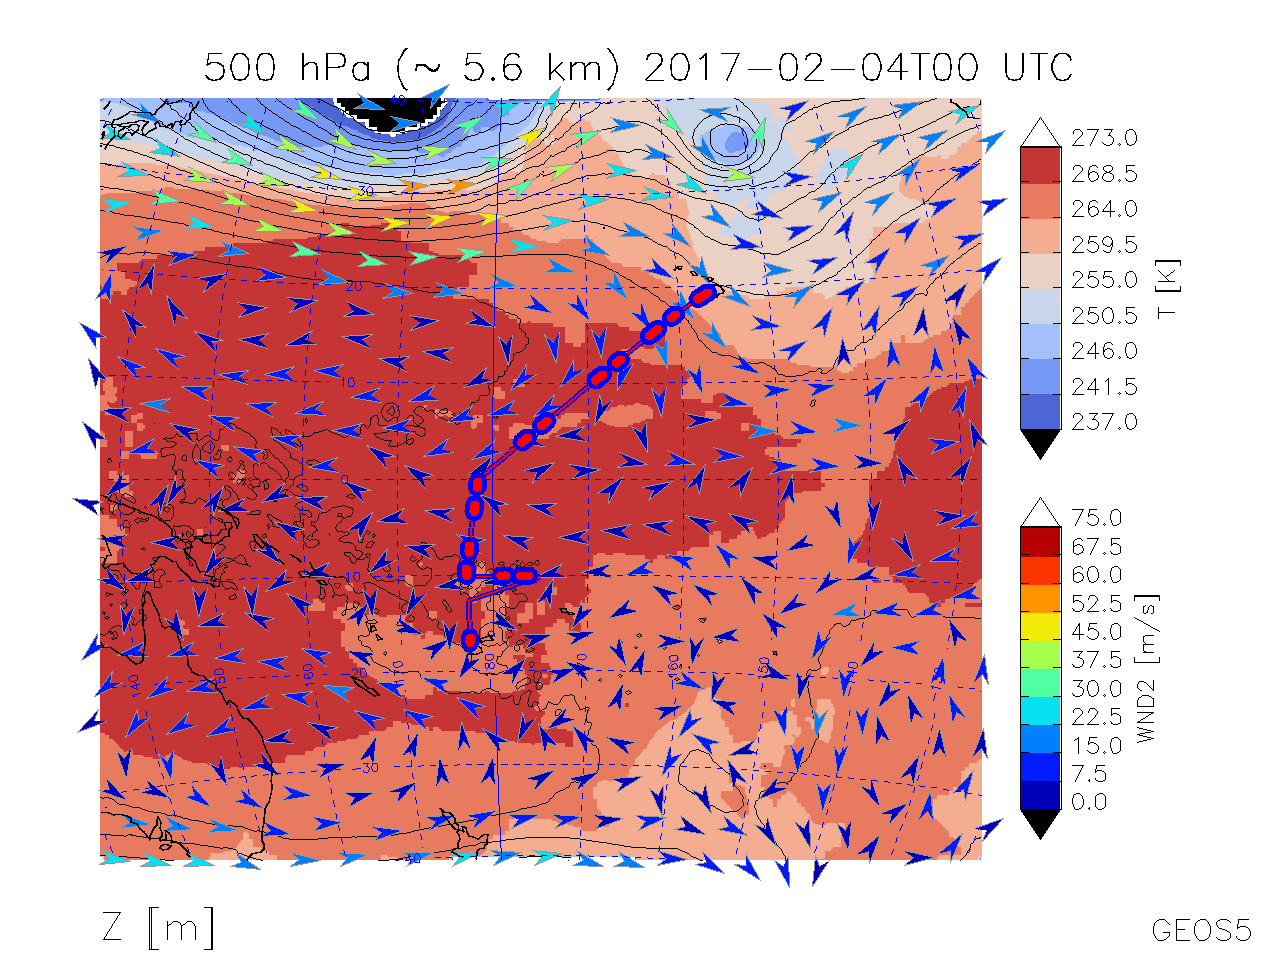
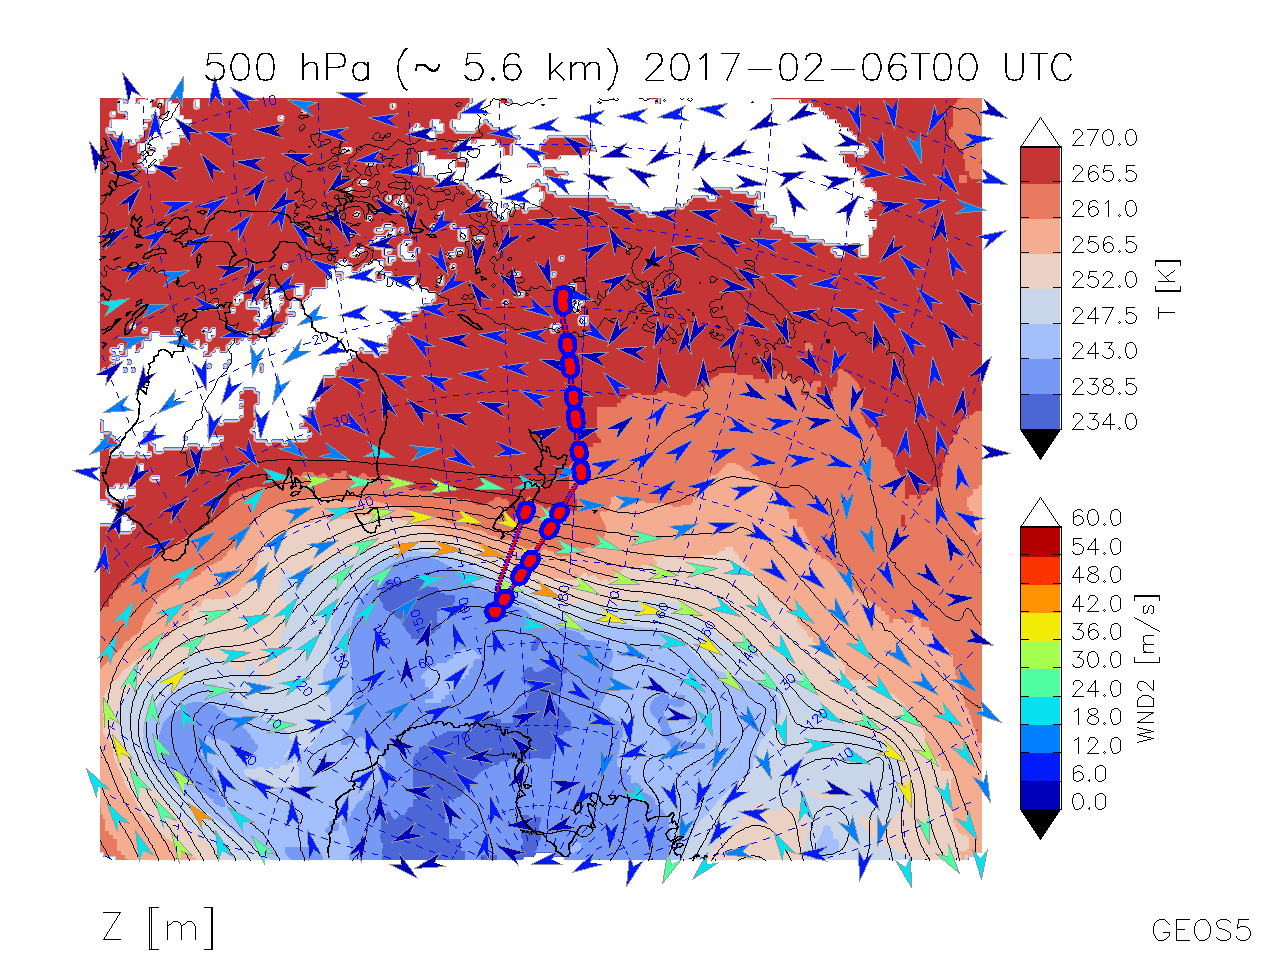
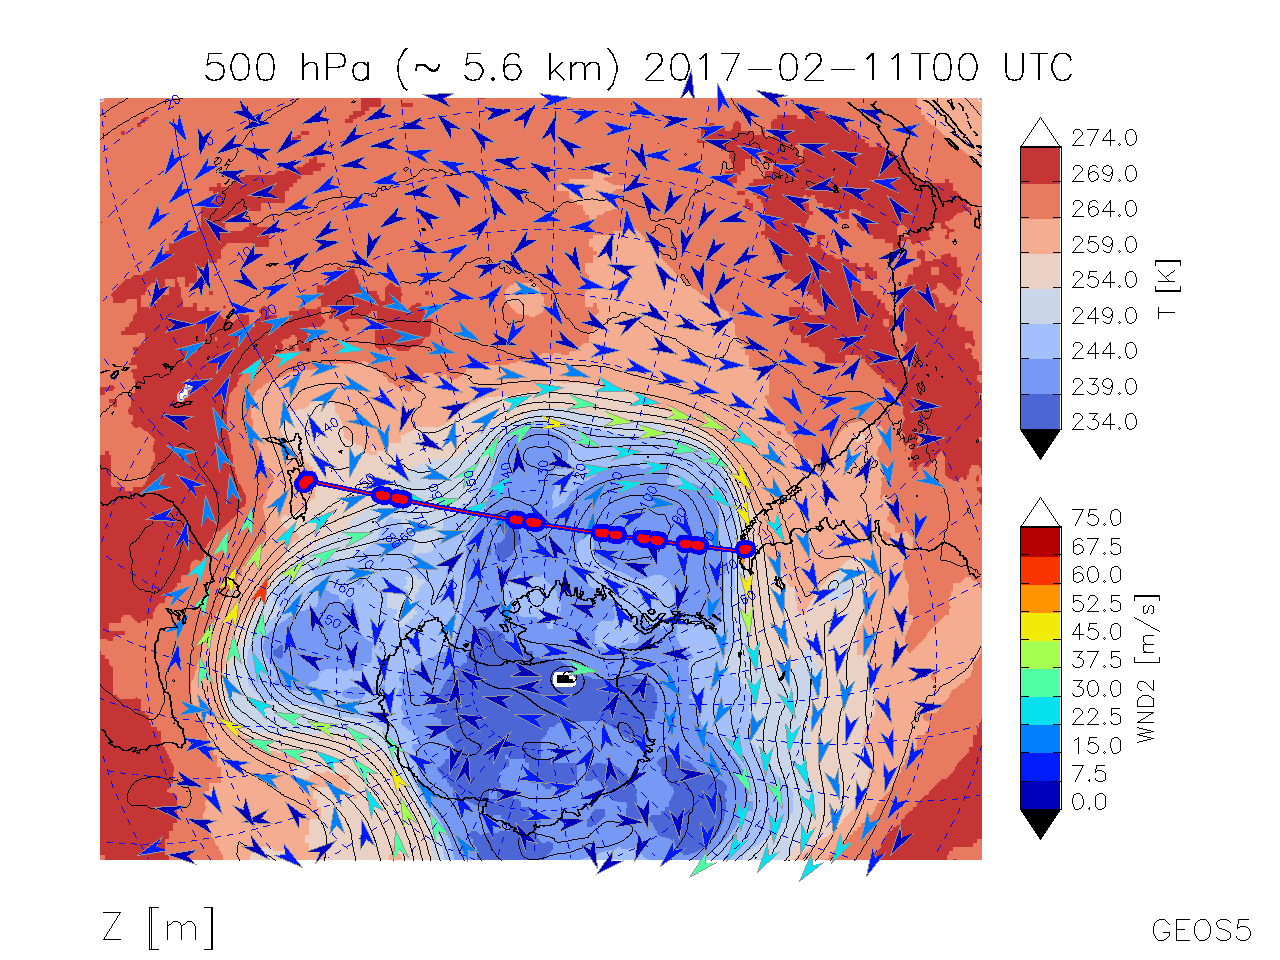
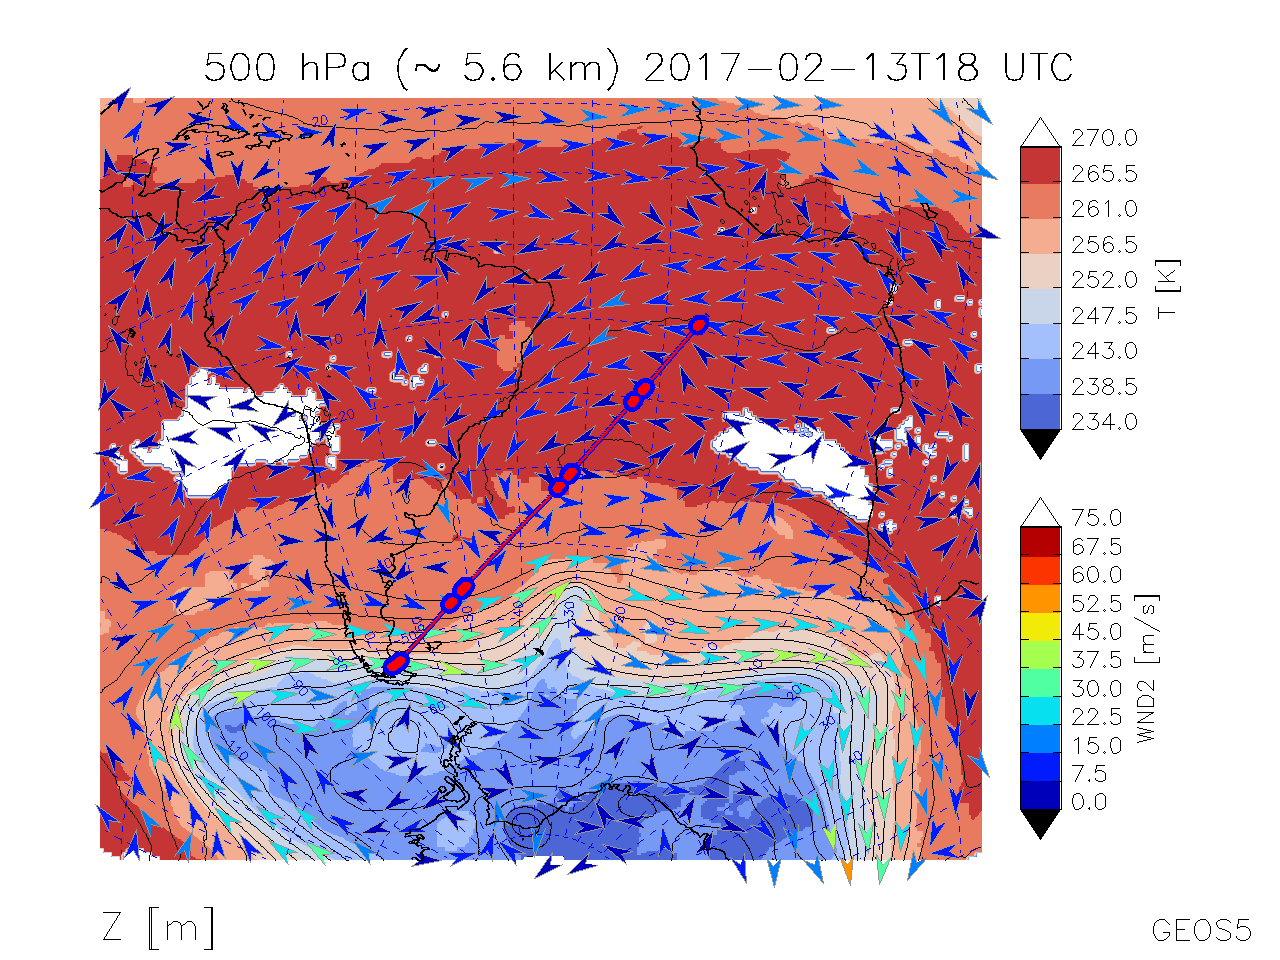
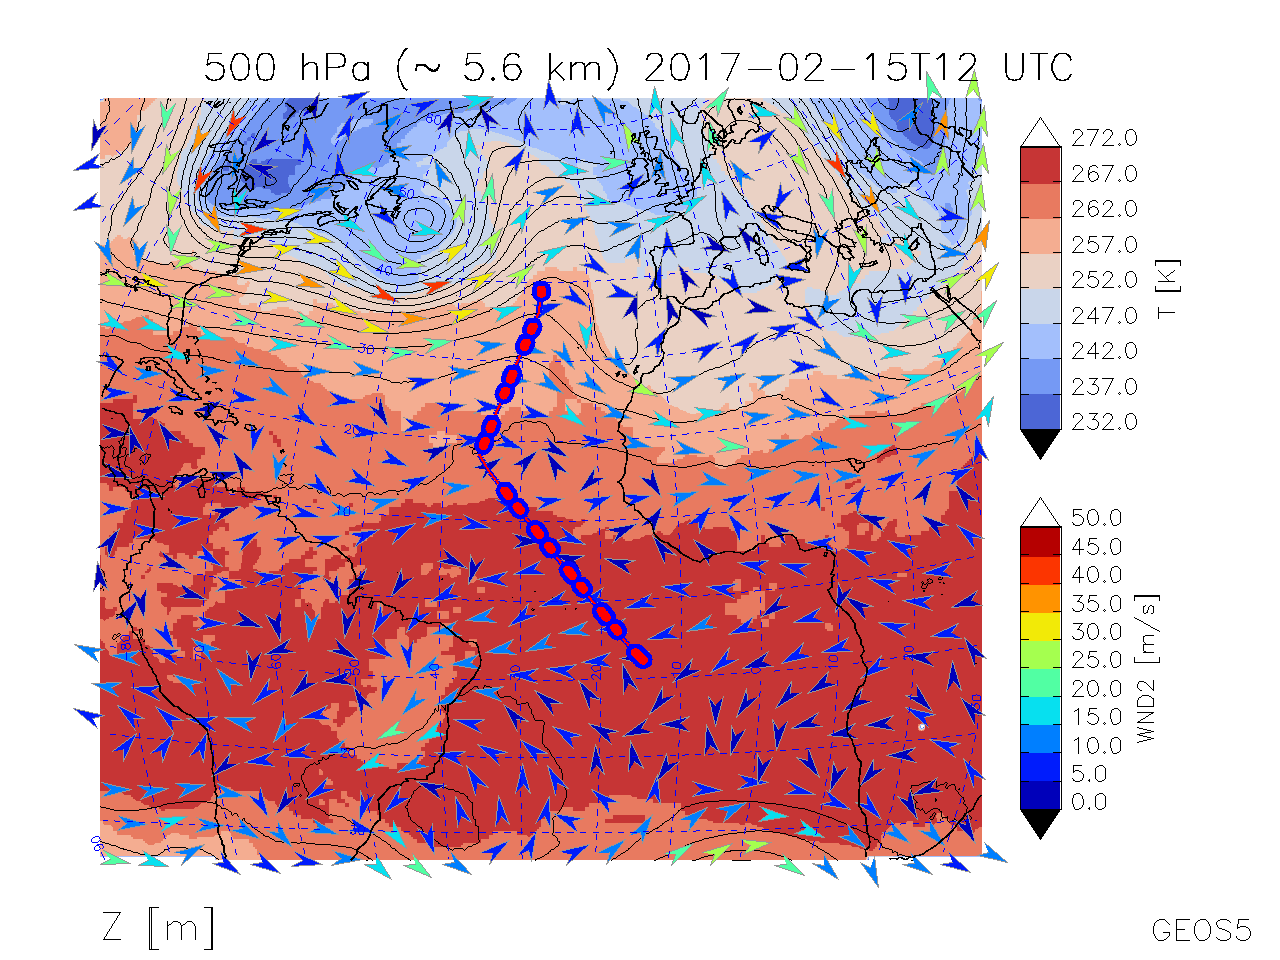
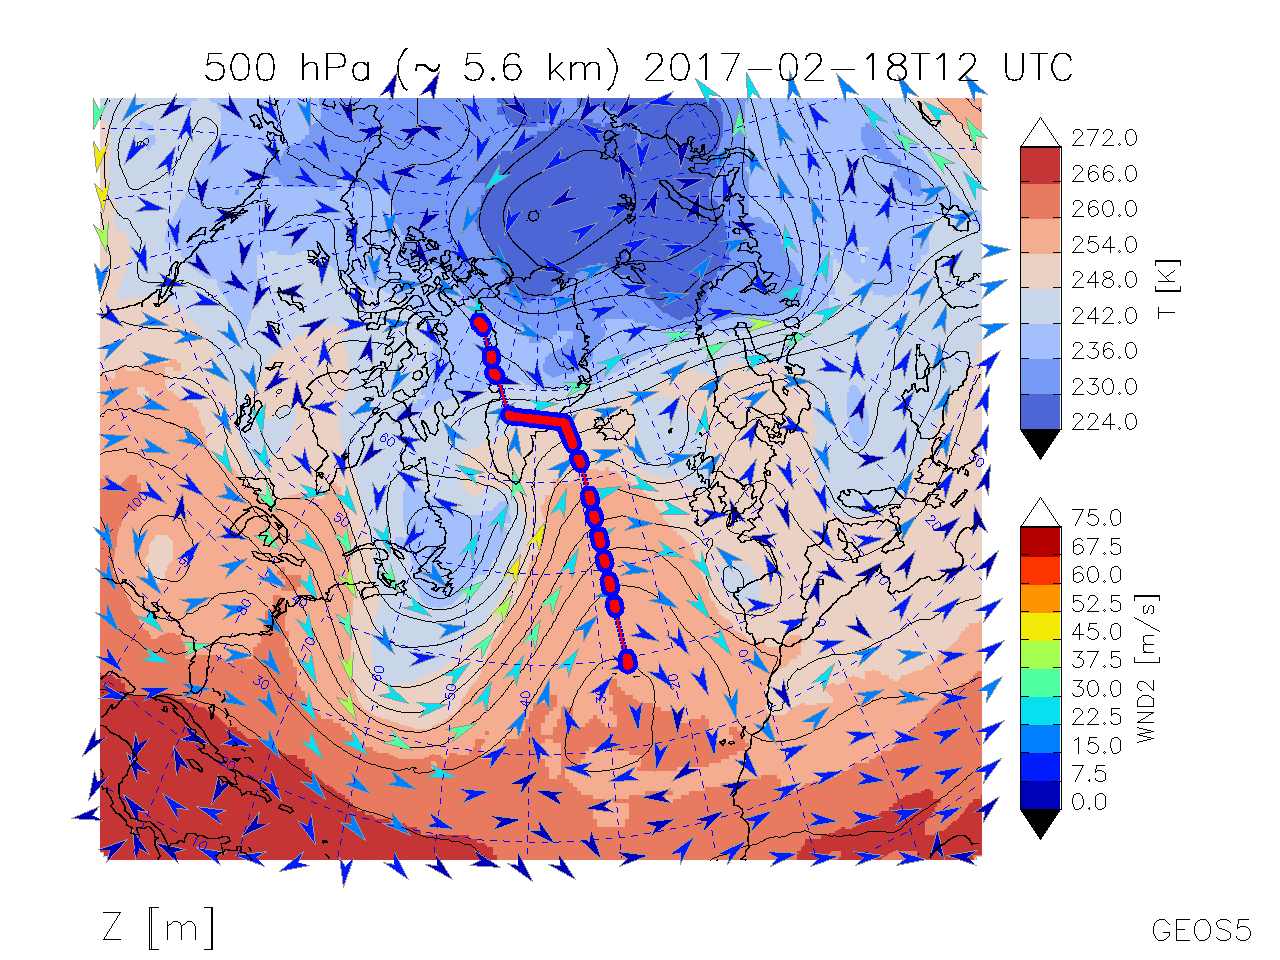
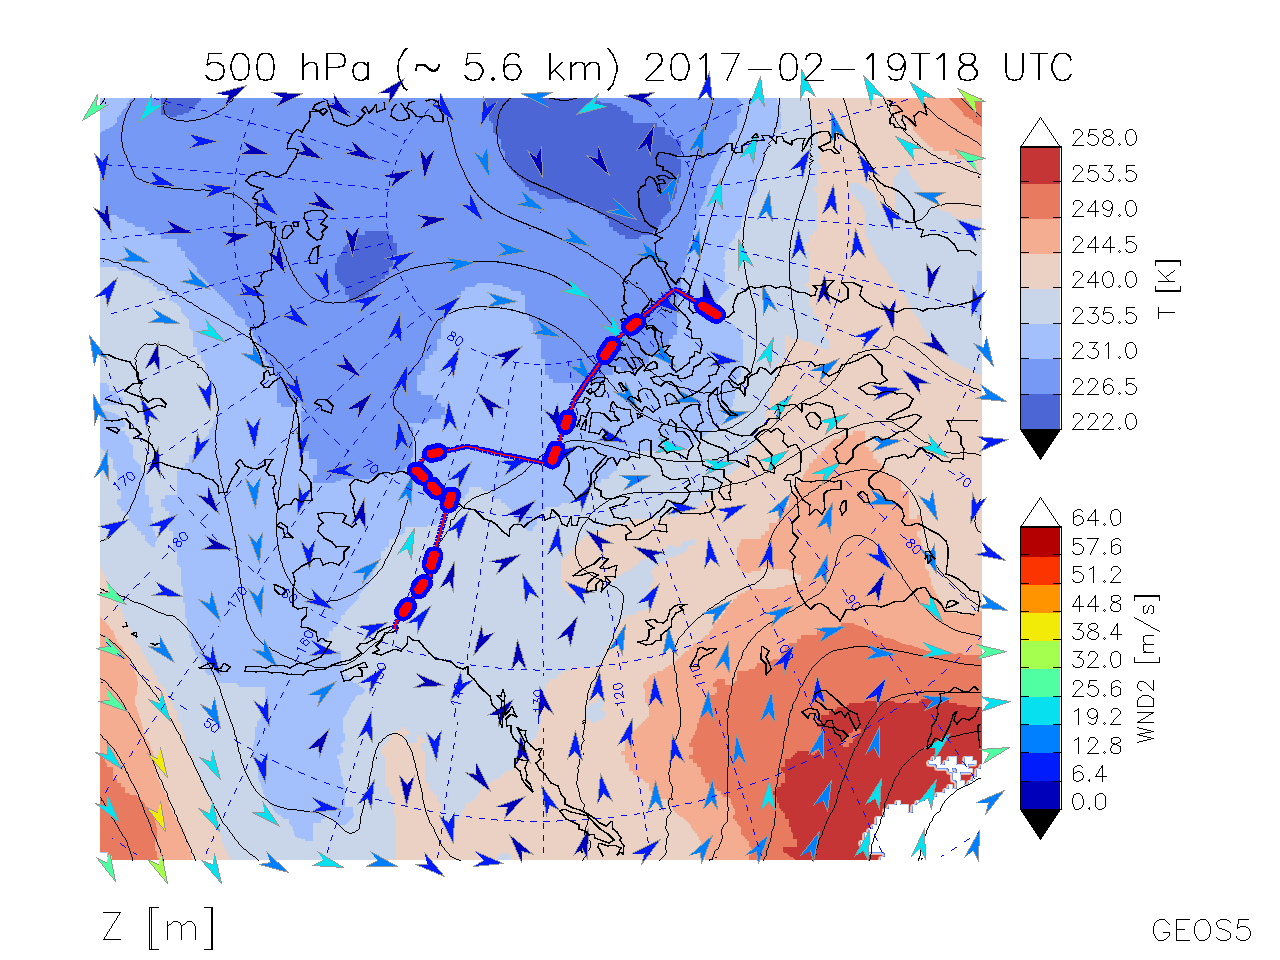
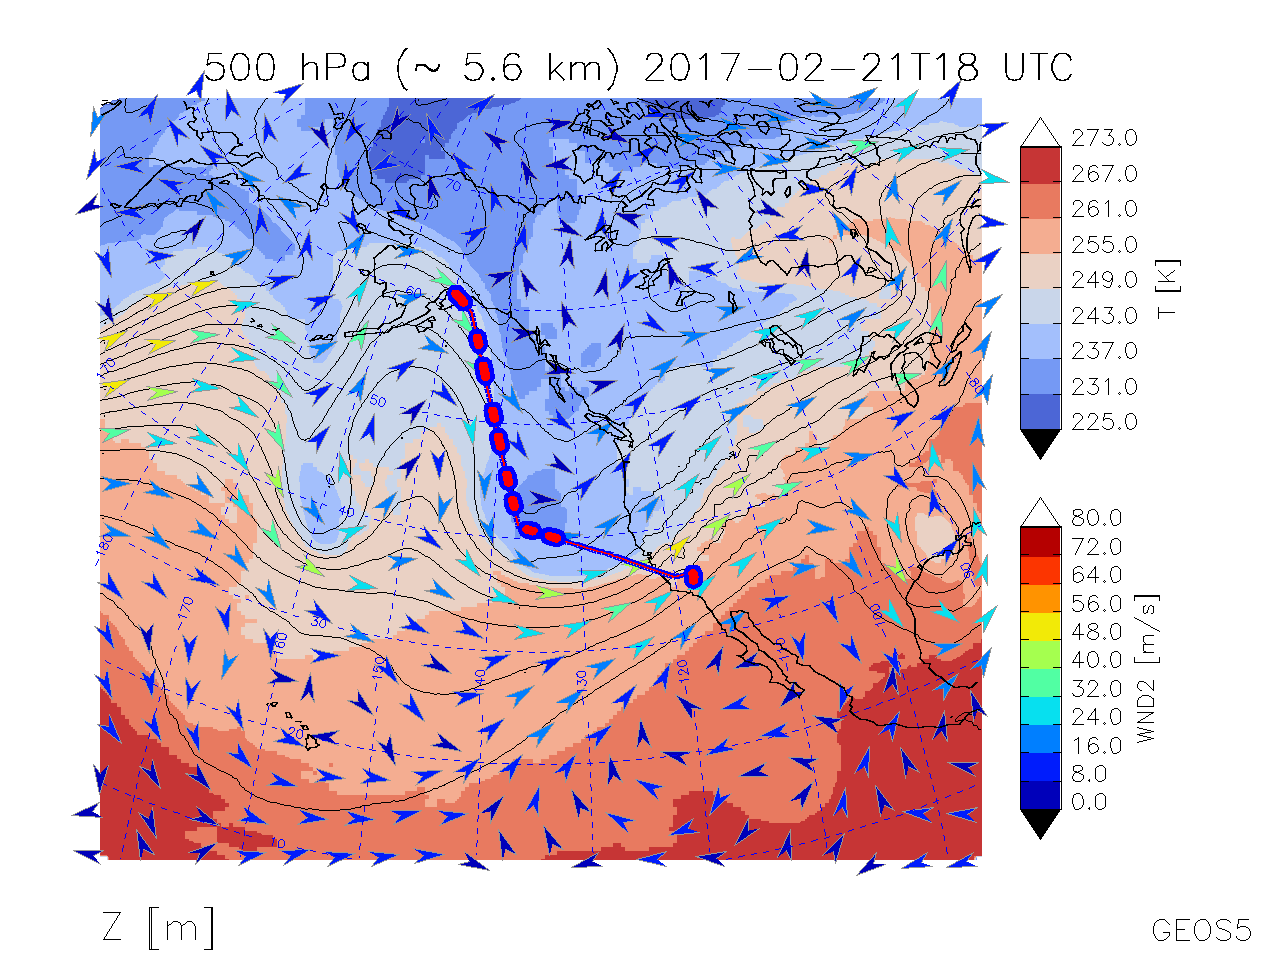
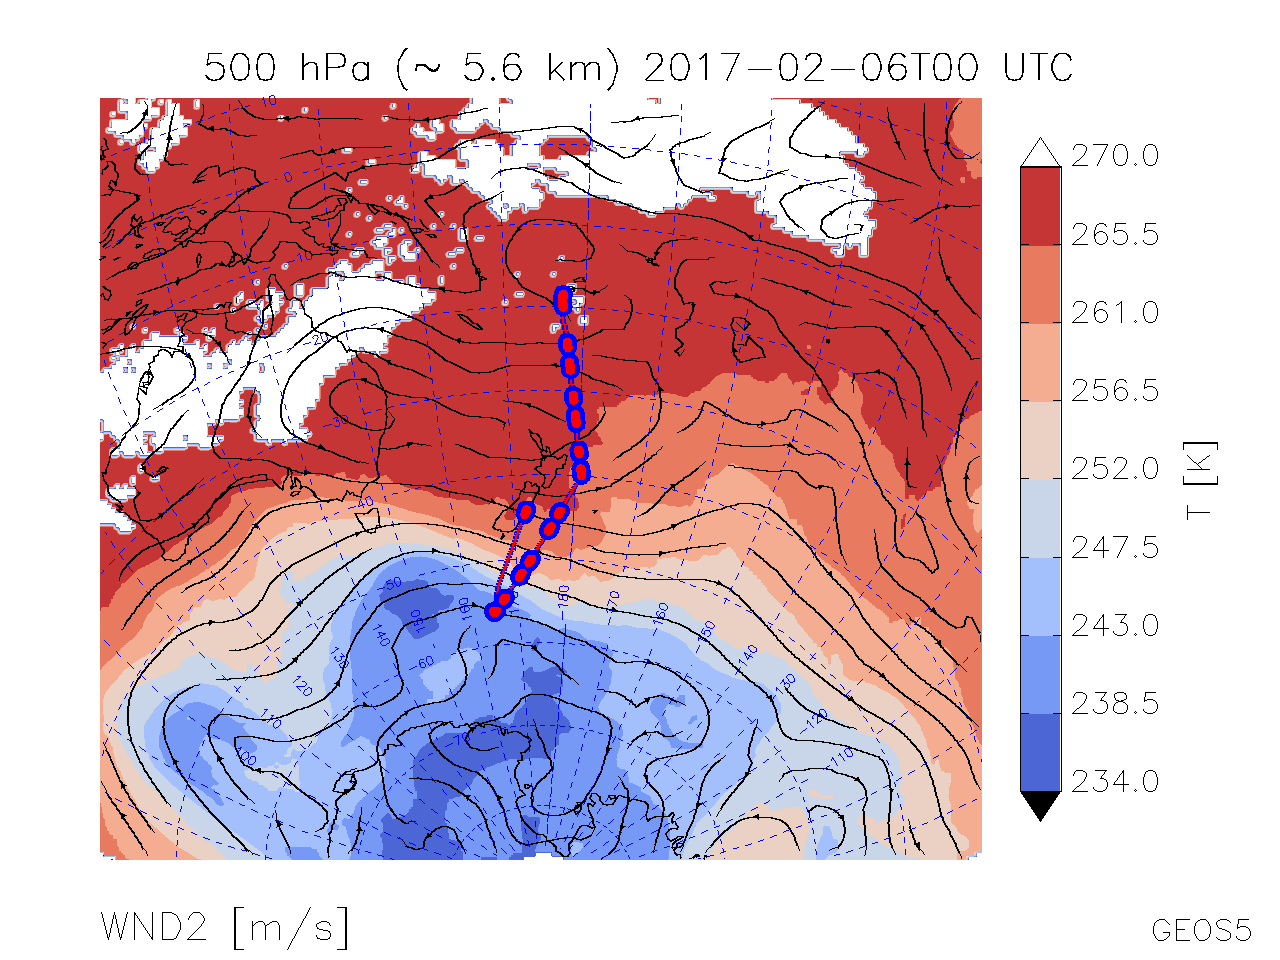
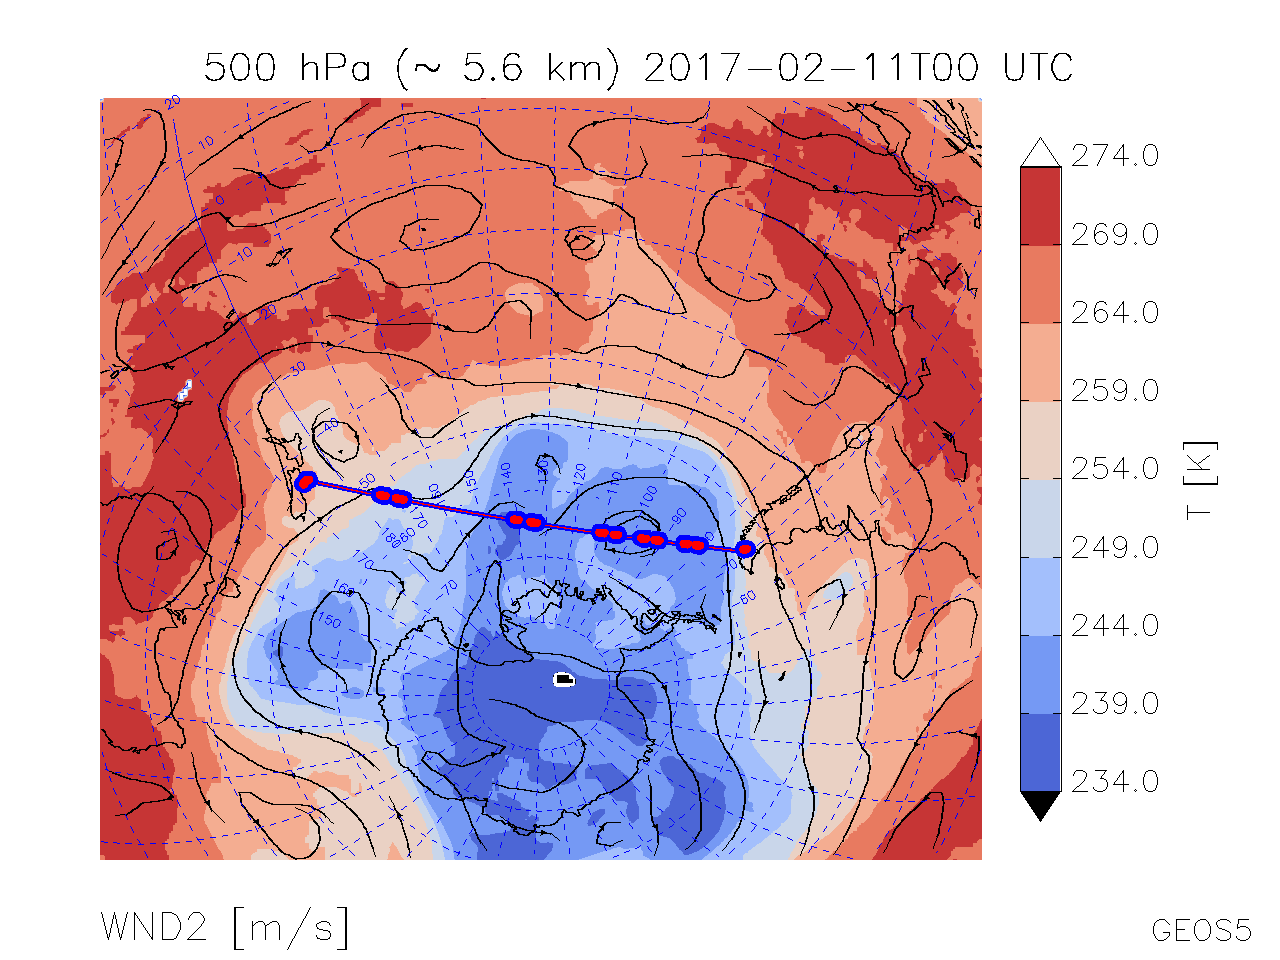
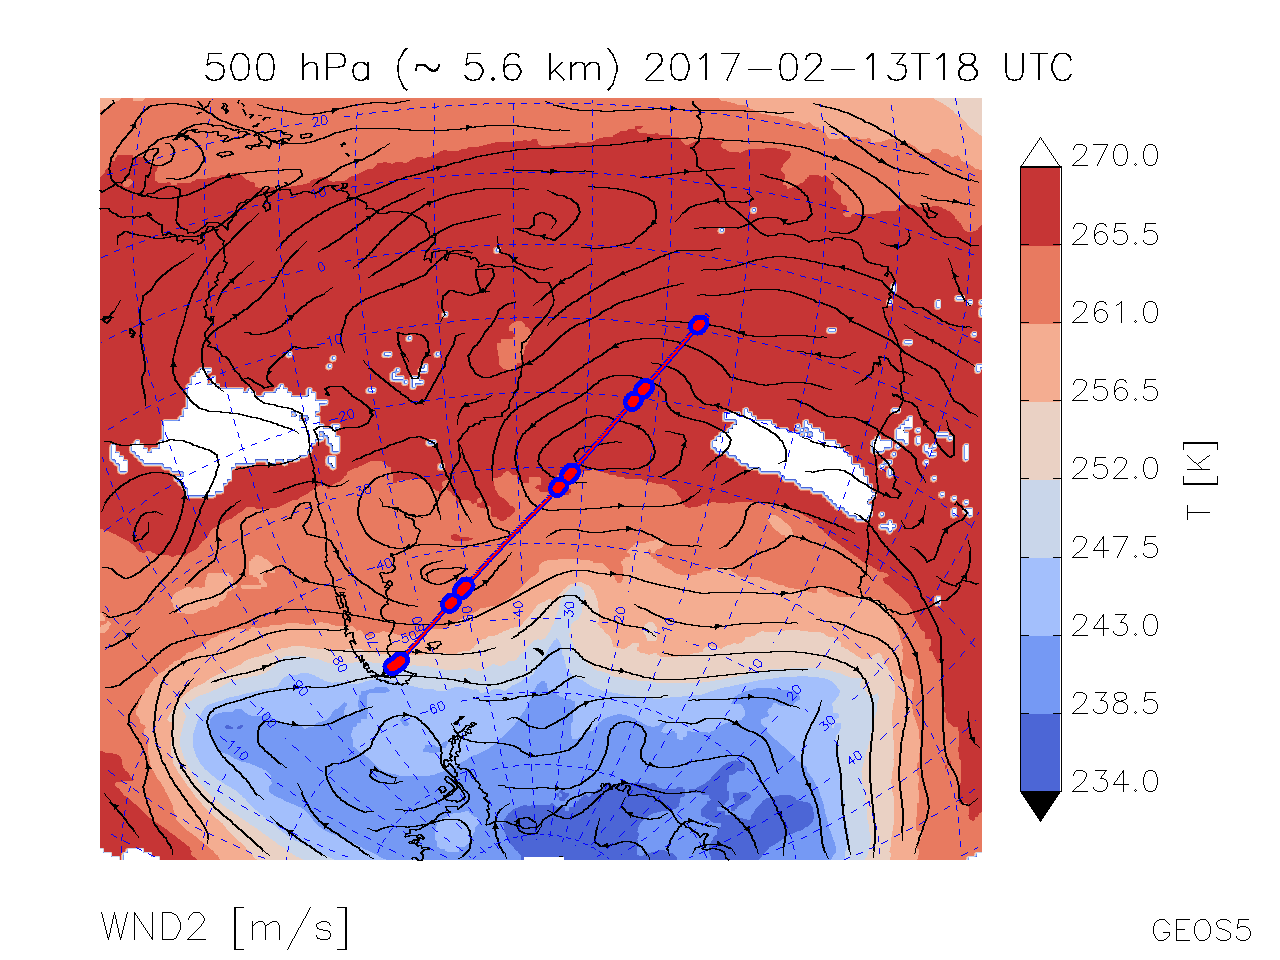
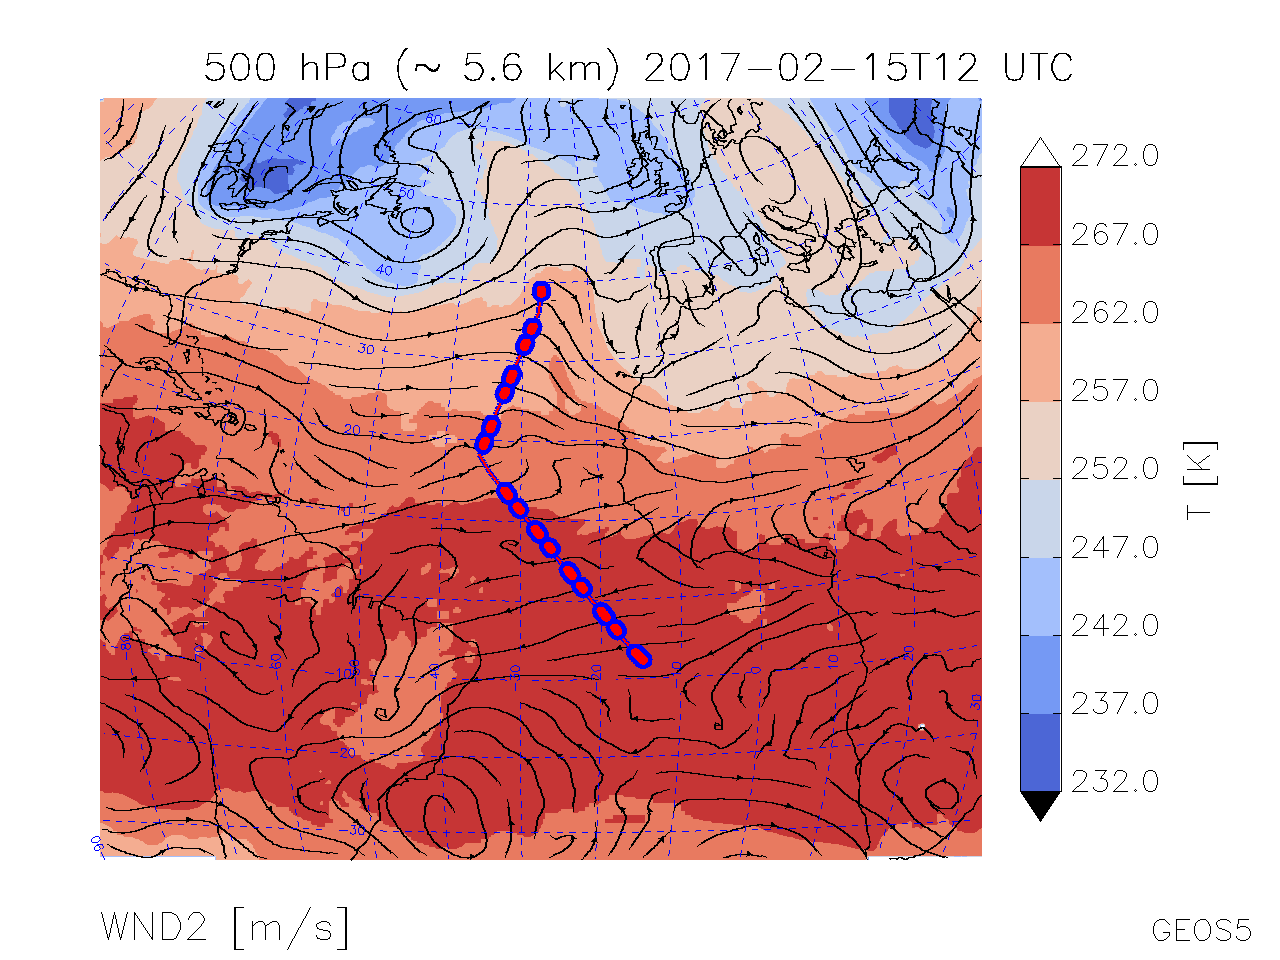
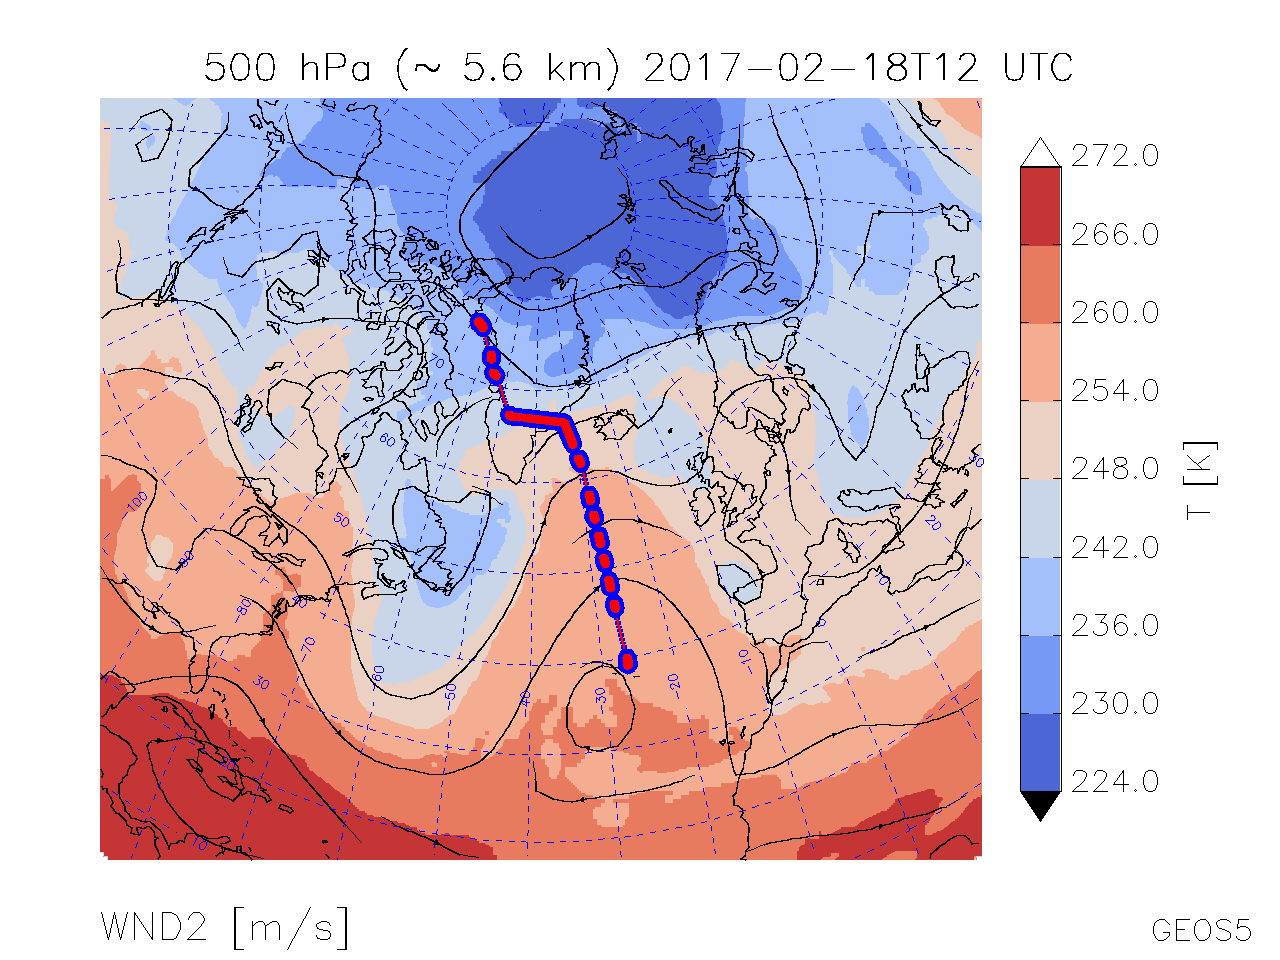
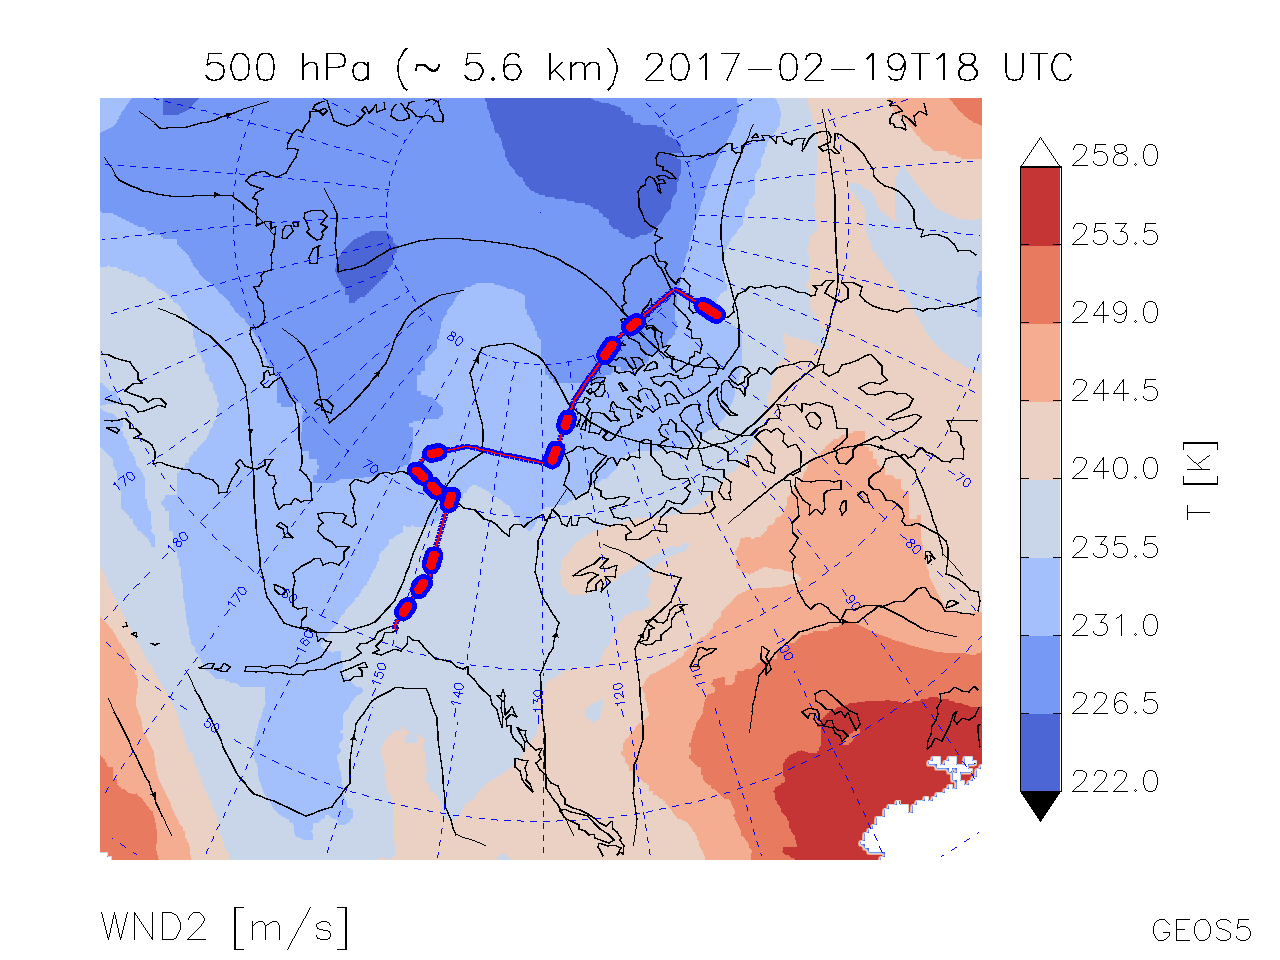
| Map of T, Winds, Geopot. Hgt. @ 500 hPa | |
|
|
|
|
|
|
|
|
|
|
|
|
Map of T, Winds, Geopot. Hgt. @ 500 hPa |
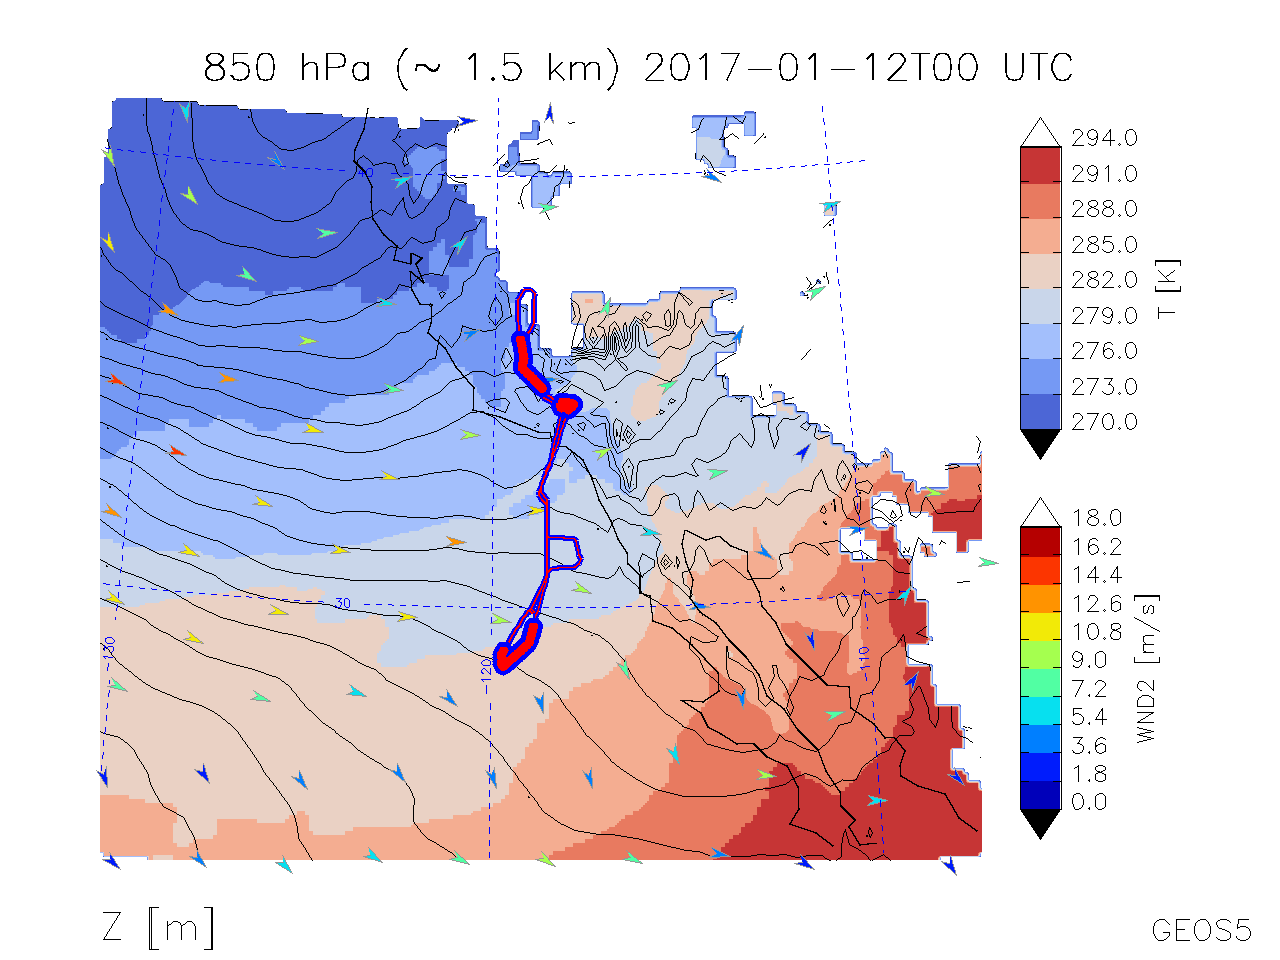
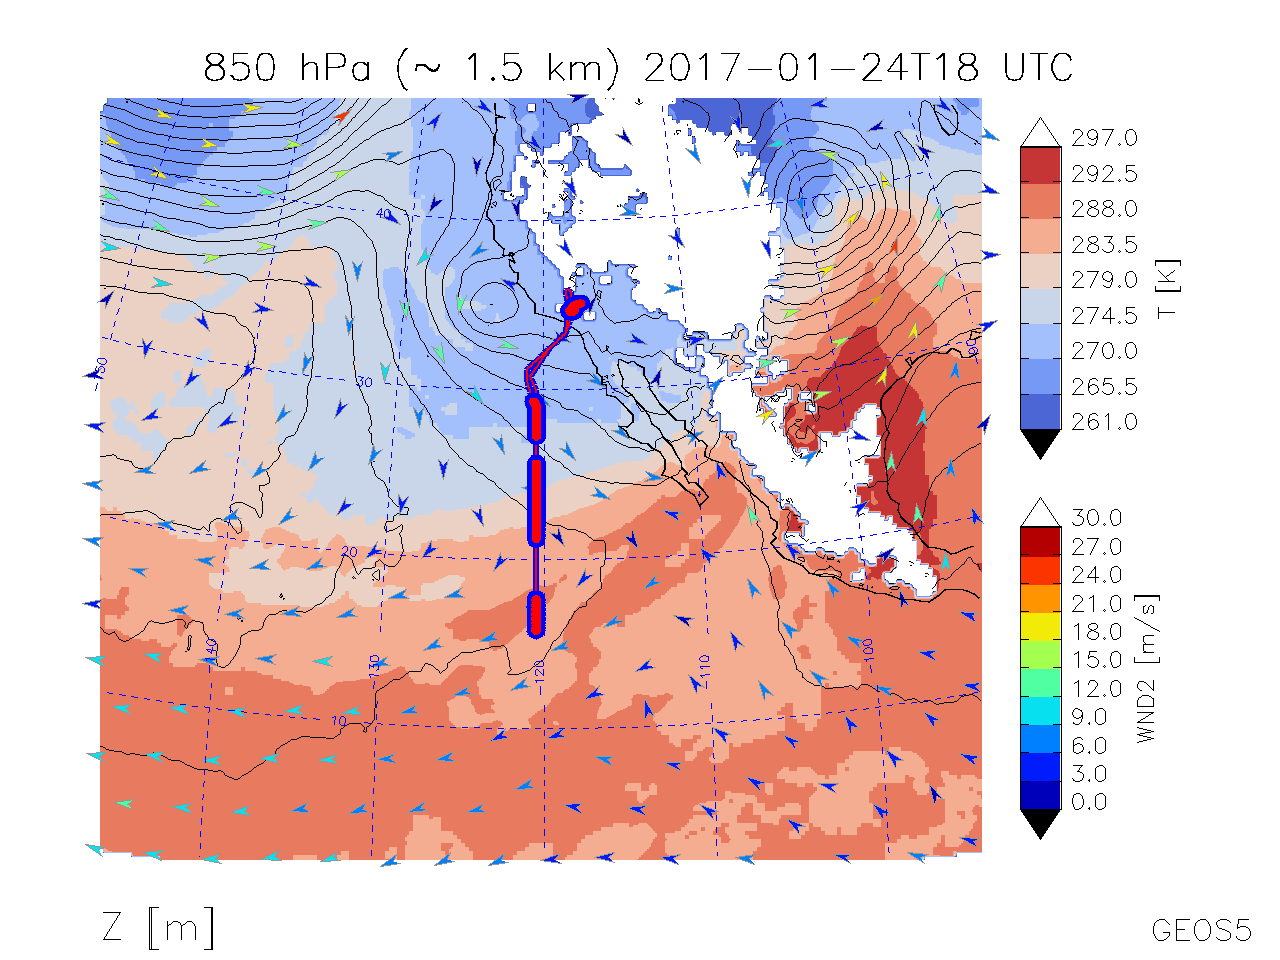
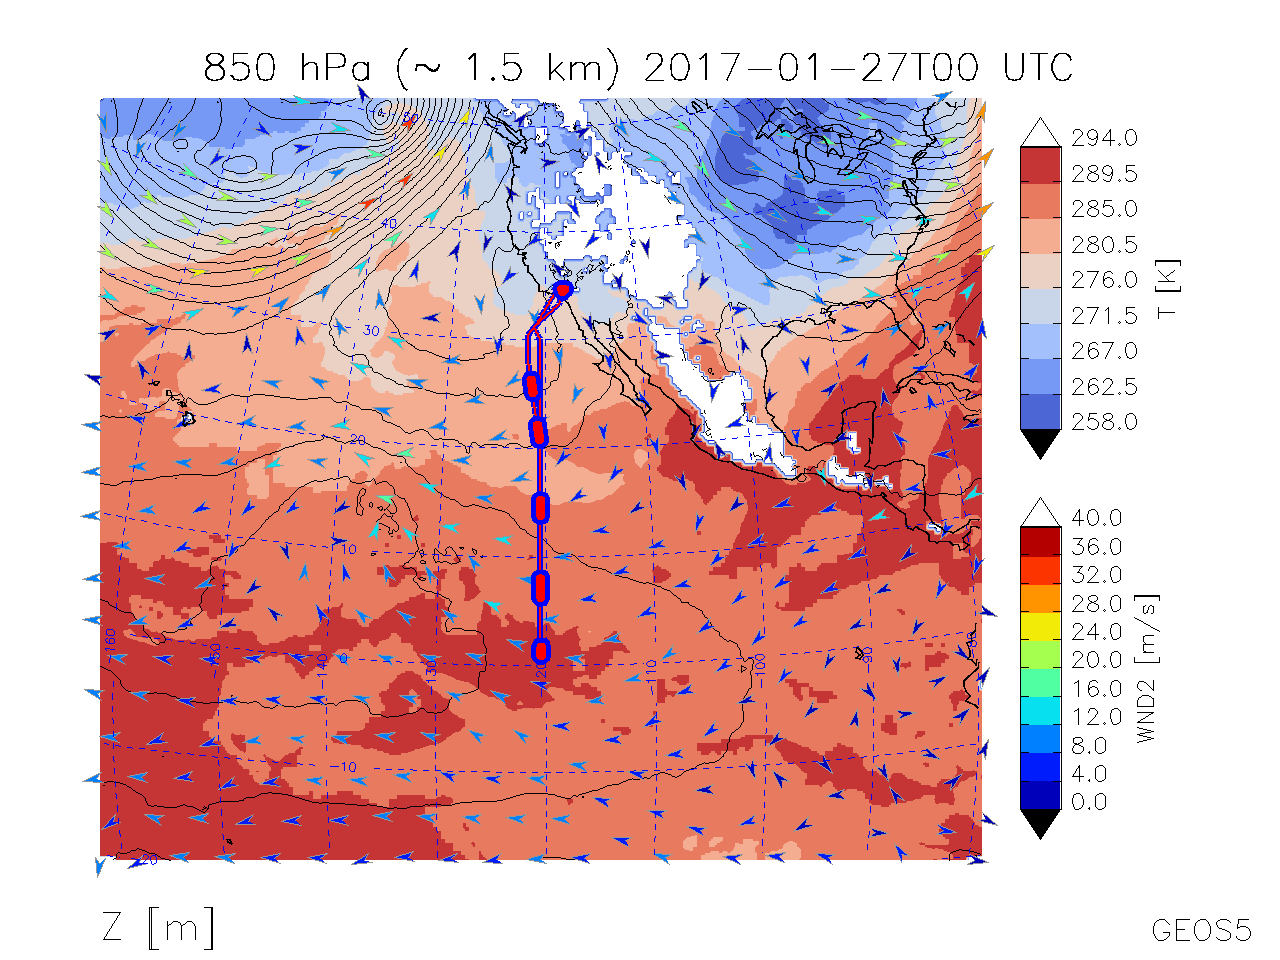
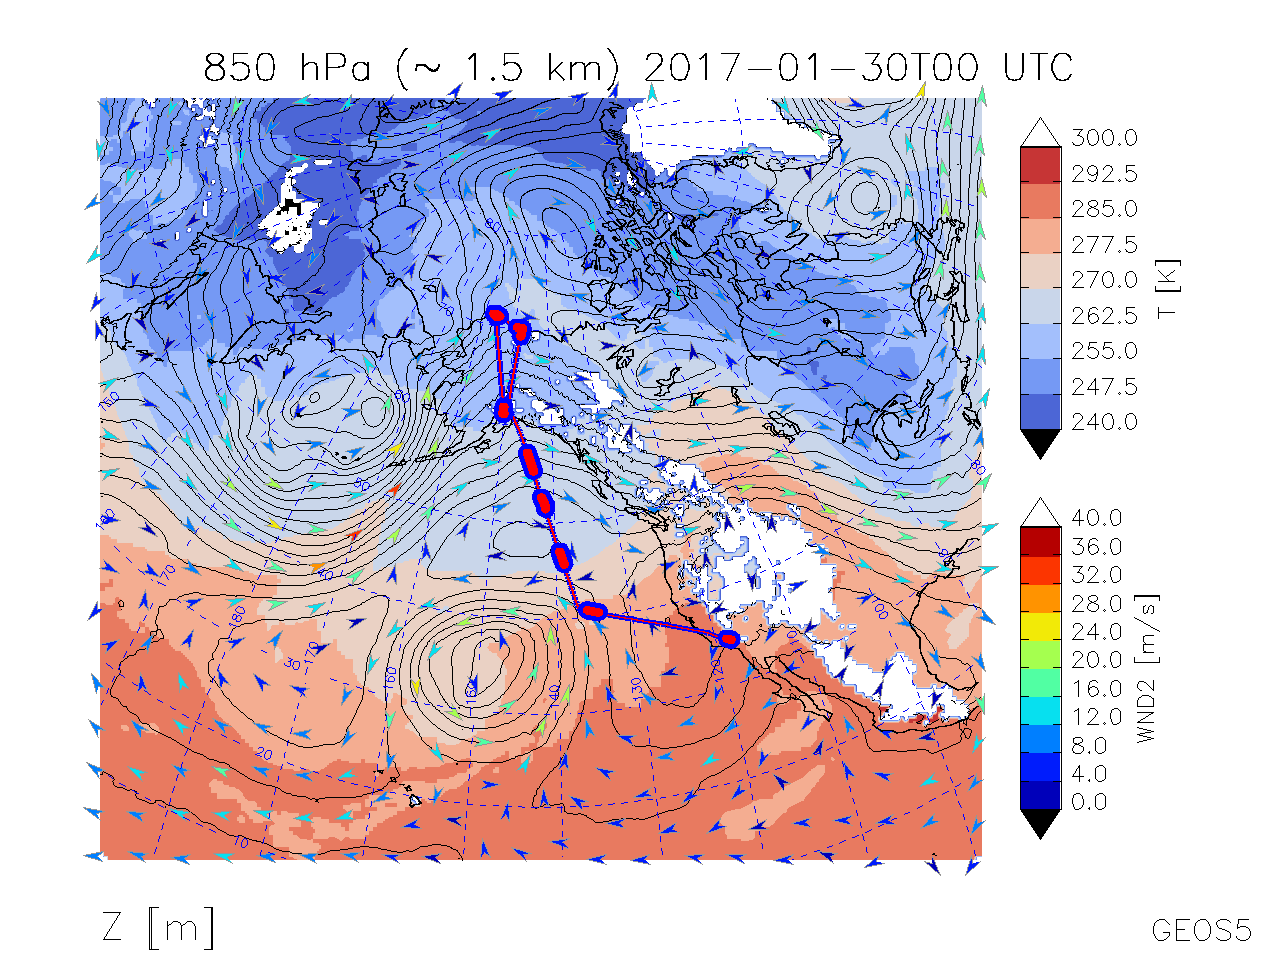
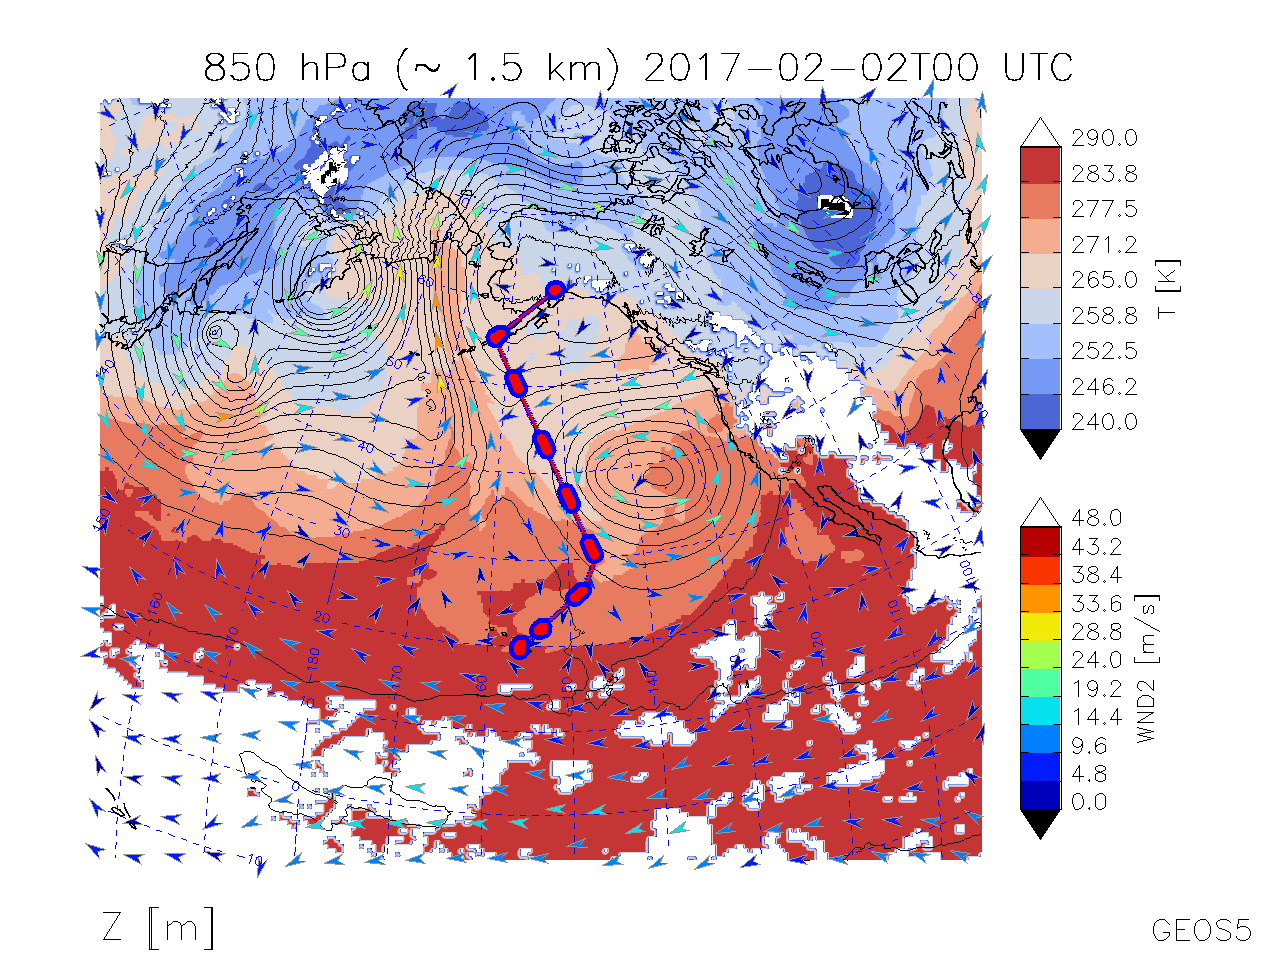
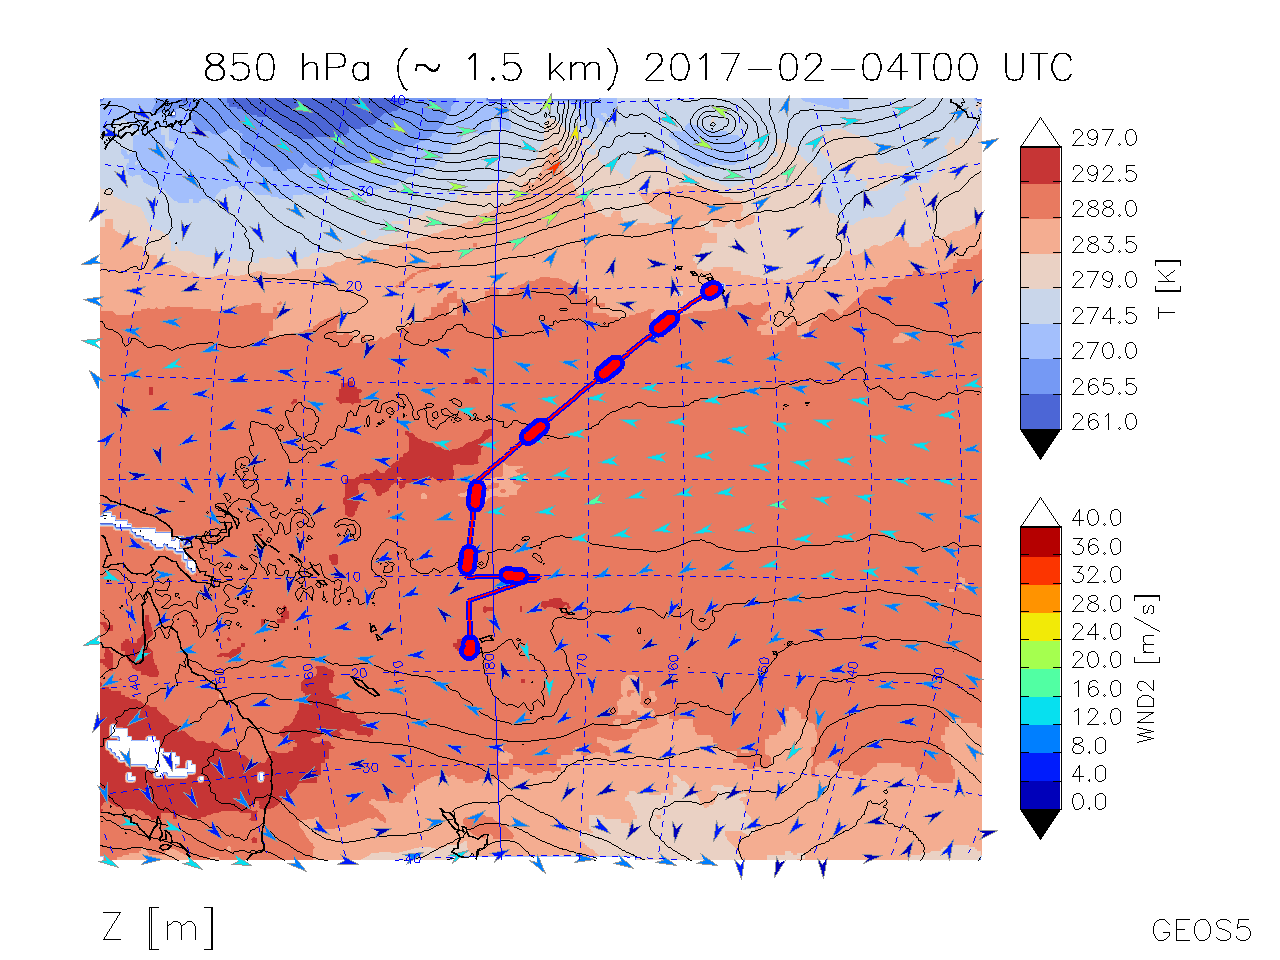
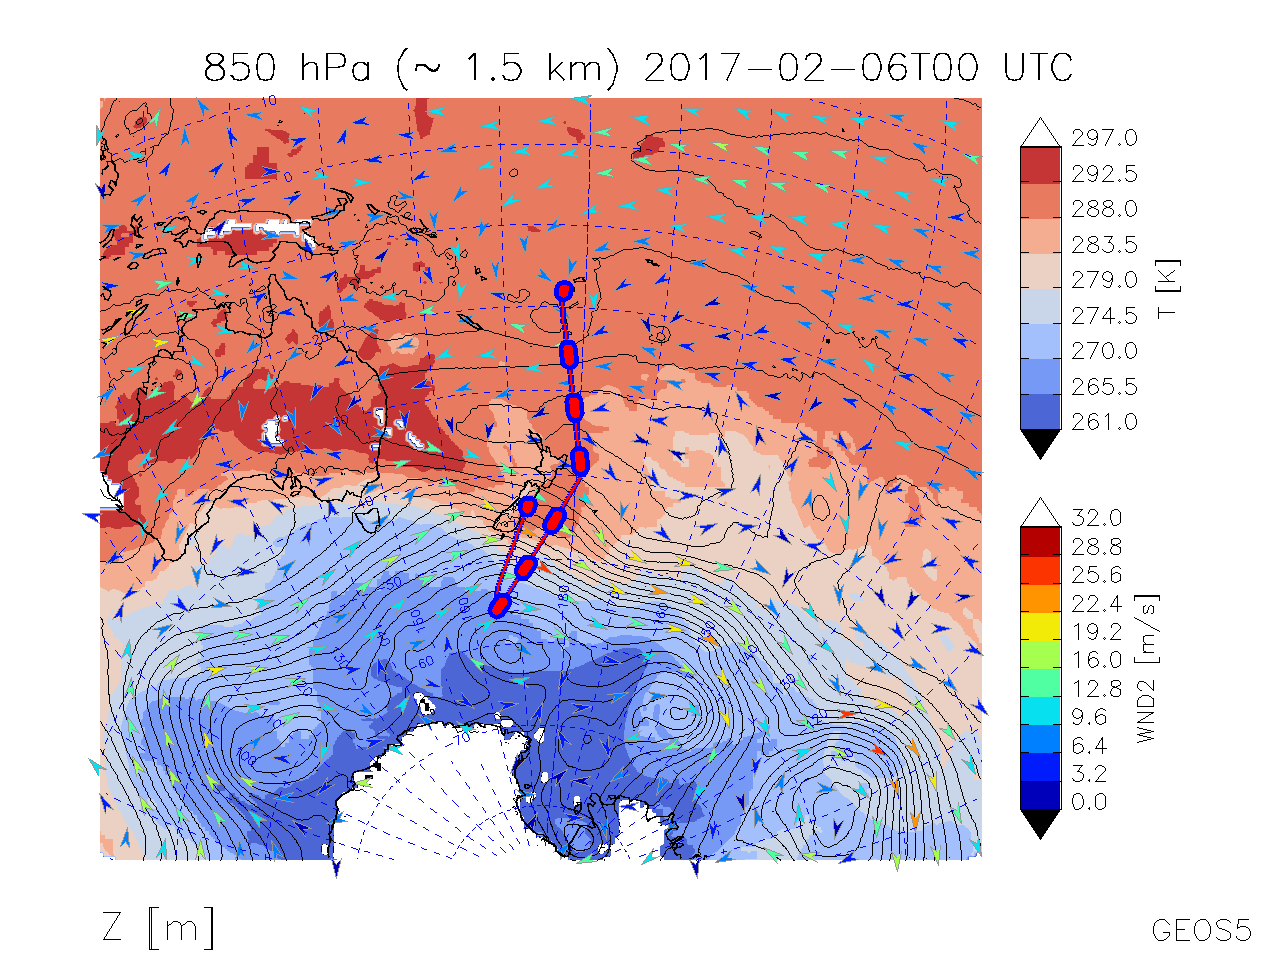
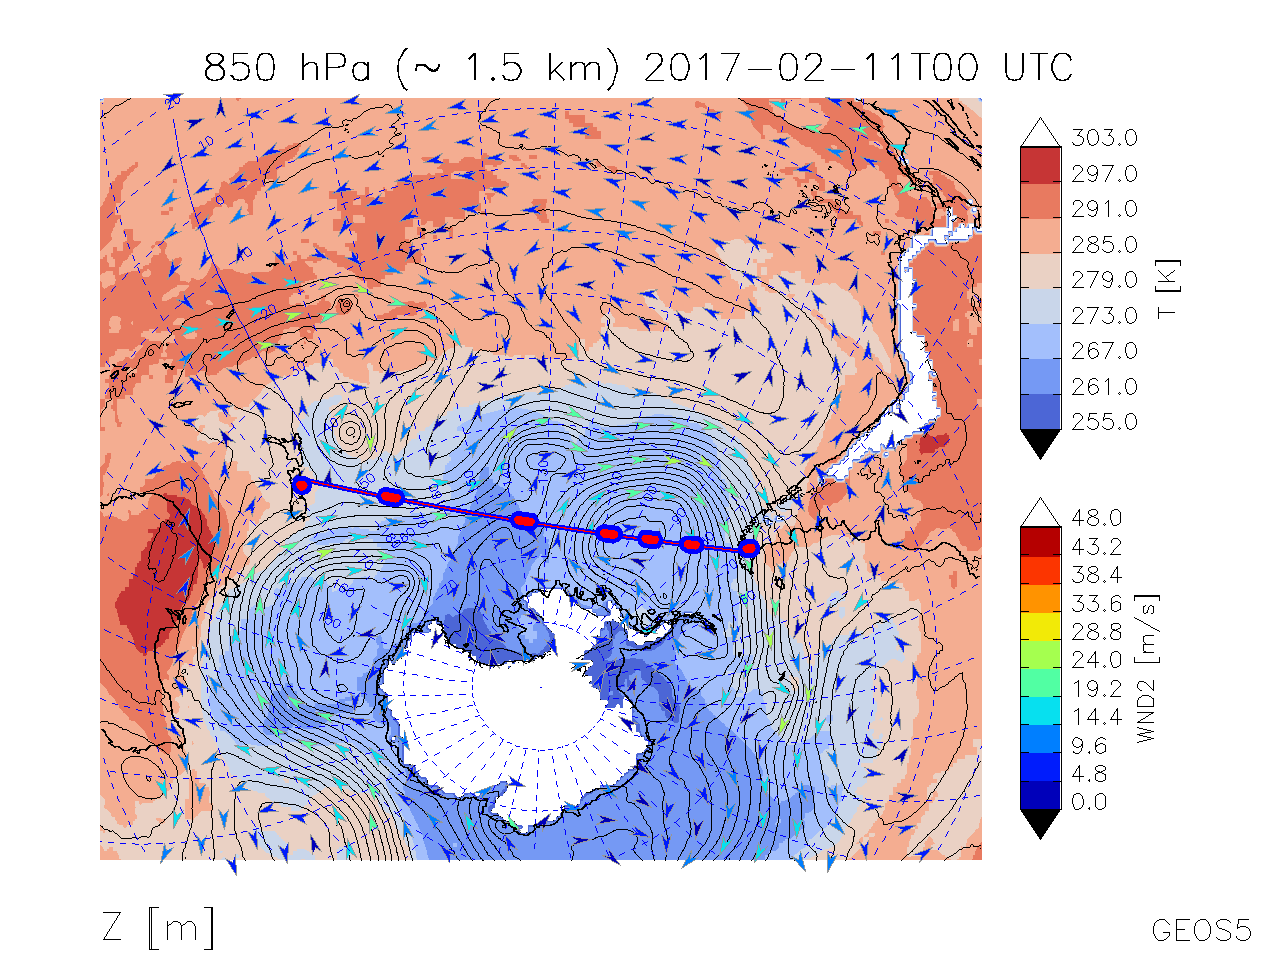
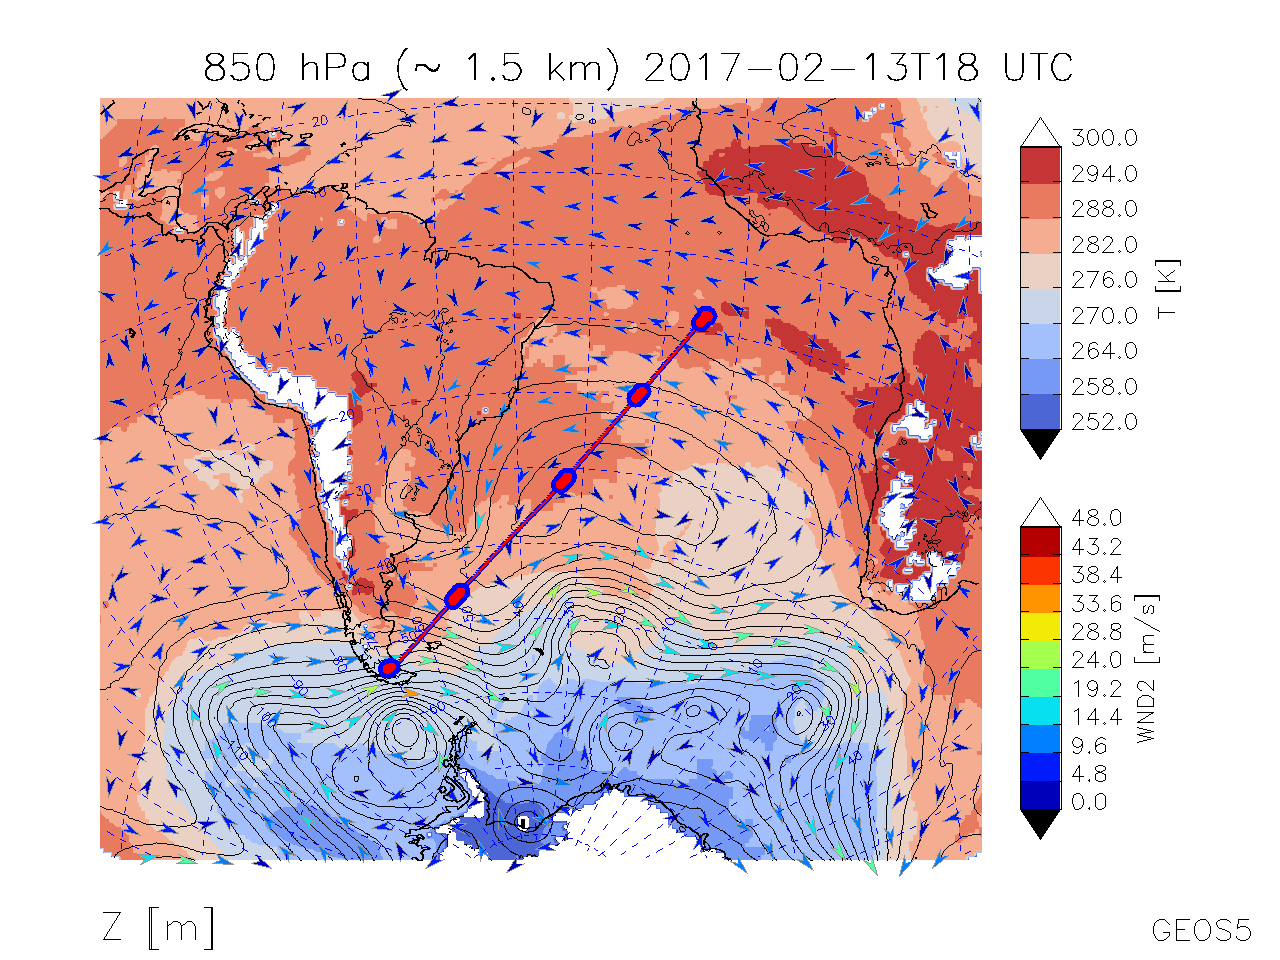
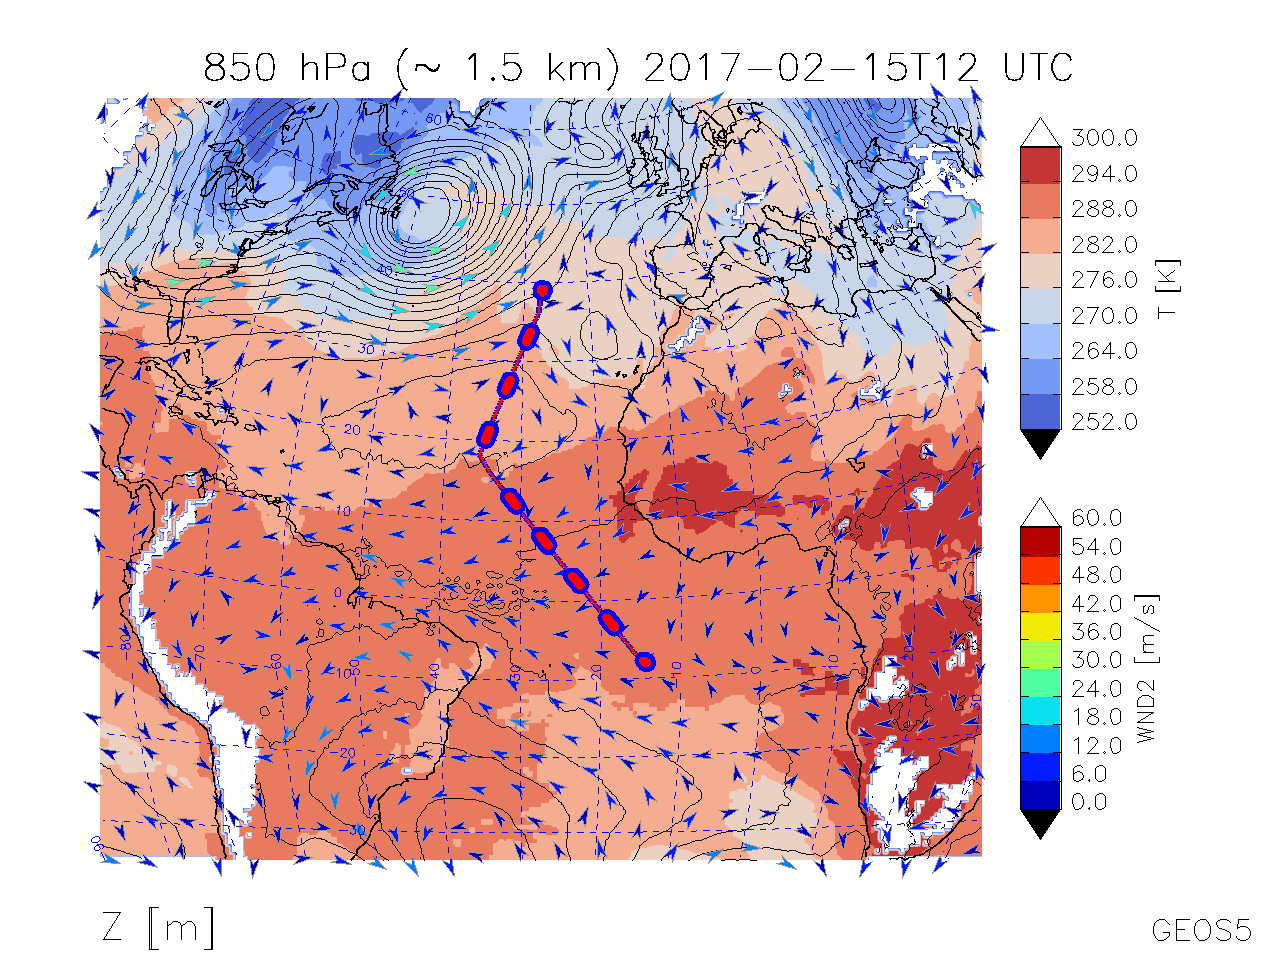
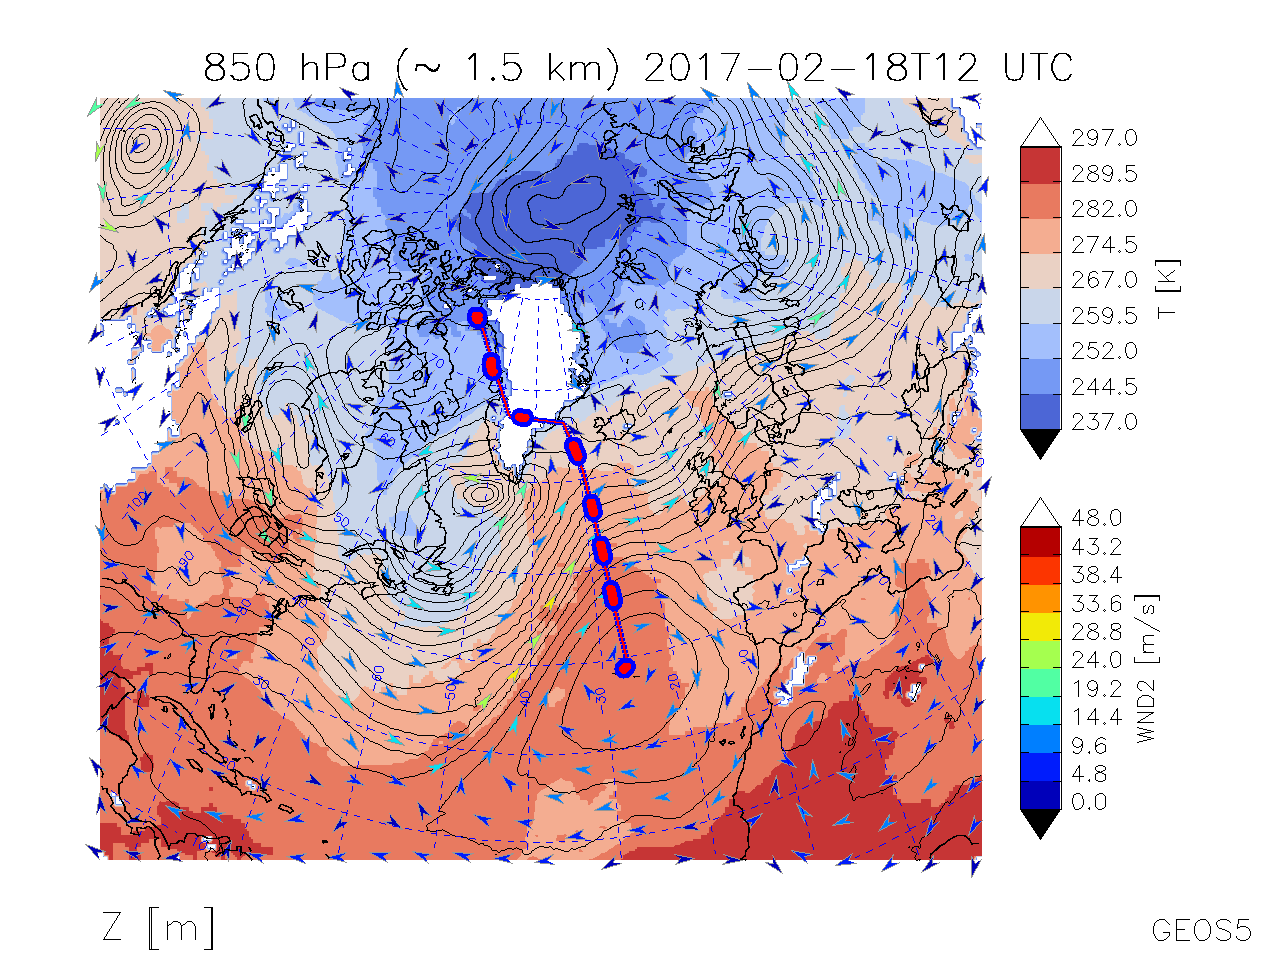
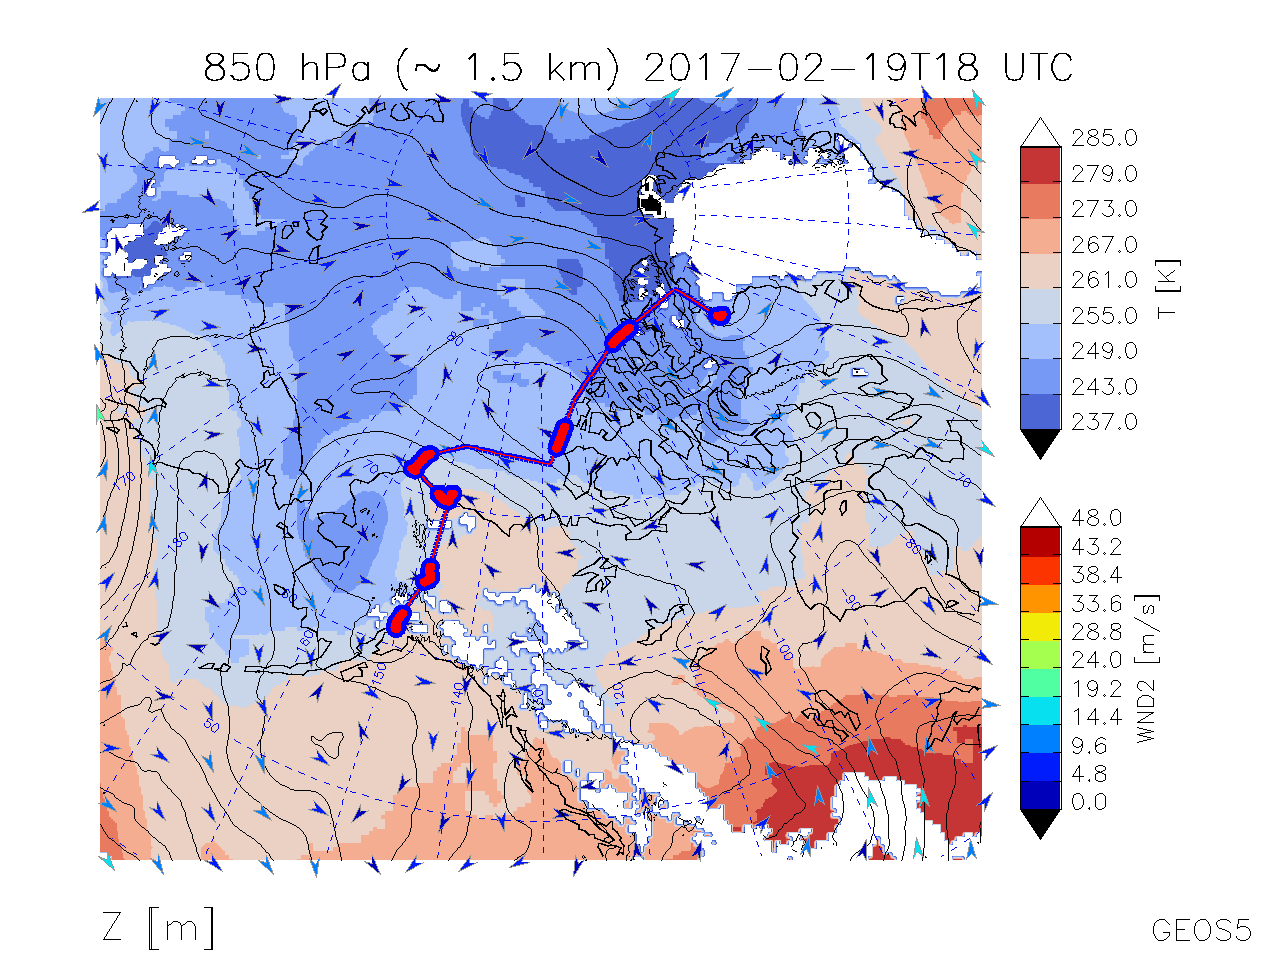
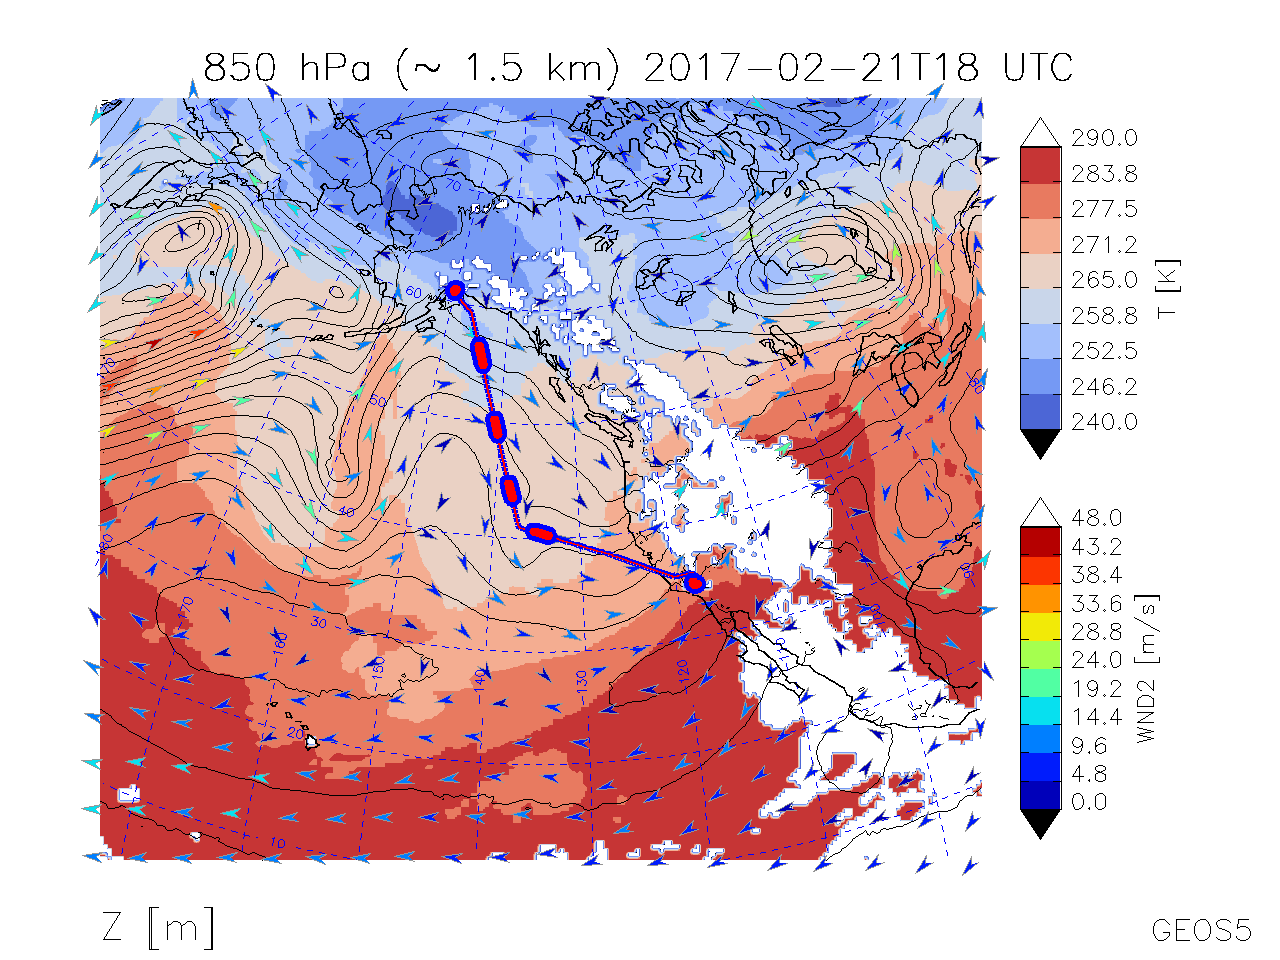
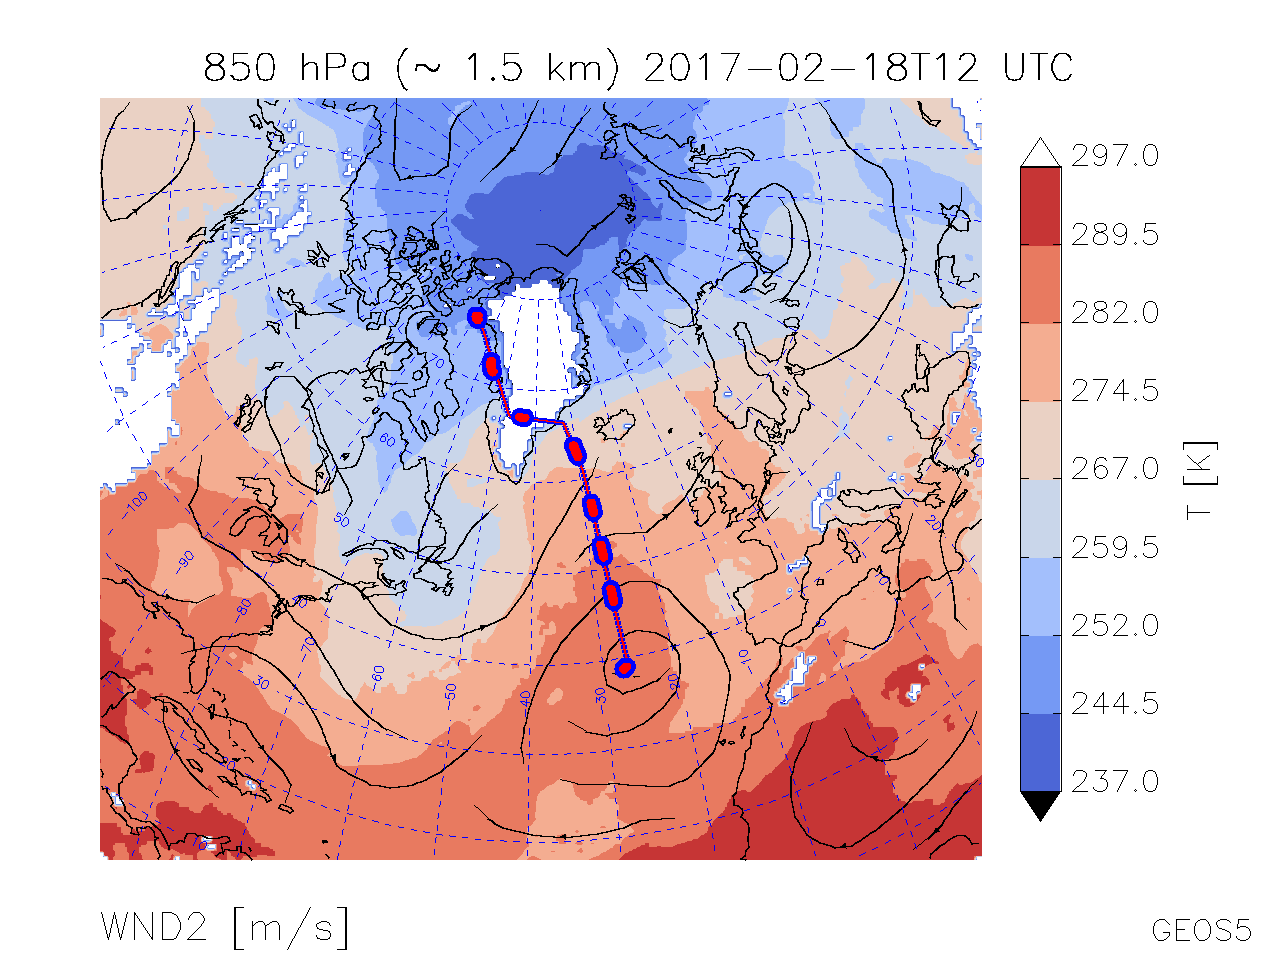
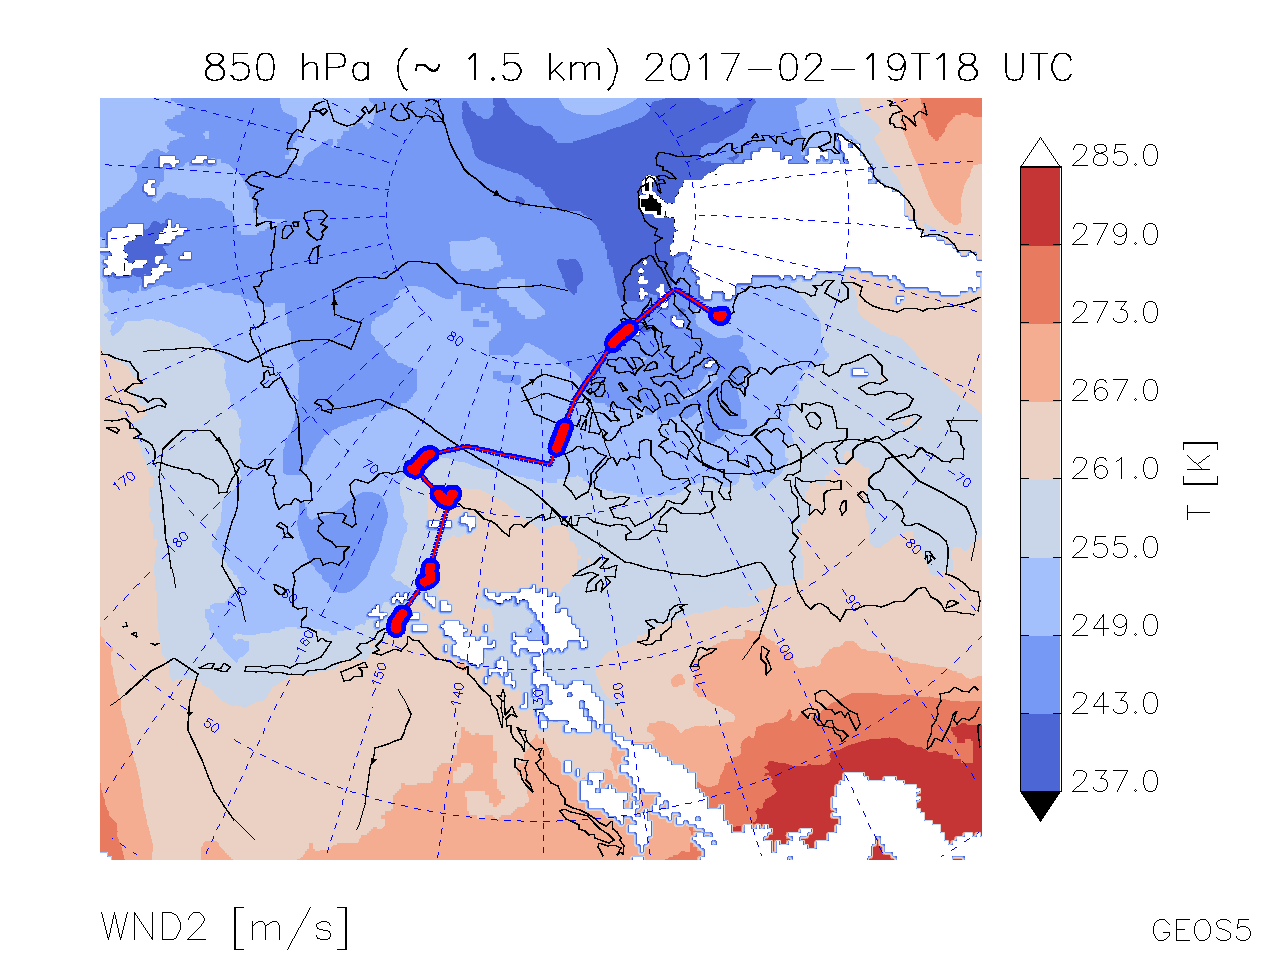
| Map of T, Winds, Geopot. Hgt. @ 850 hPa | |
|
|
|
|
|
|
|
|
|
|
|
|
Map of T, Winds, Geopot. Hgt. @ 850 hPa |
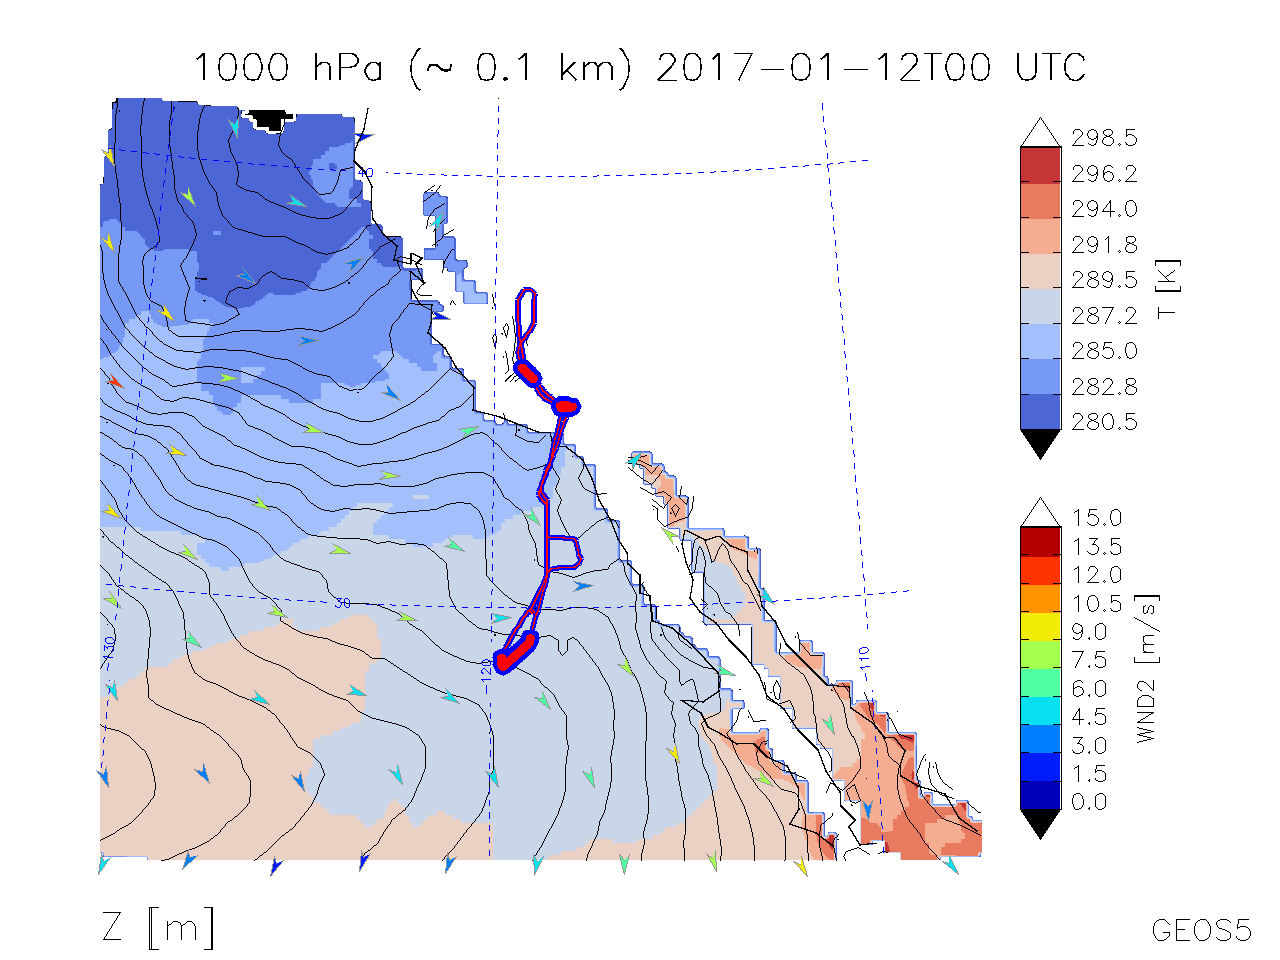
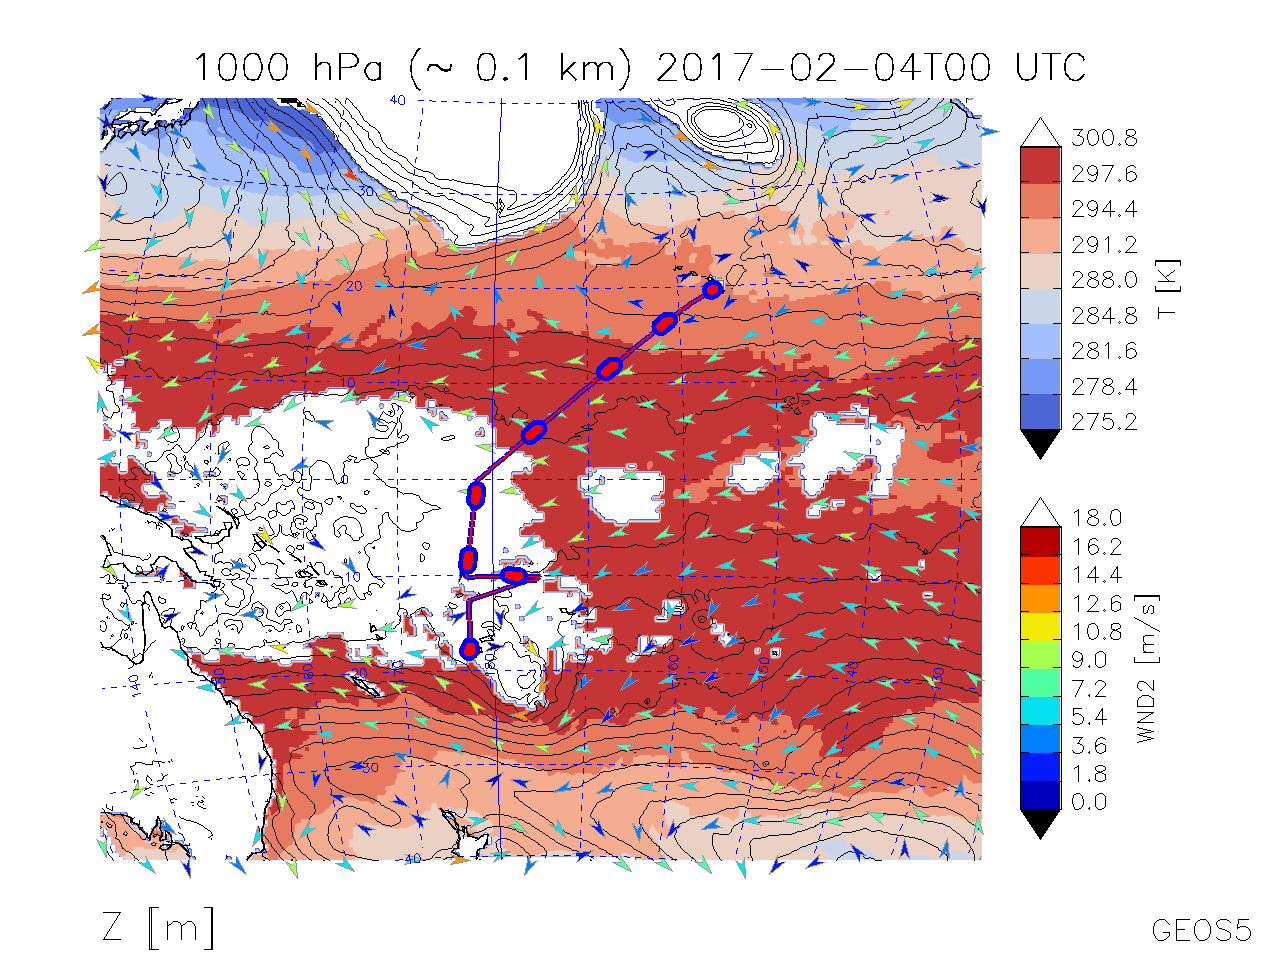
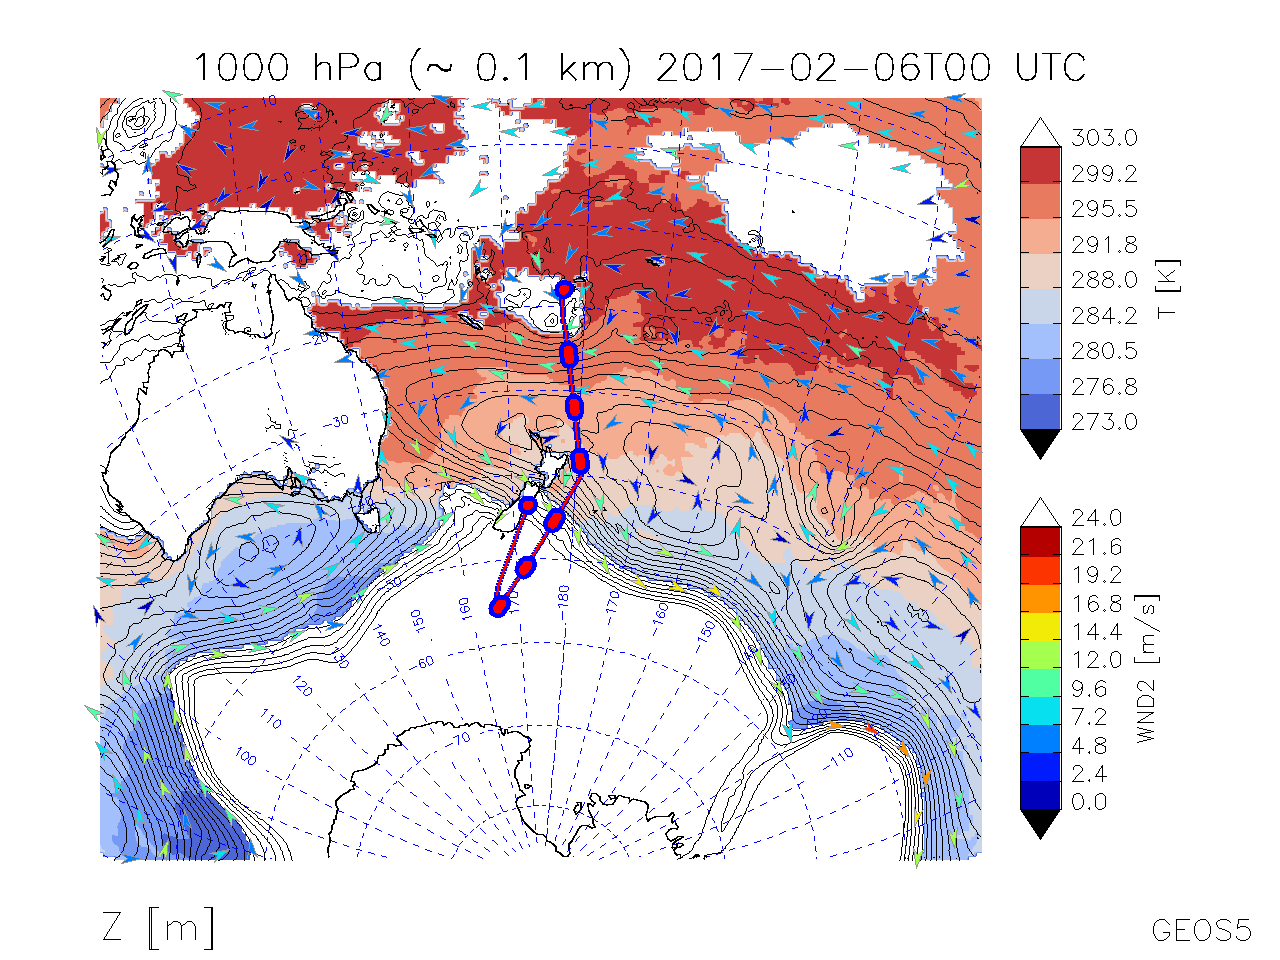
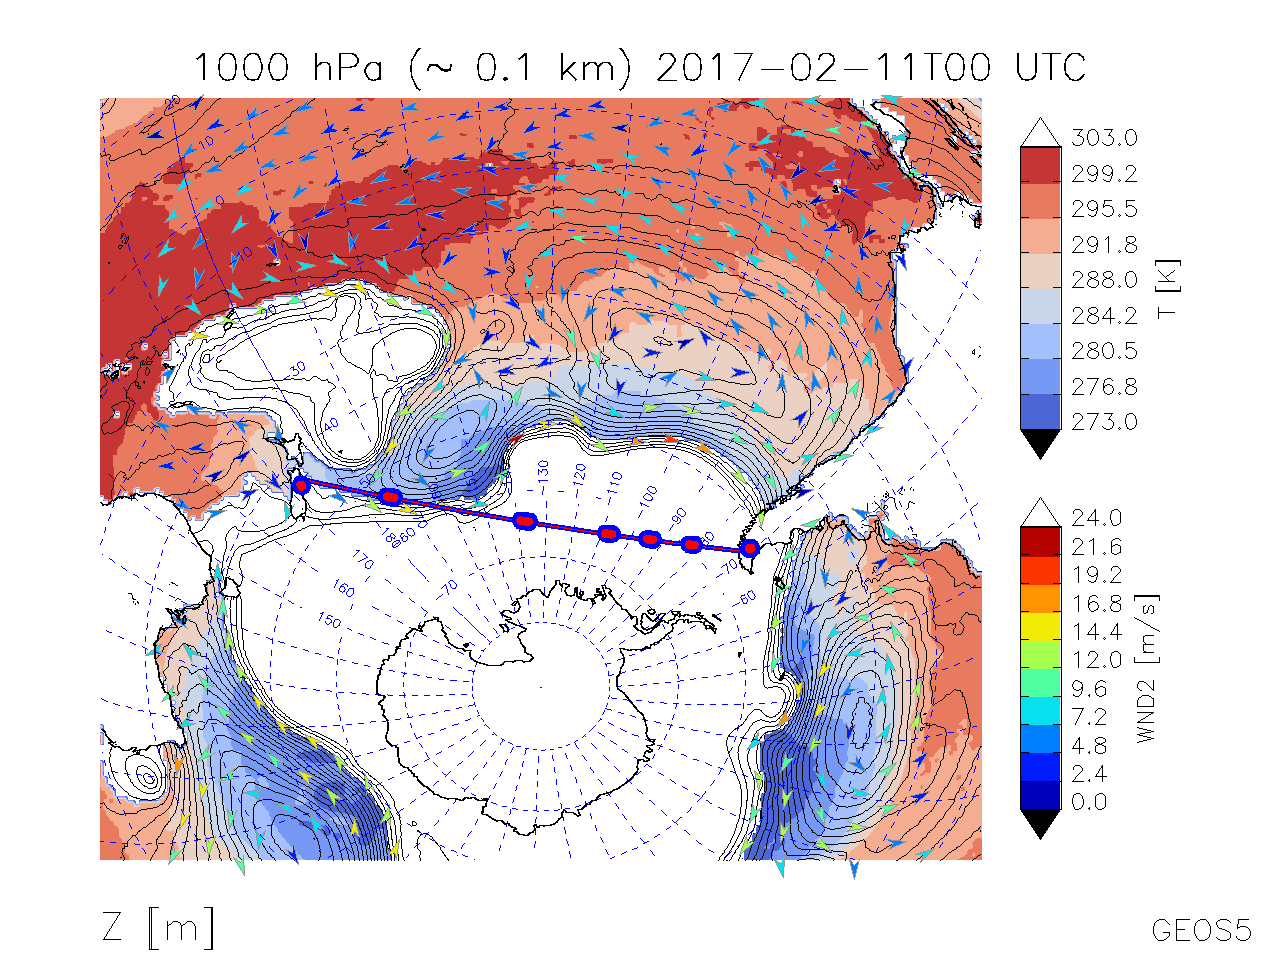
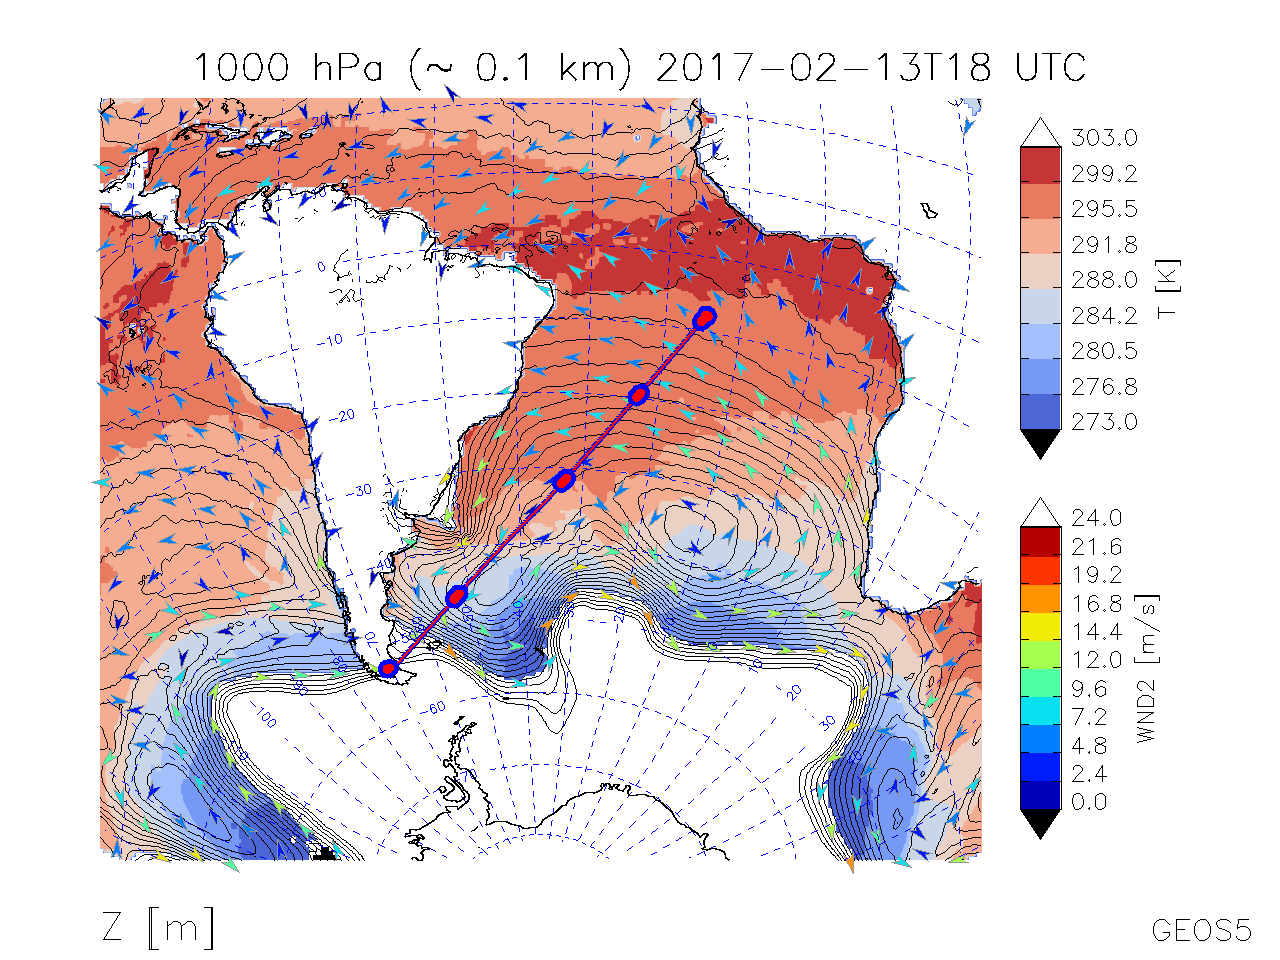
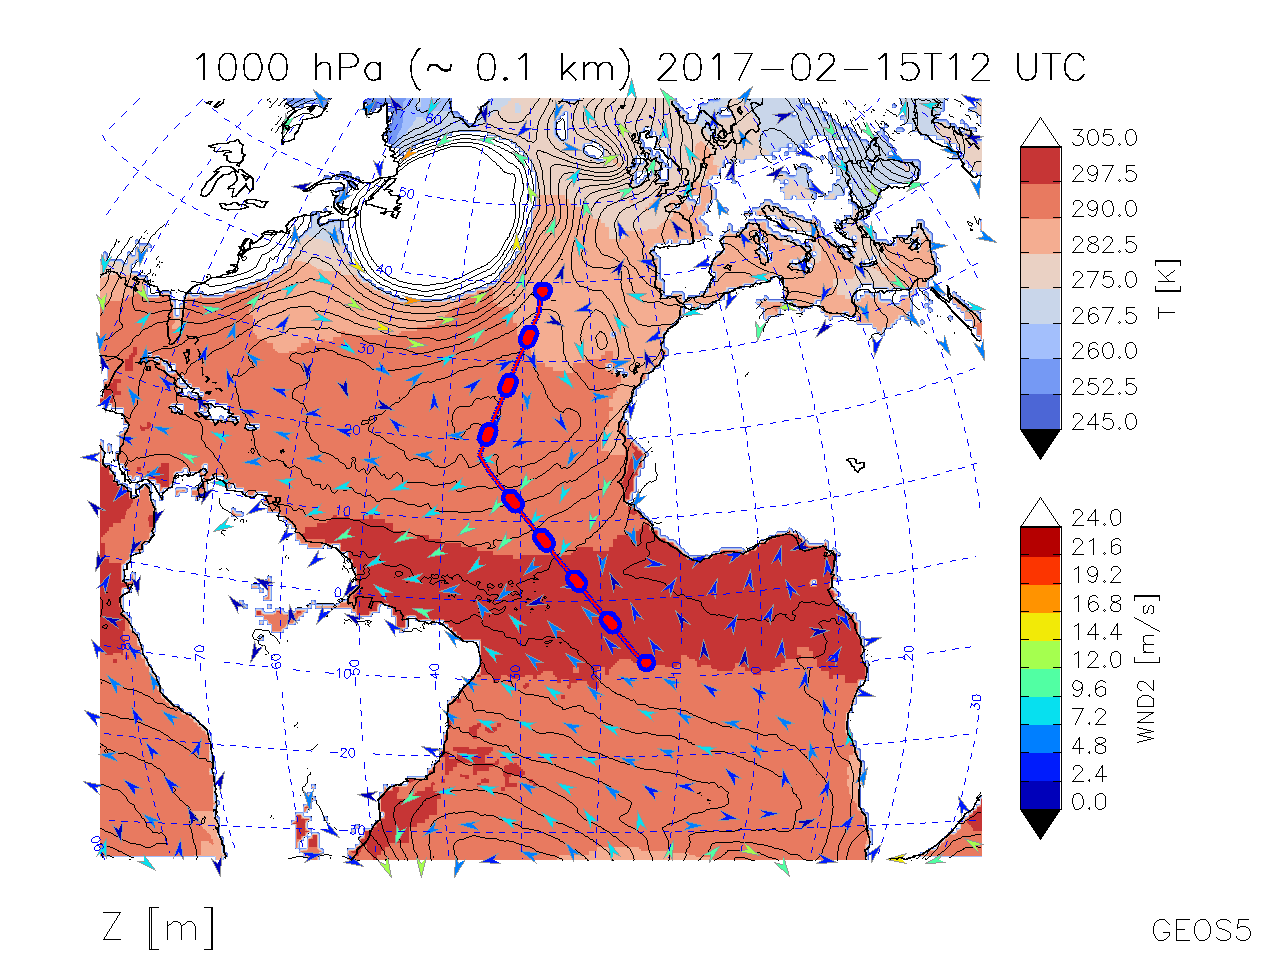
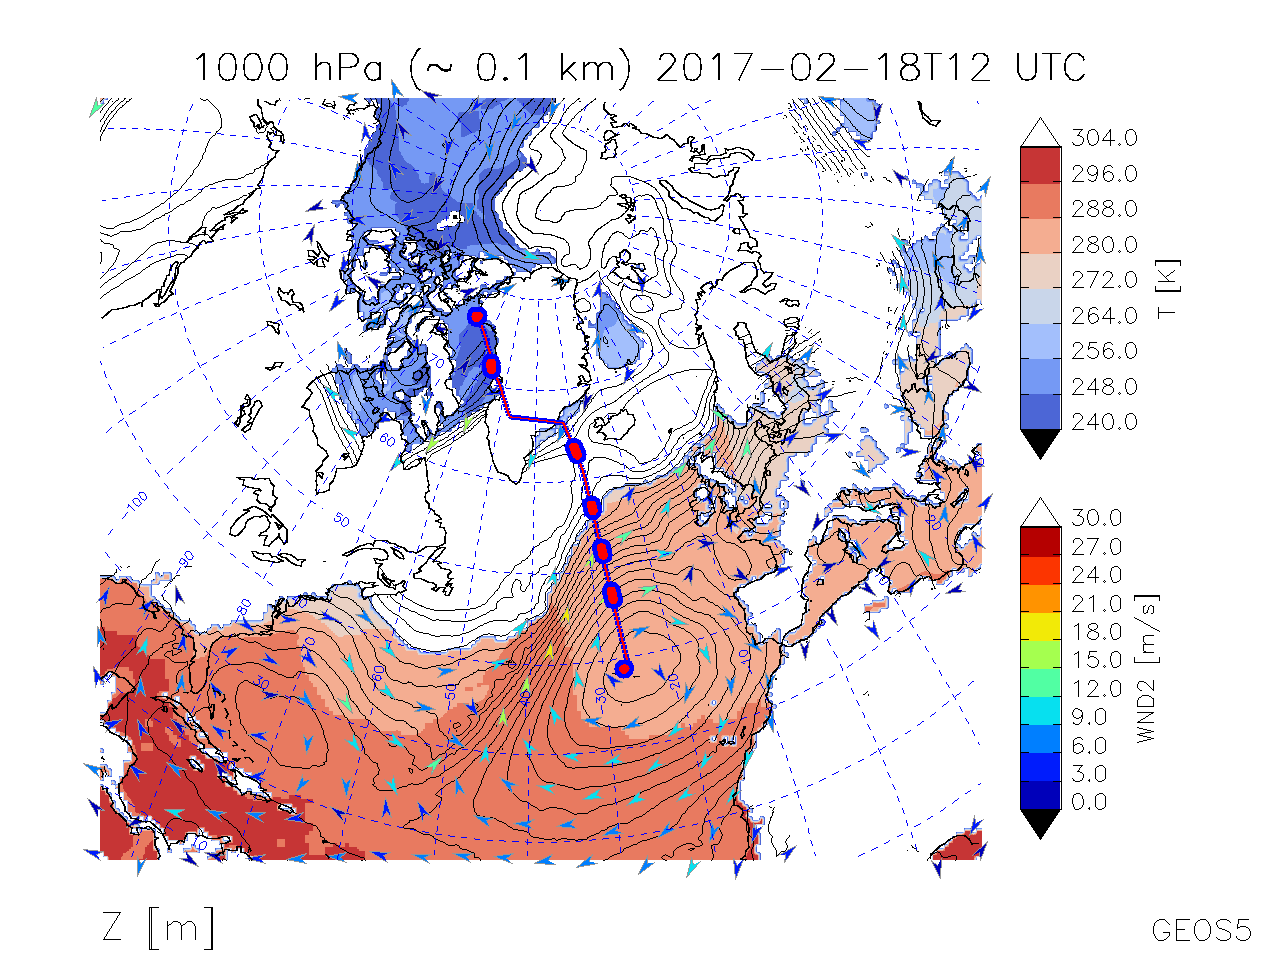
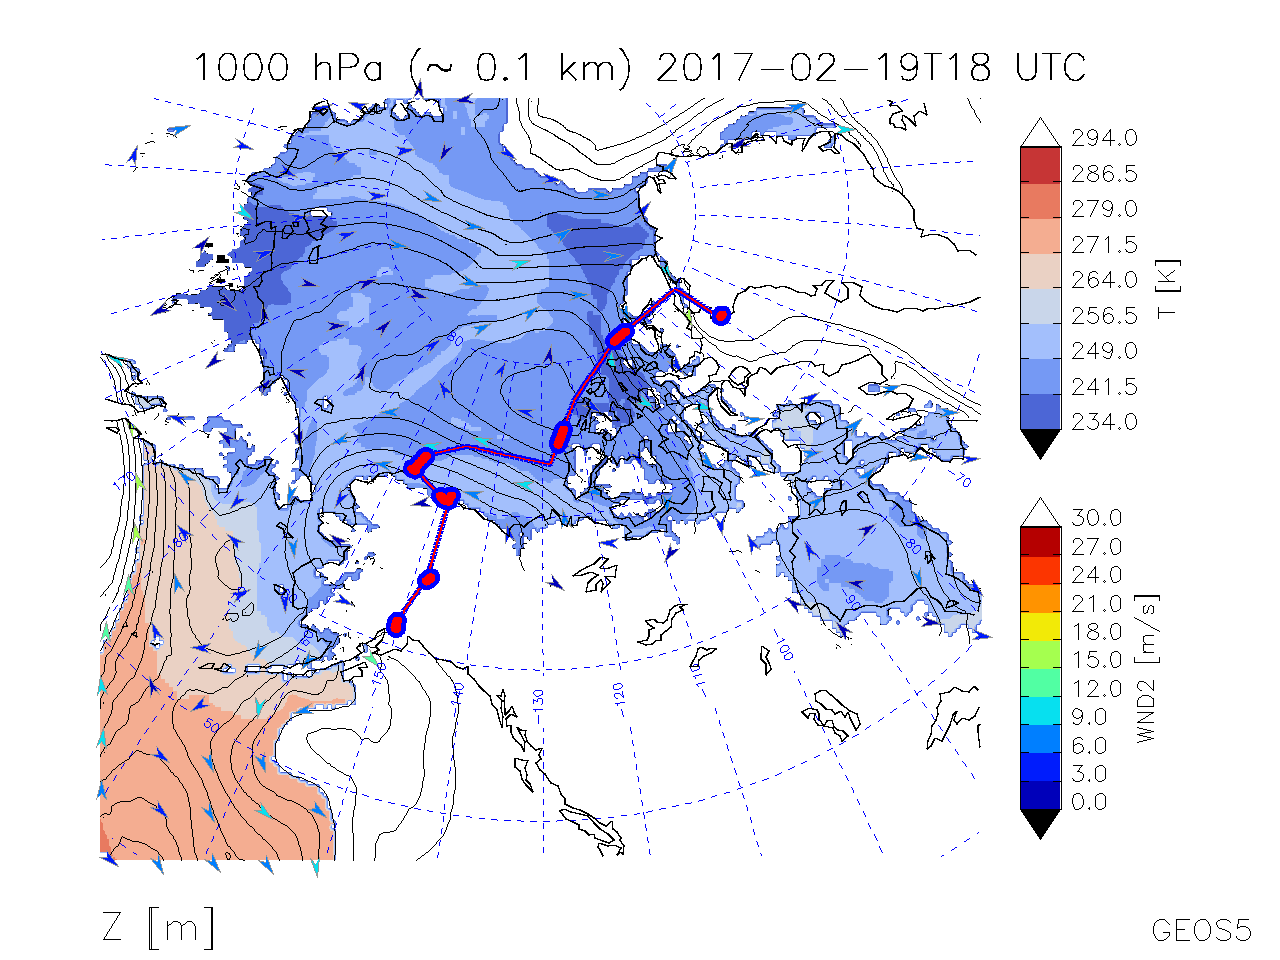
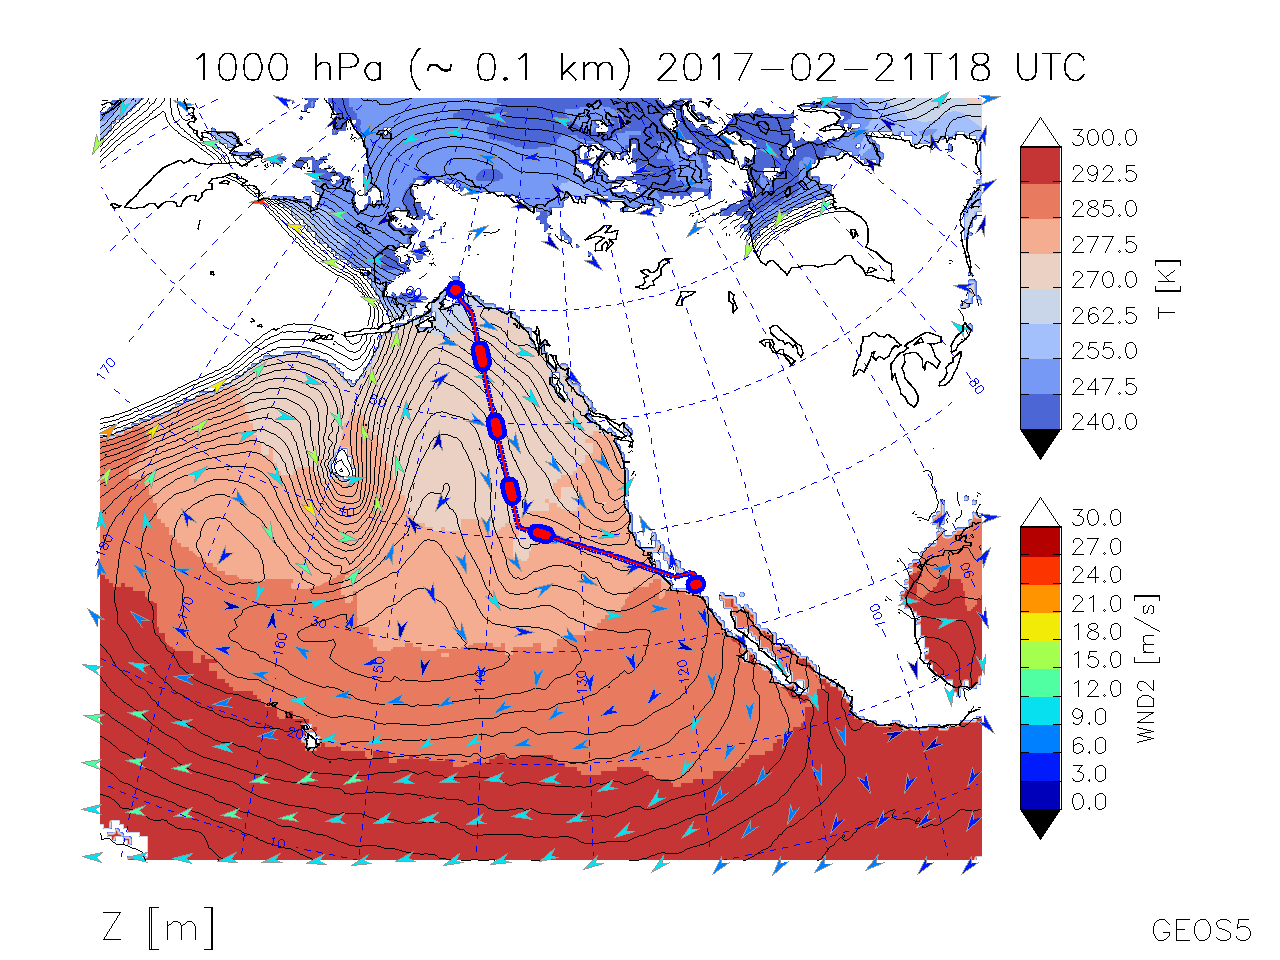
| Map of T, Winds, Geopot. Hgt. @ 1000 hPa | |
|
|
|
|
|
|
|
|
|
|
|
|
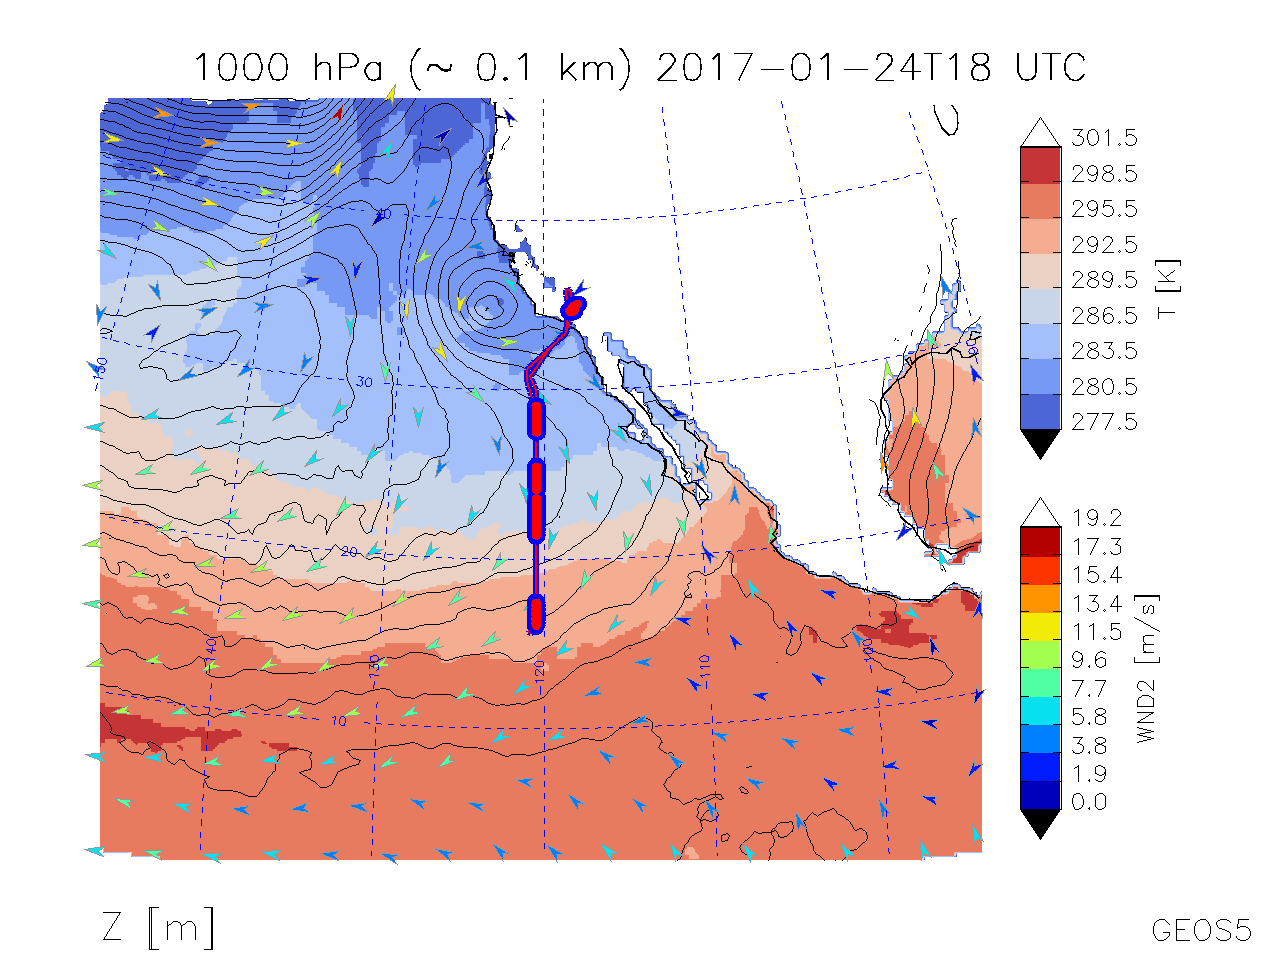
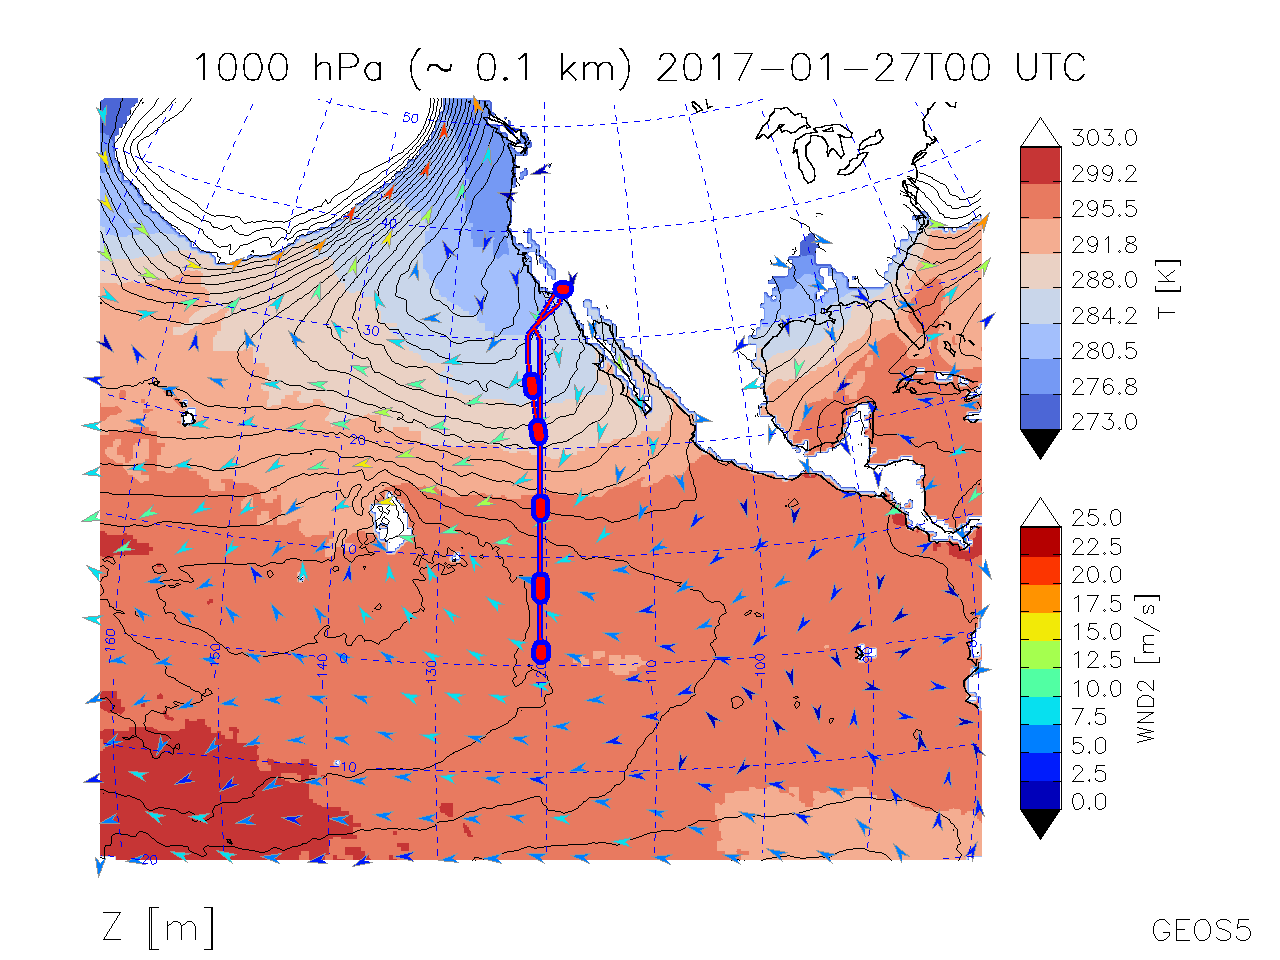
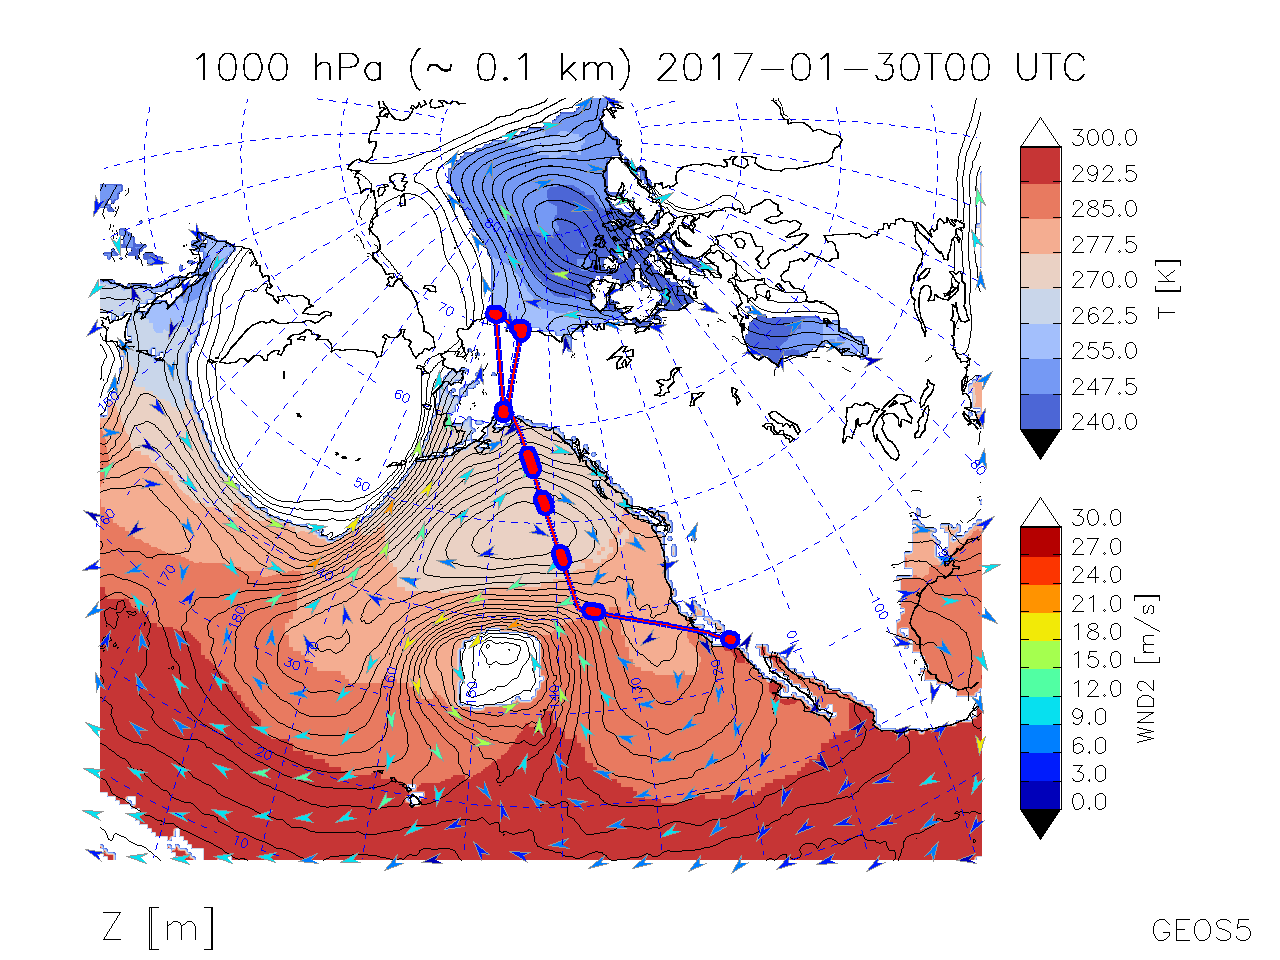
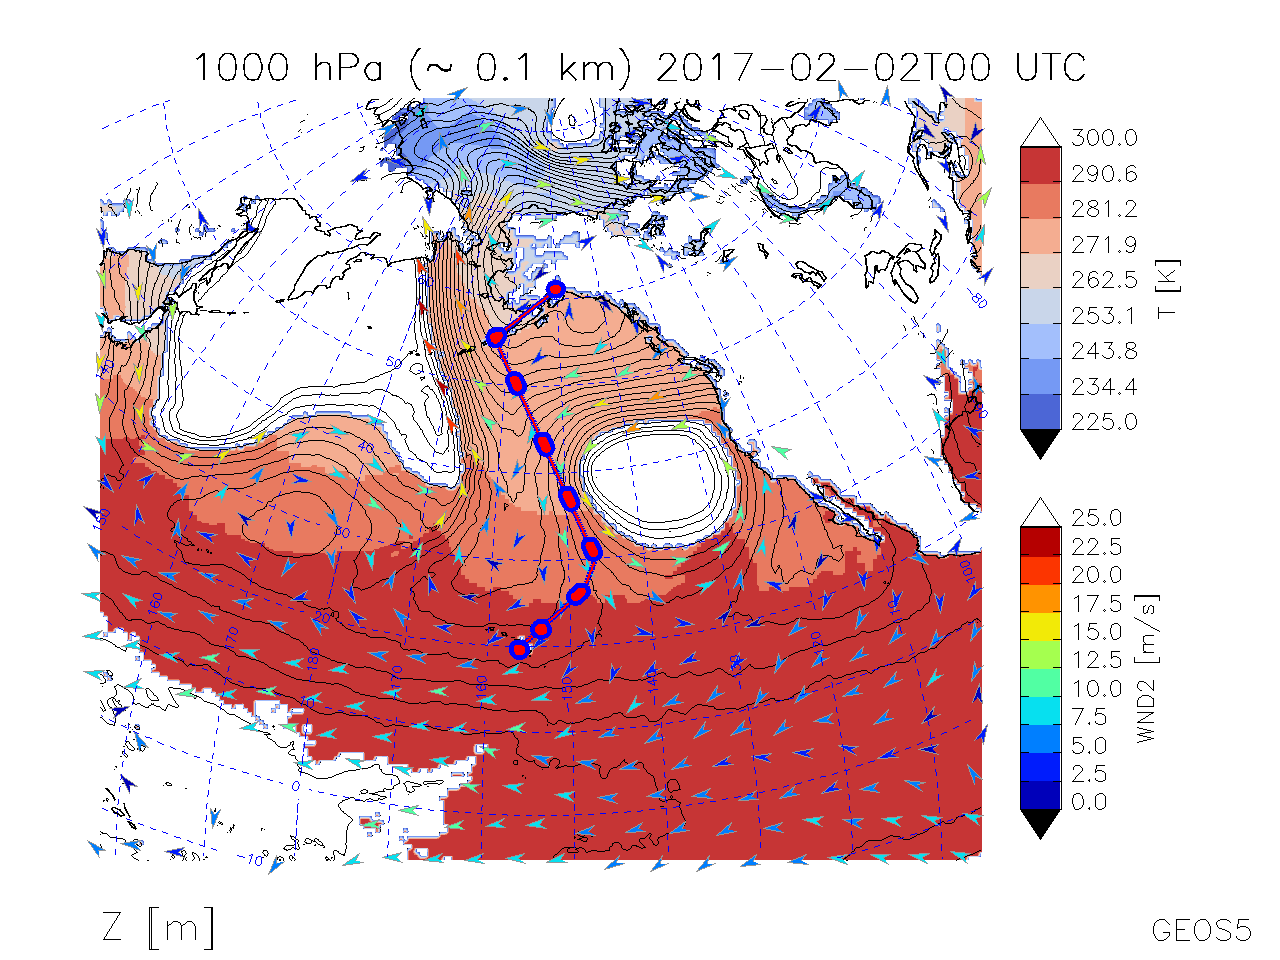
Map of T, Winds, Geopot. Hgt. @ 1000 hPa |
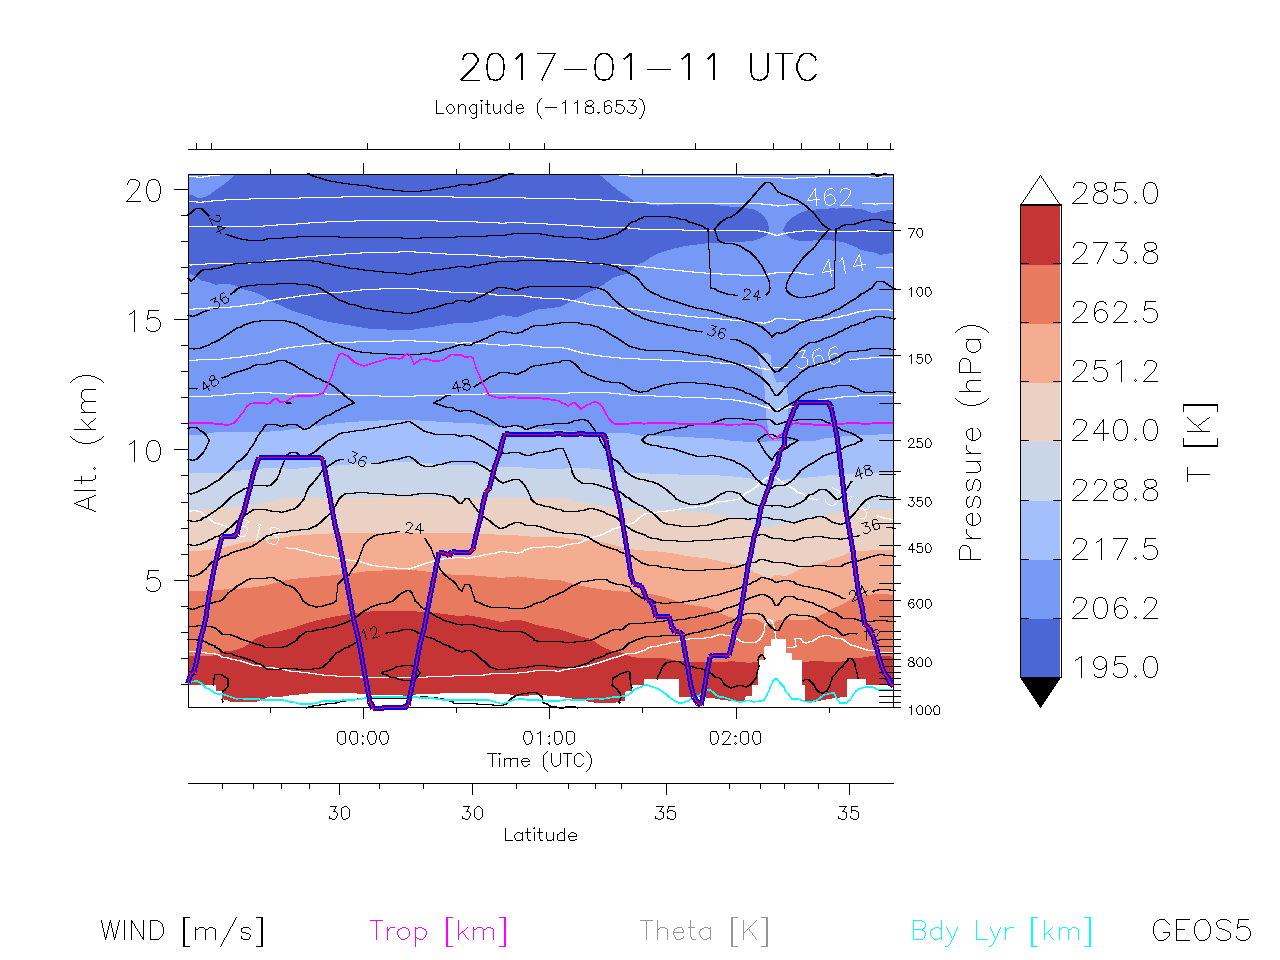
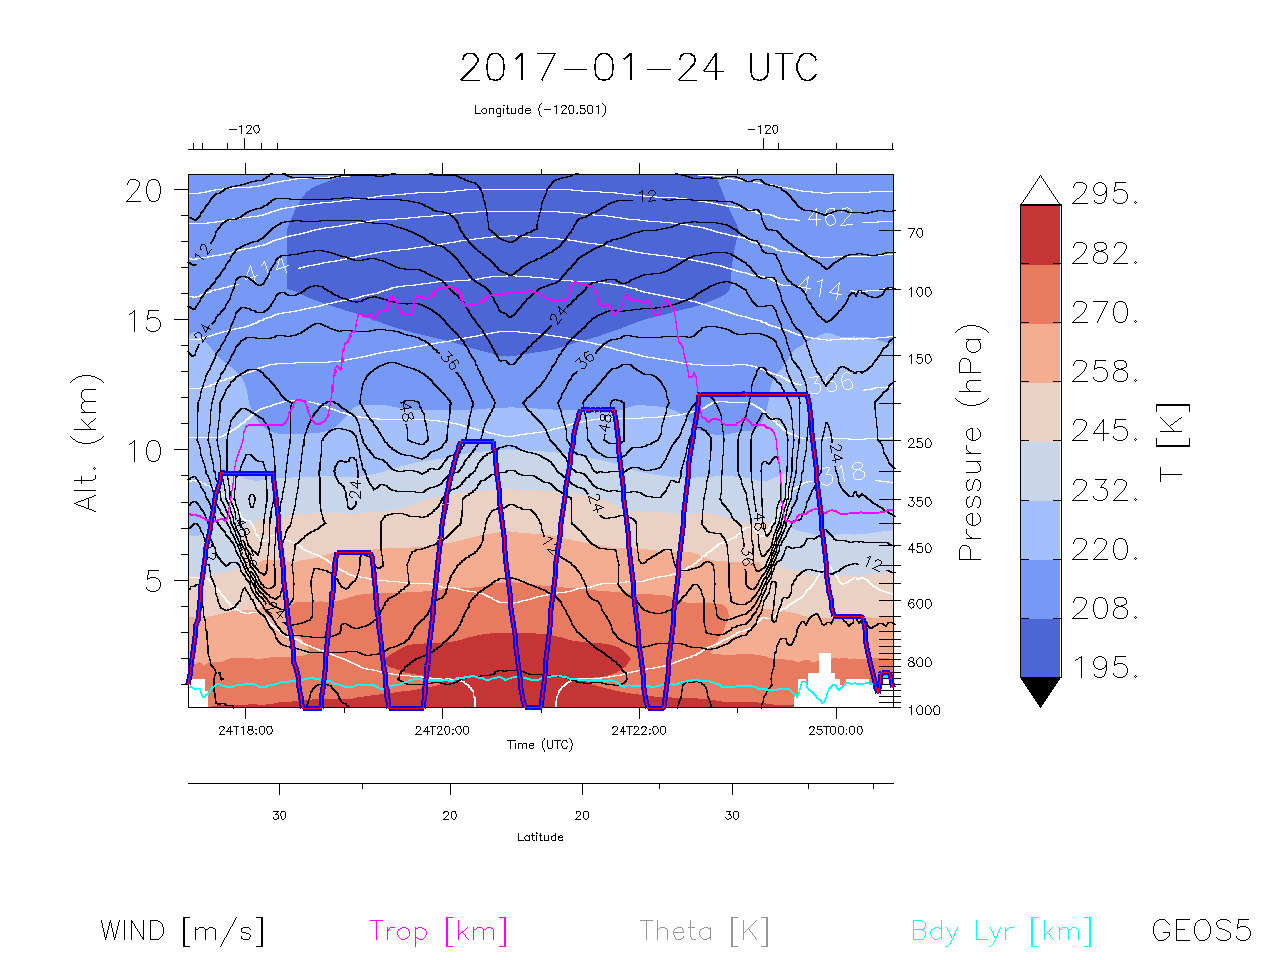
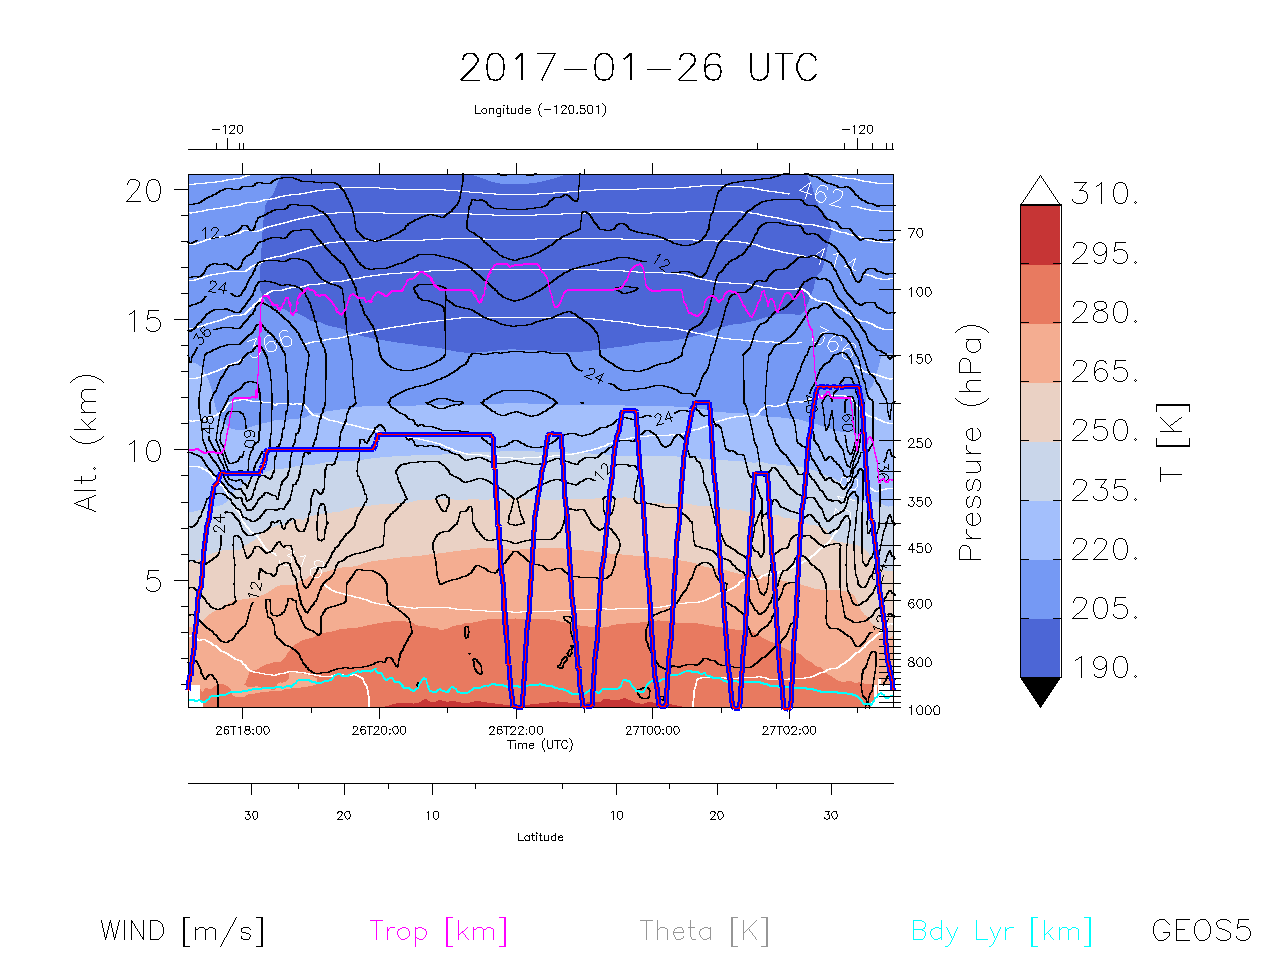
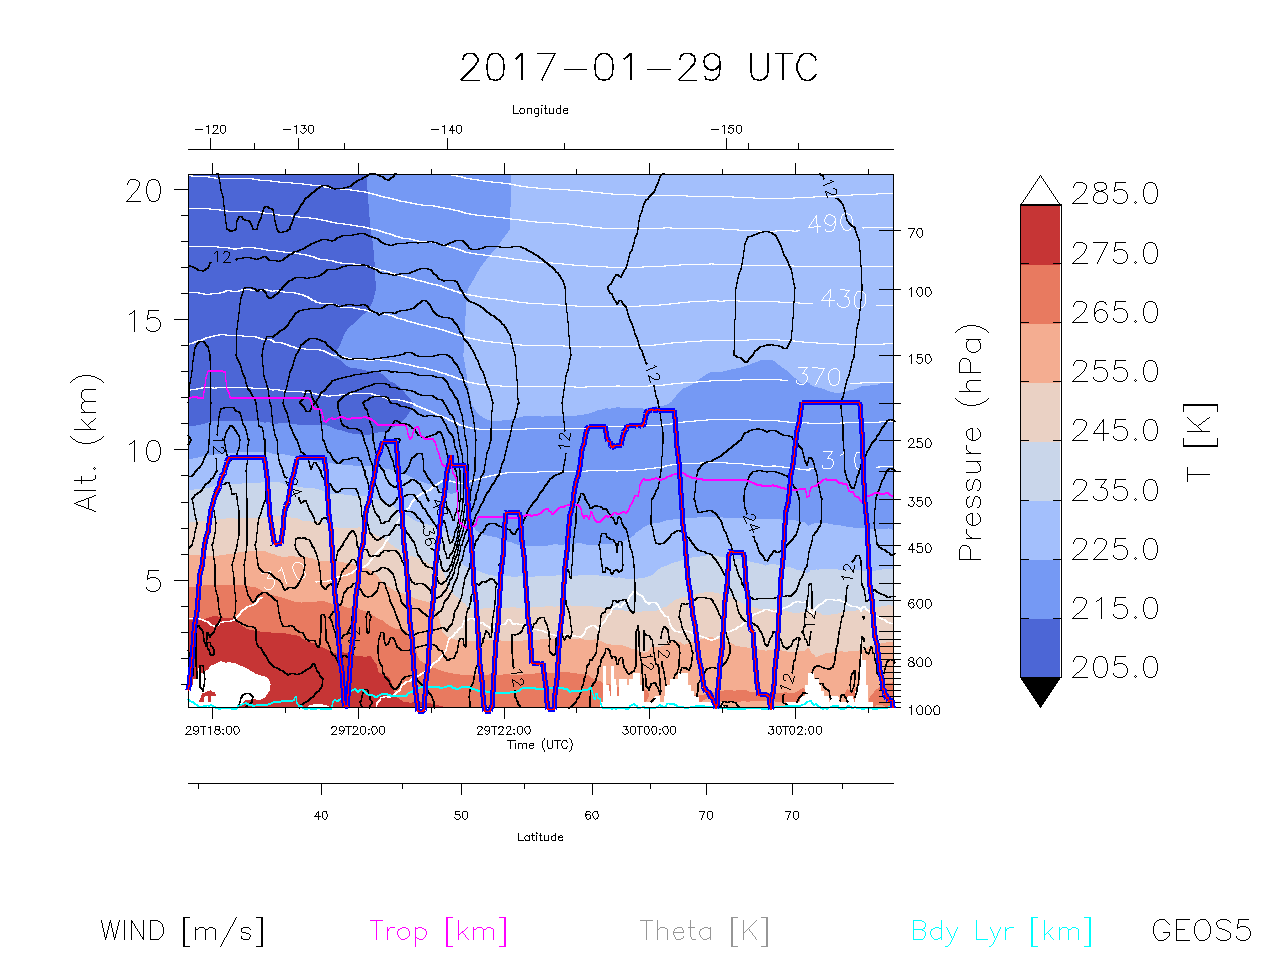
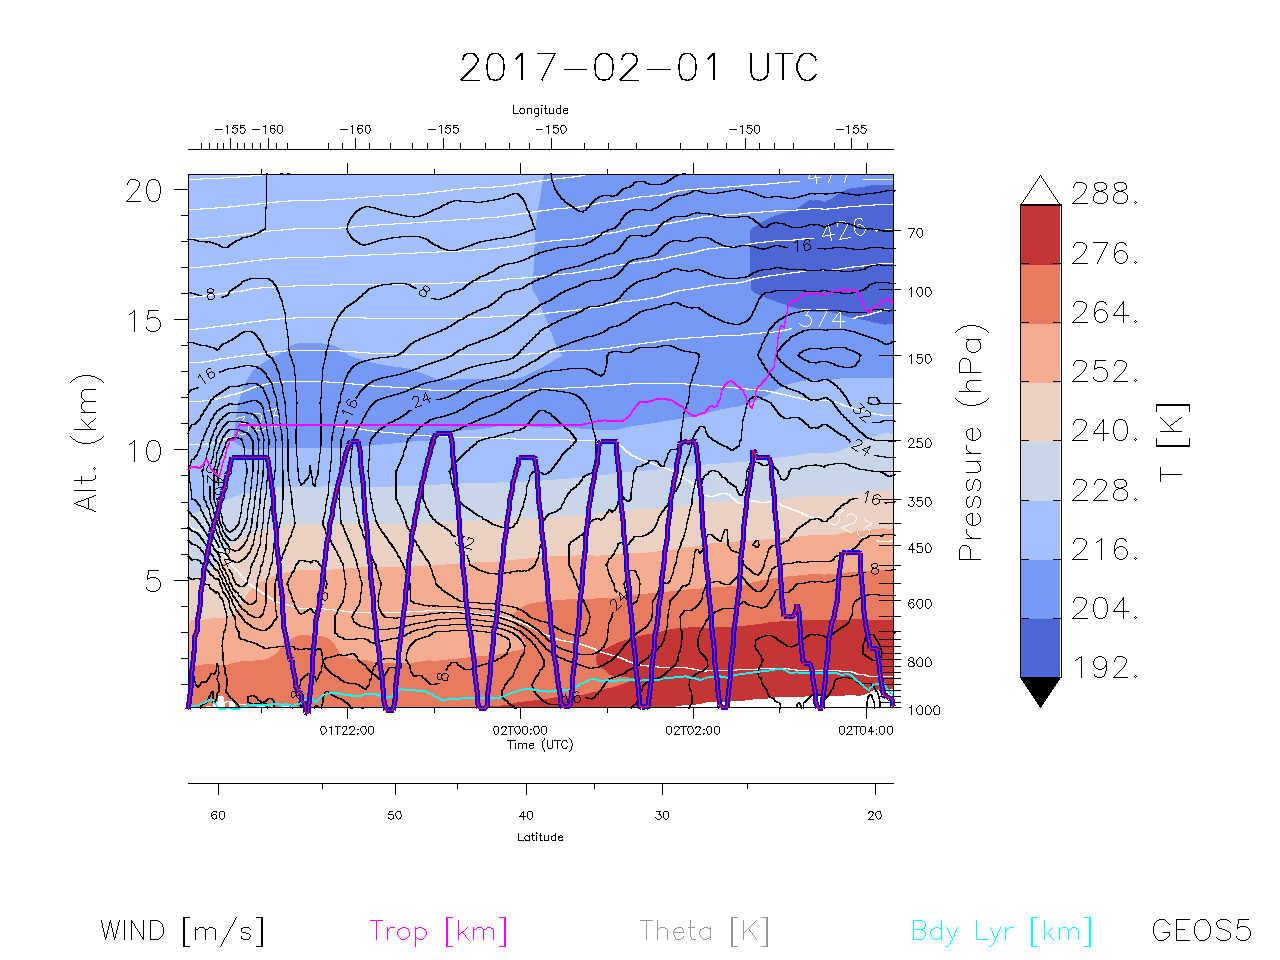
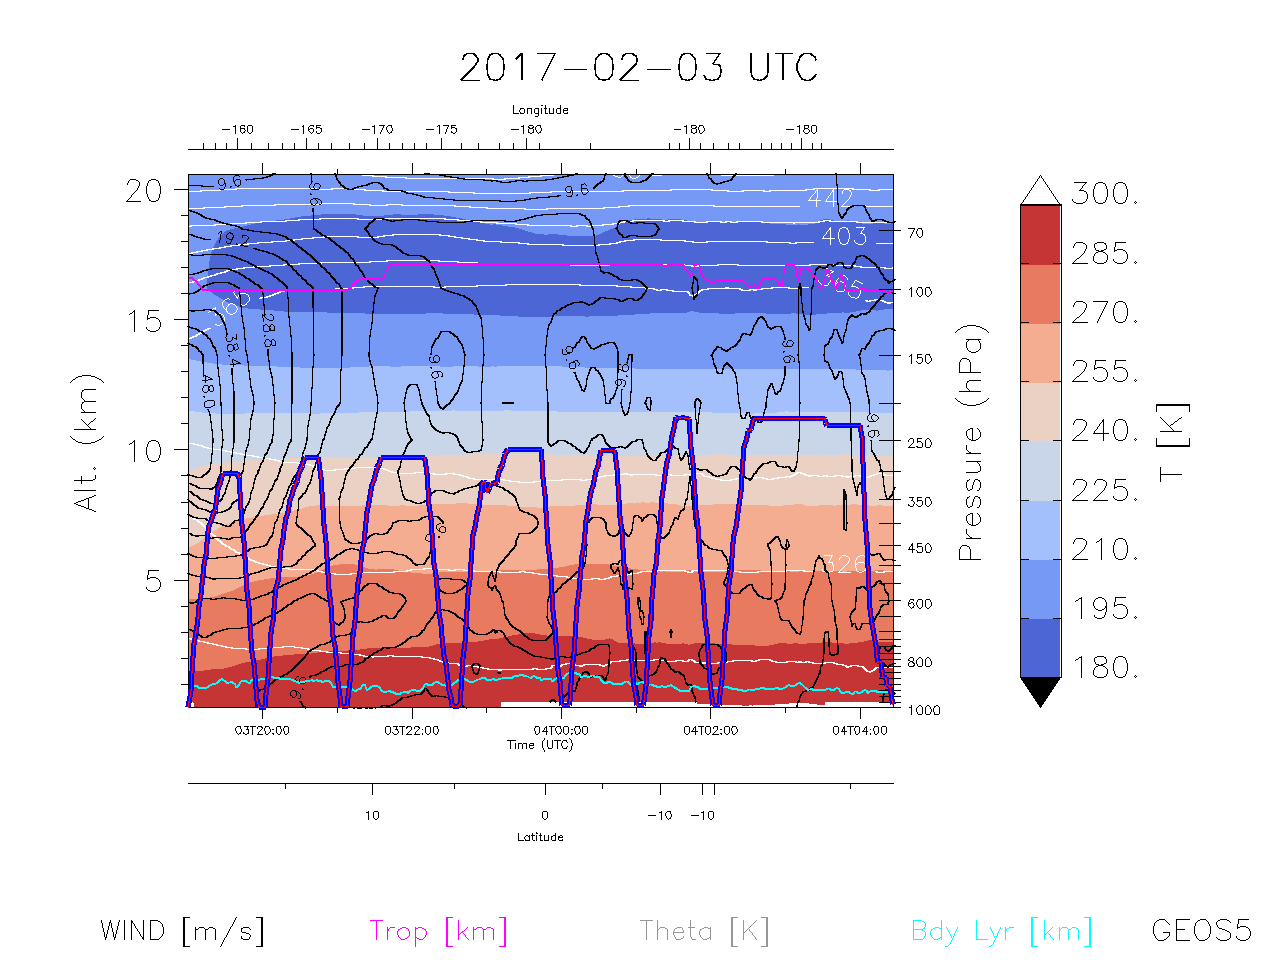
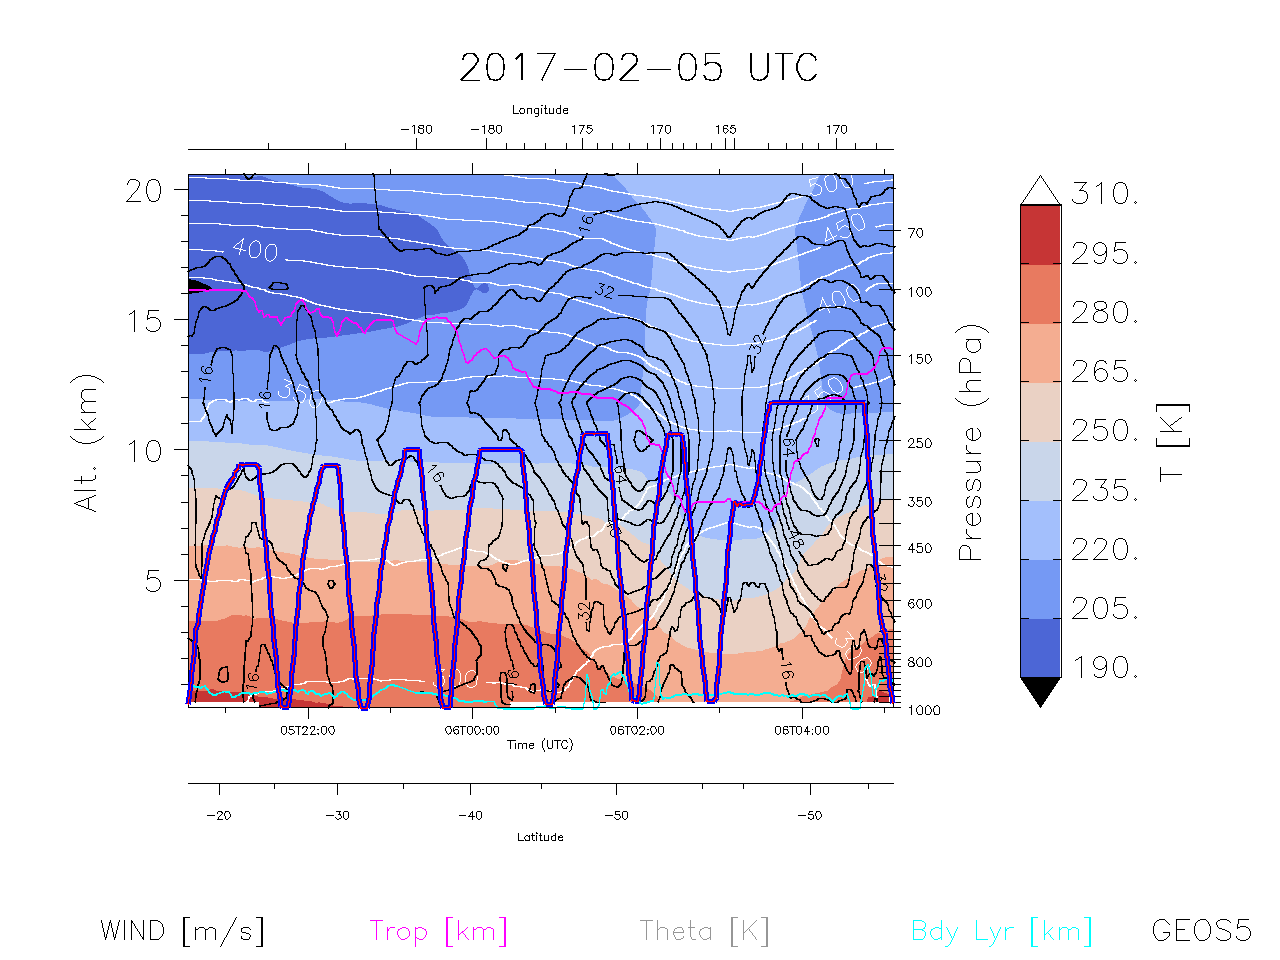
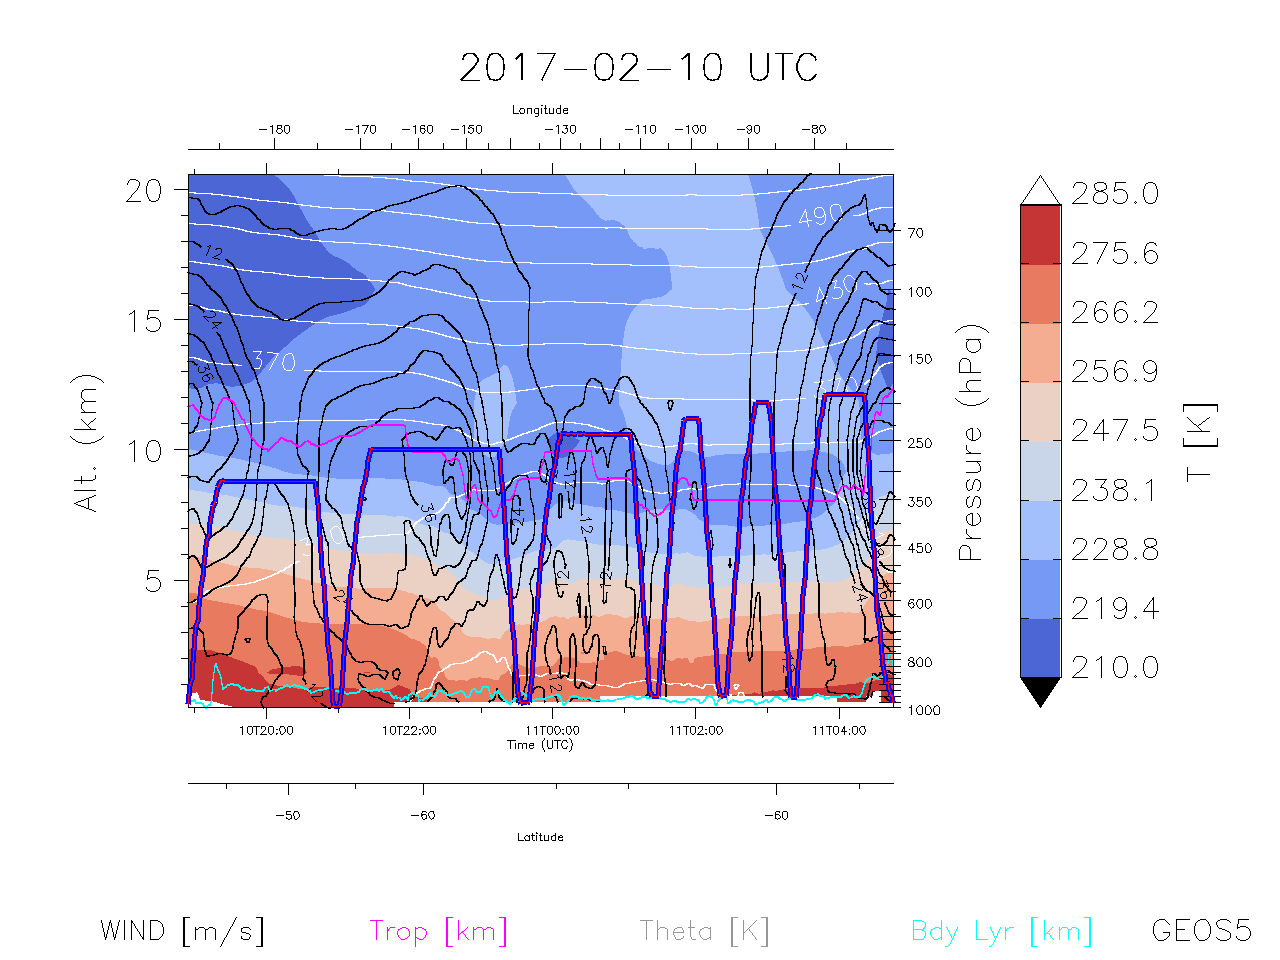
| Curtain of T, Winds | |
|
|
|
|
|
|
|
|
|
|
|
|
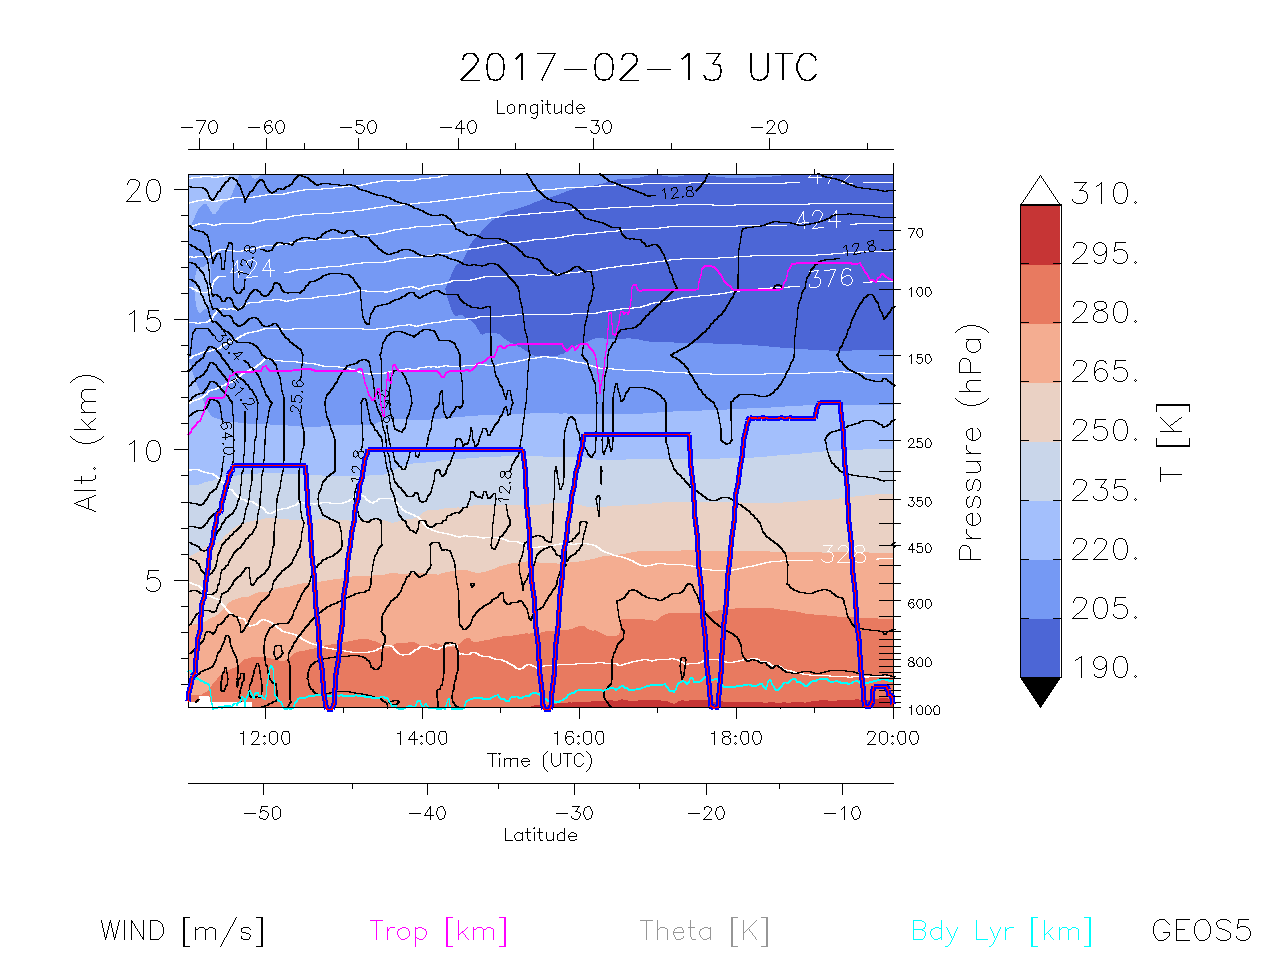
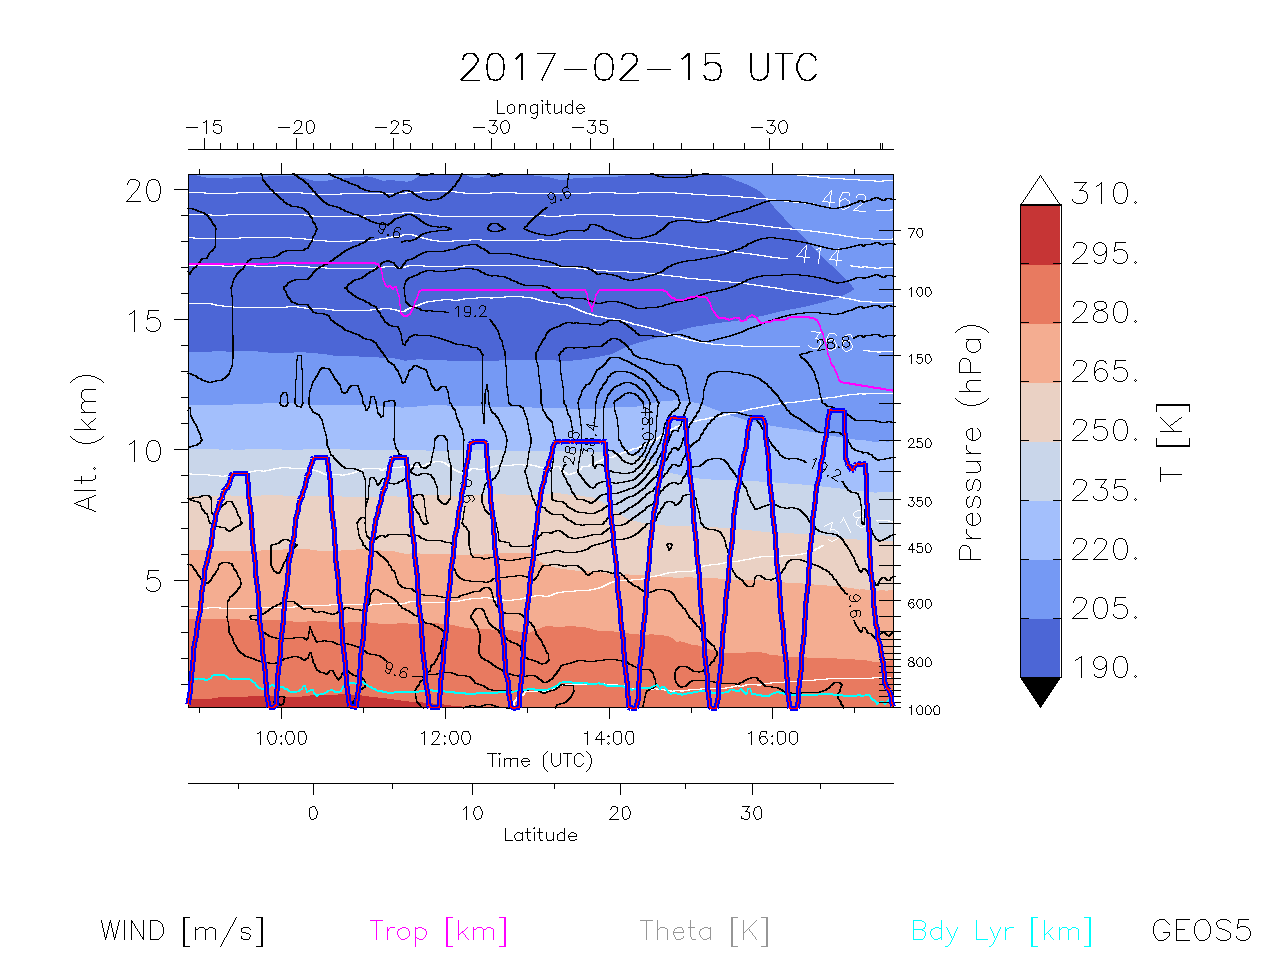
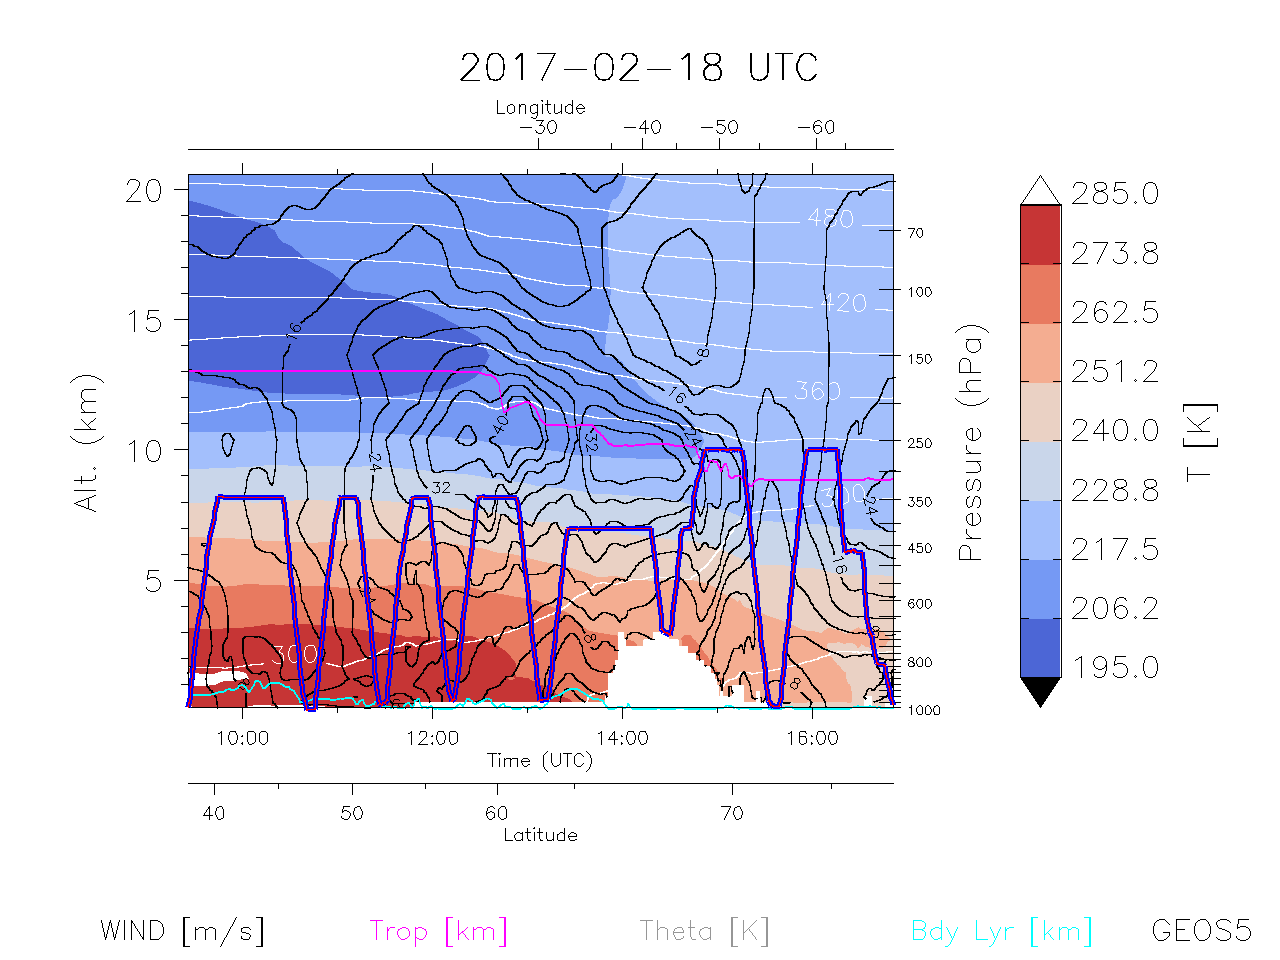
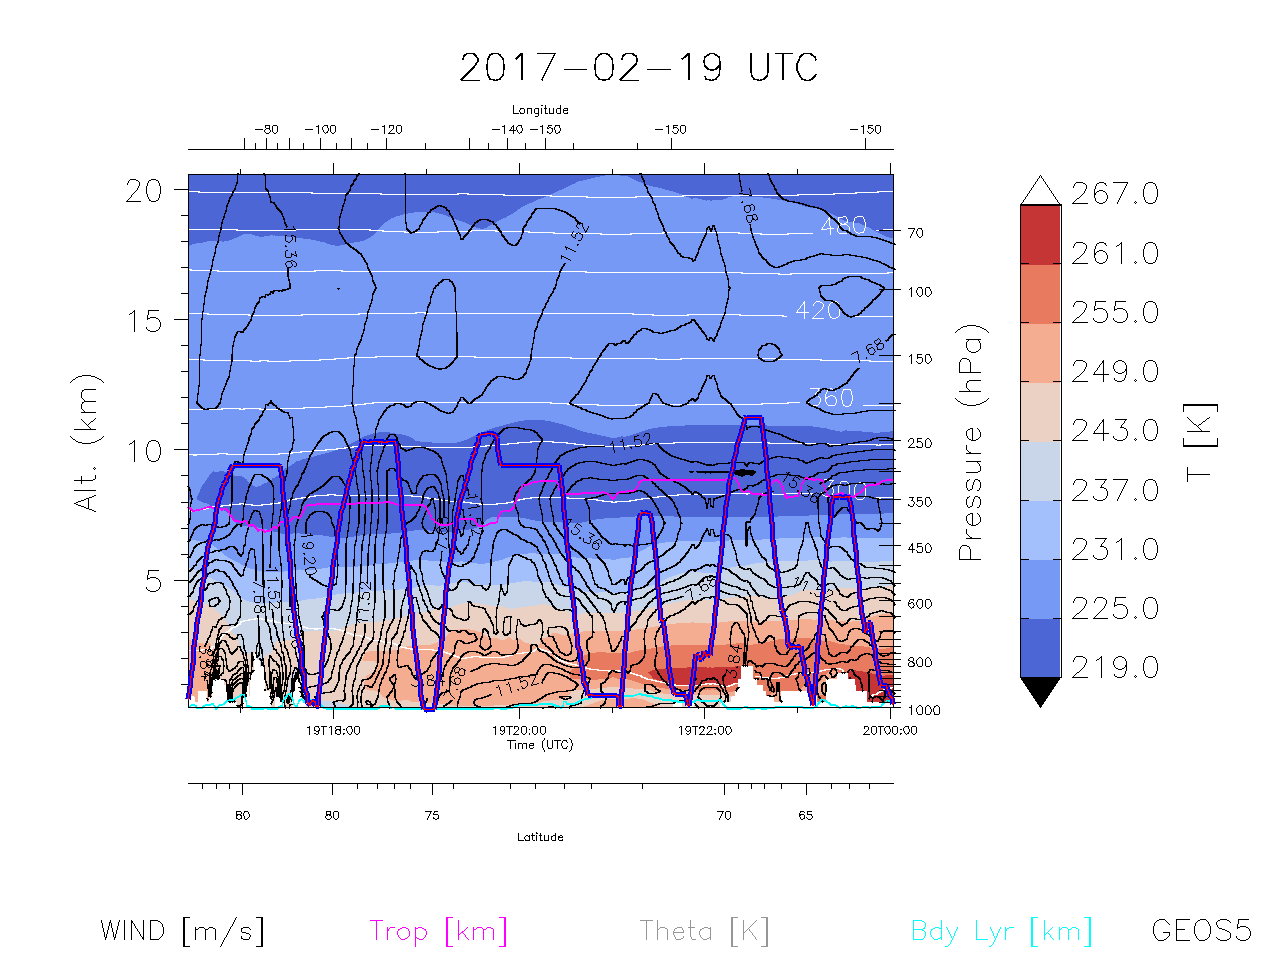
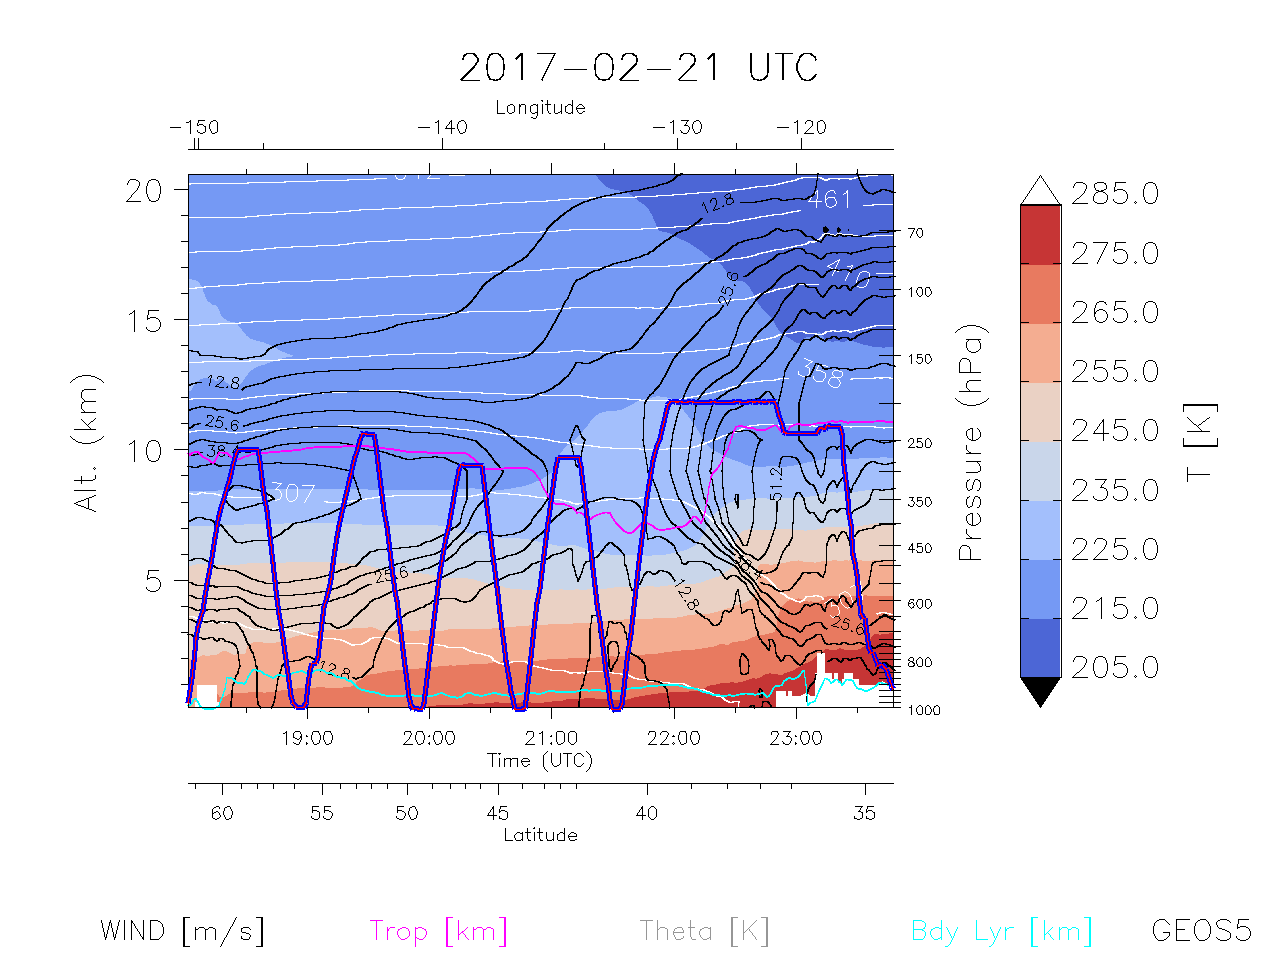
Curtain of T, Winds |
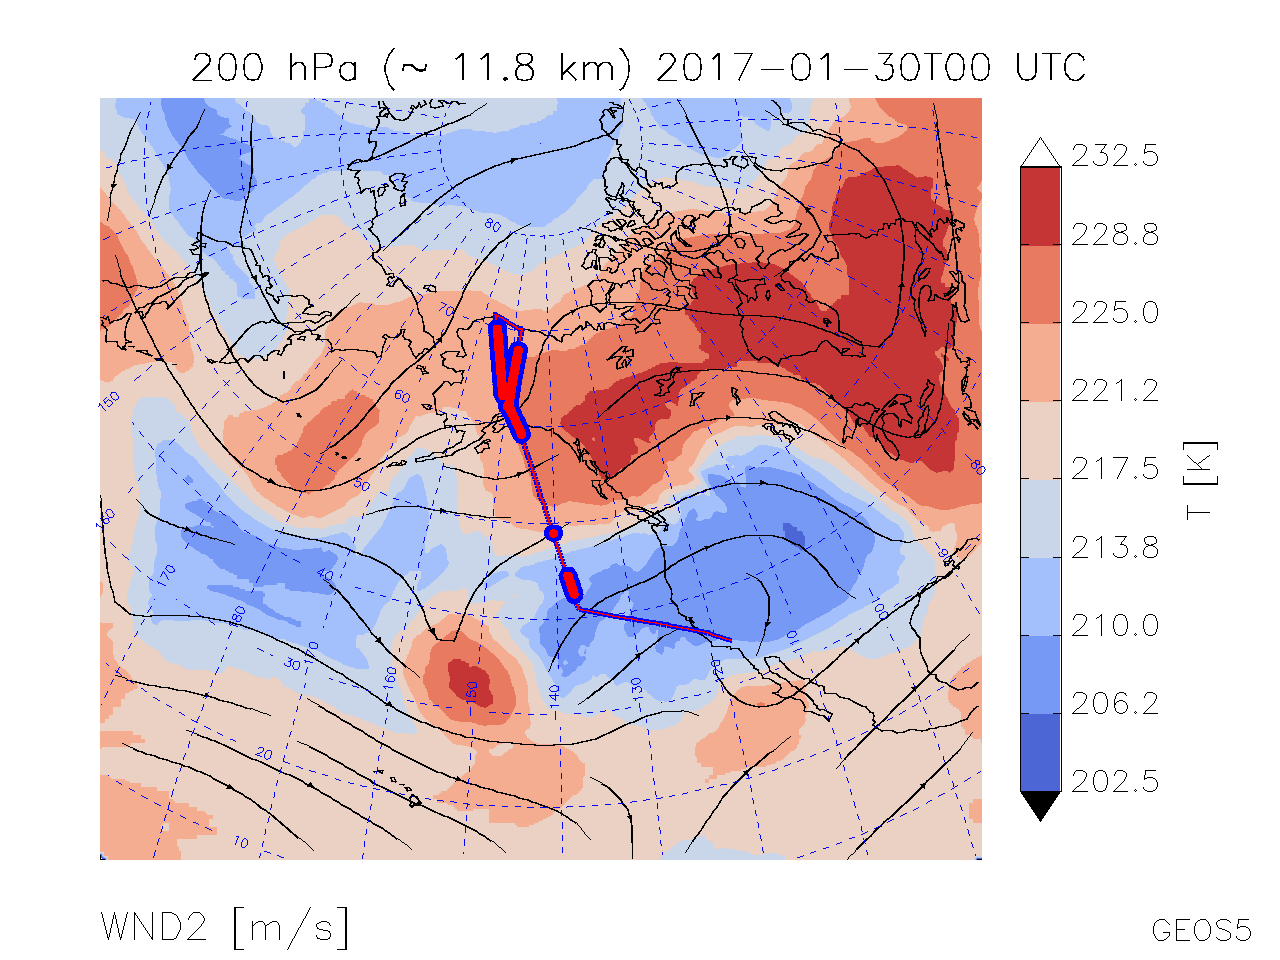
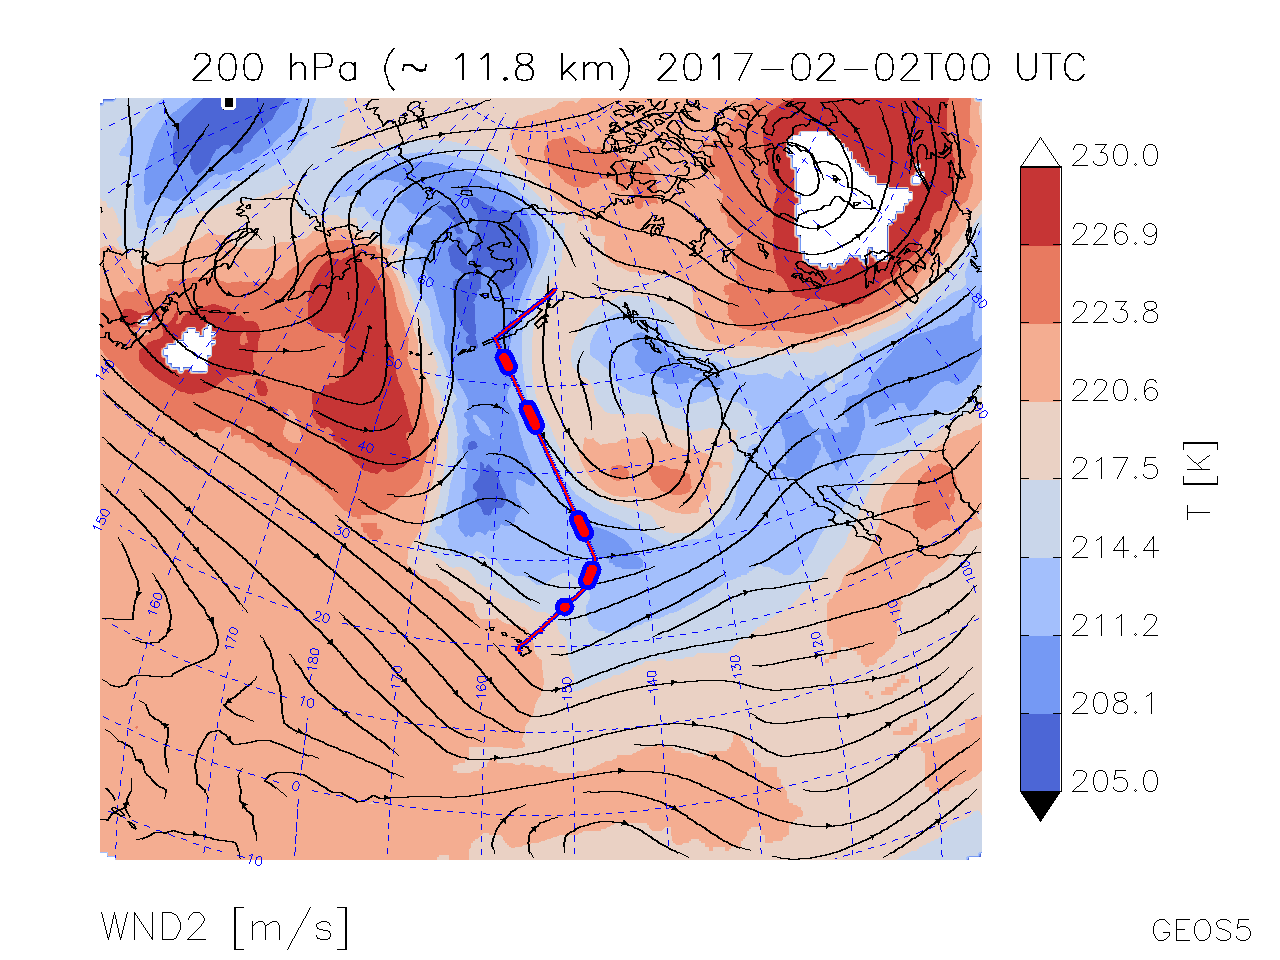
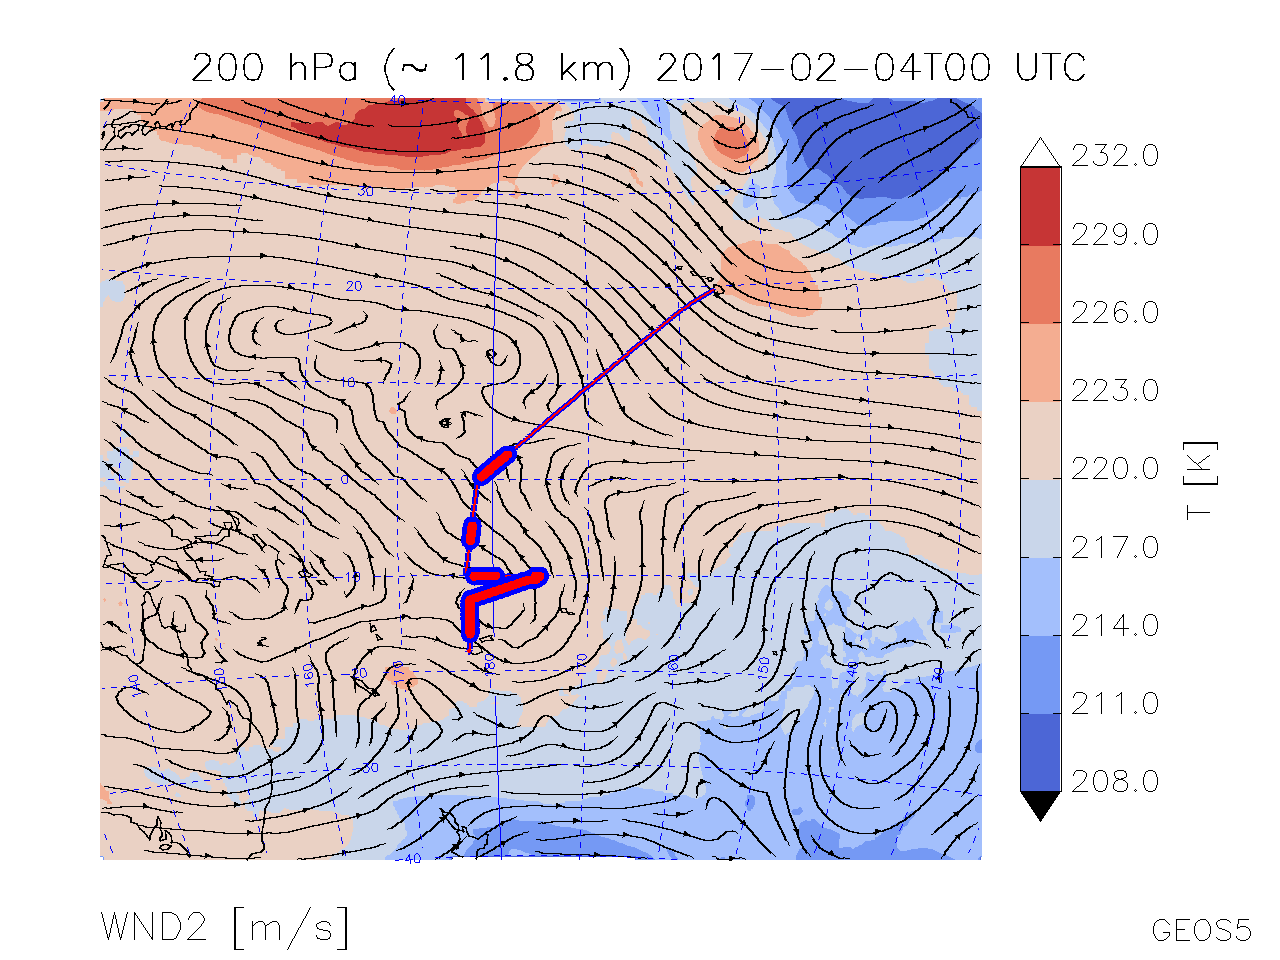
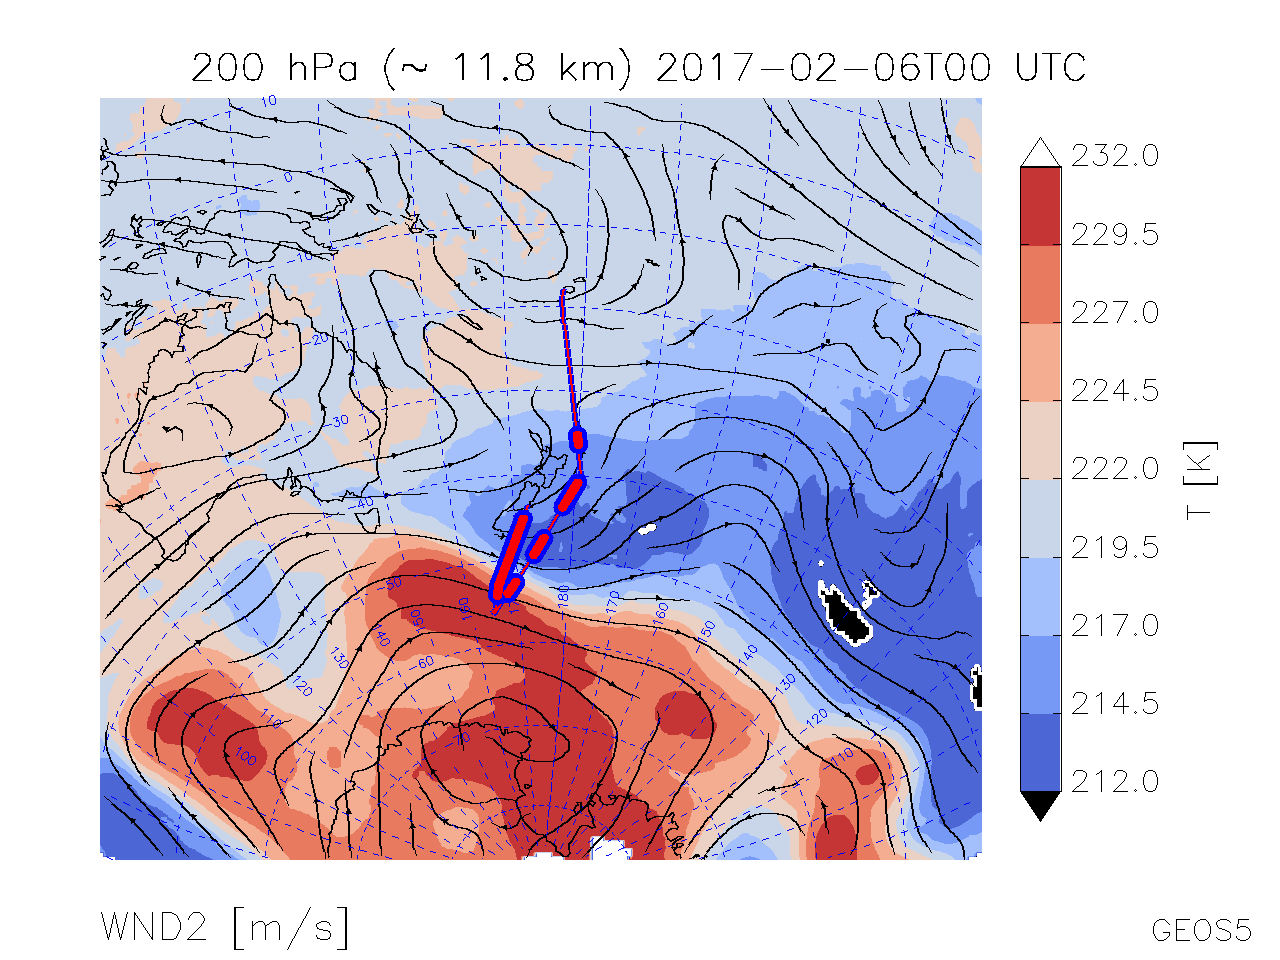
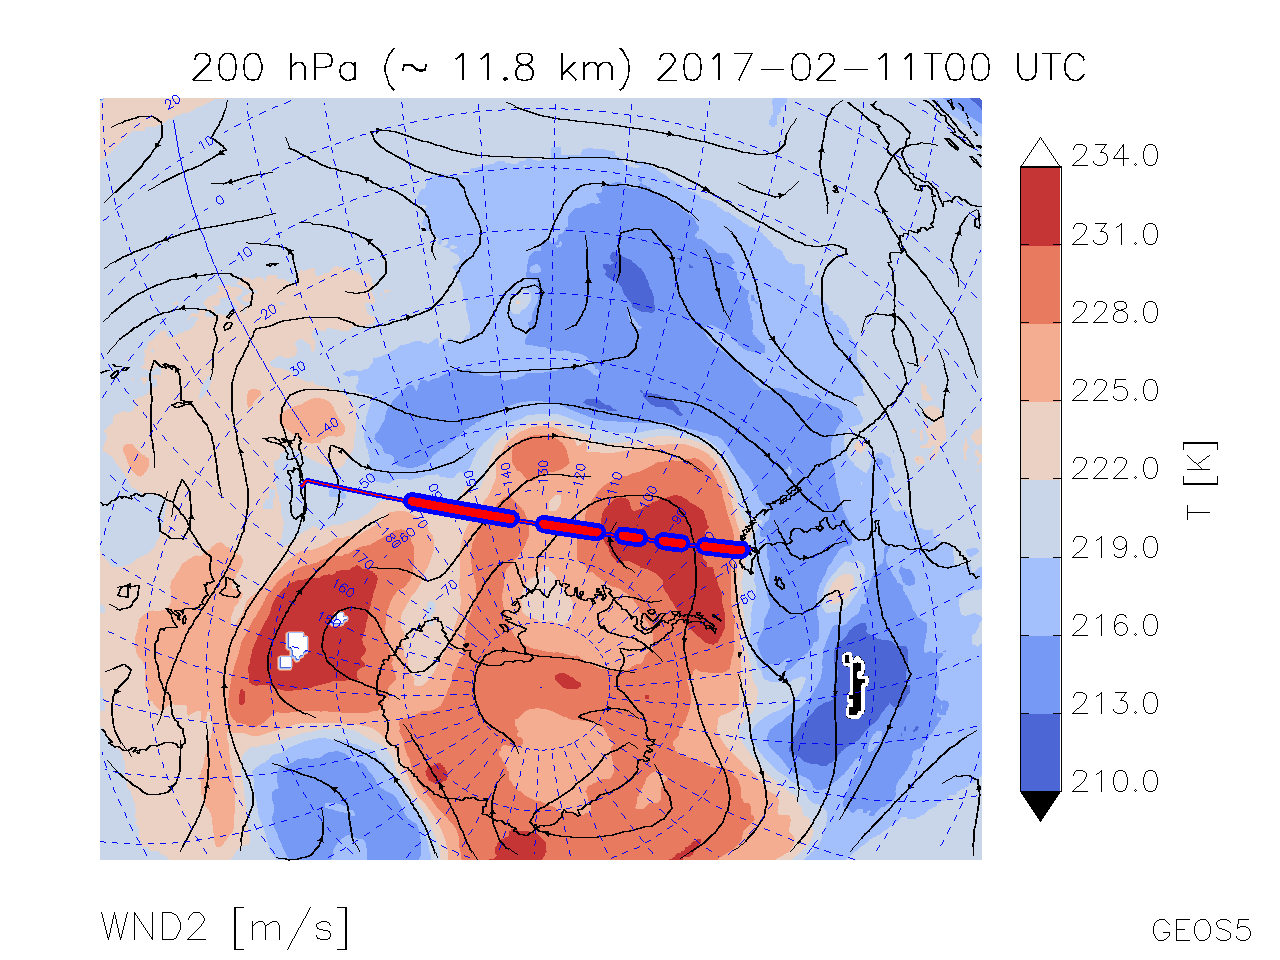
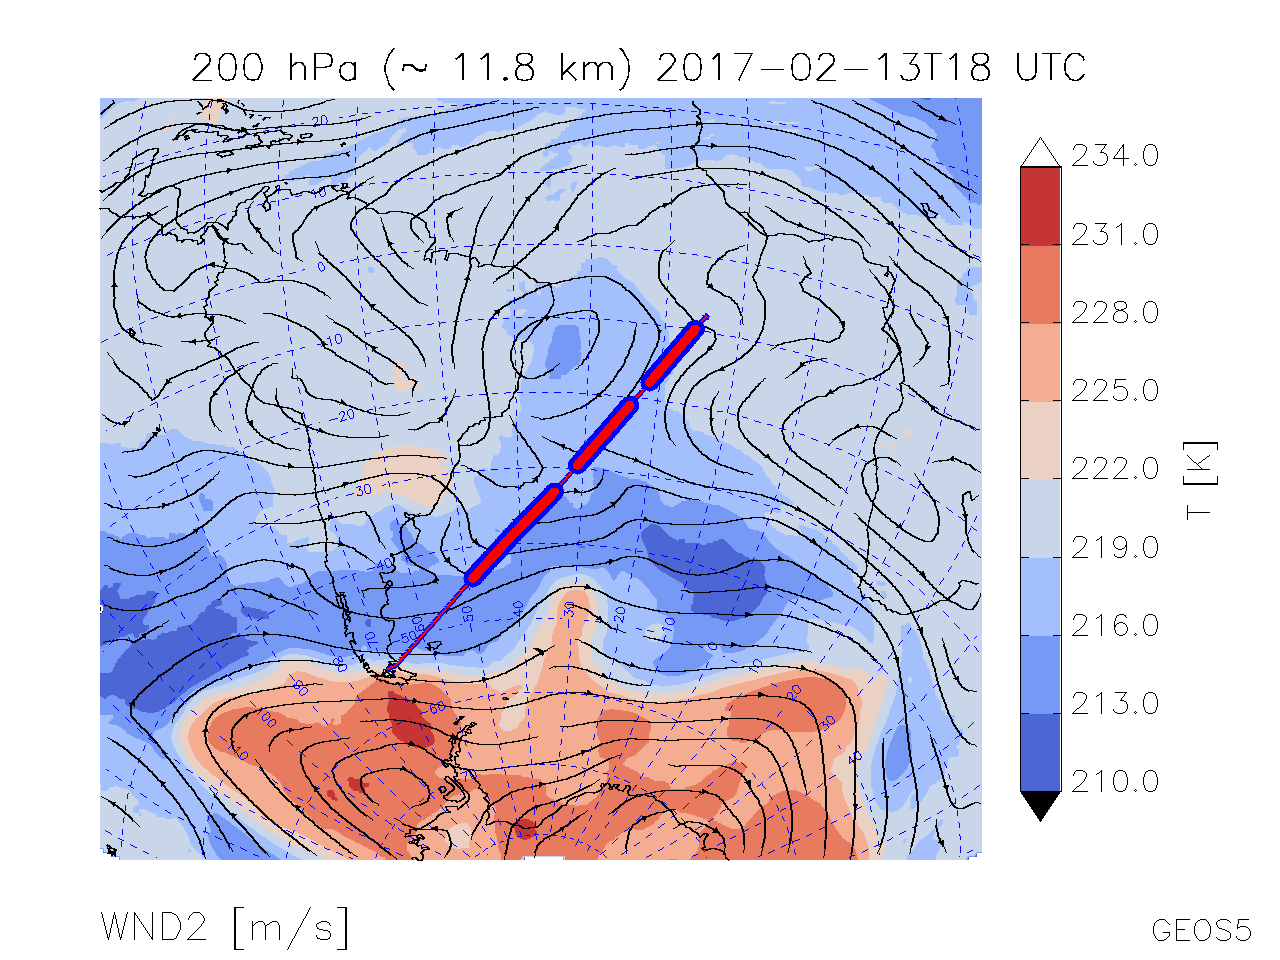
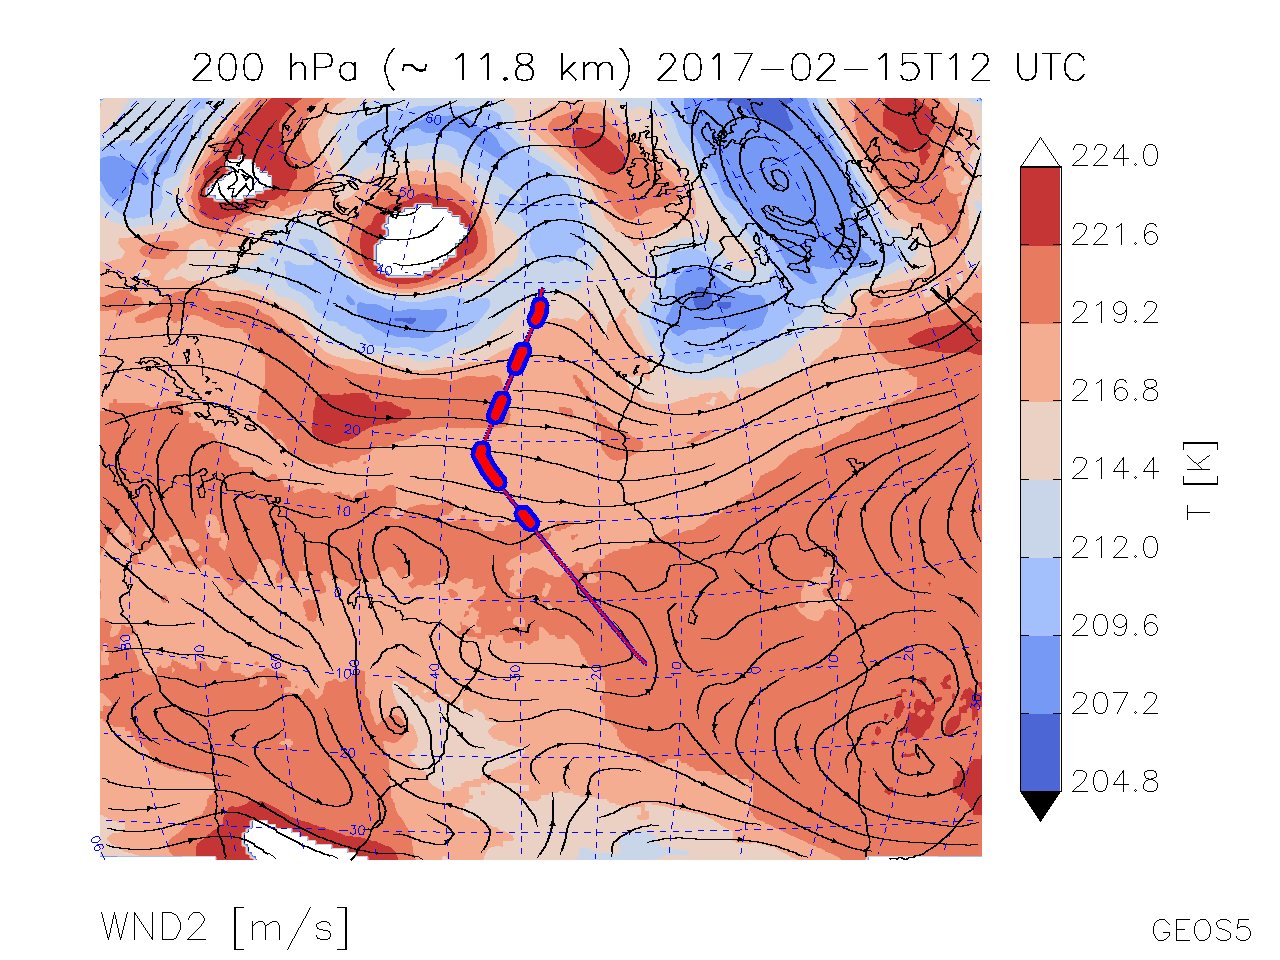
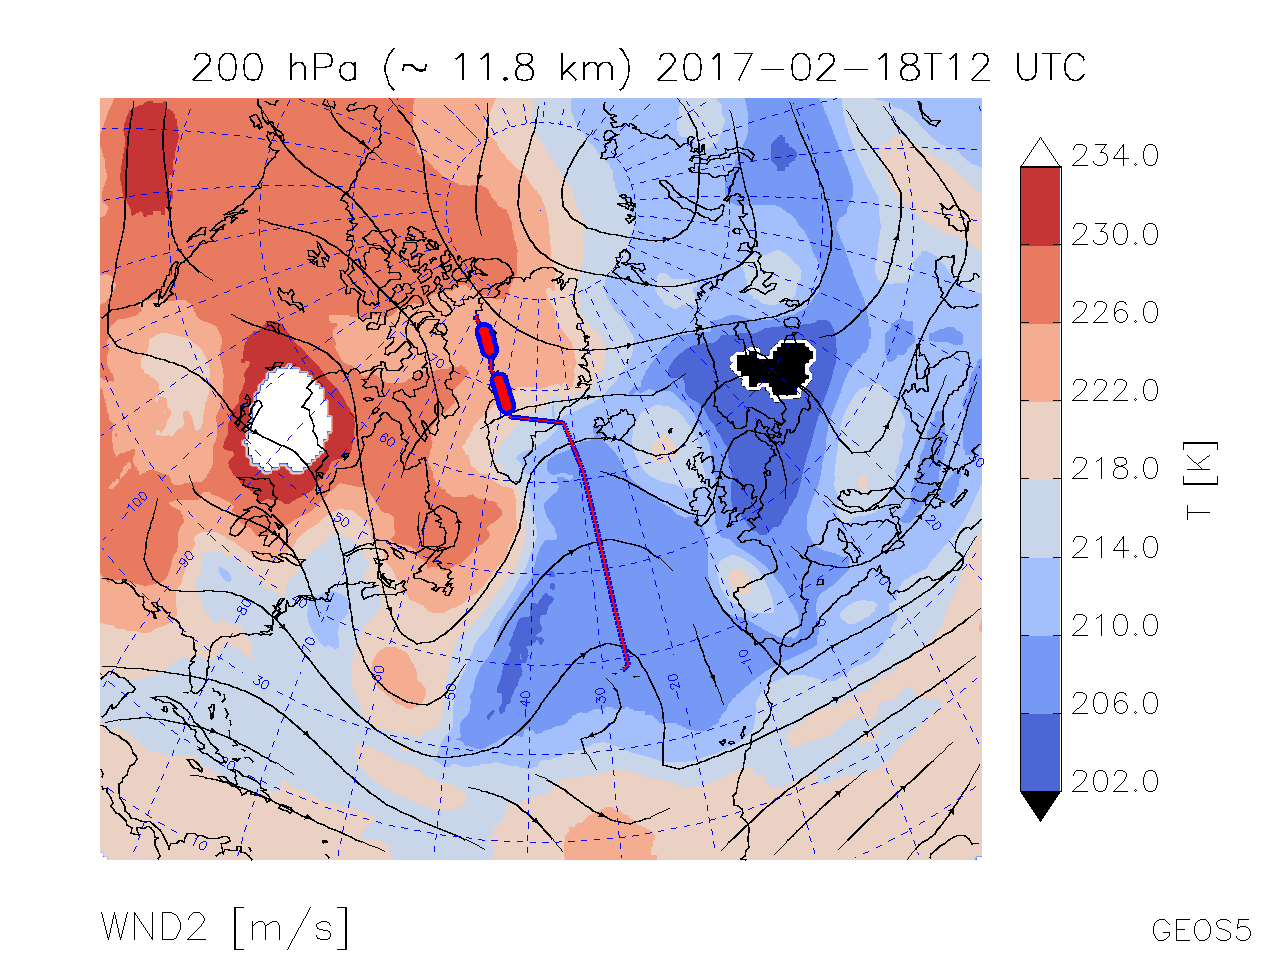
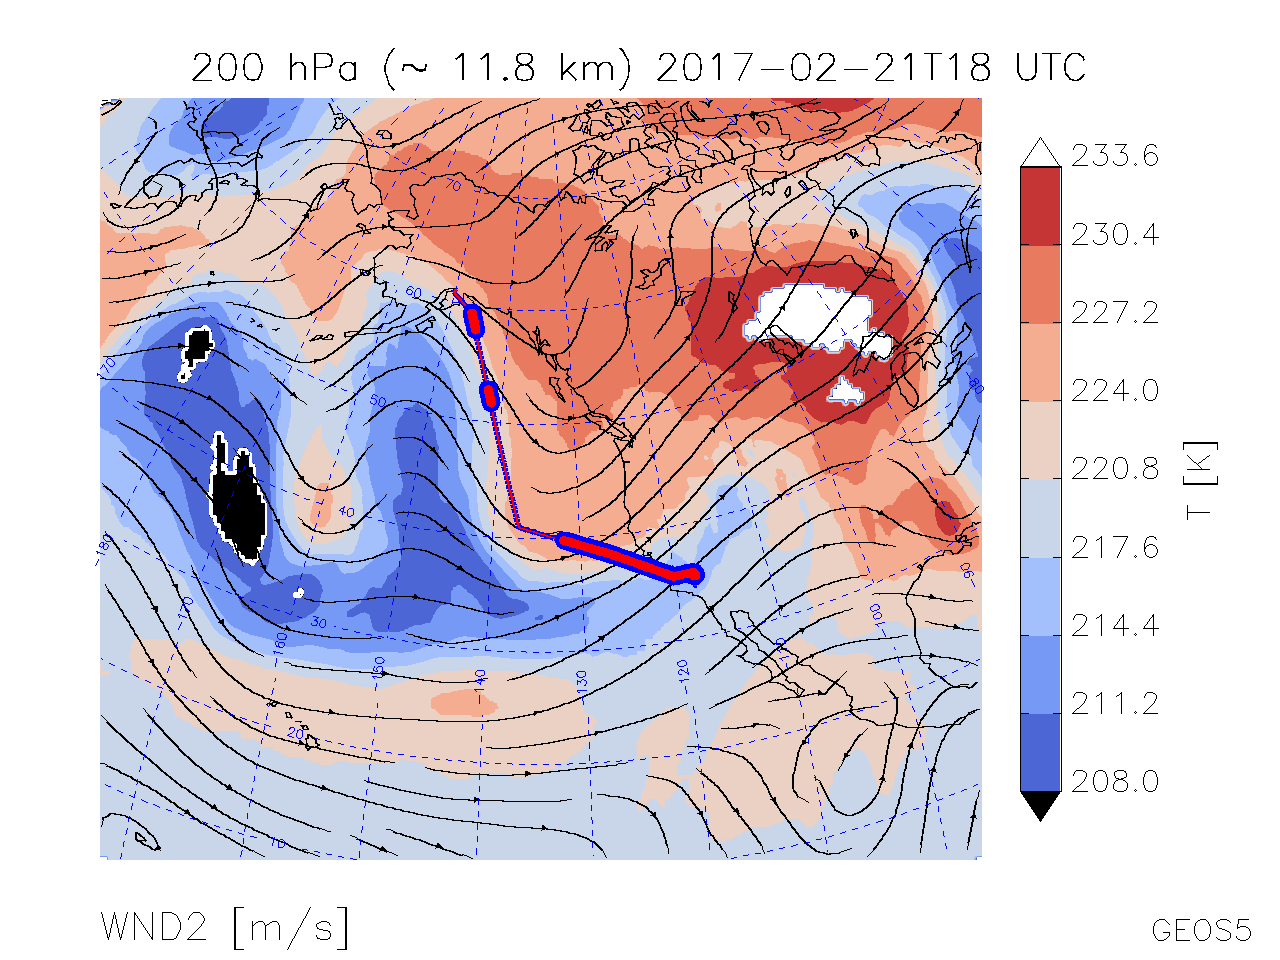
| Map of T, Wind Streamlines @ 200 hPa | |
|
|
|
|
|
|
|
|
|
|
|
|
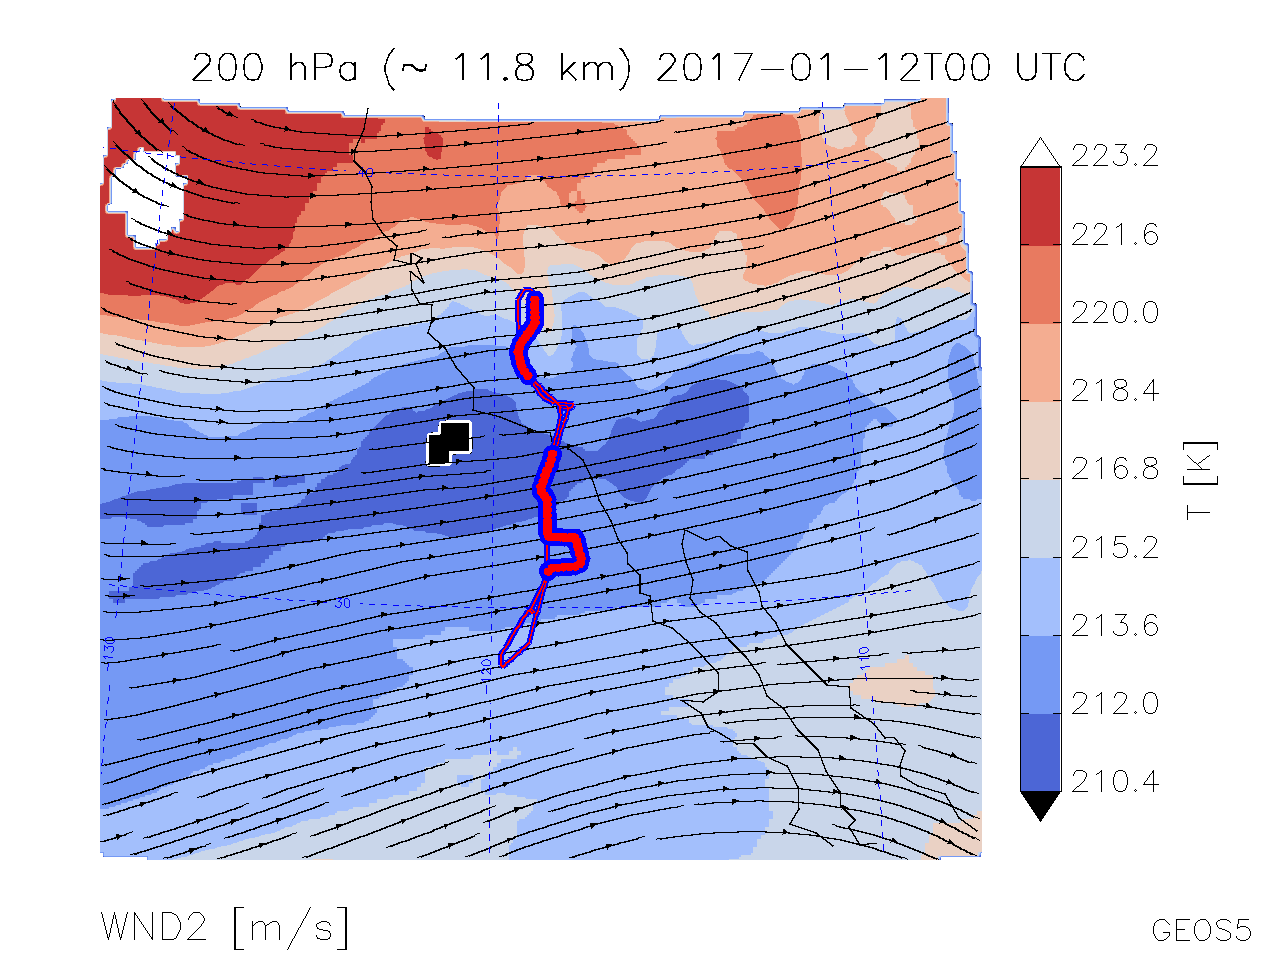
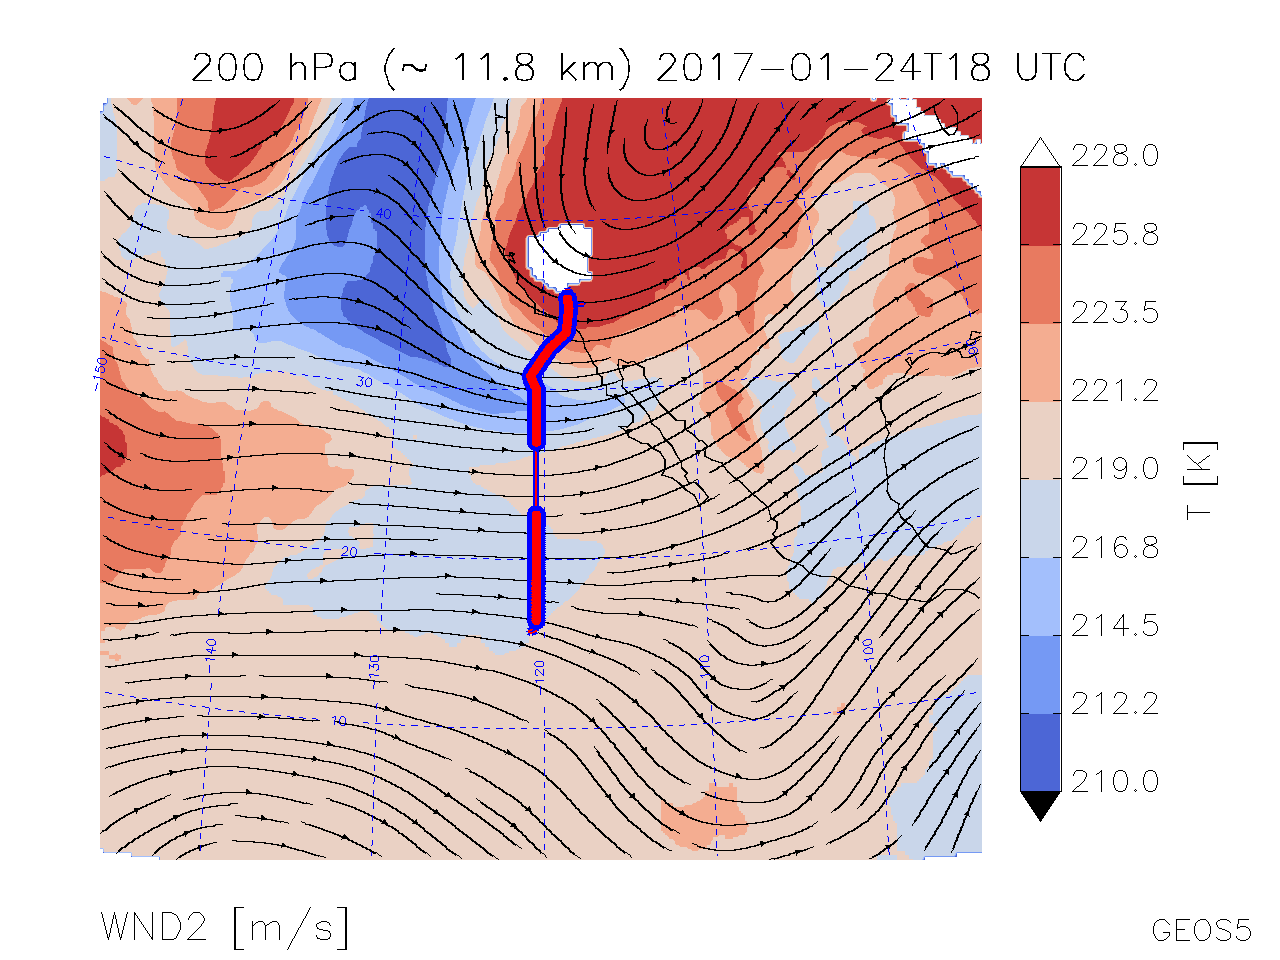
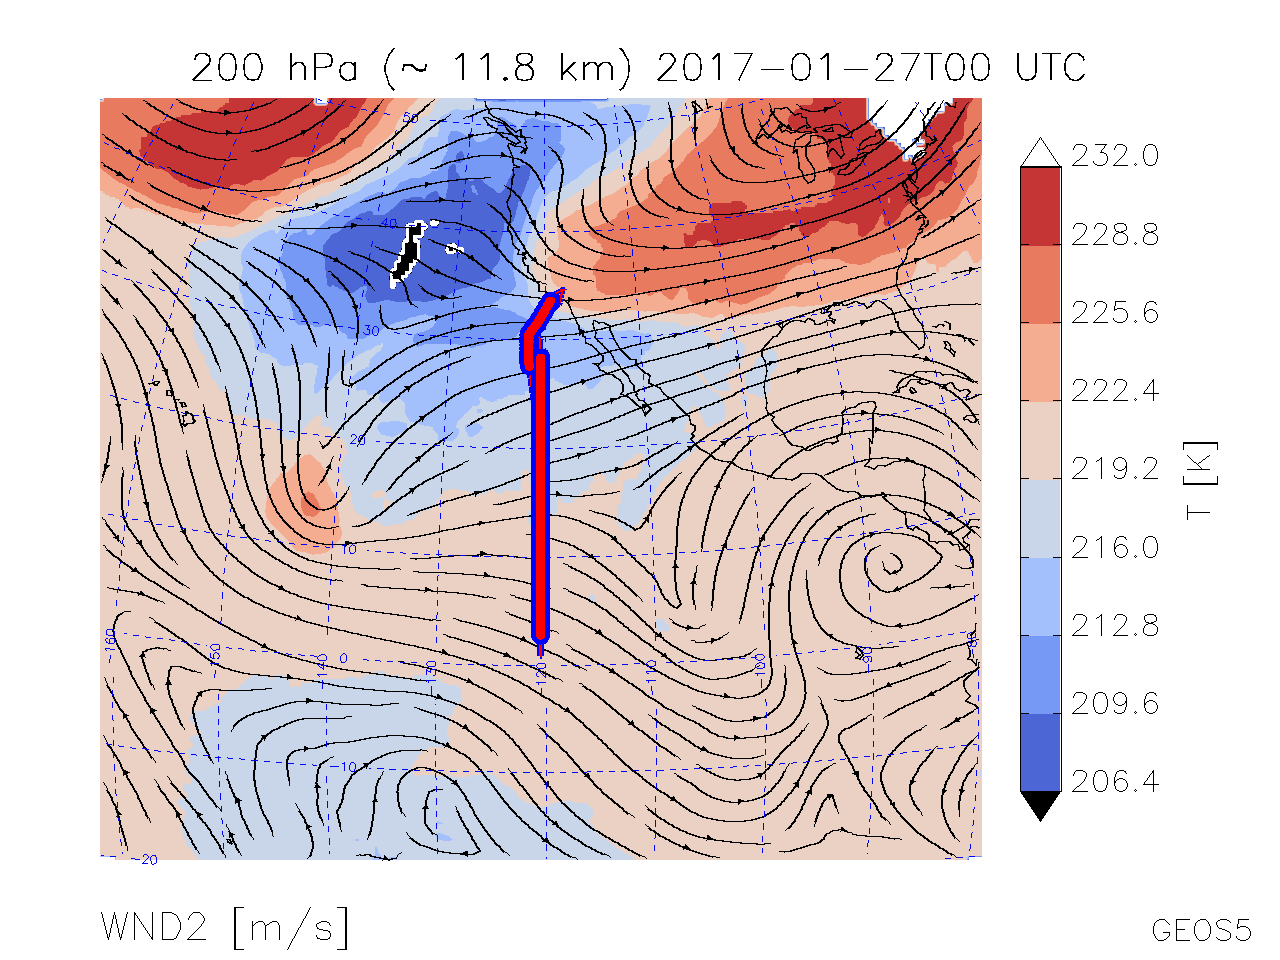
Map of T, Wind Streamlines @ 200 hPa |
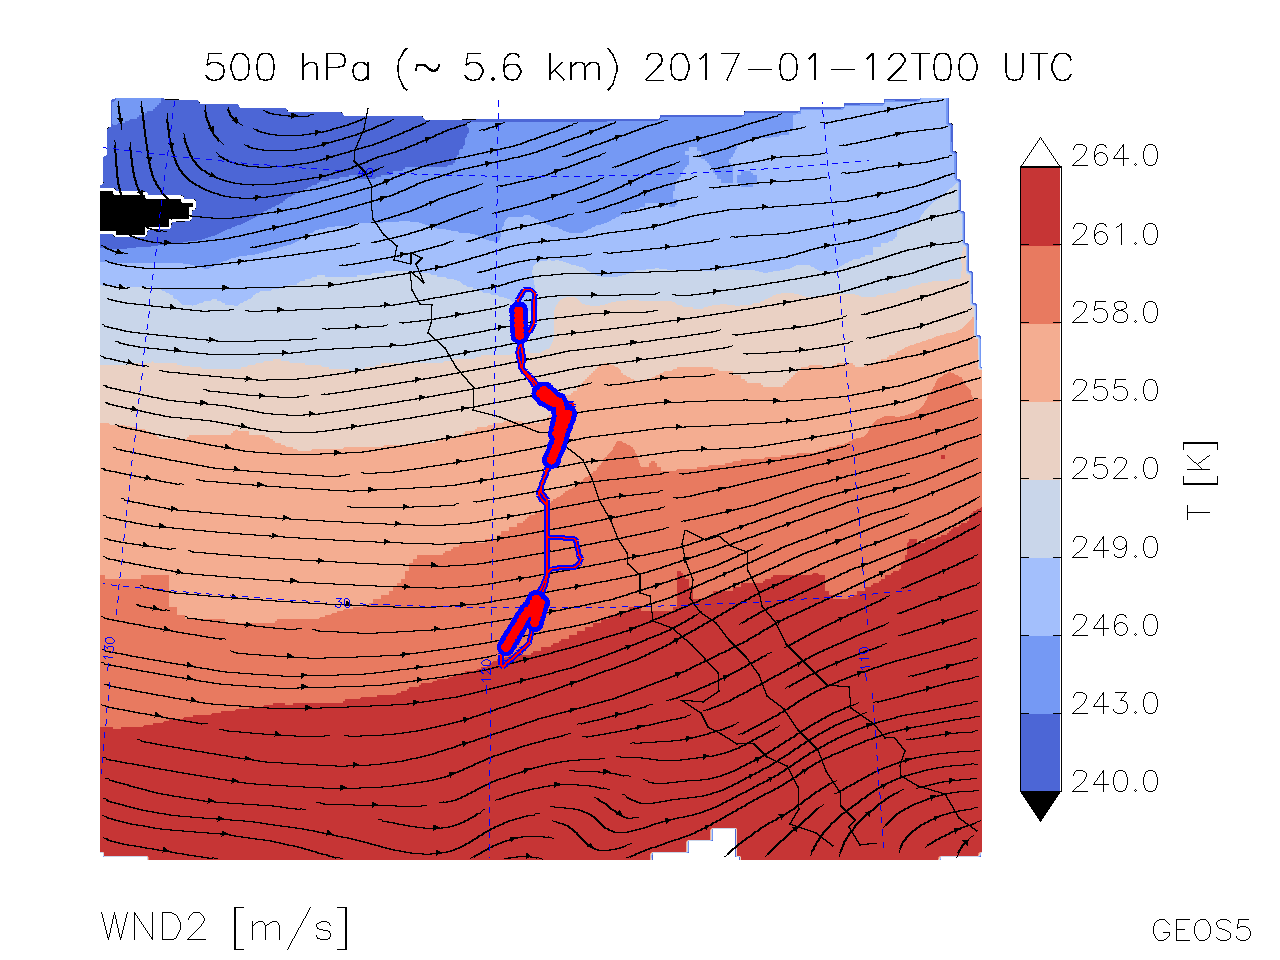
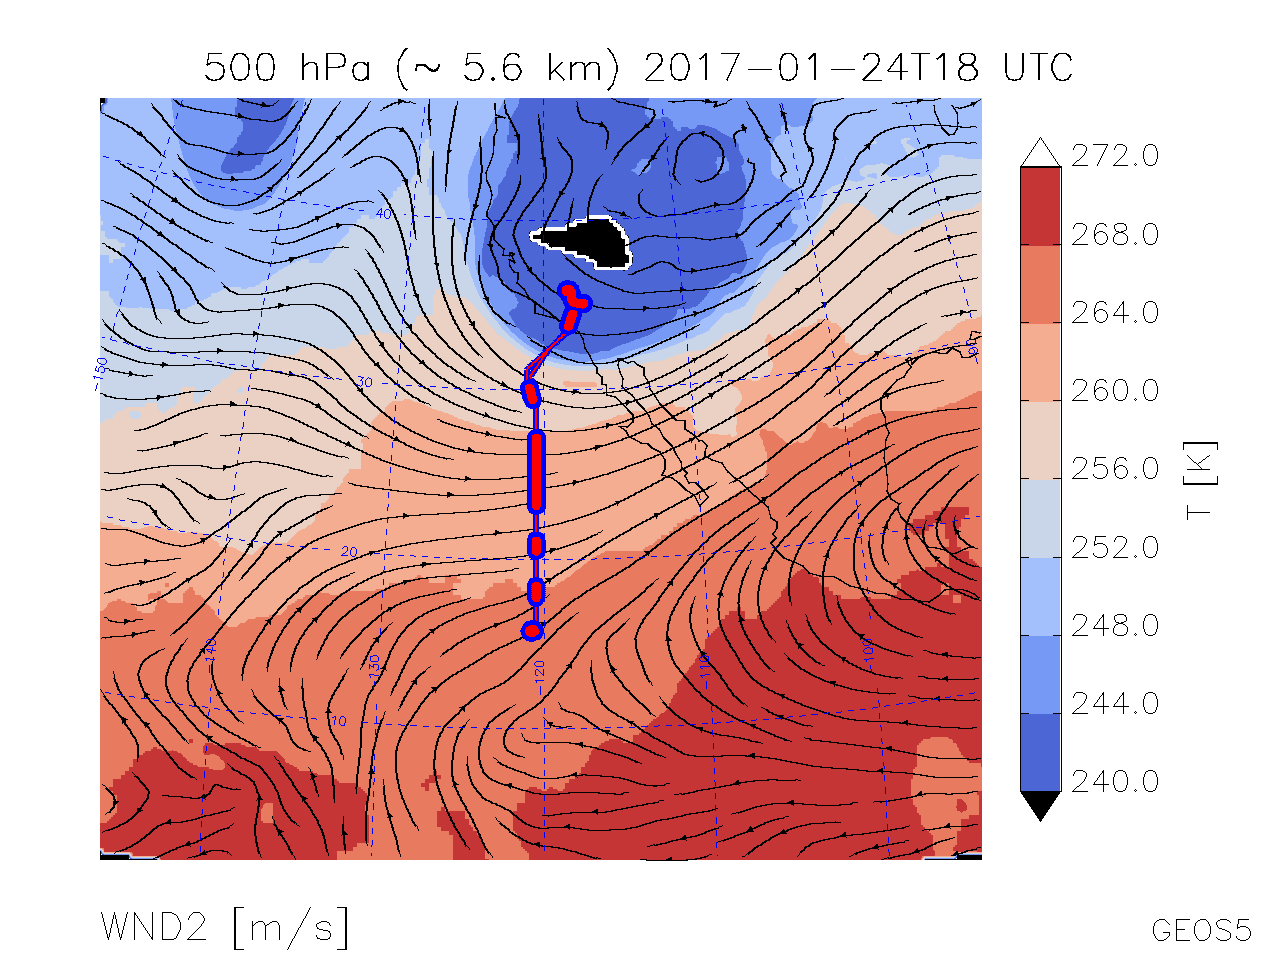
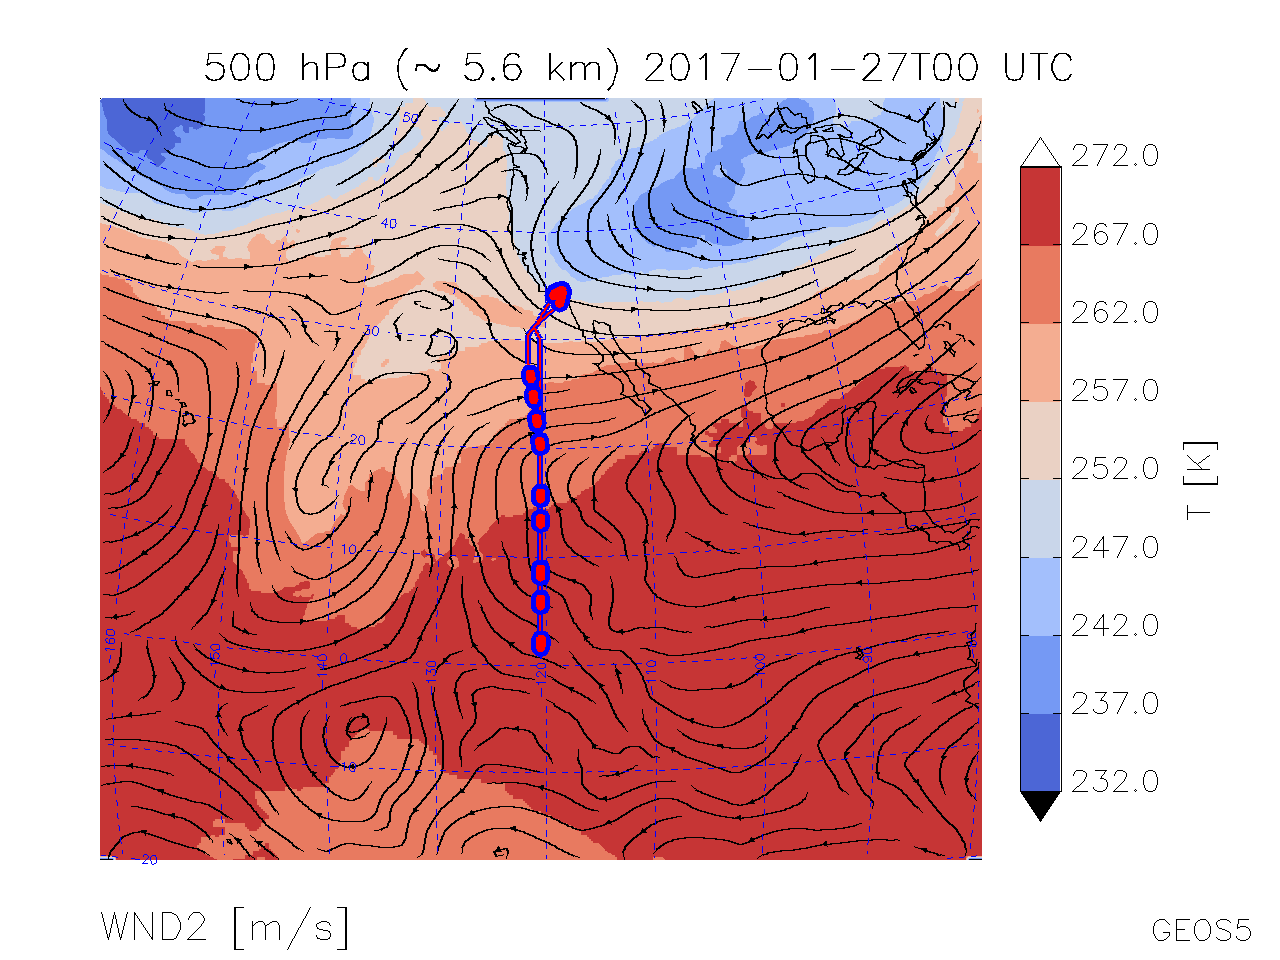
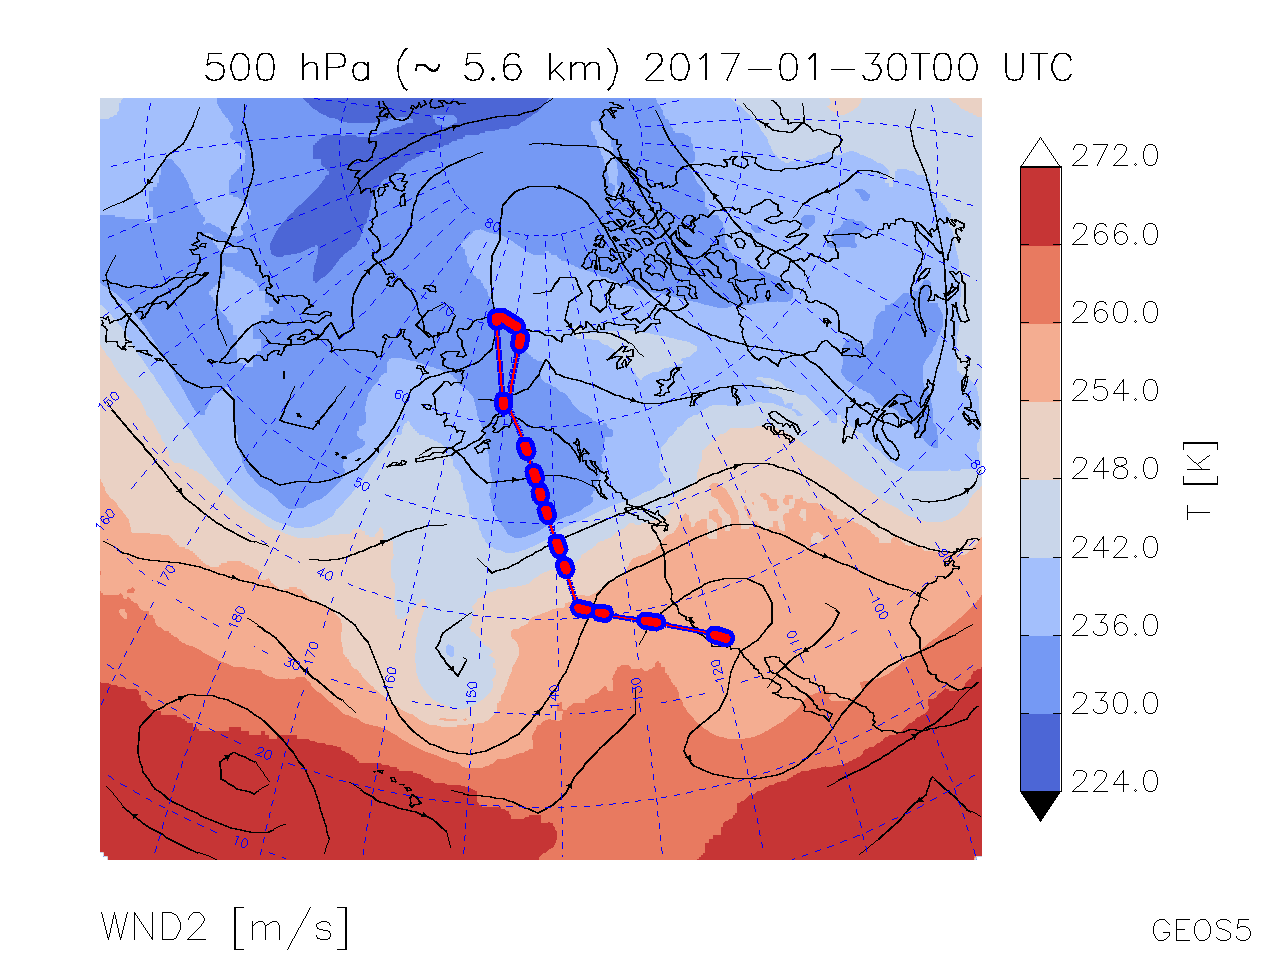
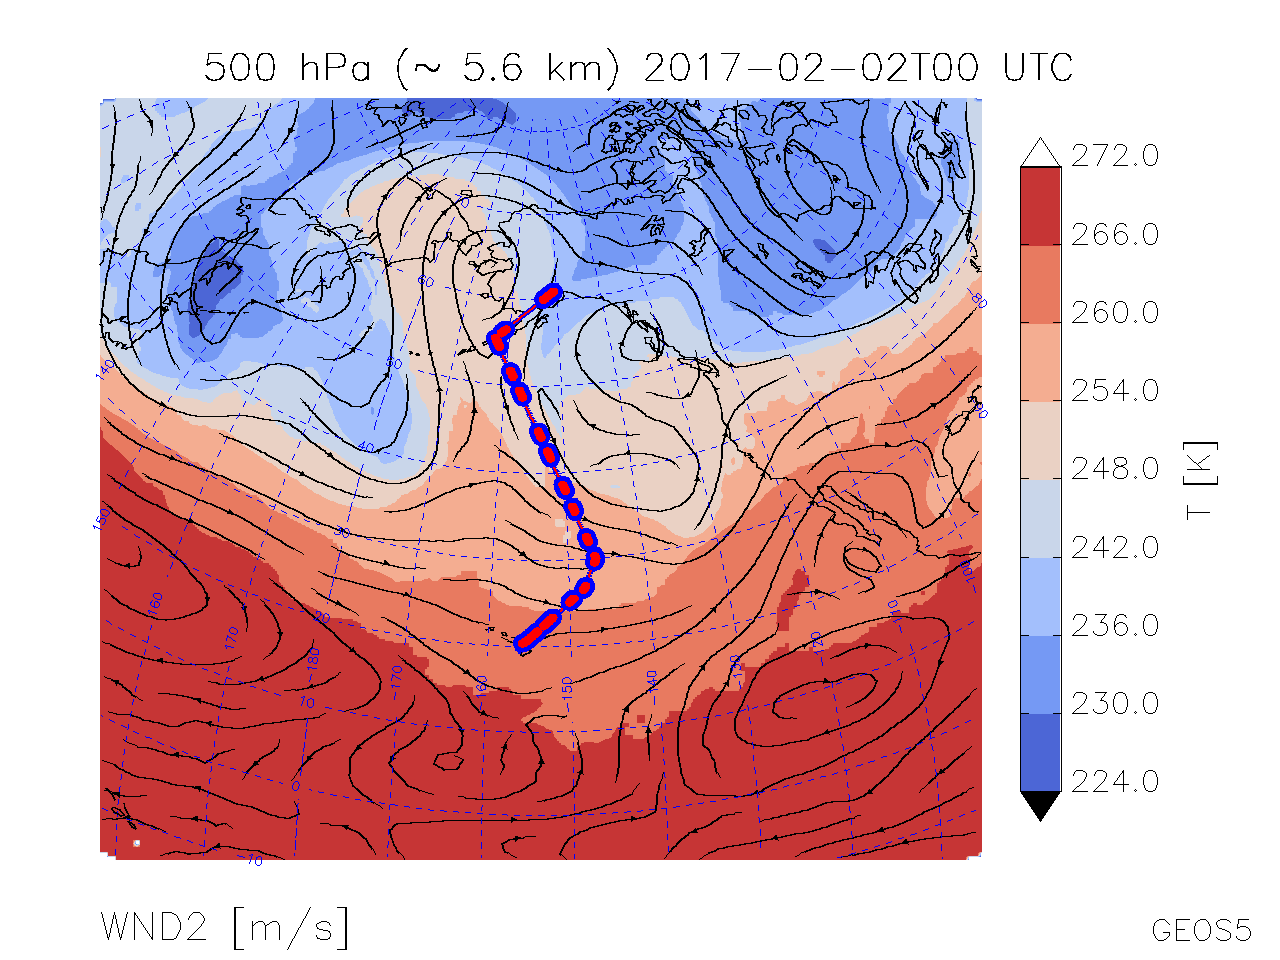
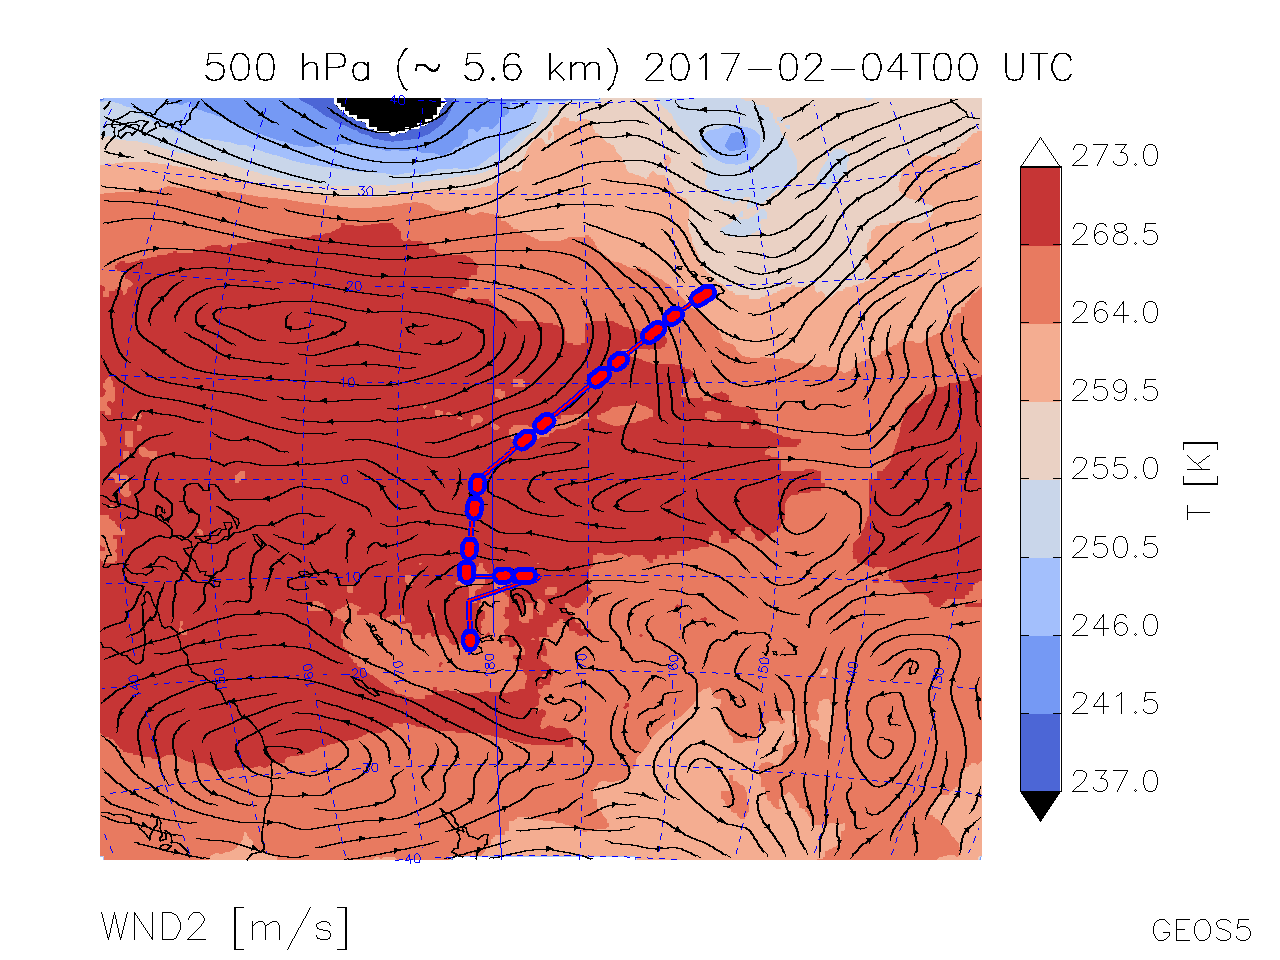
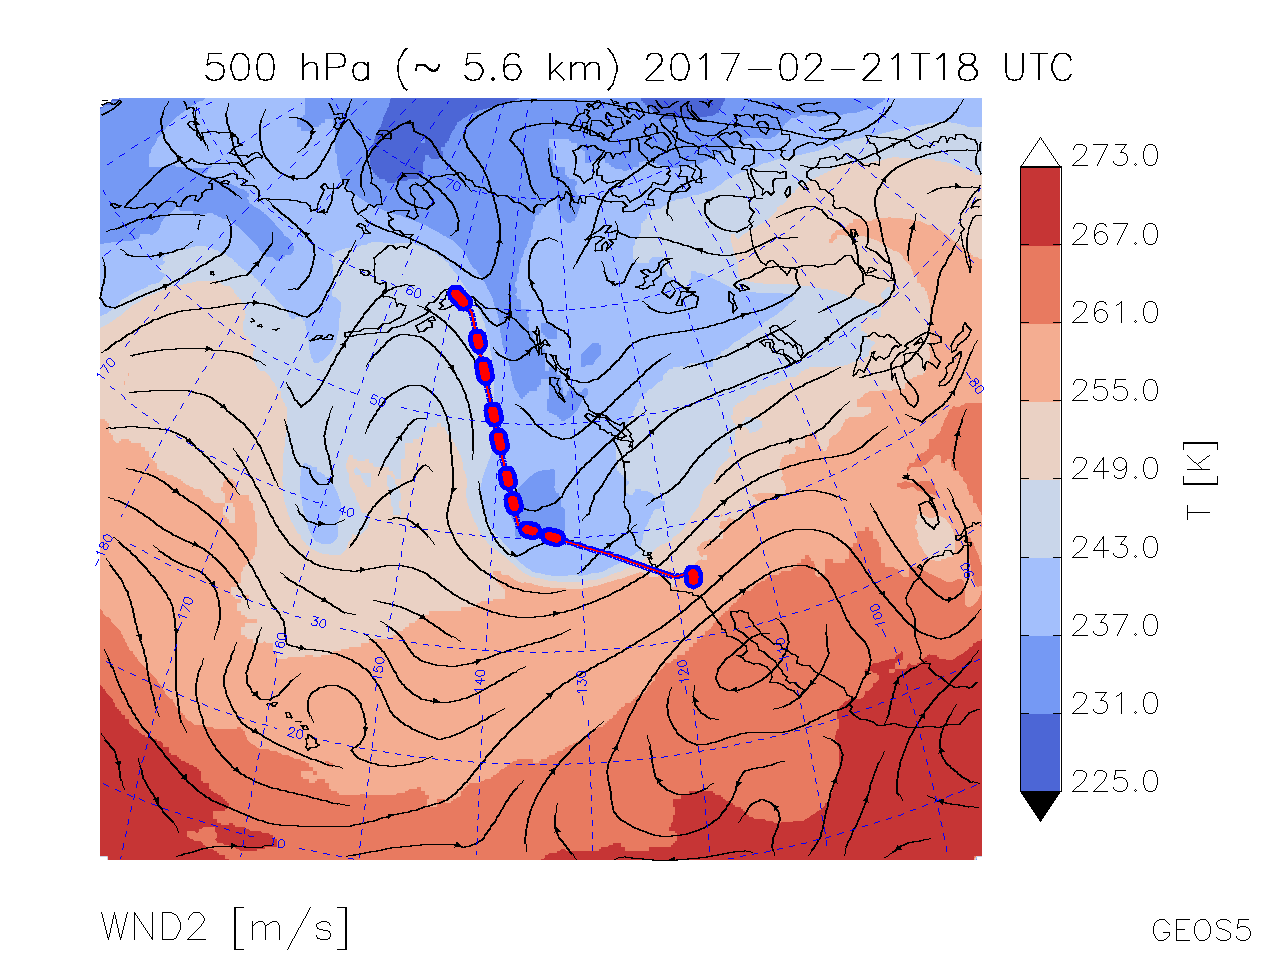
| Map of T, Wind Streamlines @ 500 hPa | |
|
|
|
|
|
|
|
|
|
|
|
|
Map of T, Wind Streamlines @ 500 hPa |
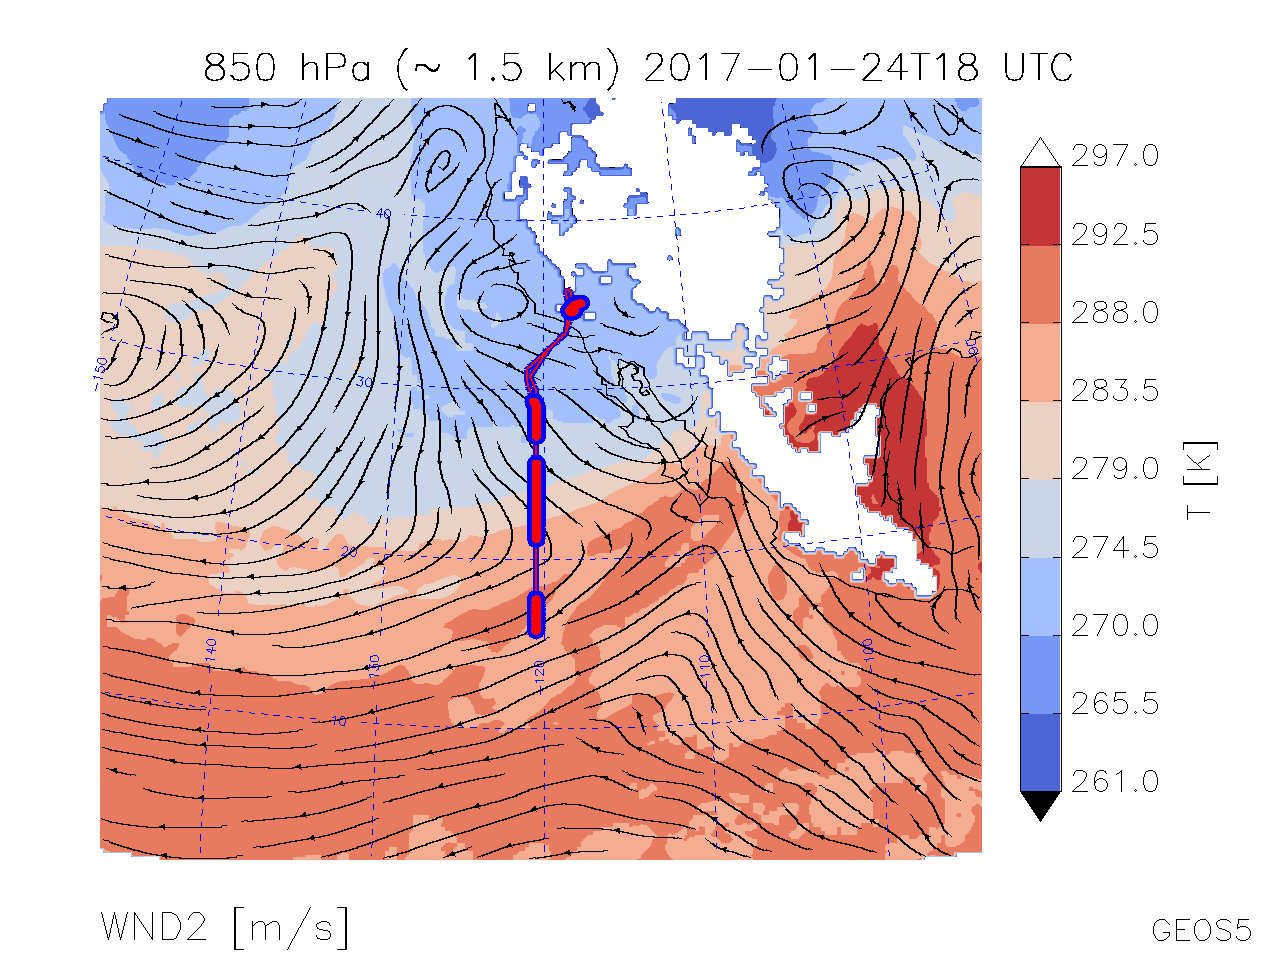
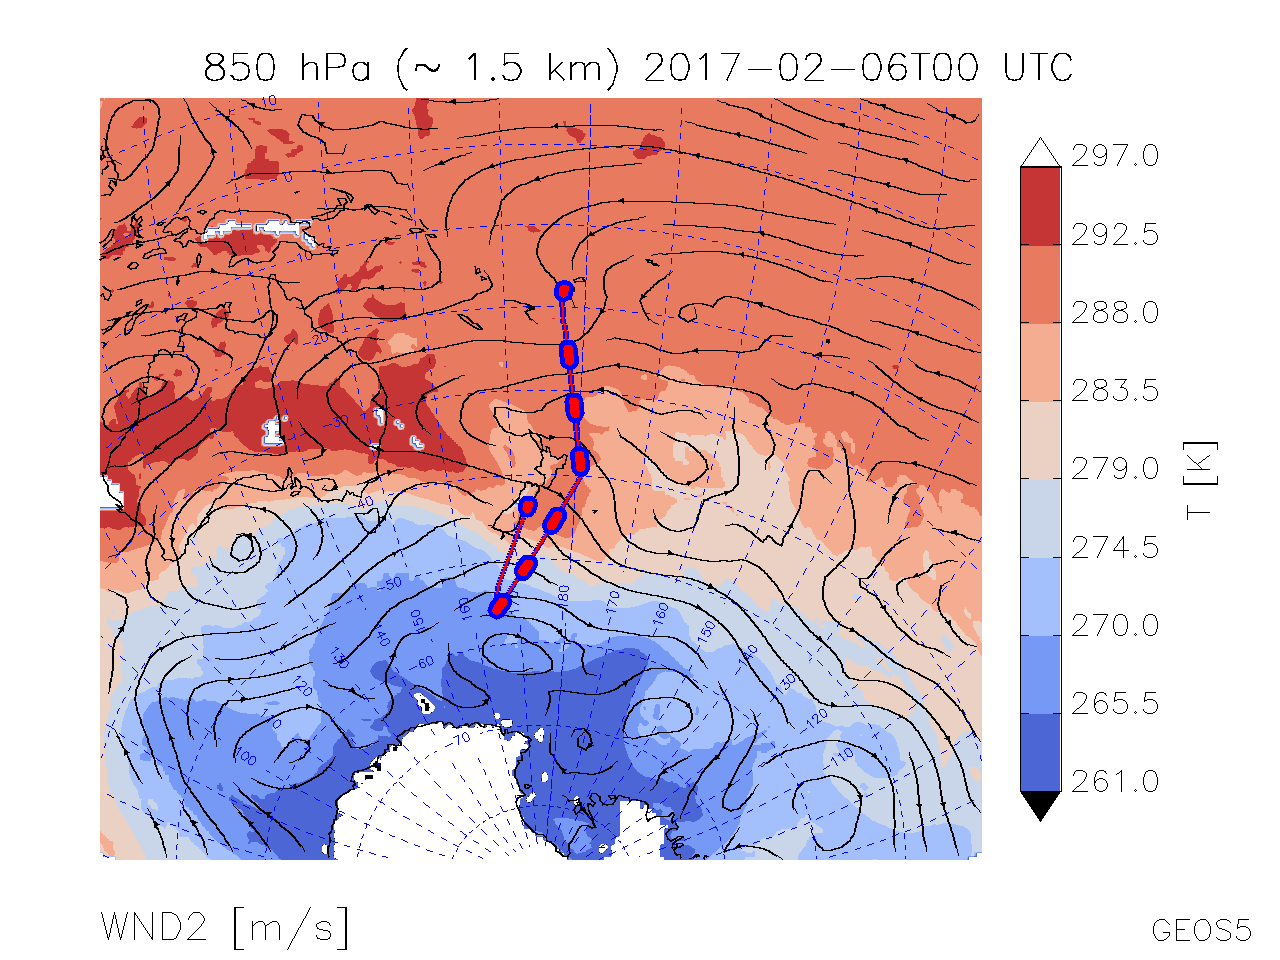
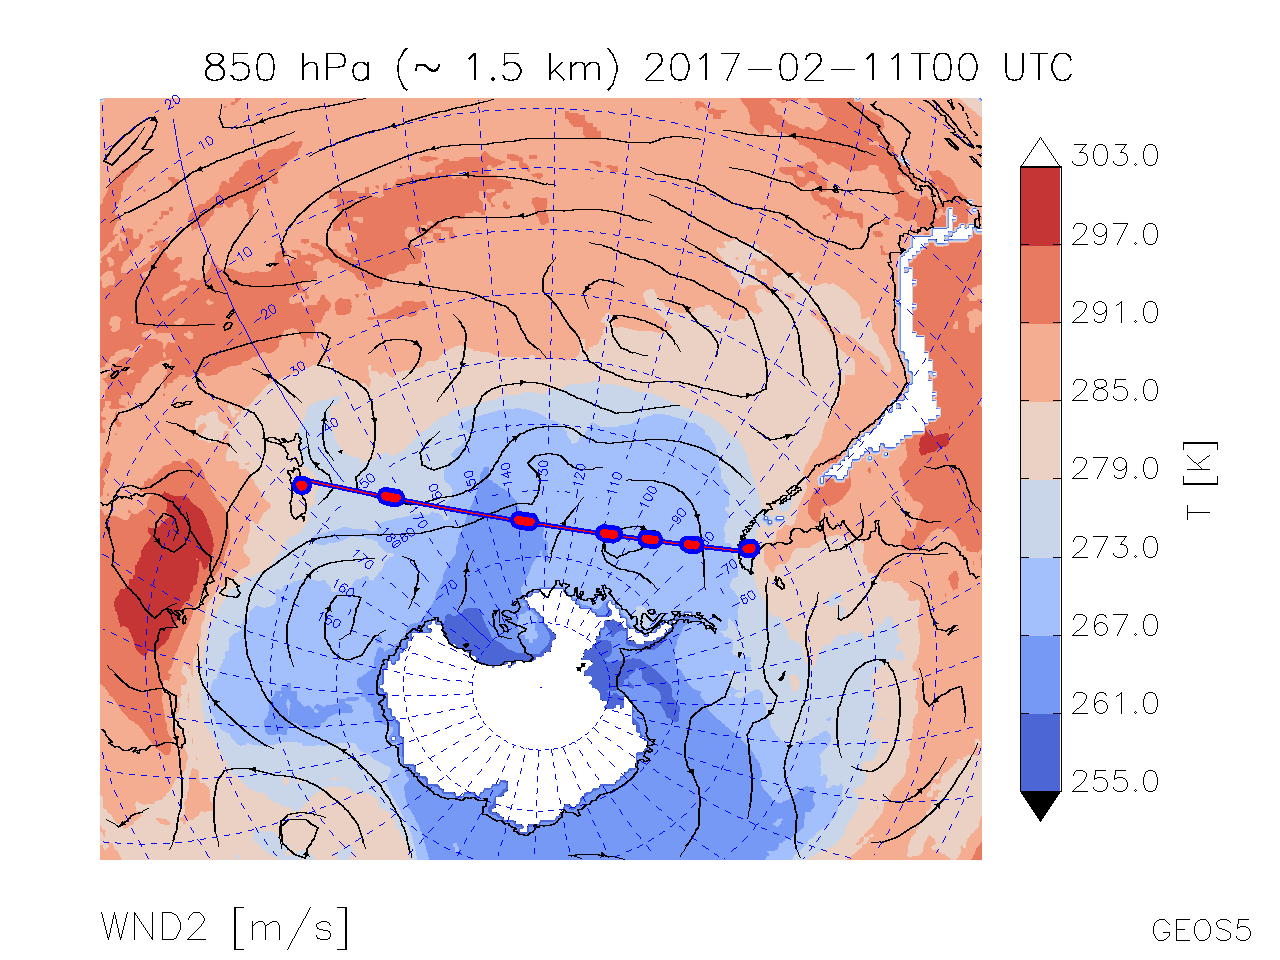
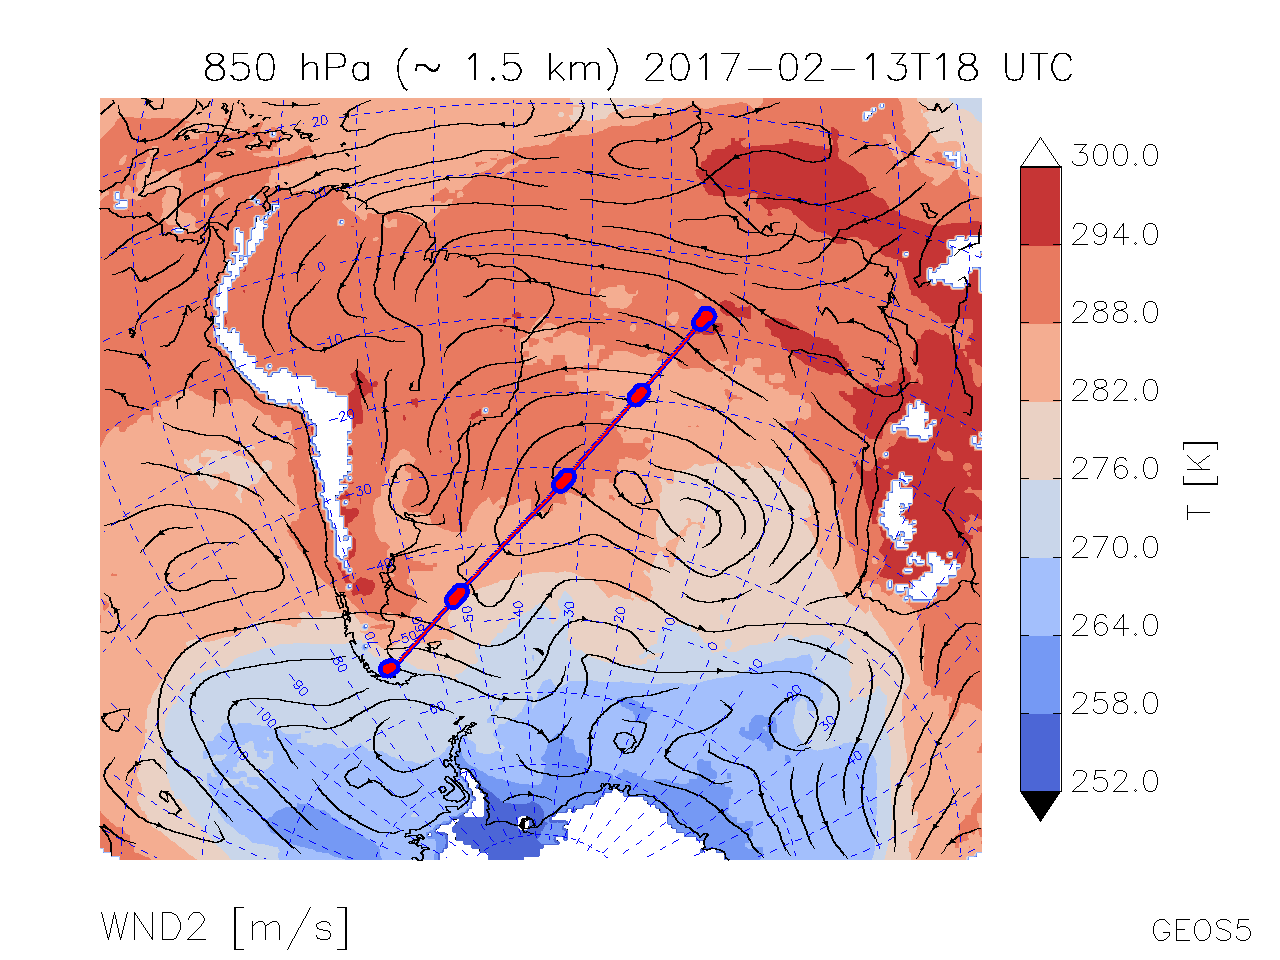
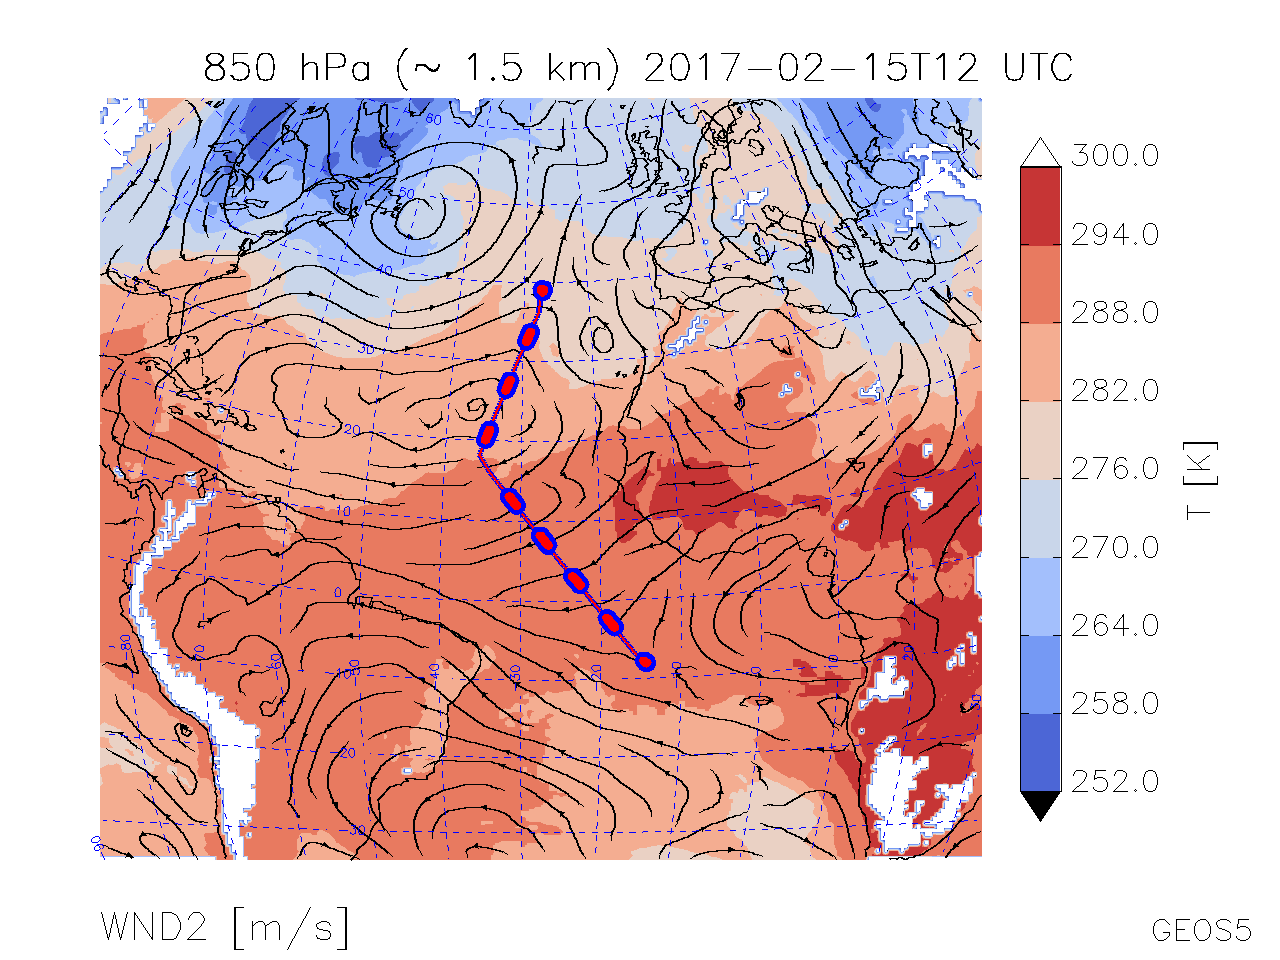
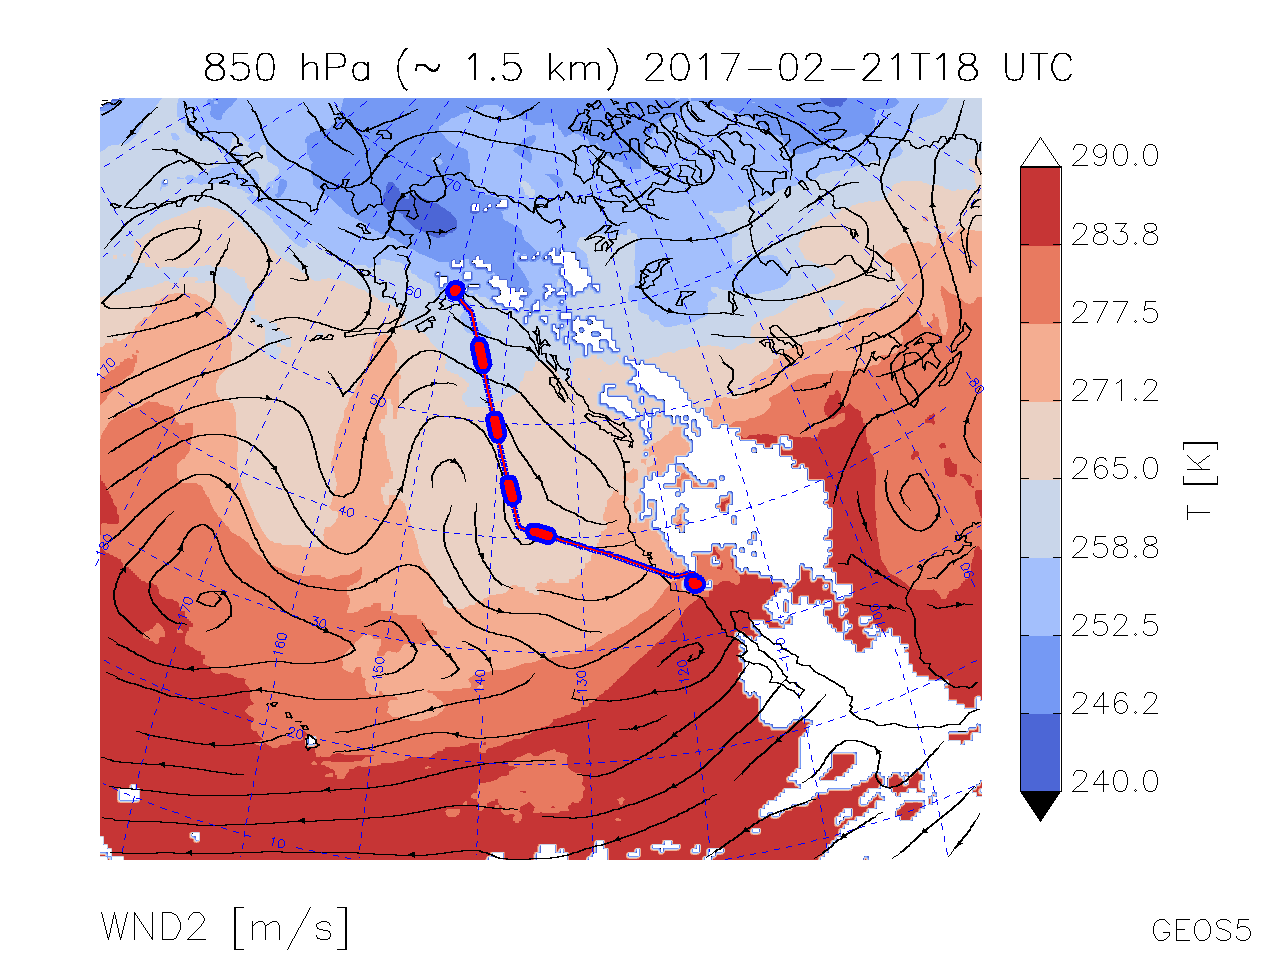
| Map of T, Wind Streamlines @ 850 hPa | |
|
|
|
|
|
|
|
|
|
|
|
|
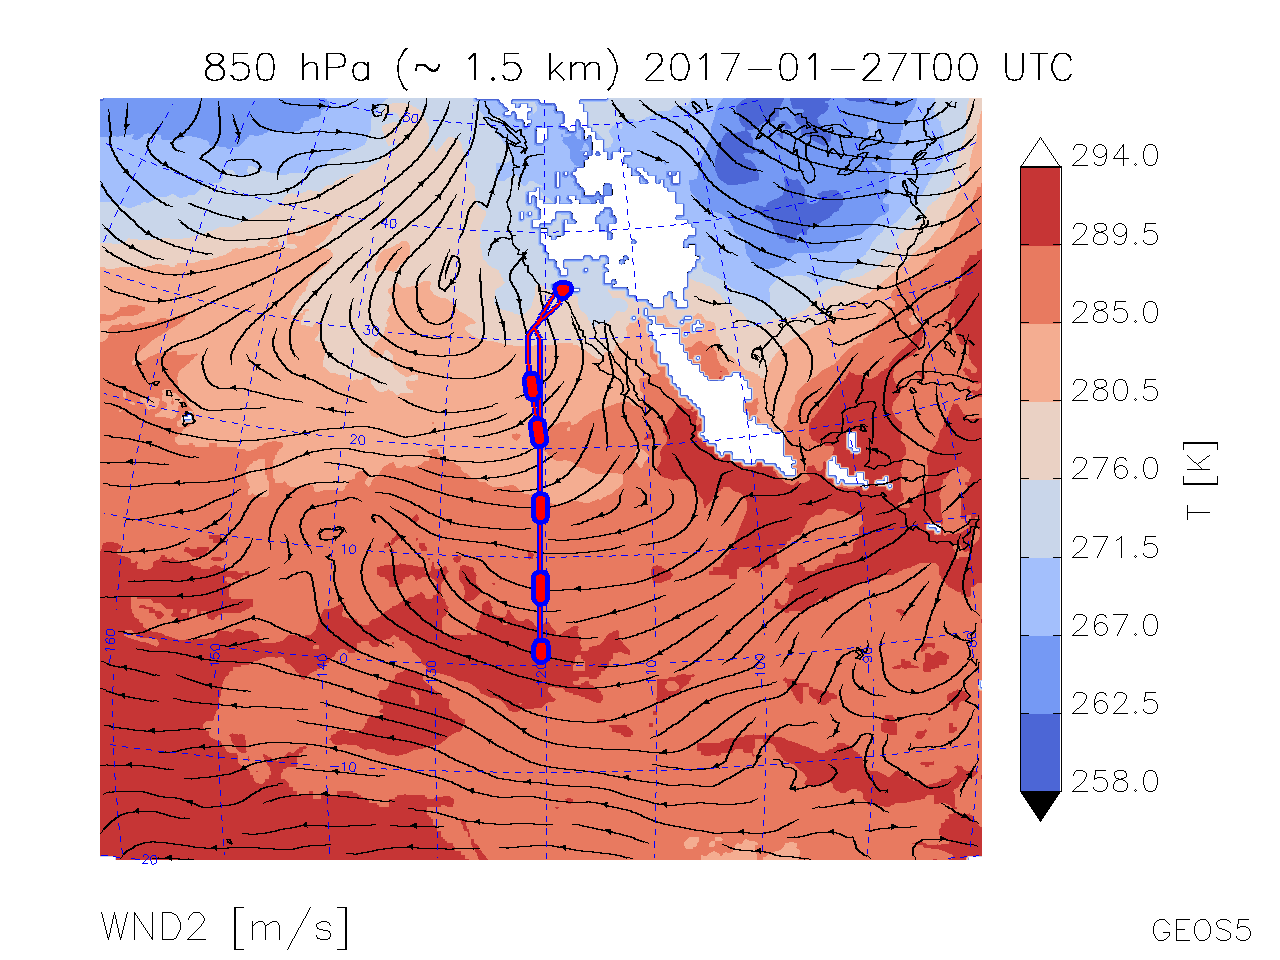
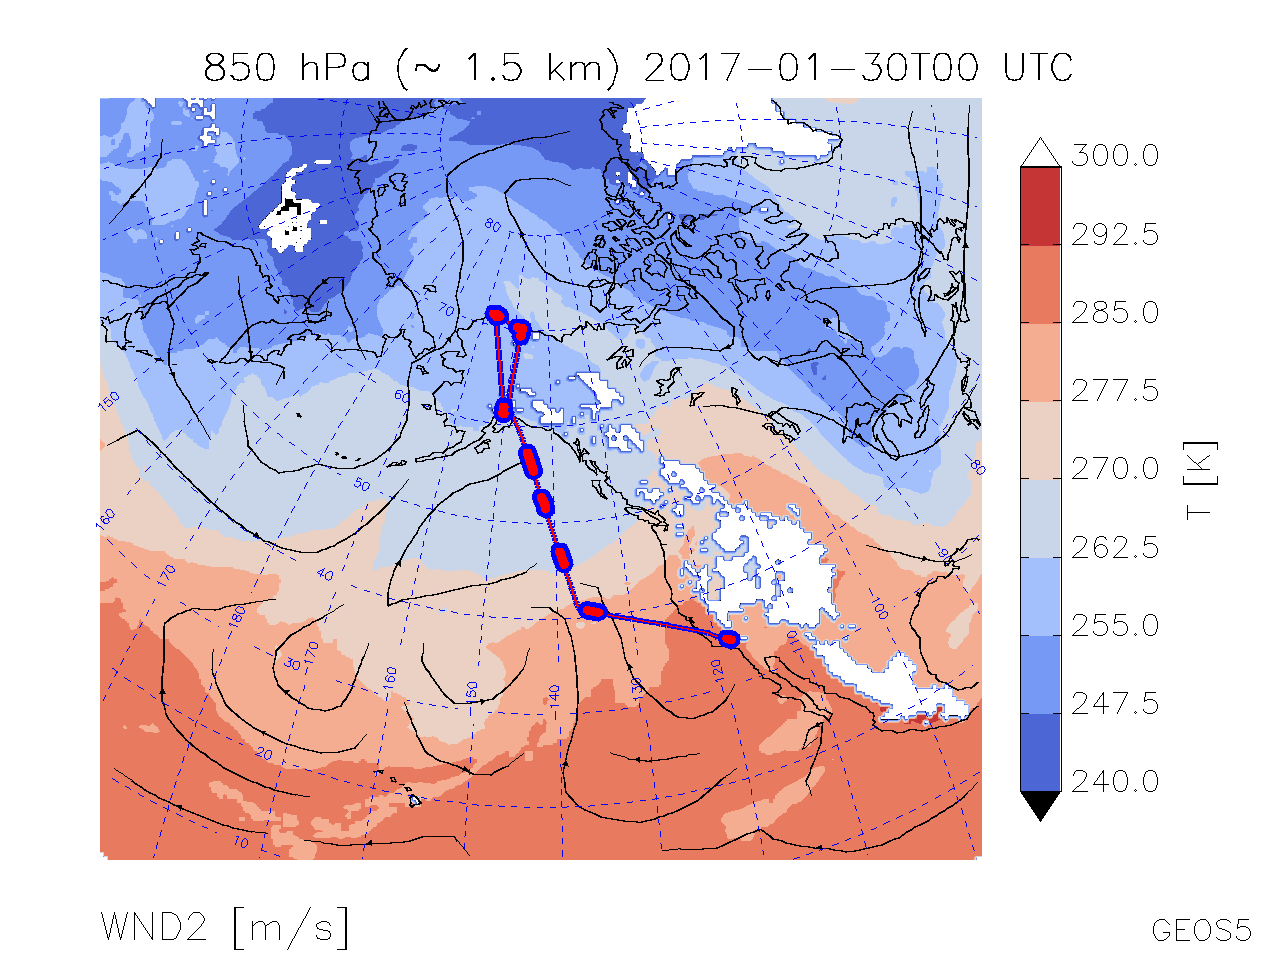
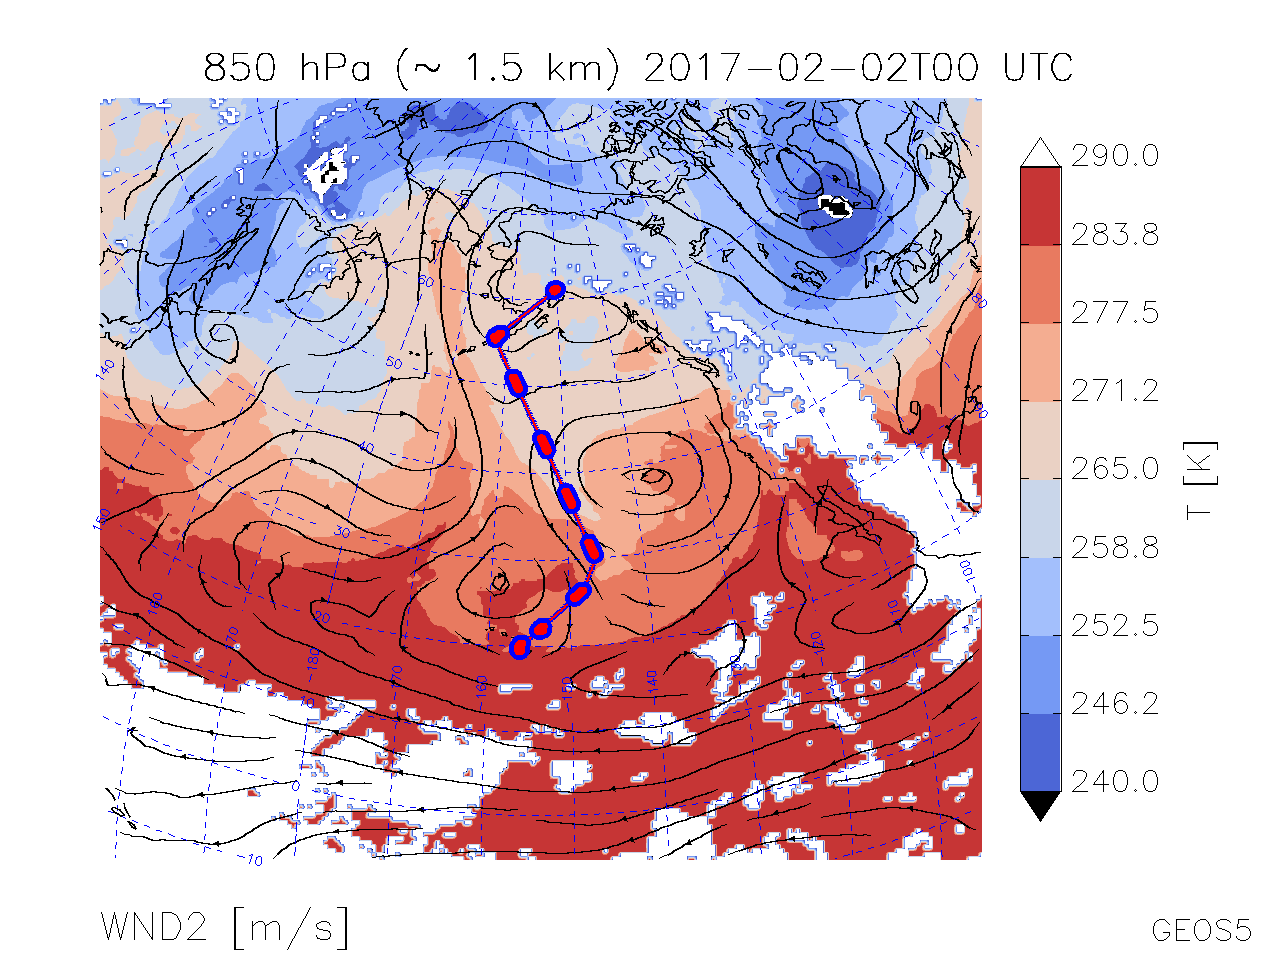
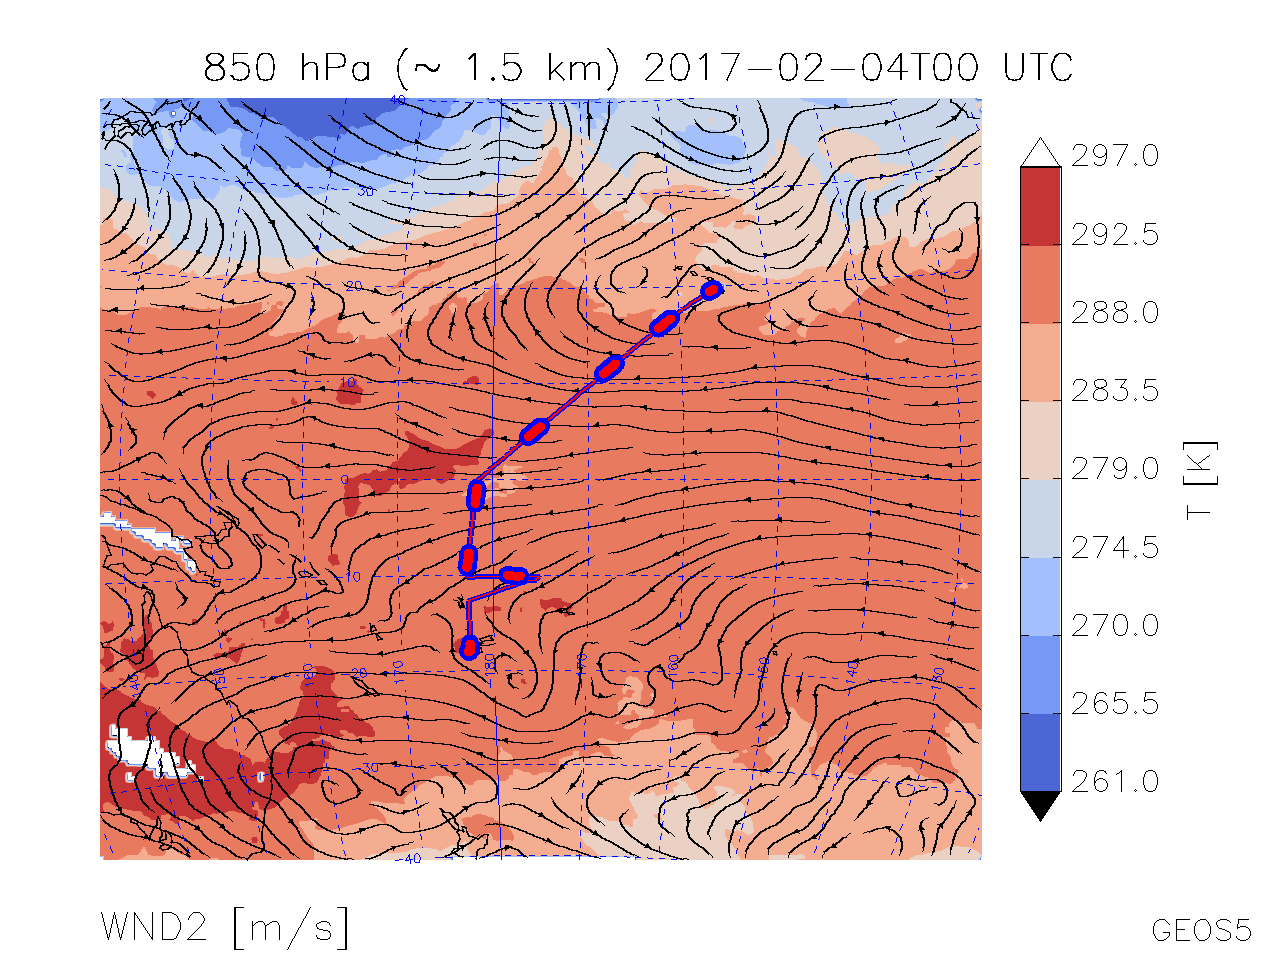
Map of T, Wind Streamlines @ 850 hPa |
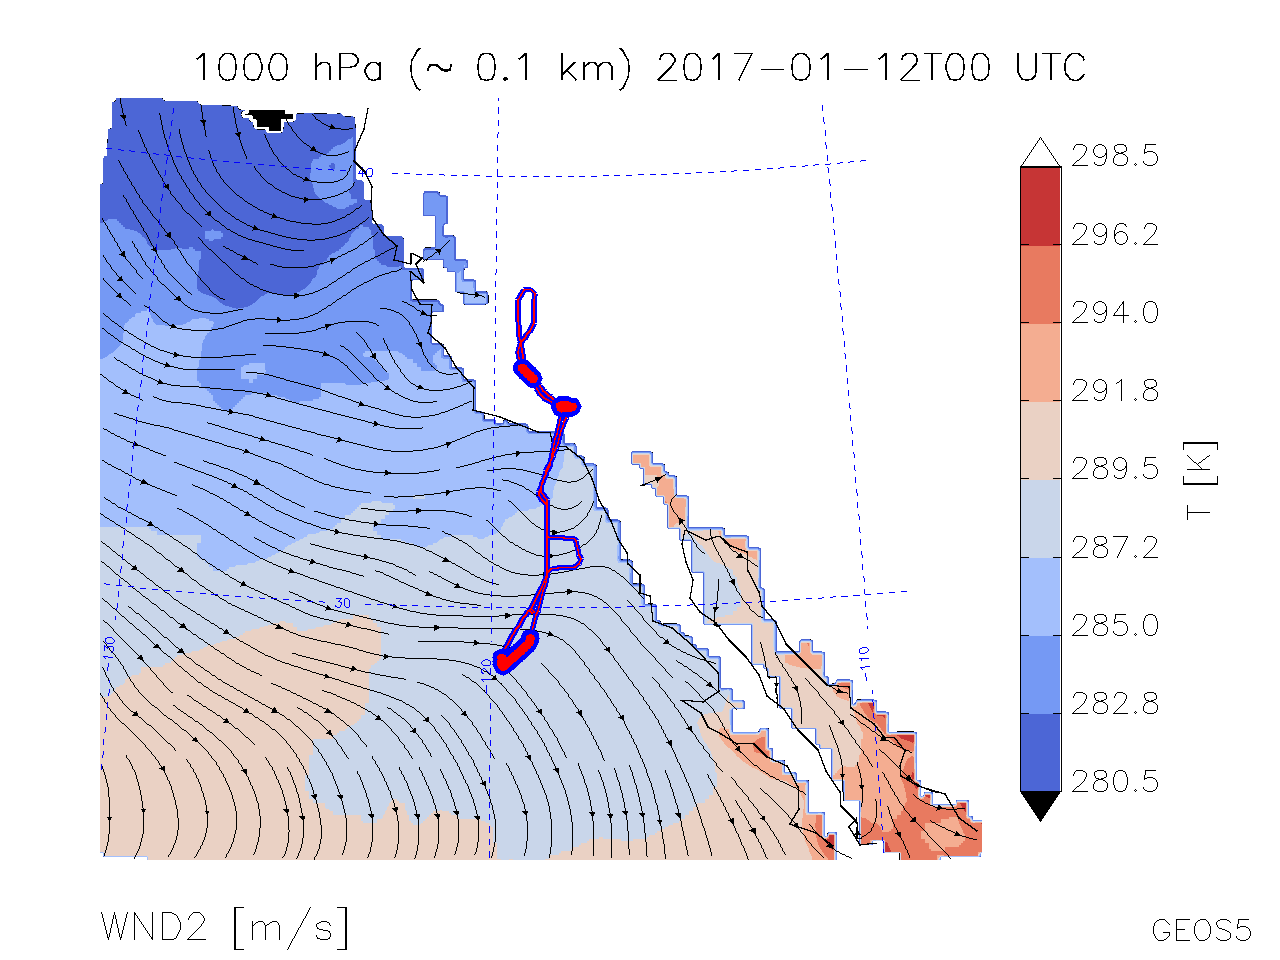
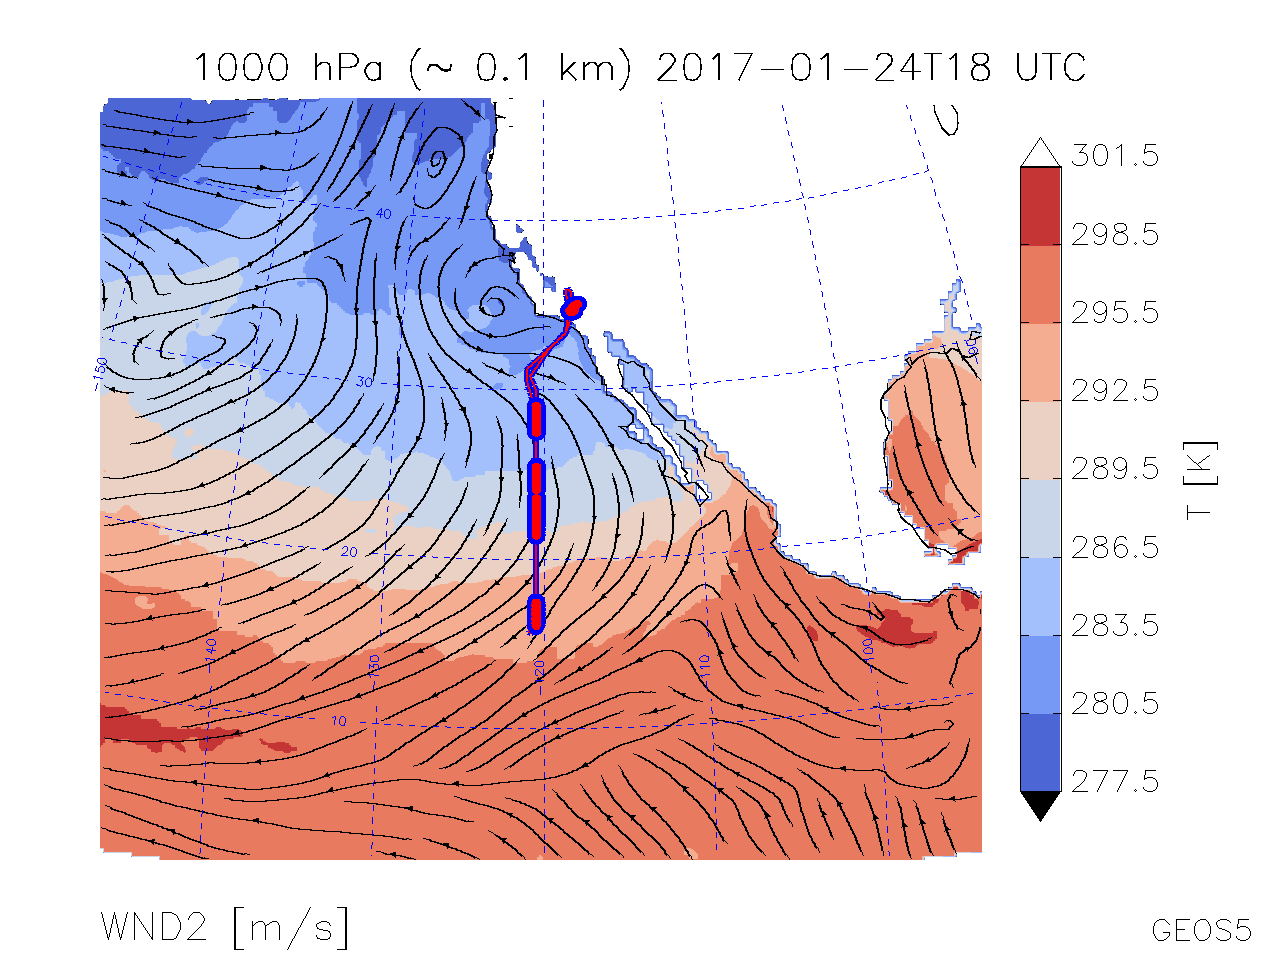
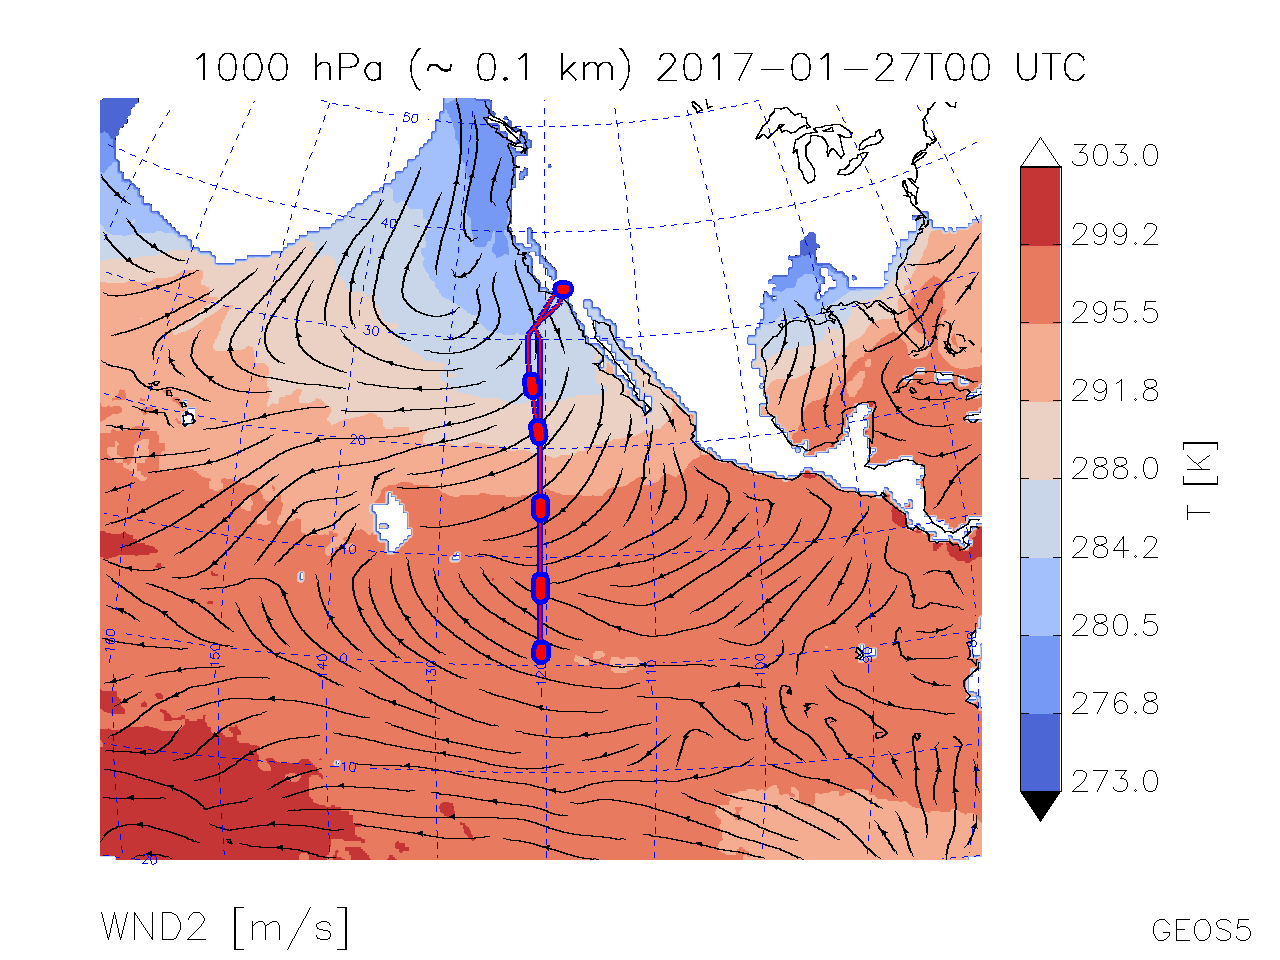
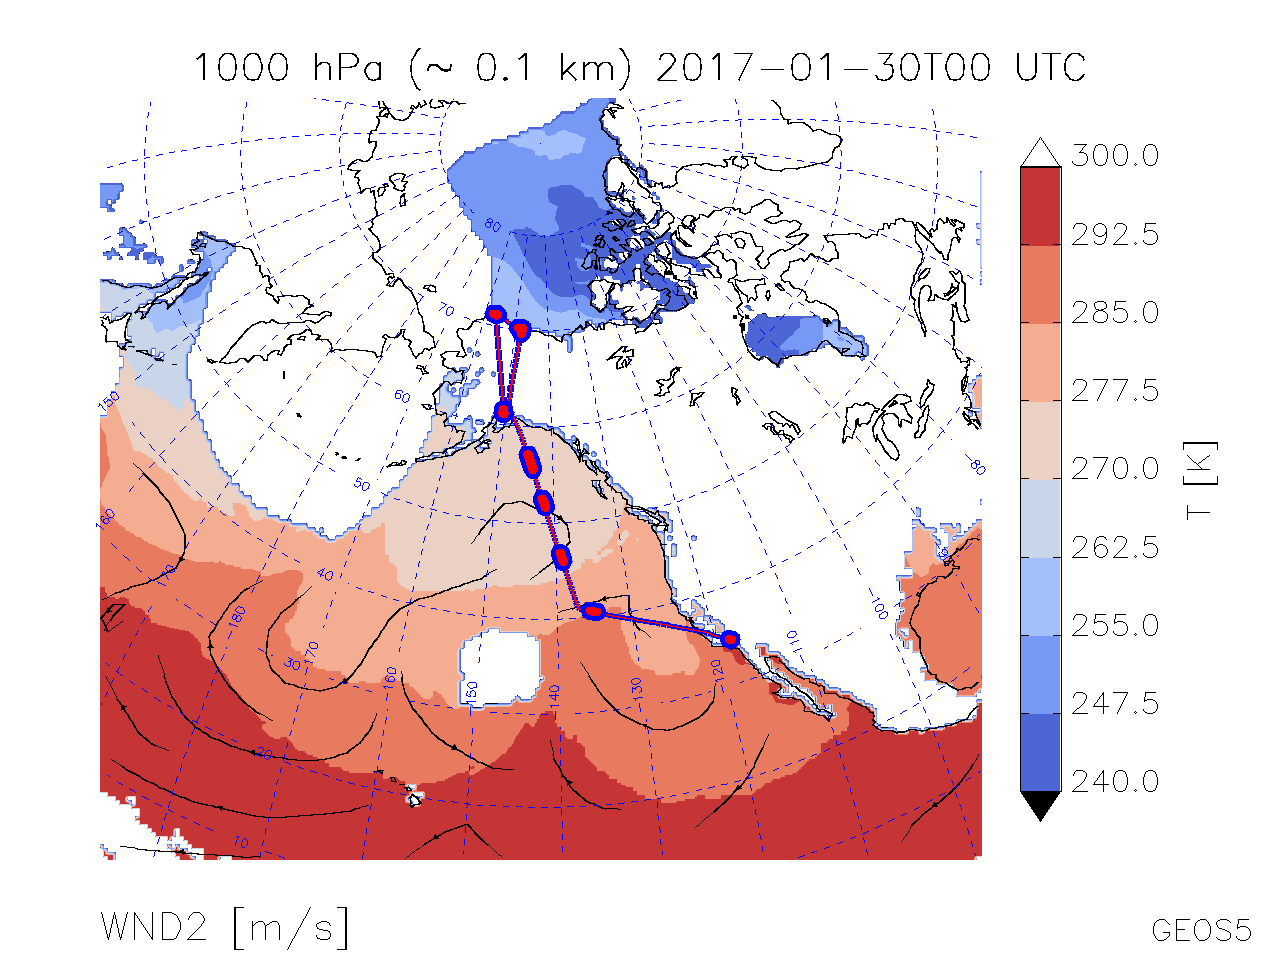
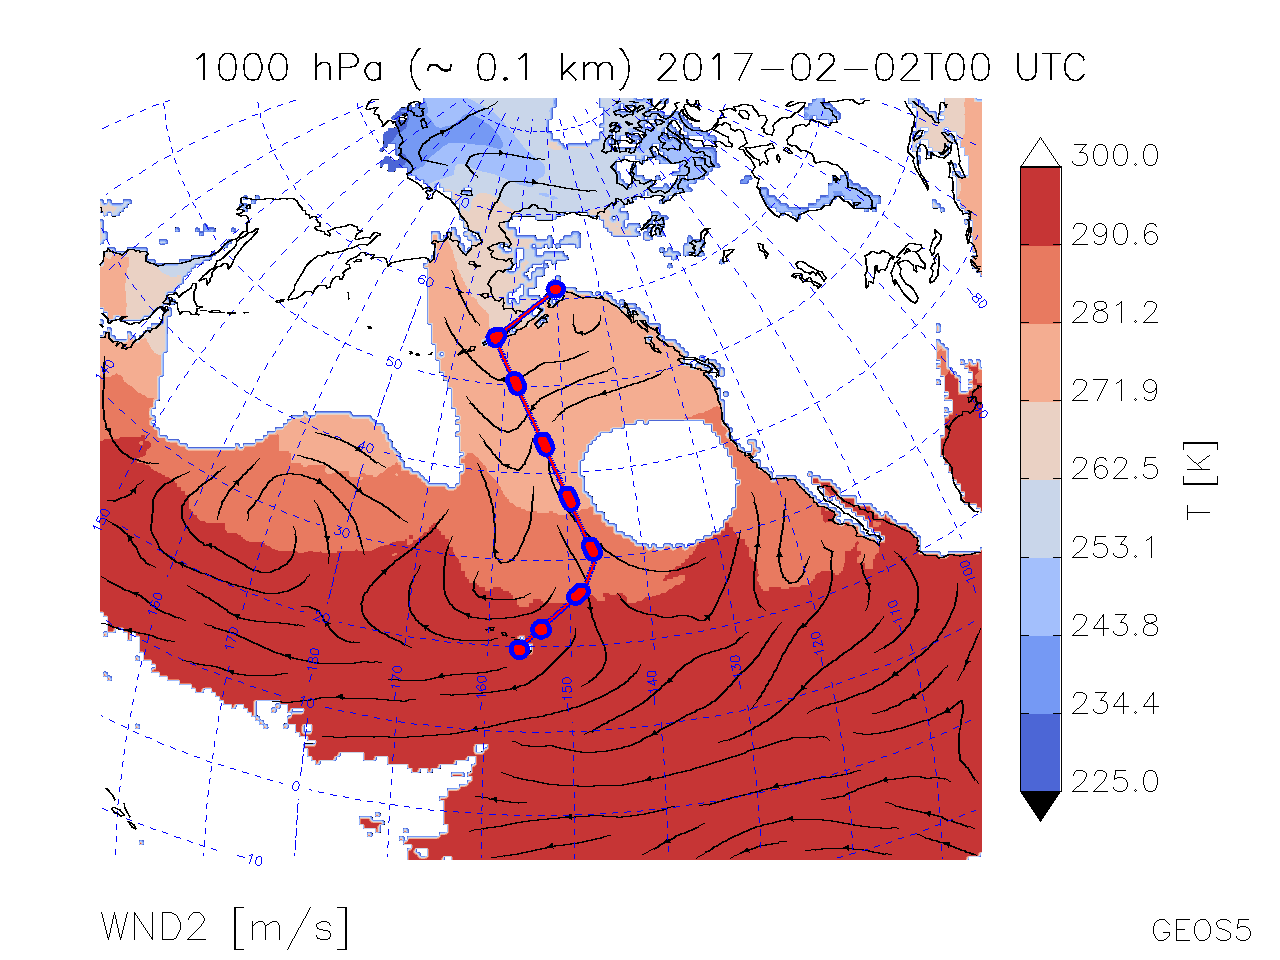
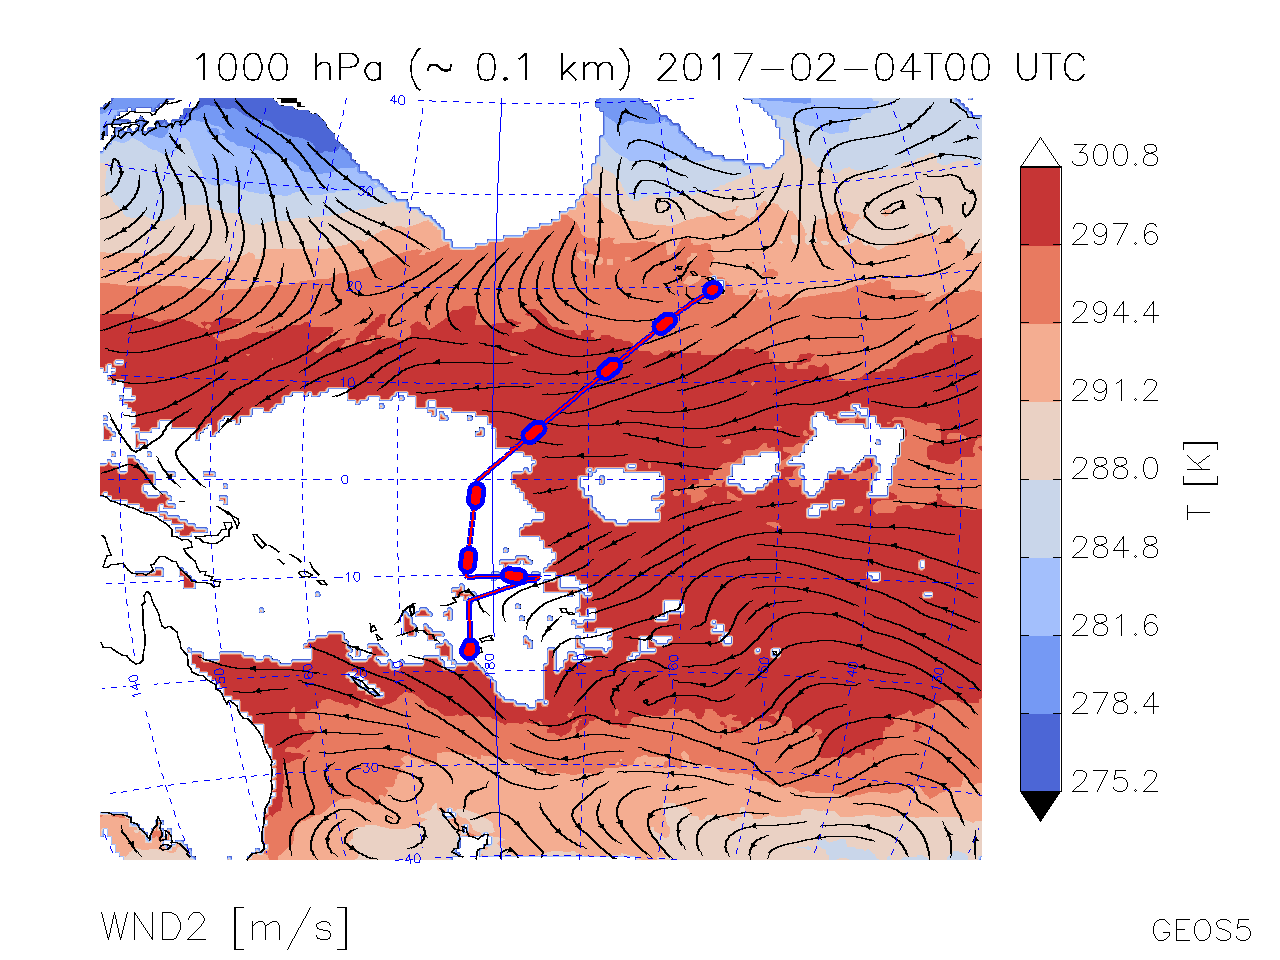
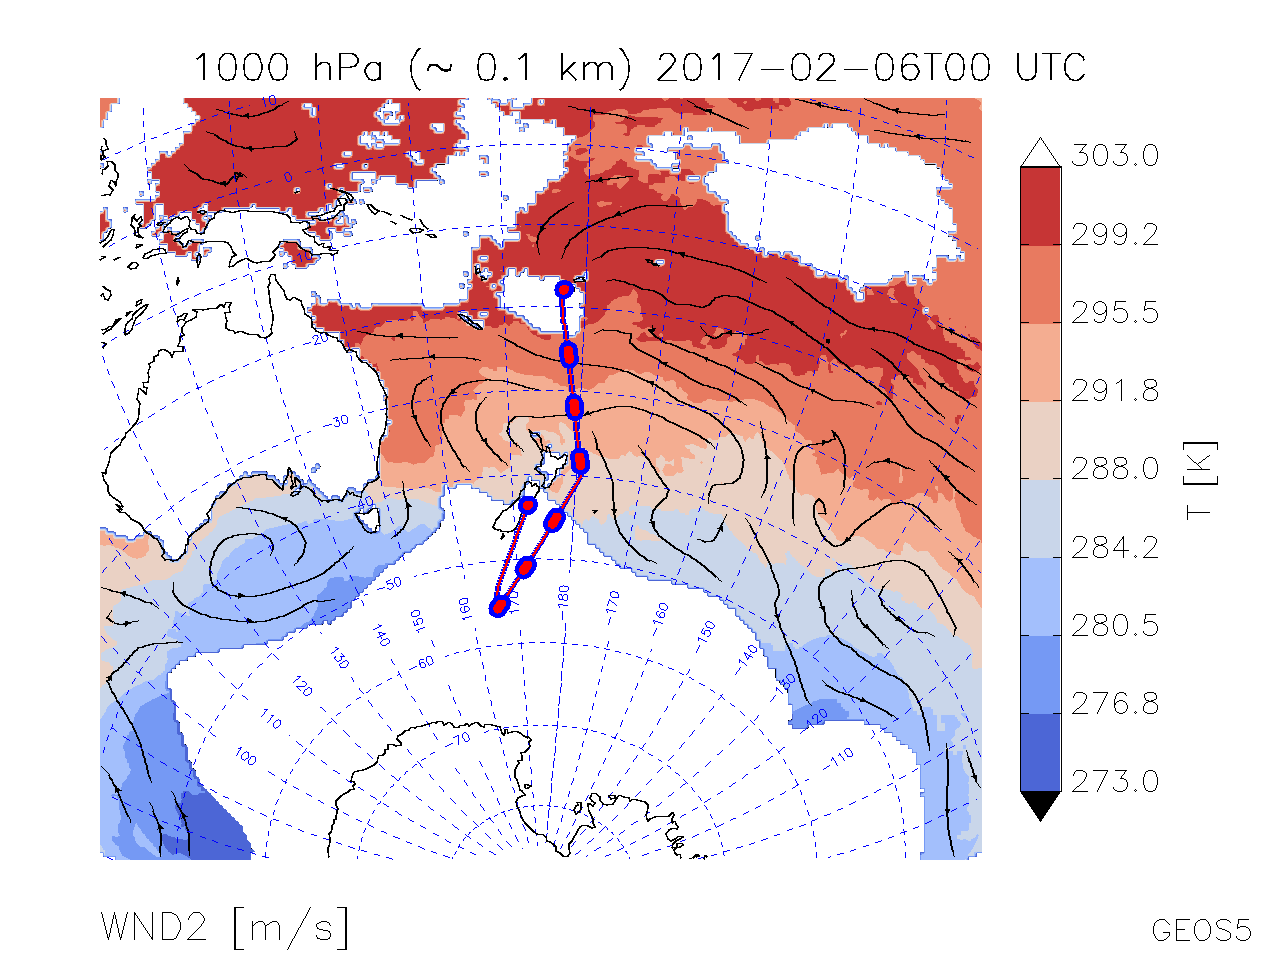
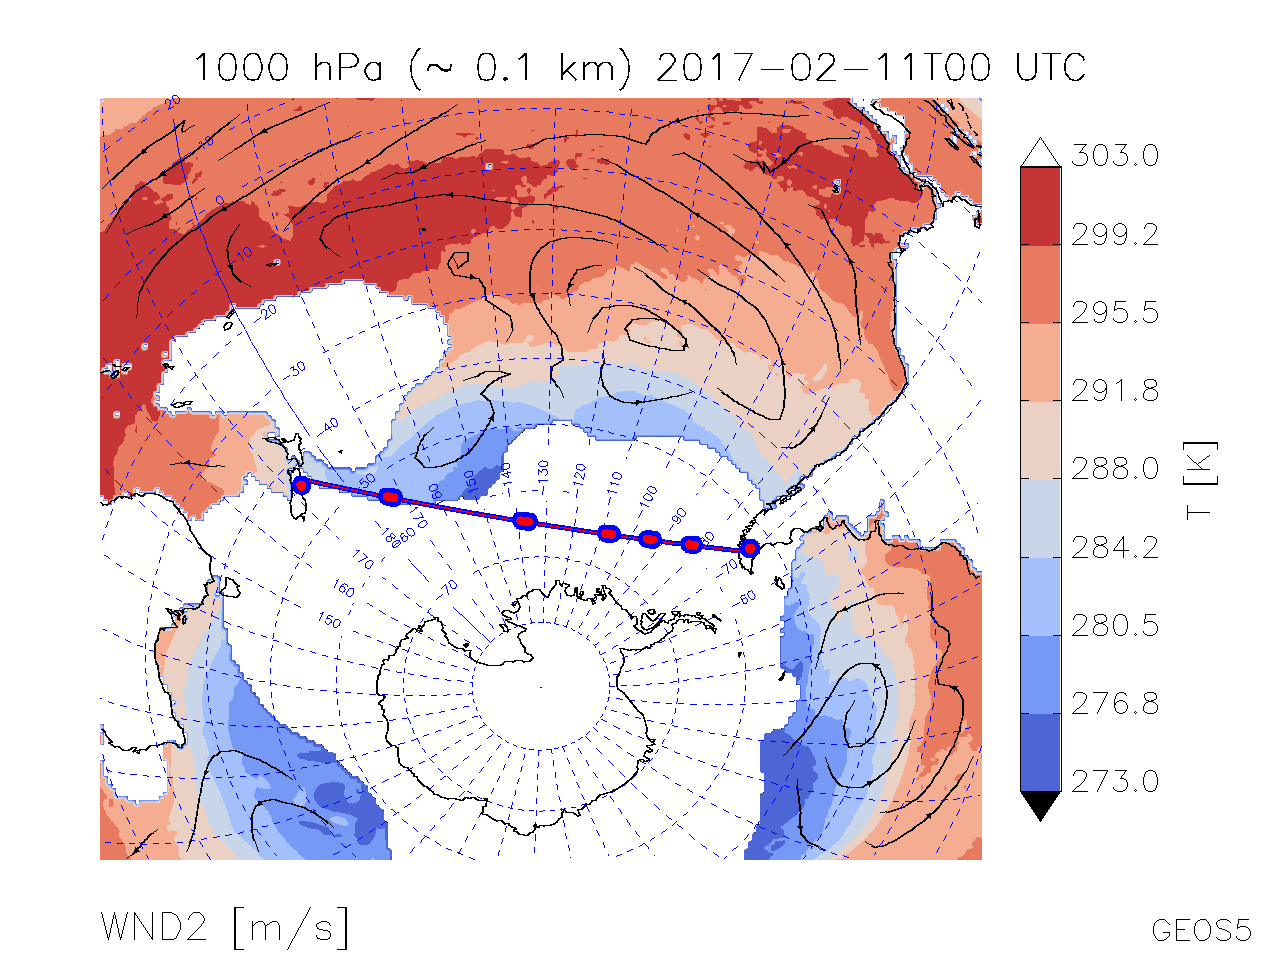
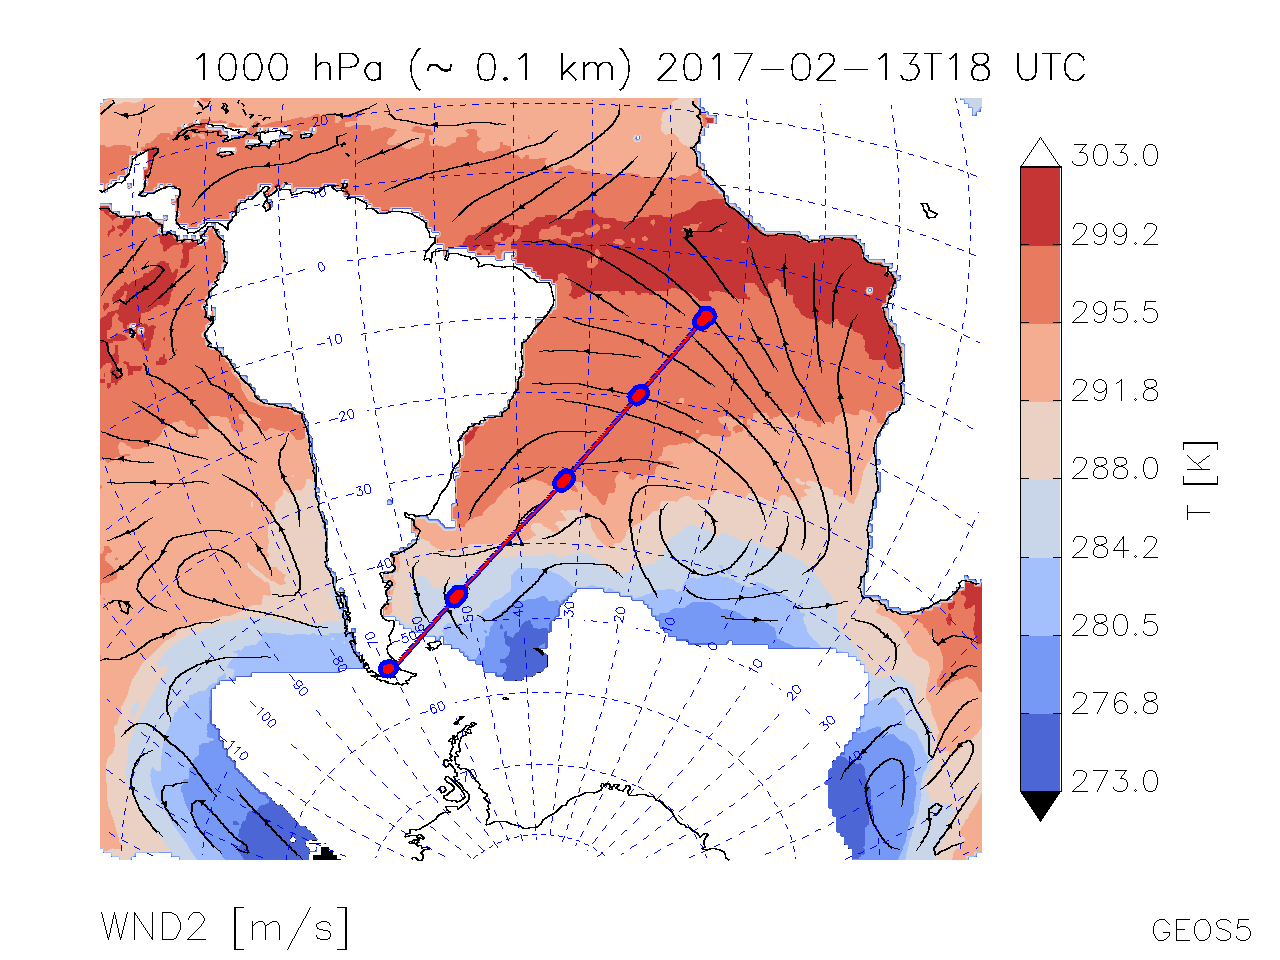
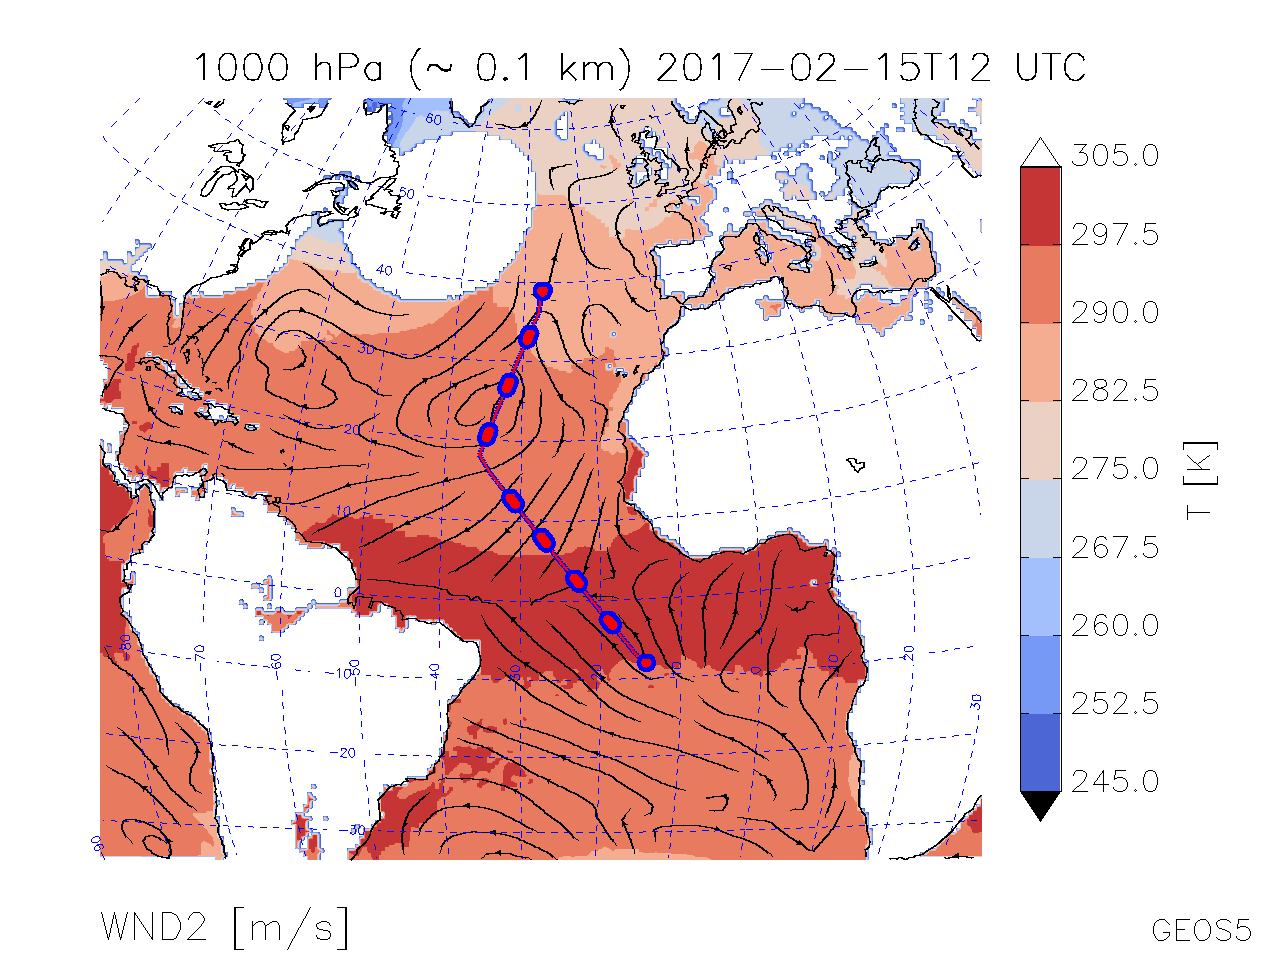
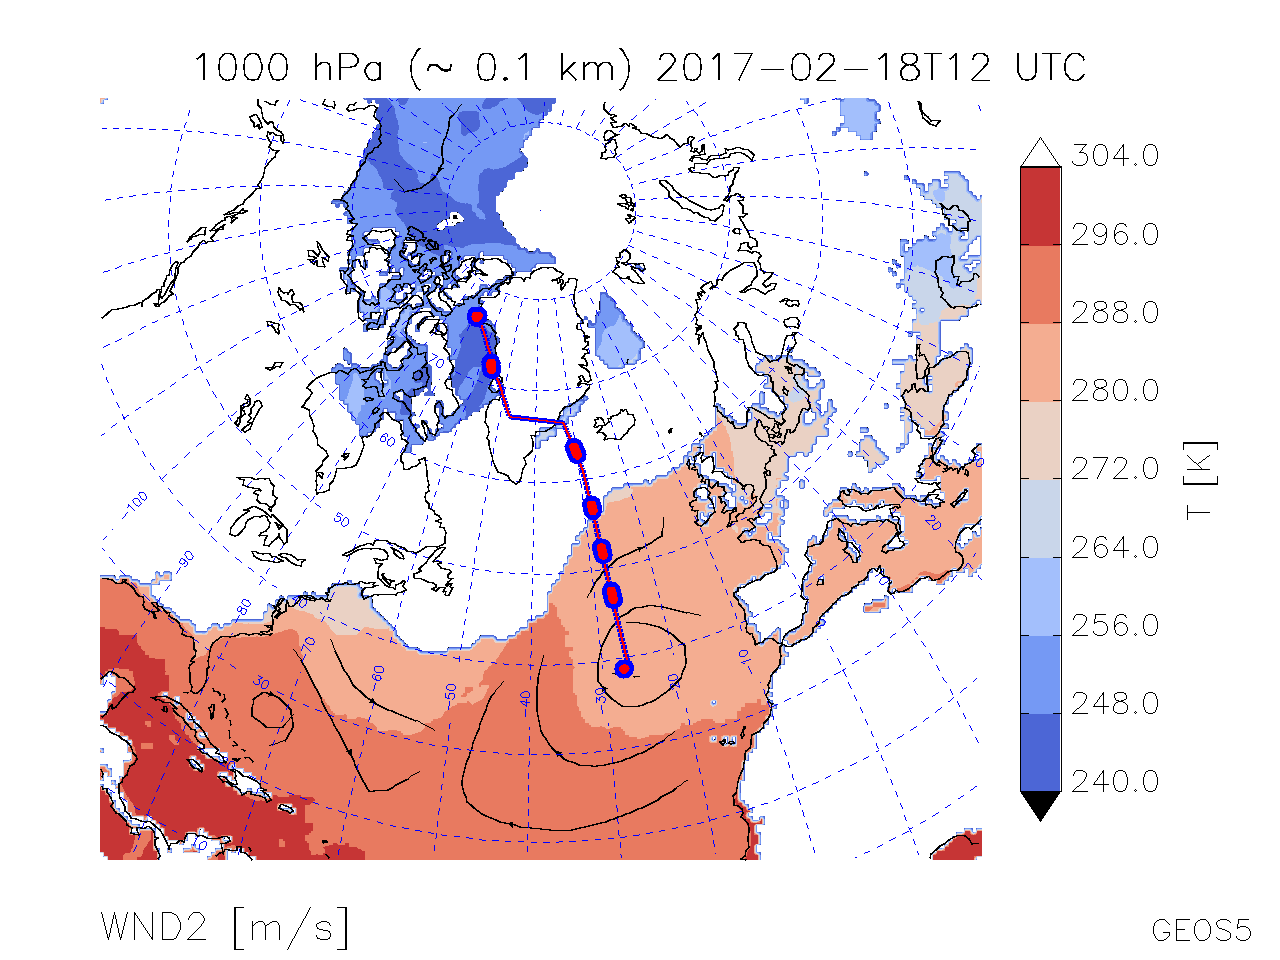
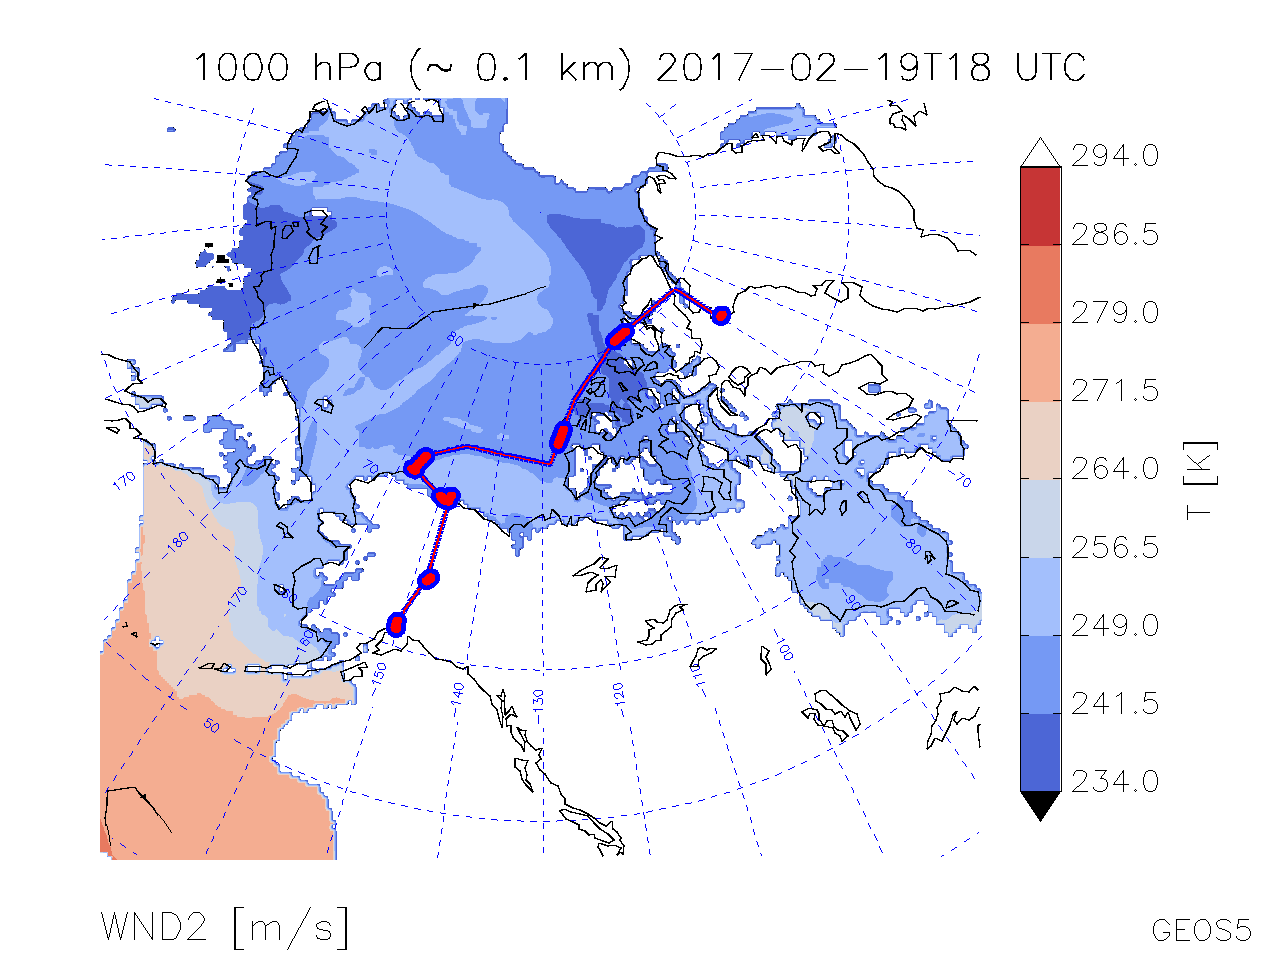
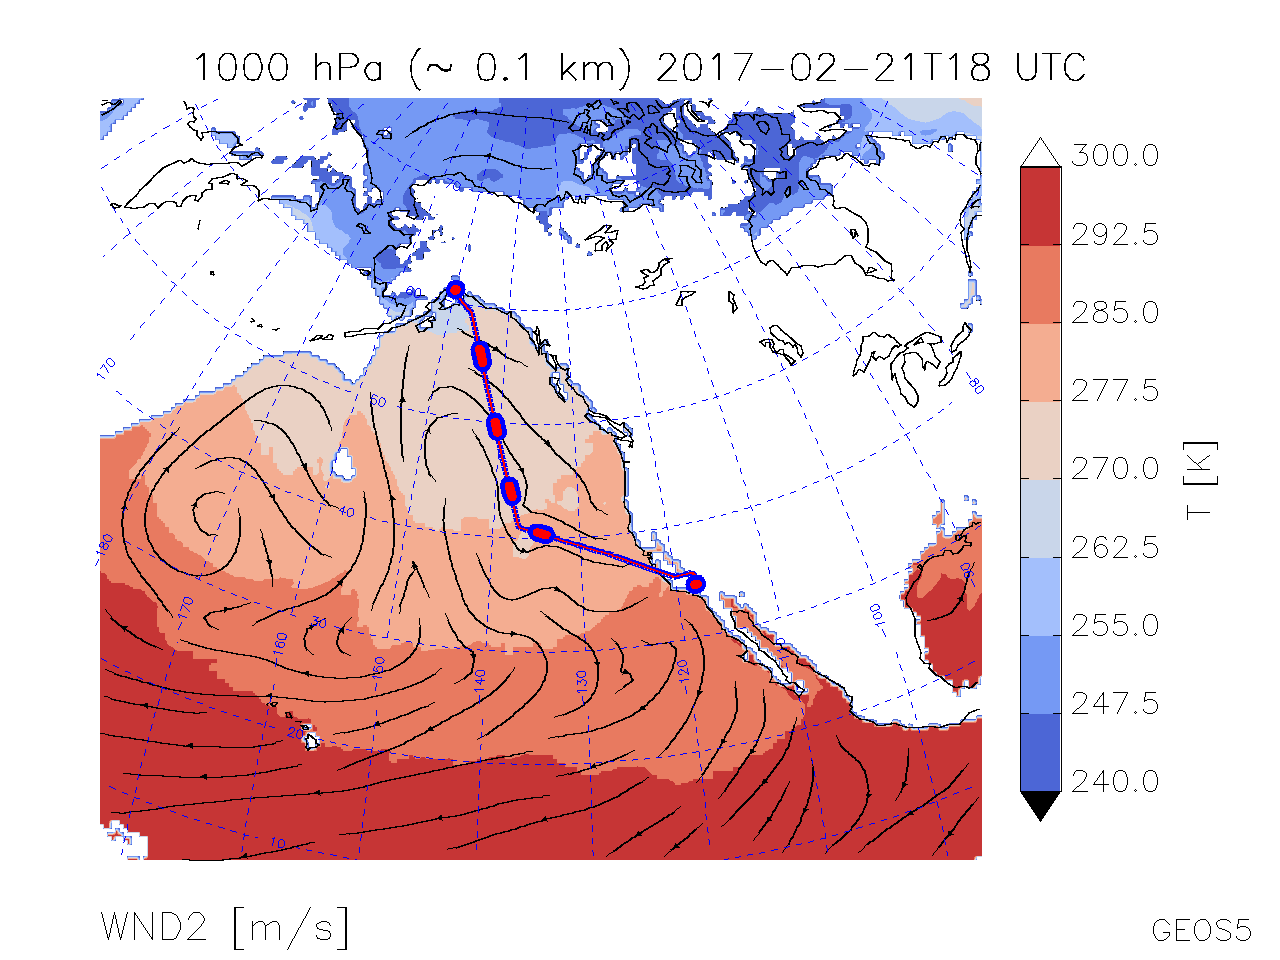
| Map of T, Wind Streamlines @ 1000 hPa | |
|
|
|
|
|
|
|
|
|
|
|
|
Map of T, Wind Streamlines @ 1000 hPa |
| Plot | 2017-01-11 | 2017-01-24 | 2017-01-26 | 2017-01-29 | 2017-02-01 | 2017-02-03 | 2017-02-05 | 2017-02-10 | 2017-02-13 | 2017-02-15 | 2017-02-18 | 2017-02-19 | 2017-02-21 | Plot |
|---|---|---|---|---|---|---|---|---|---|---|---|---|---|---|
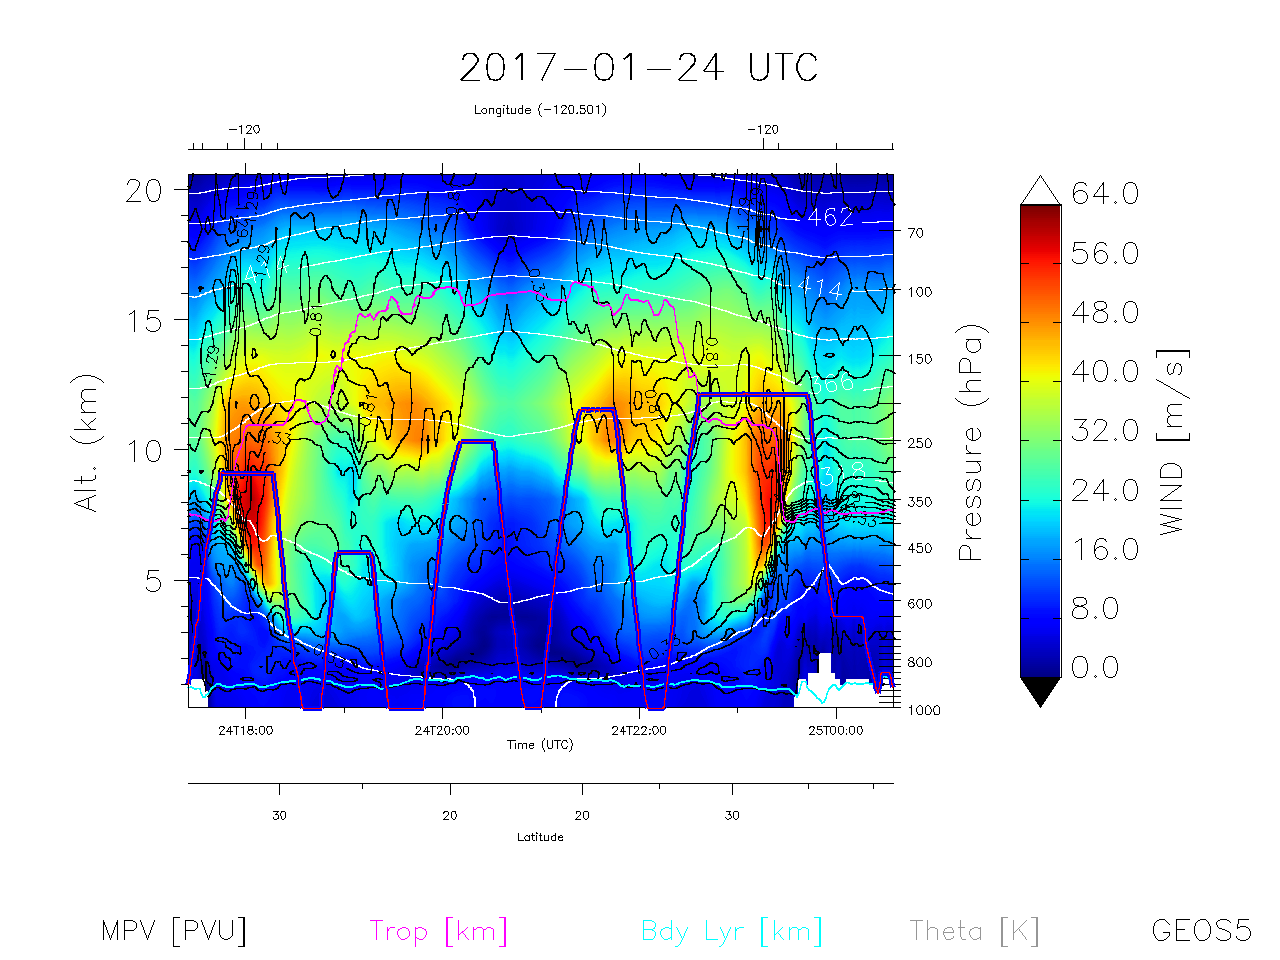
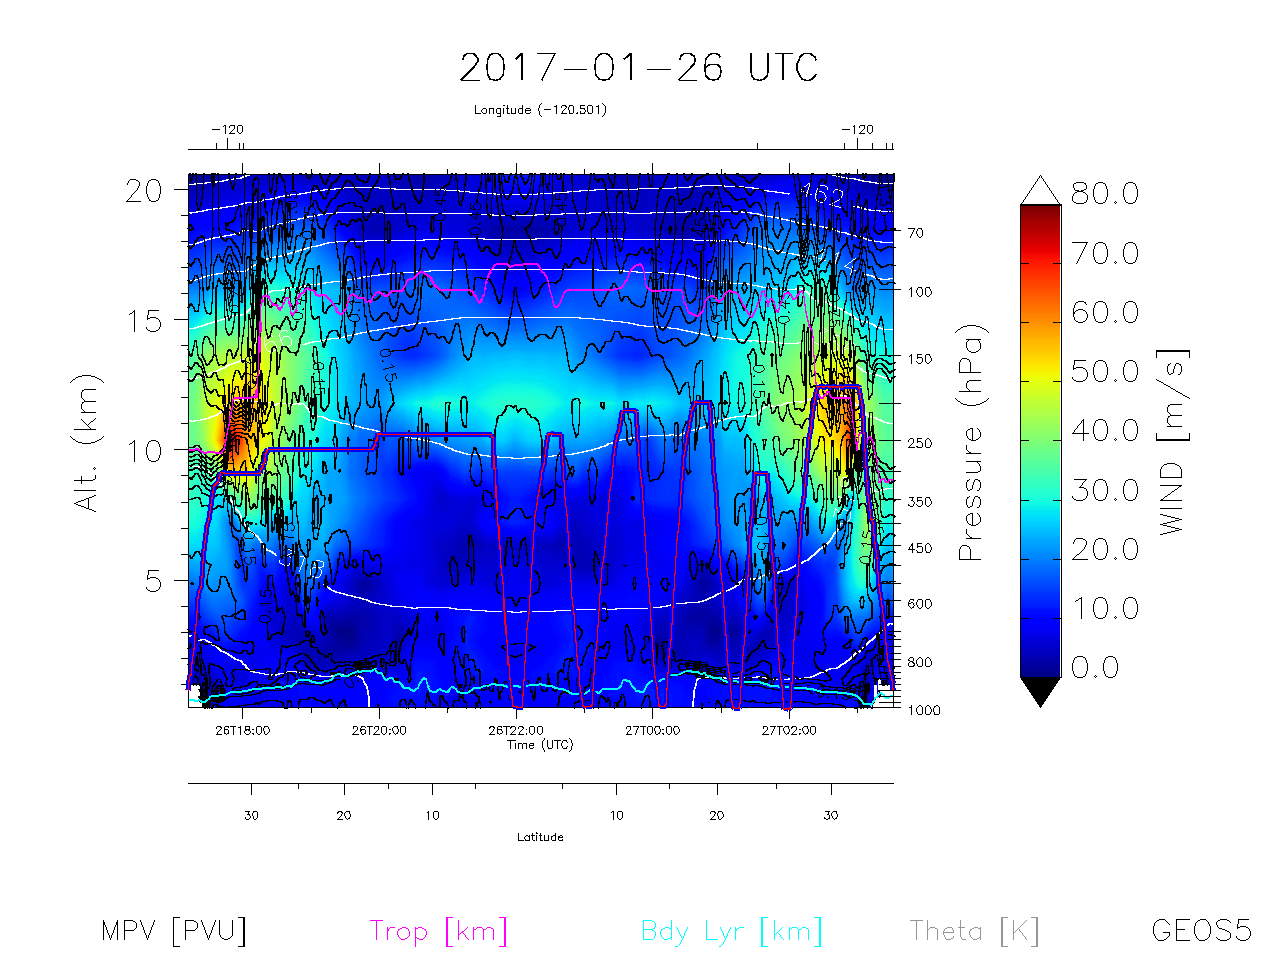
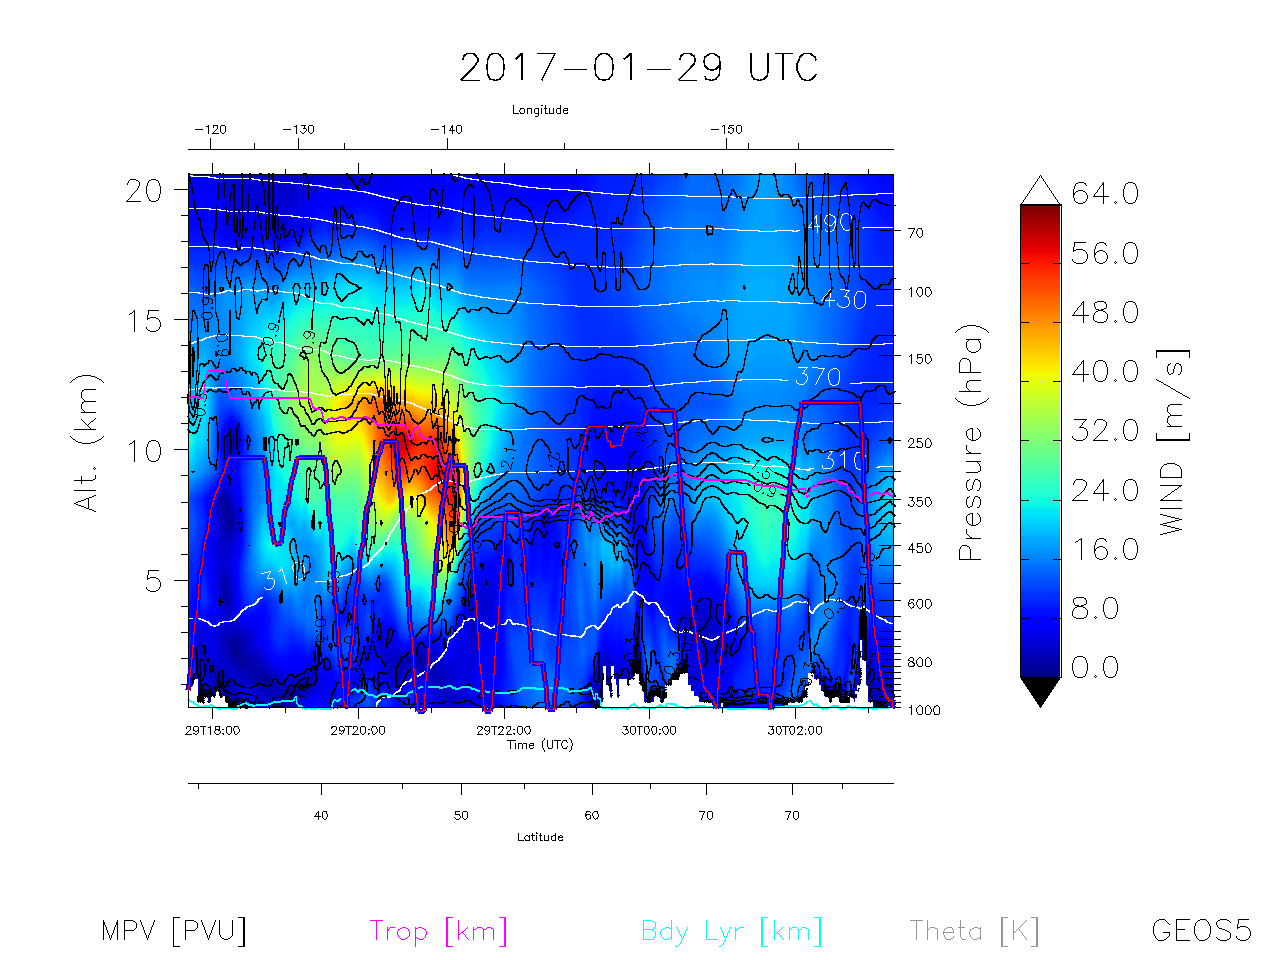
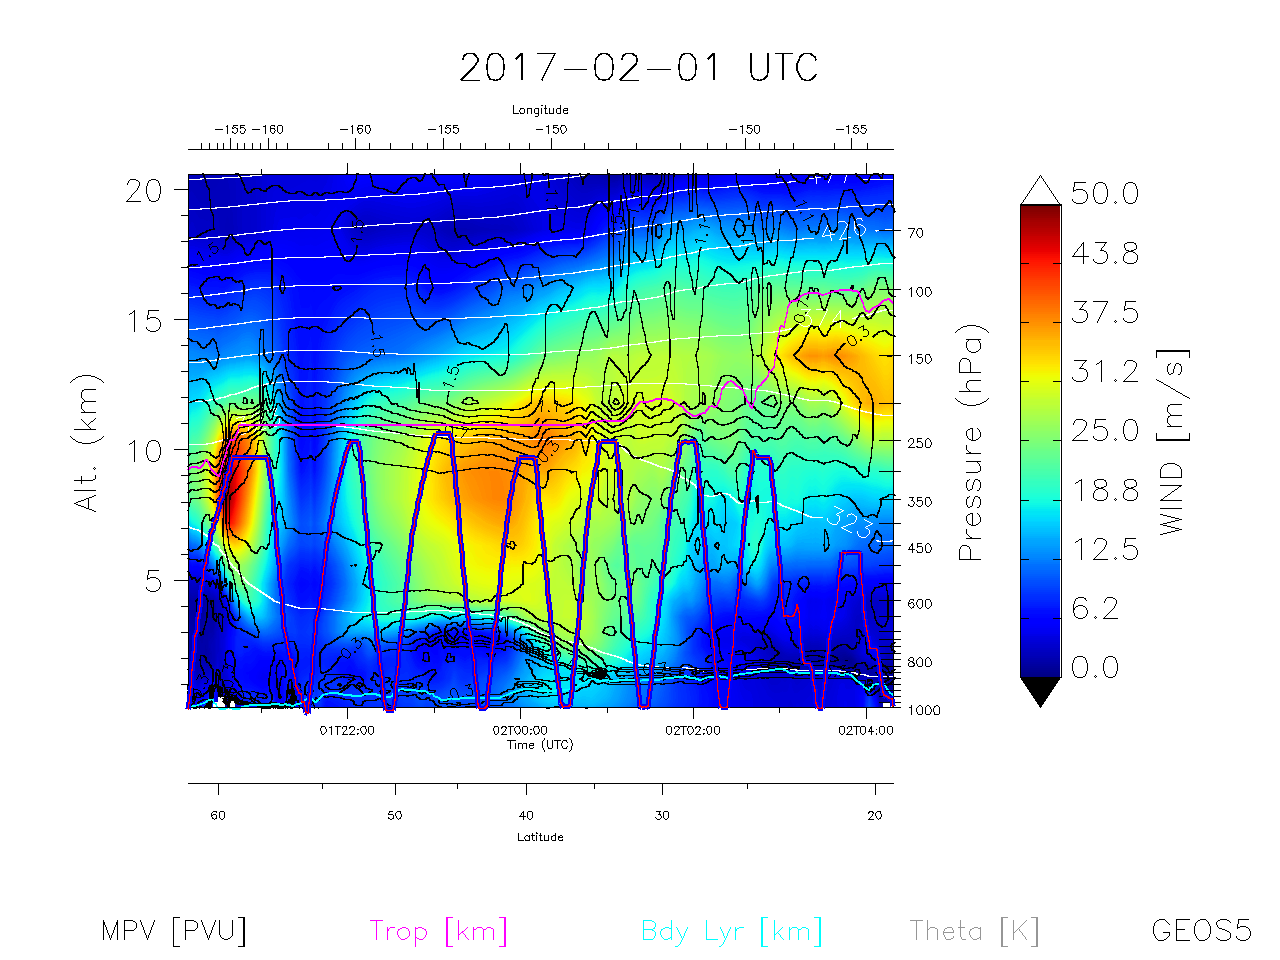
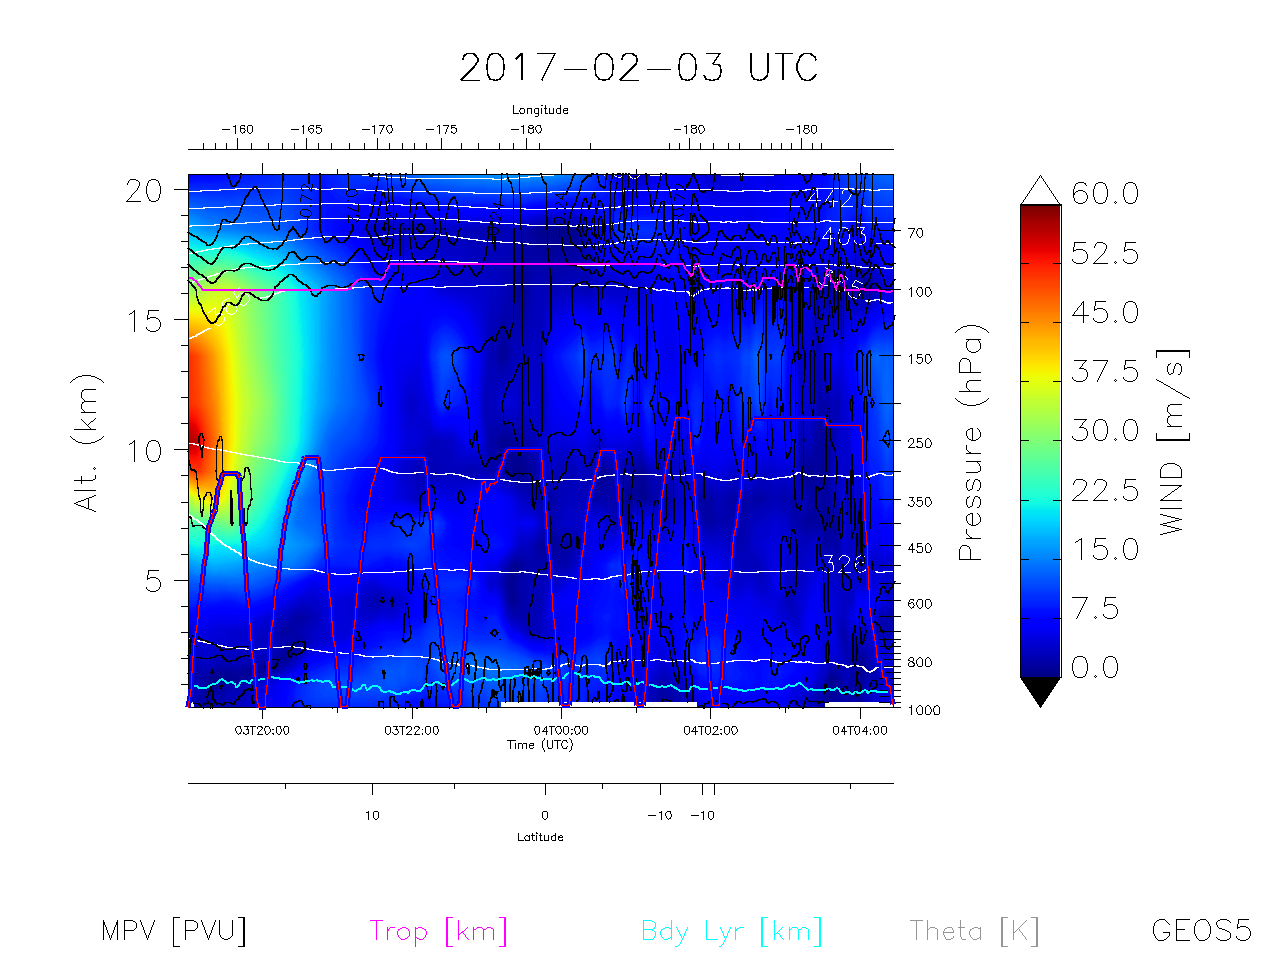
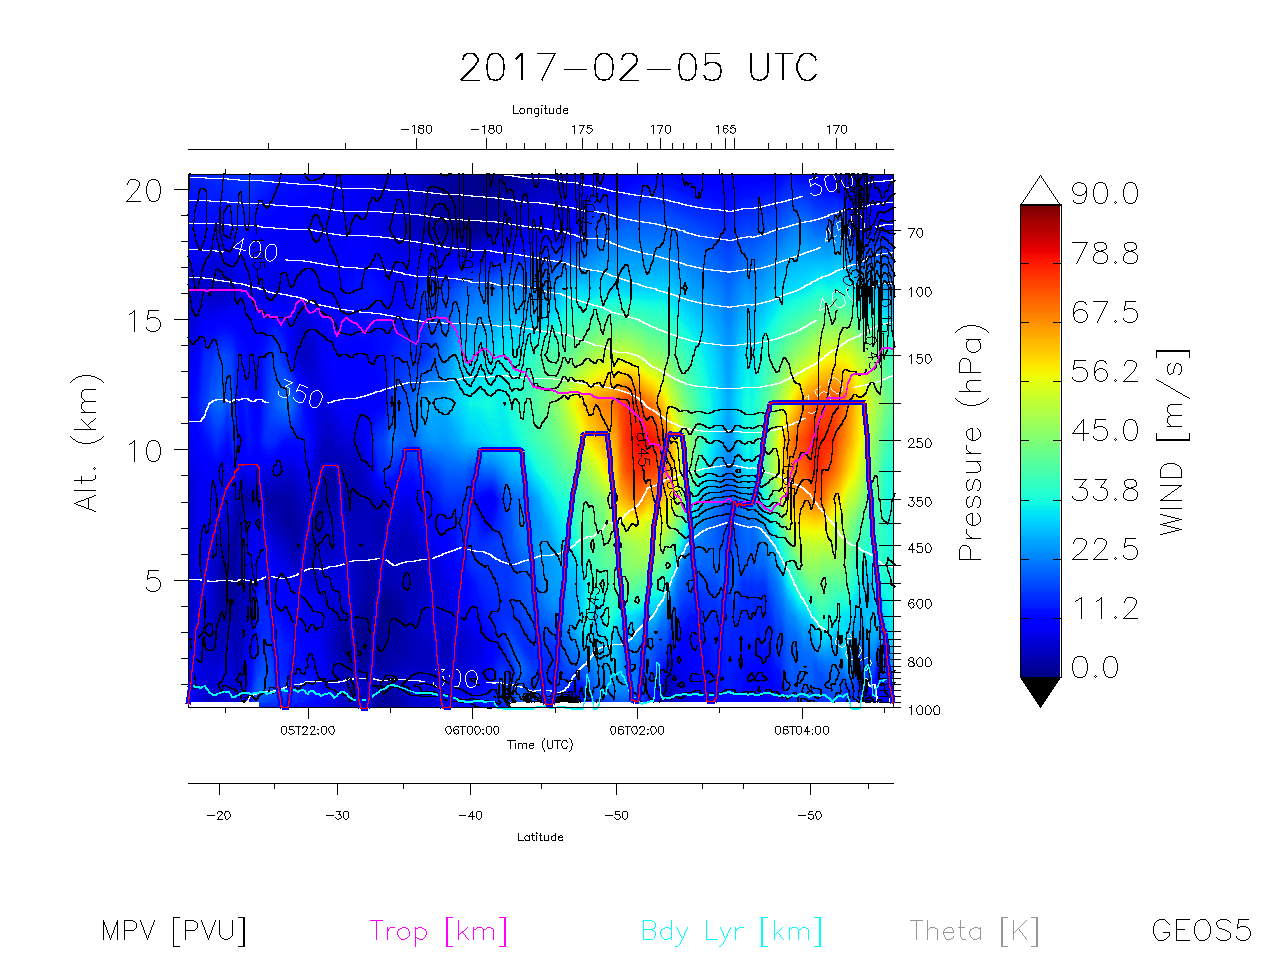
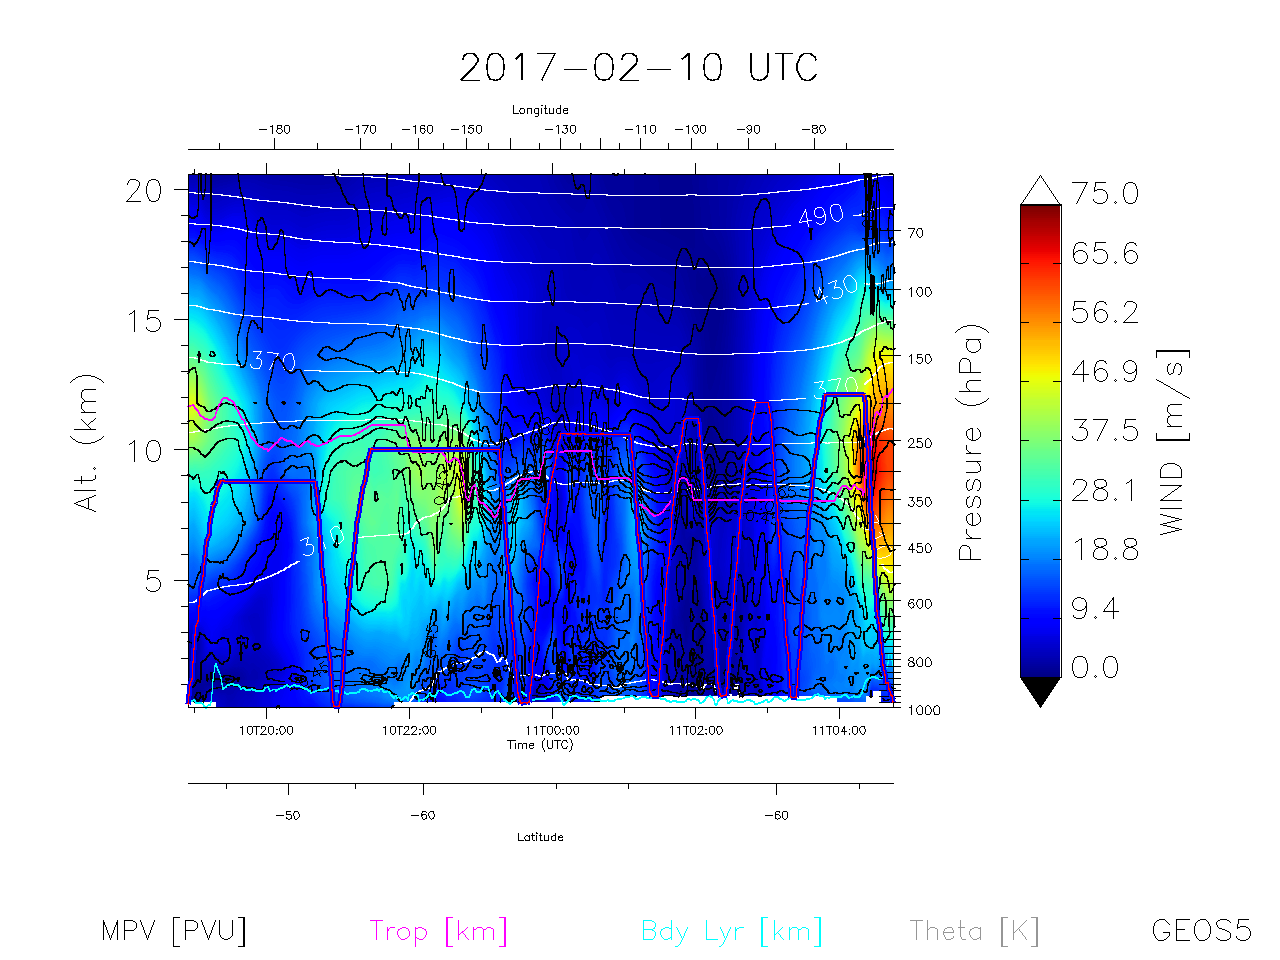
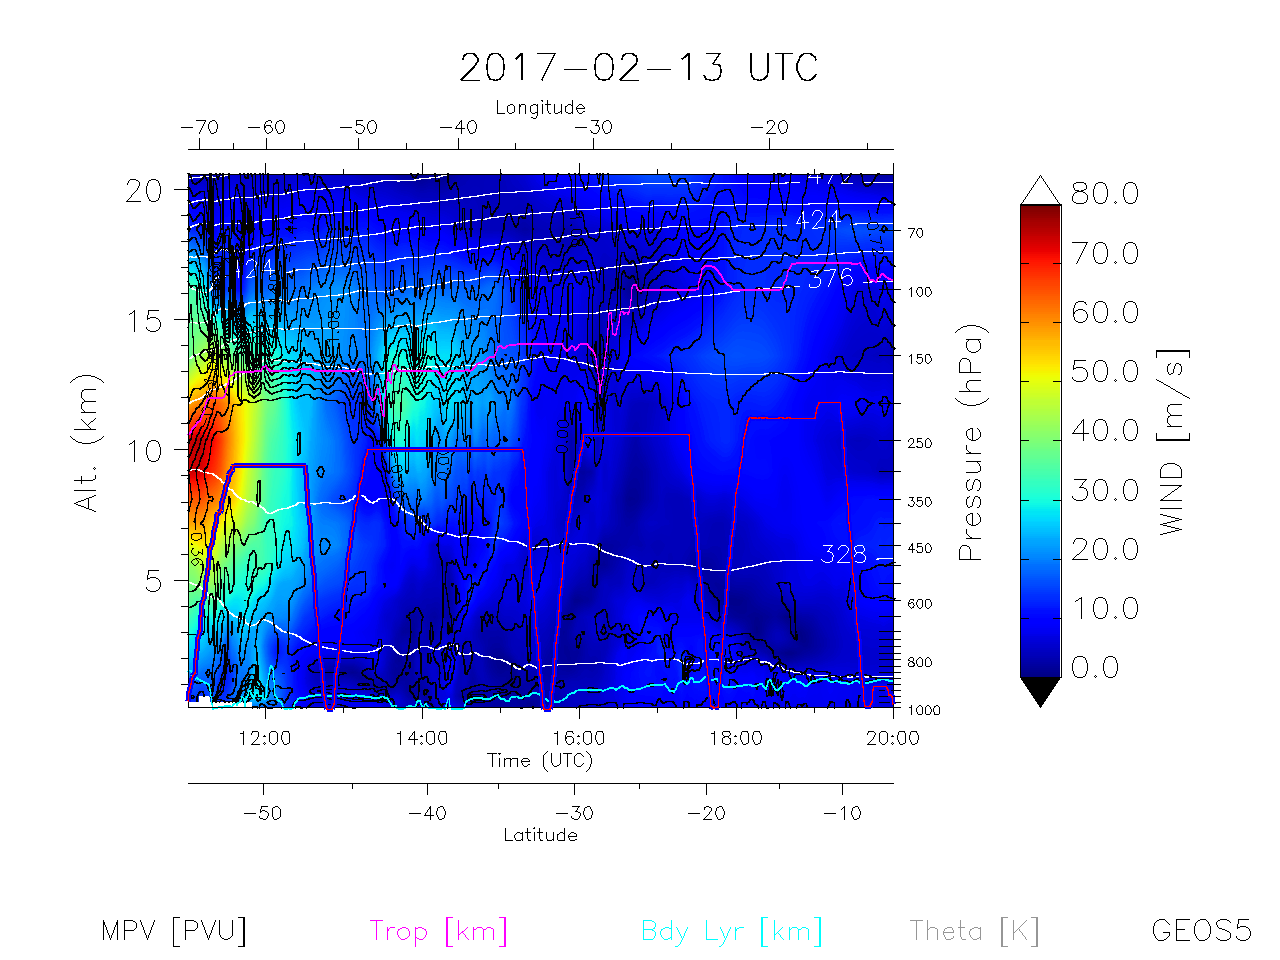
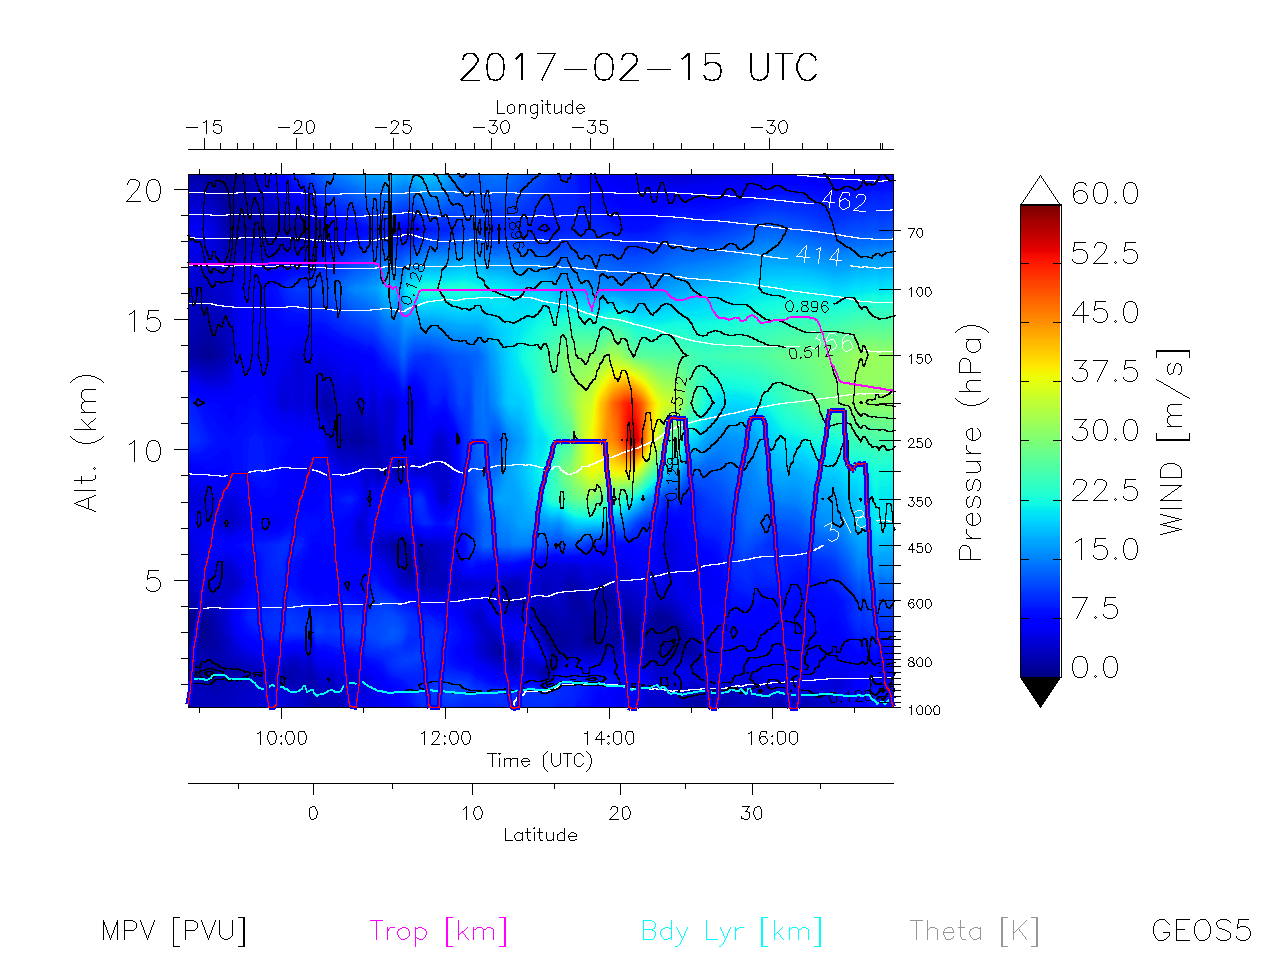
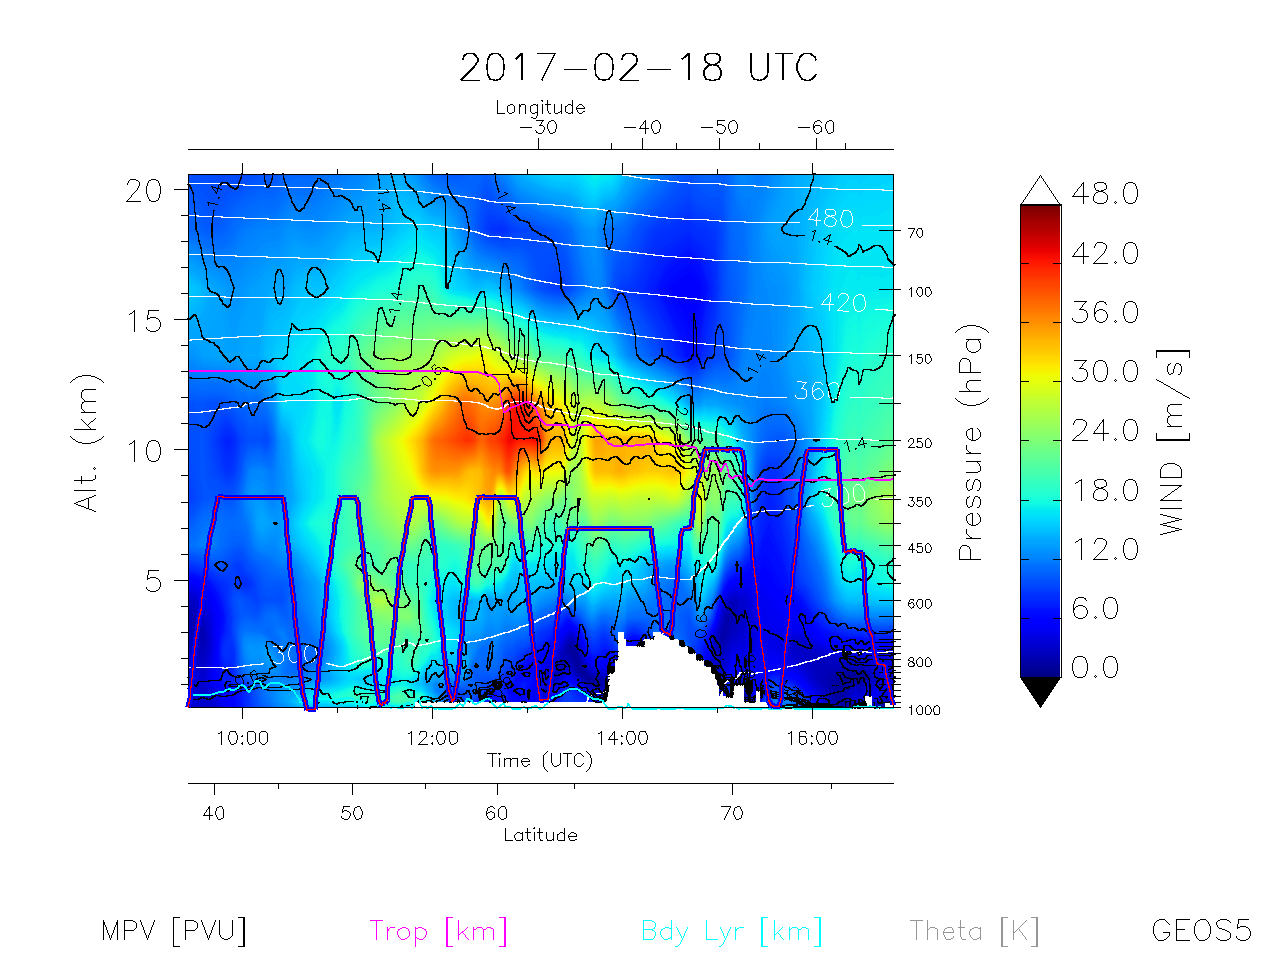
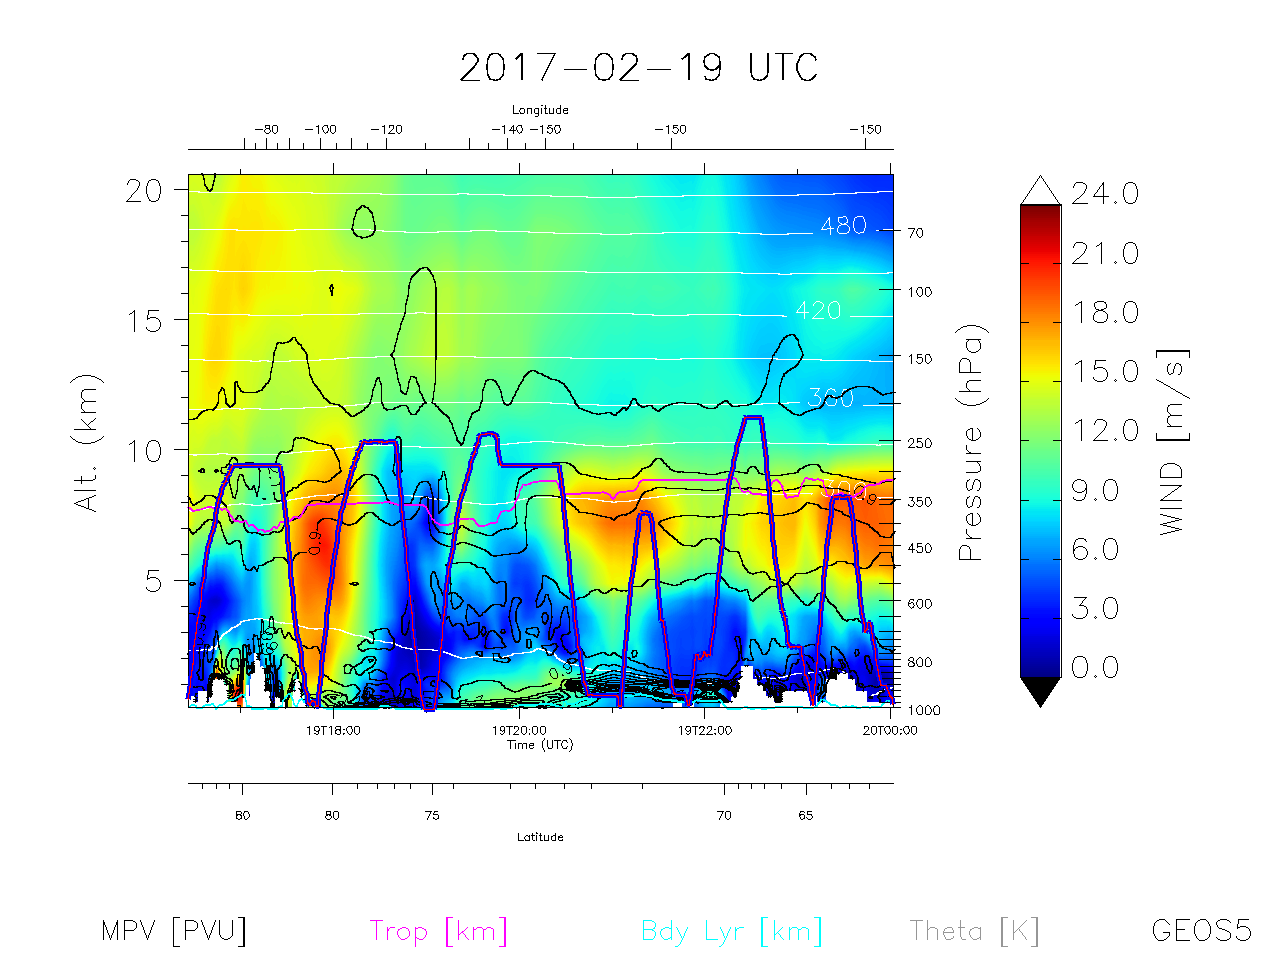
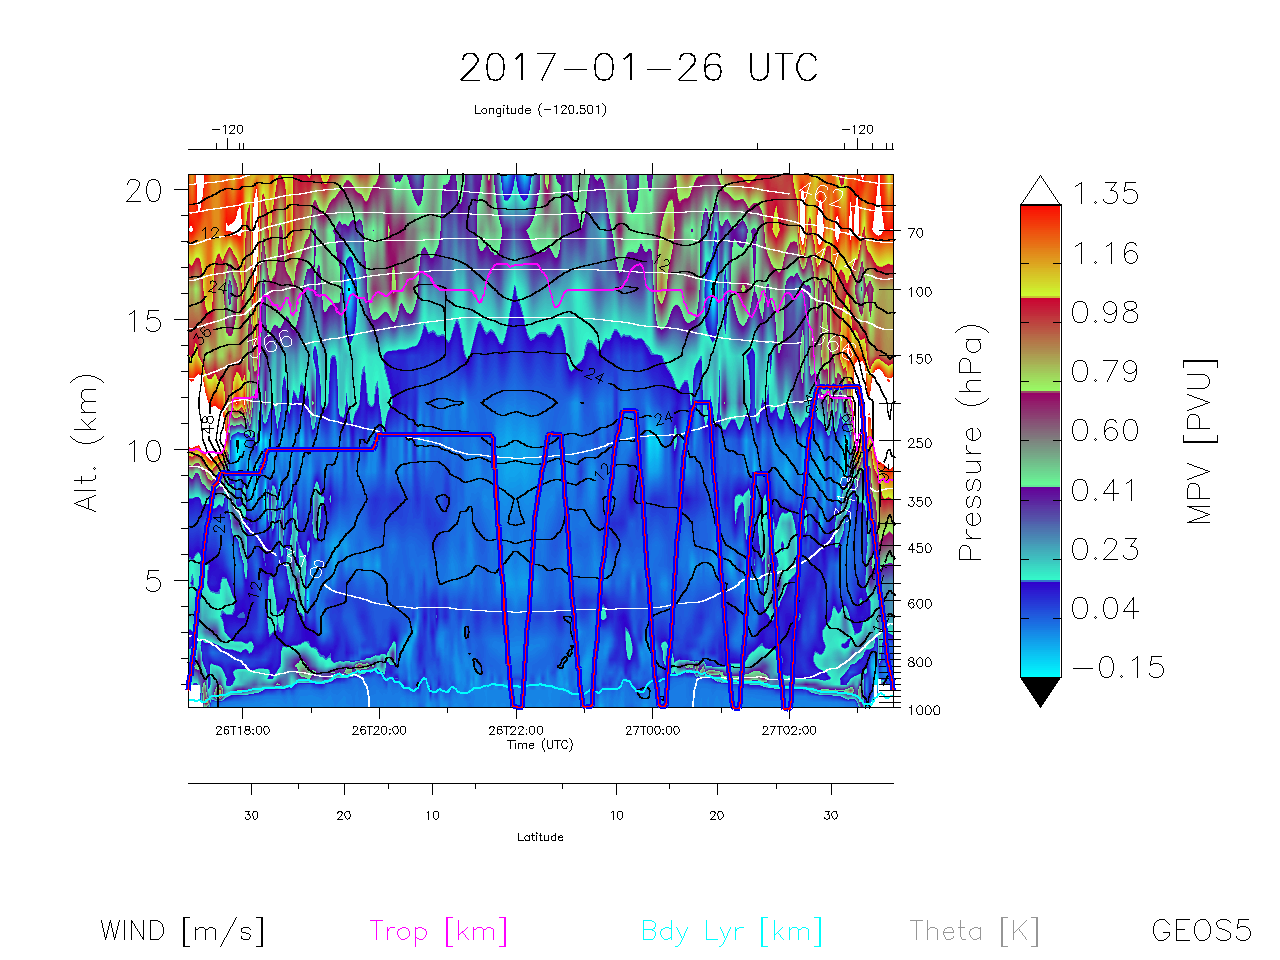
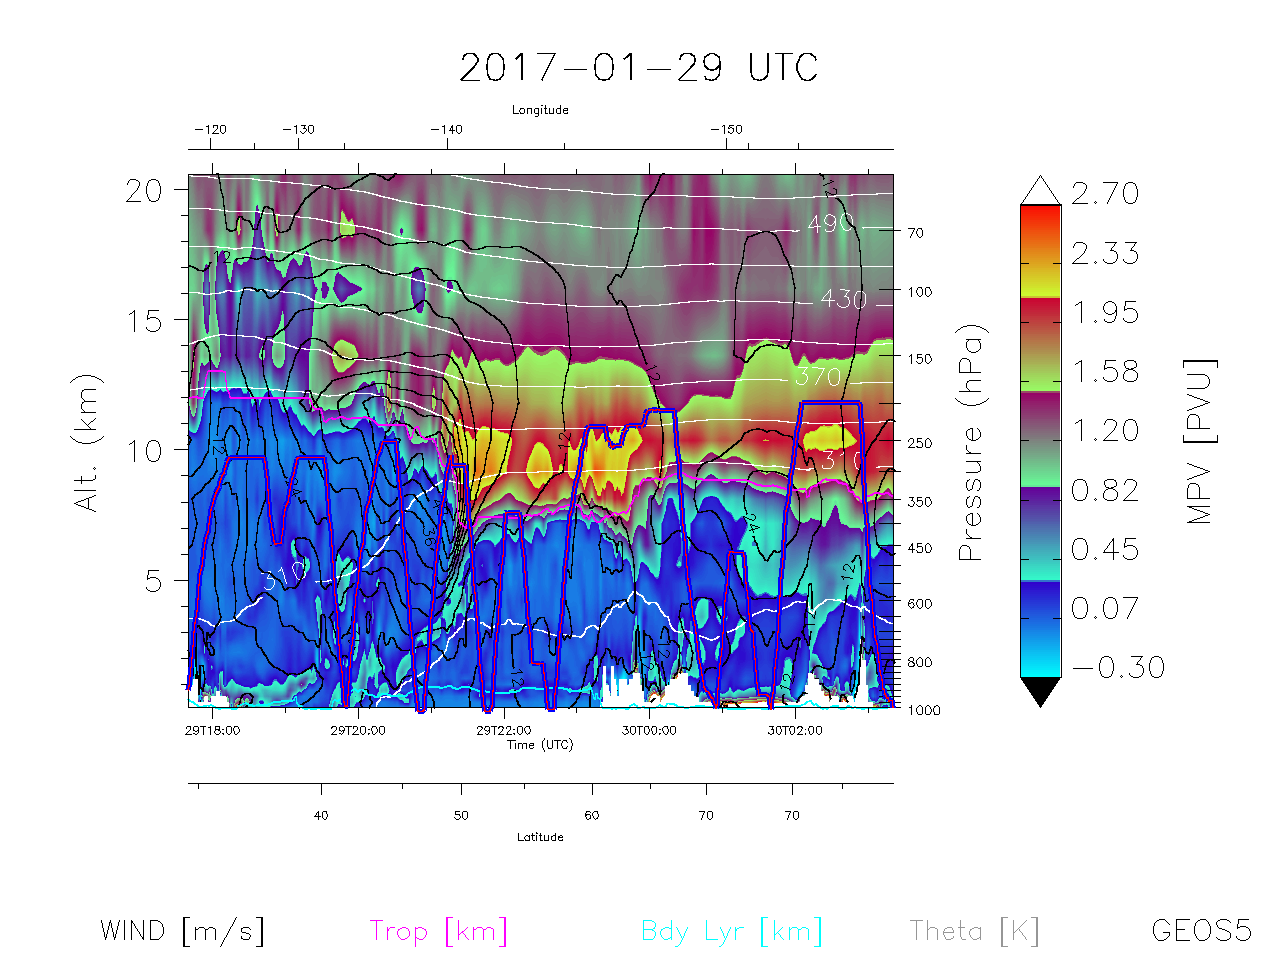
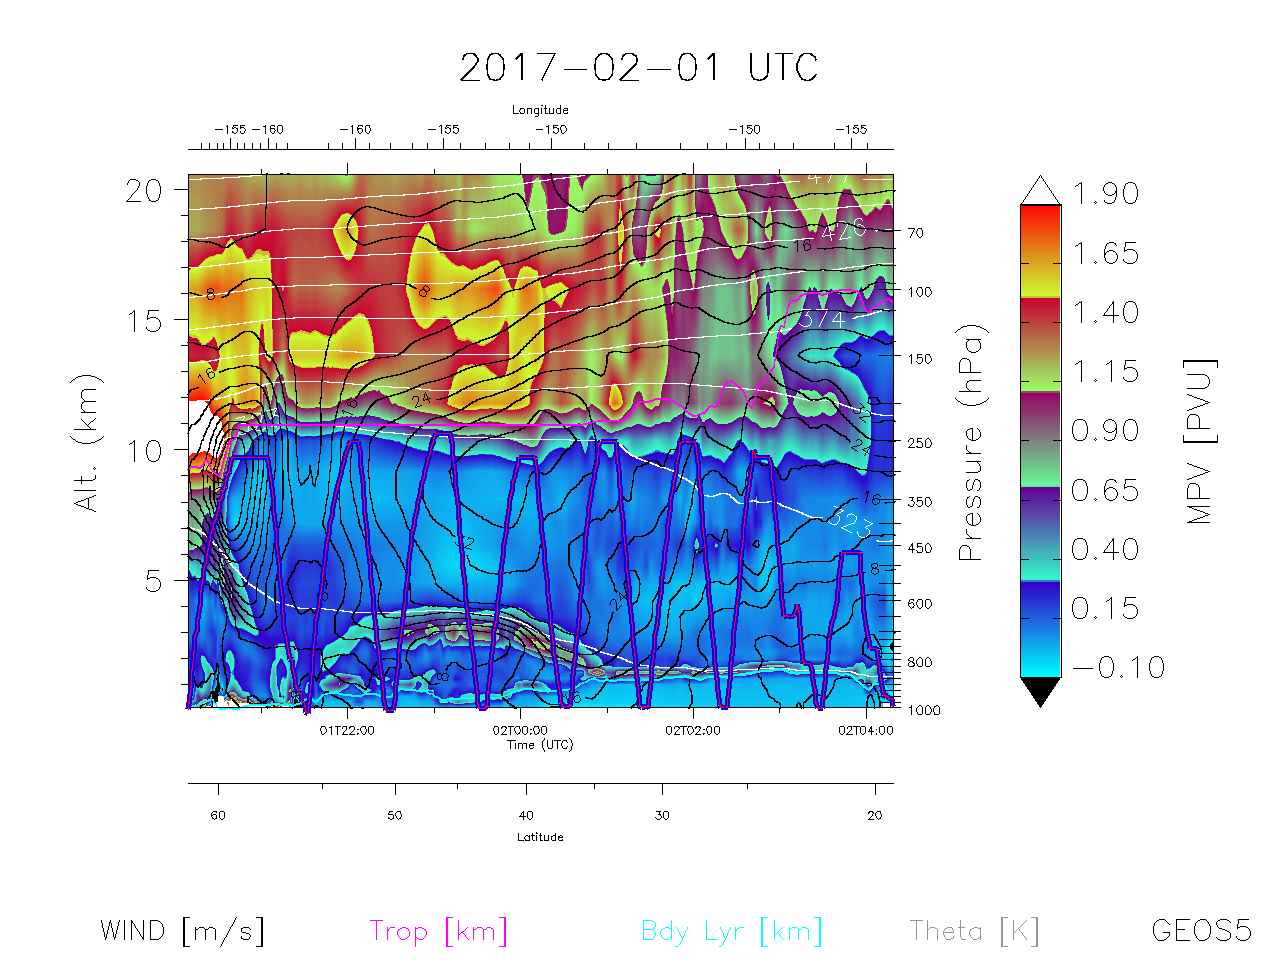
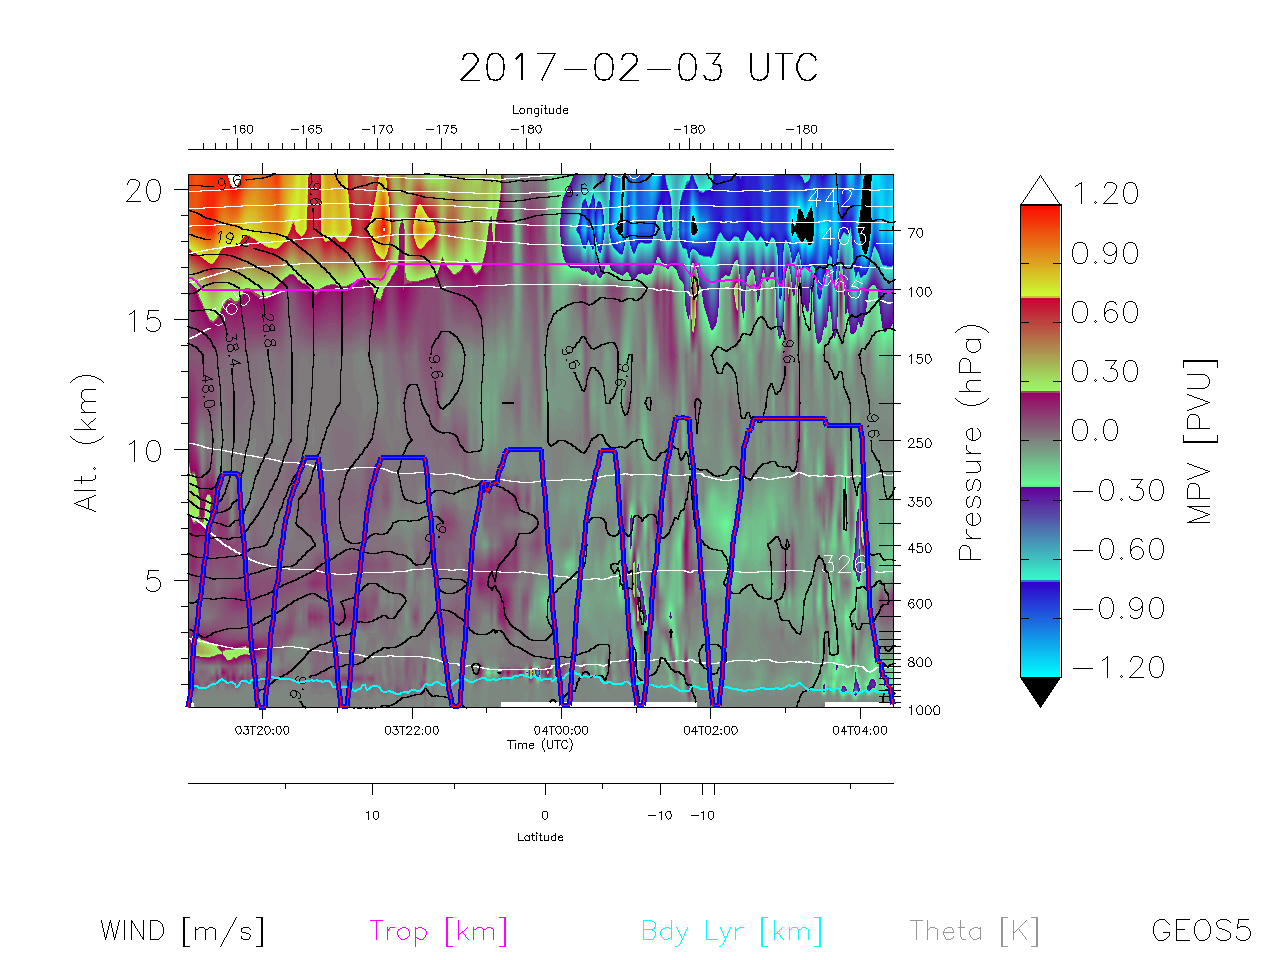
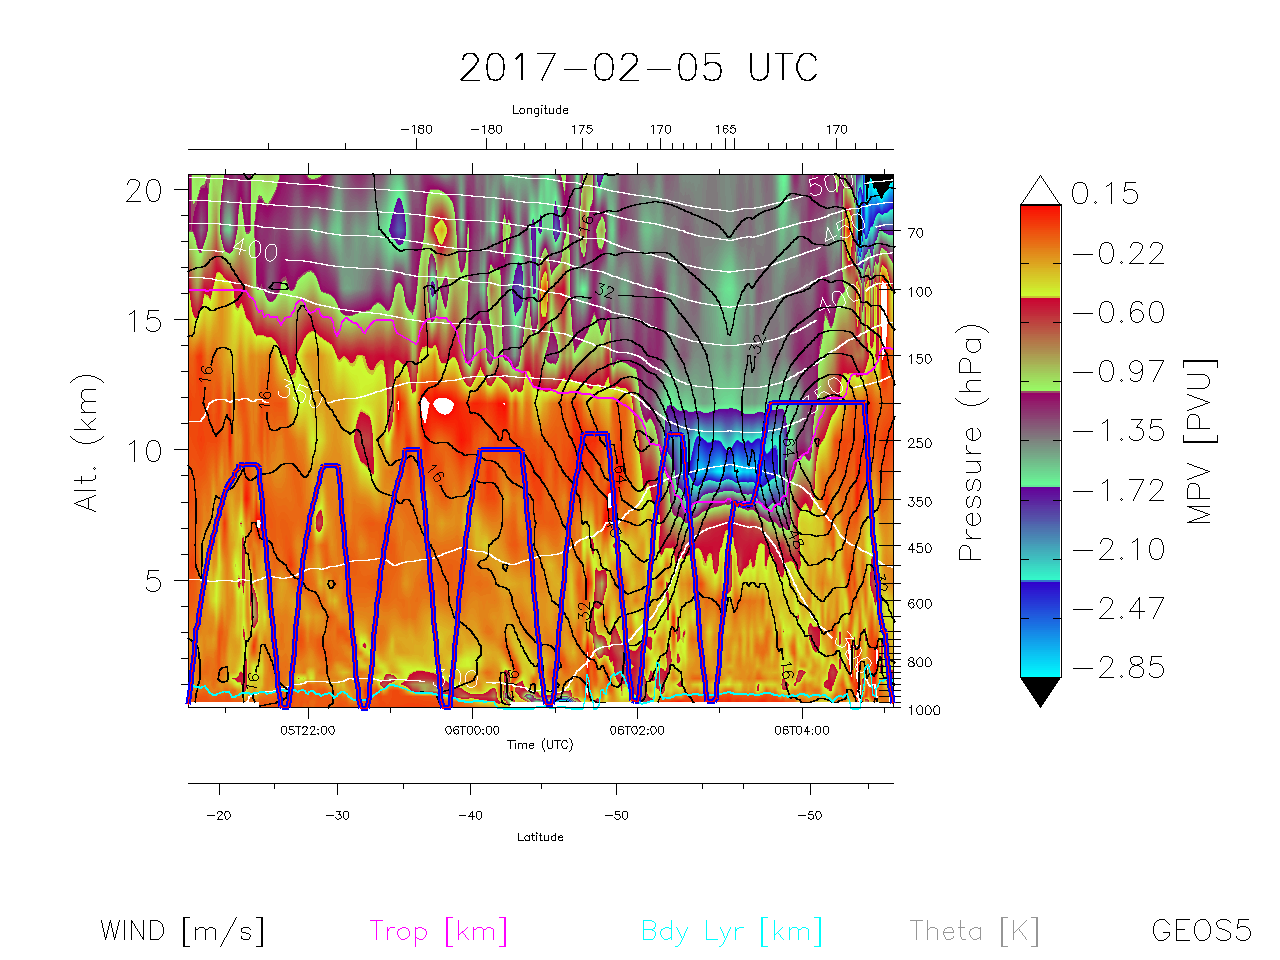
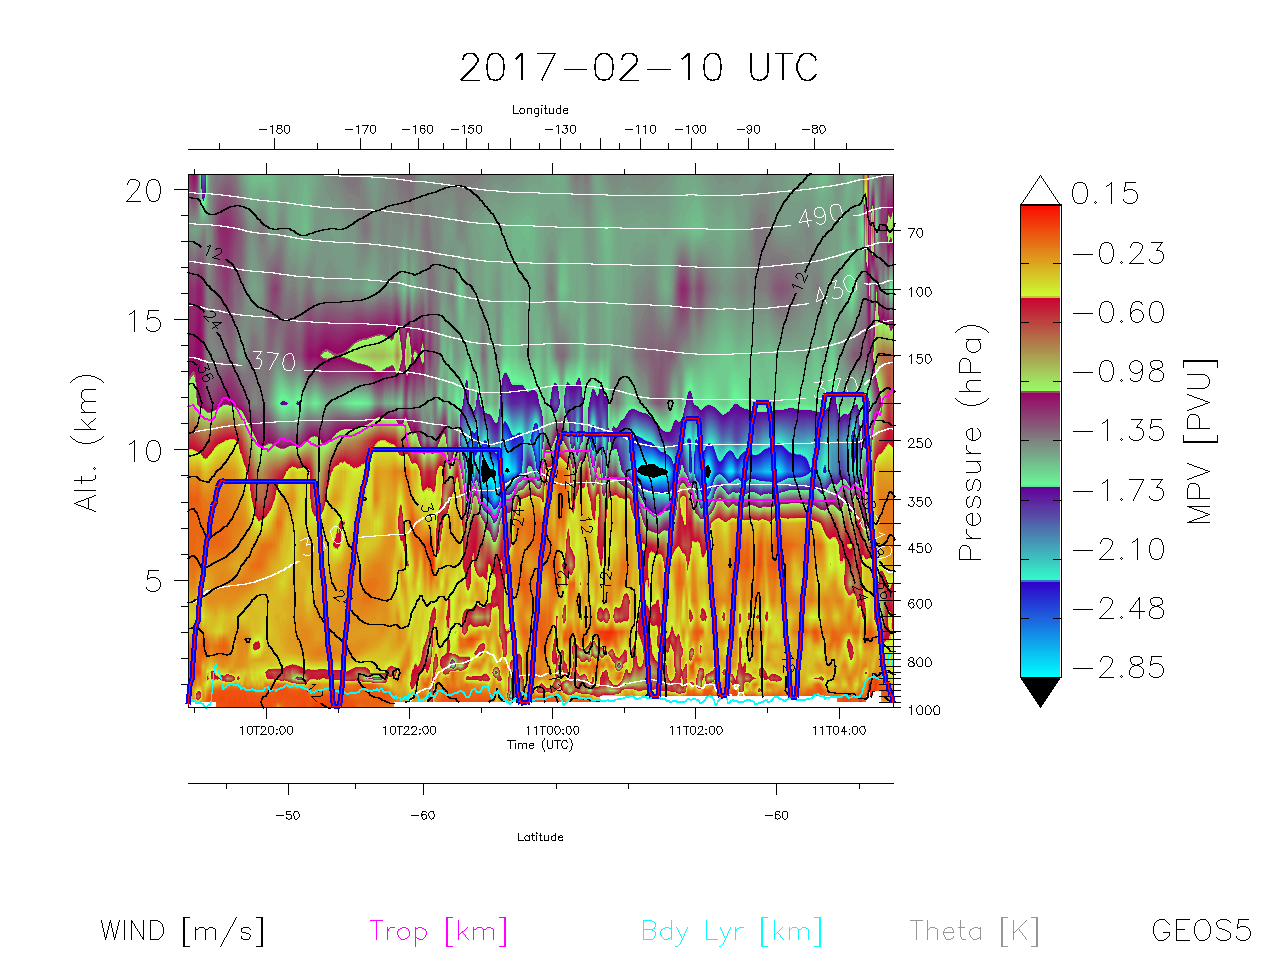
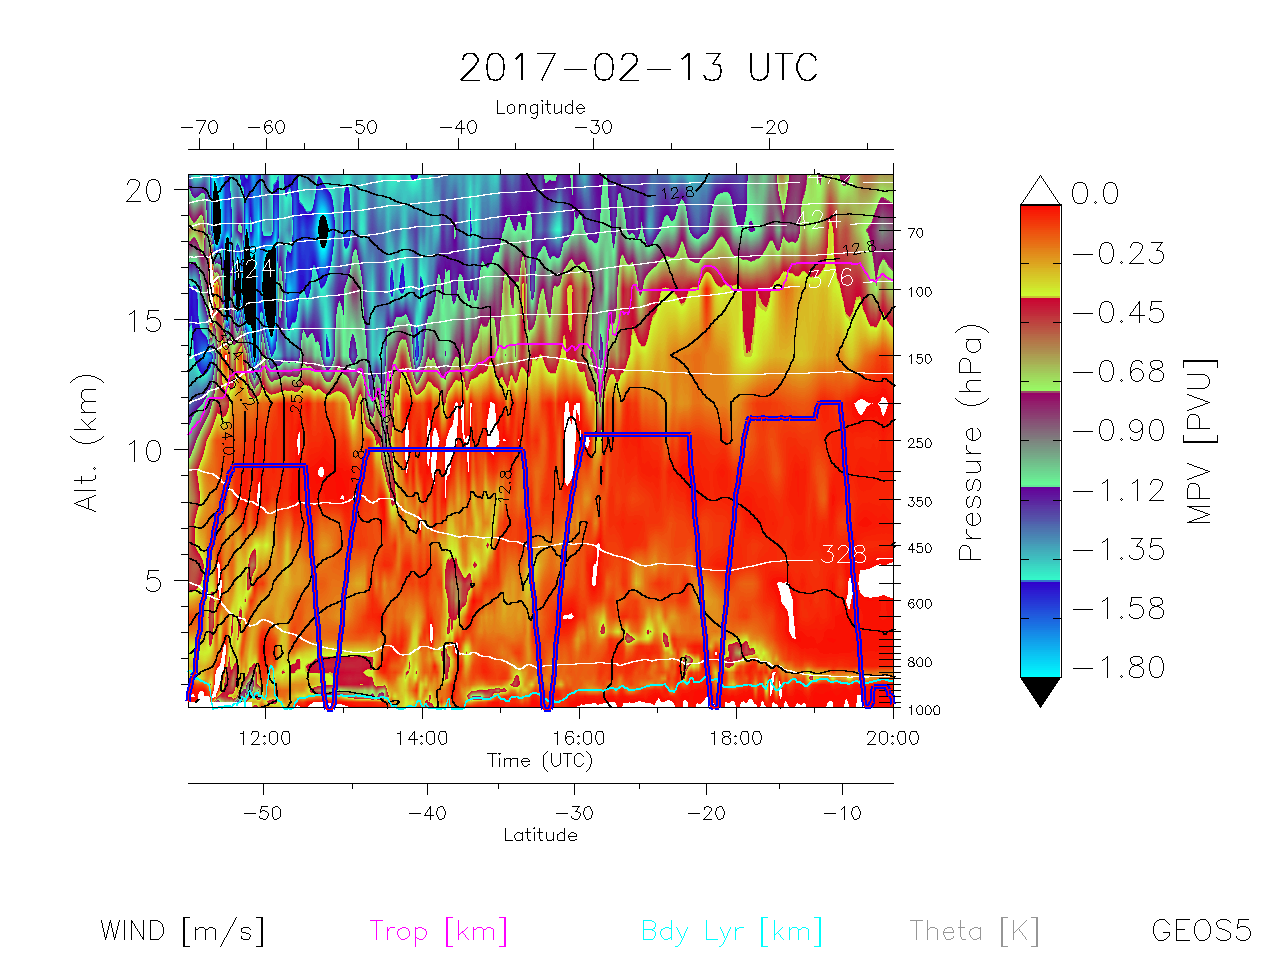
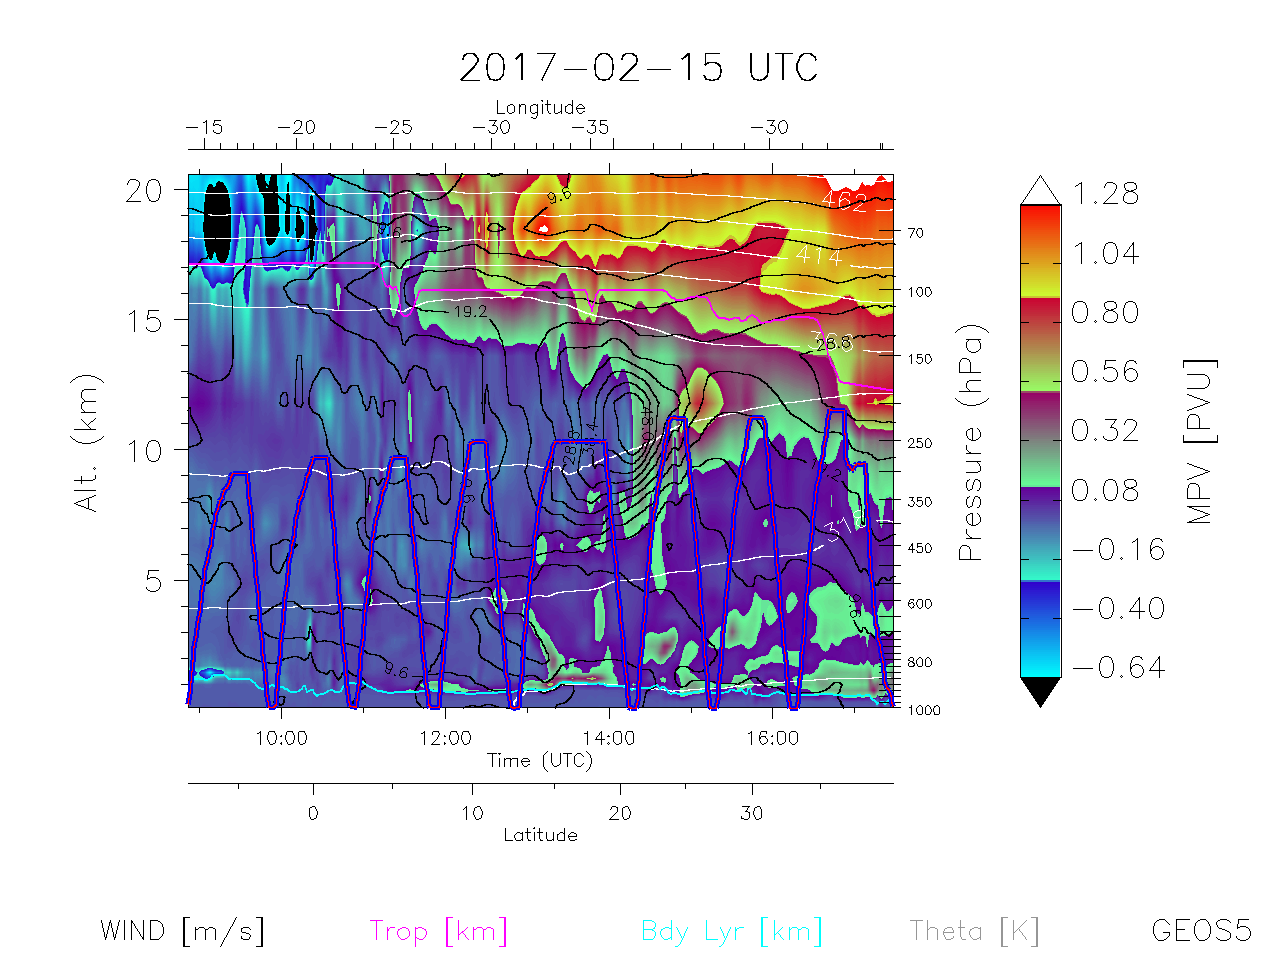
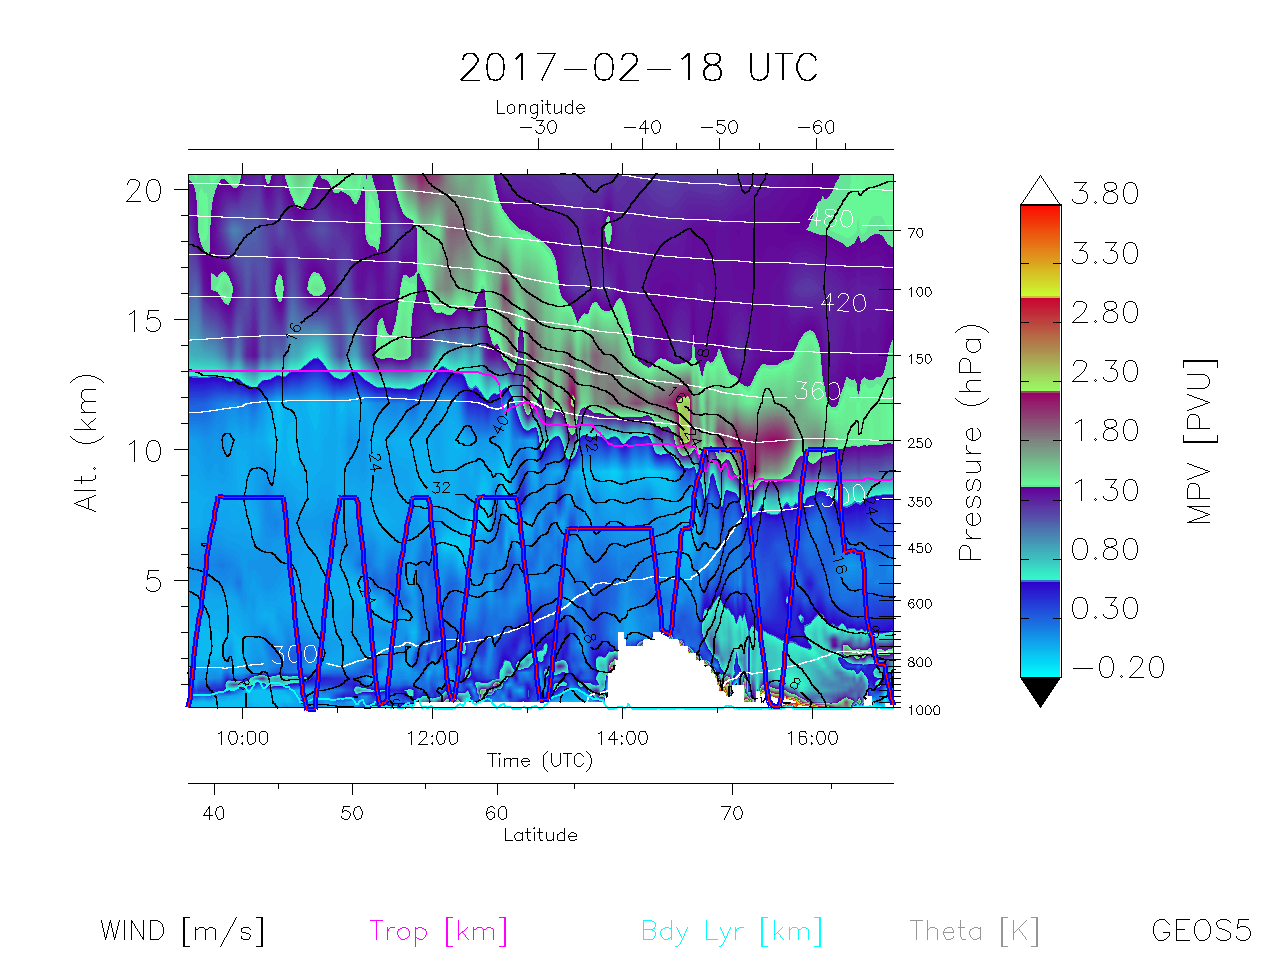
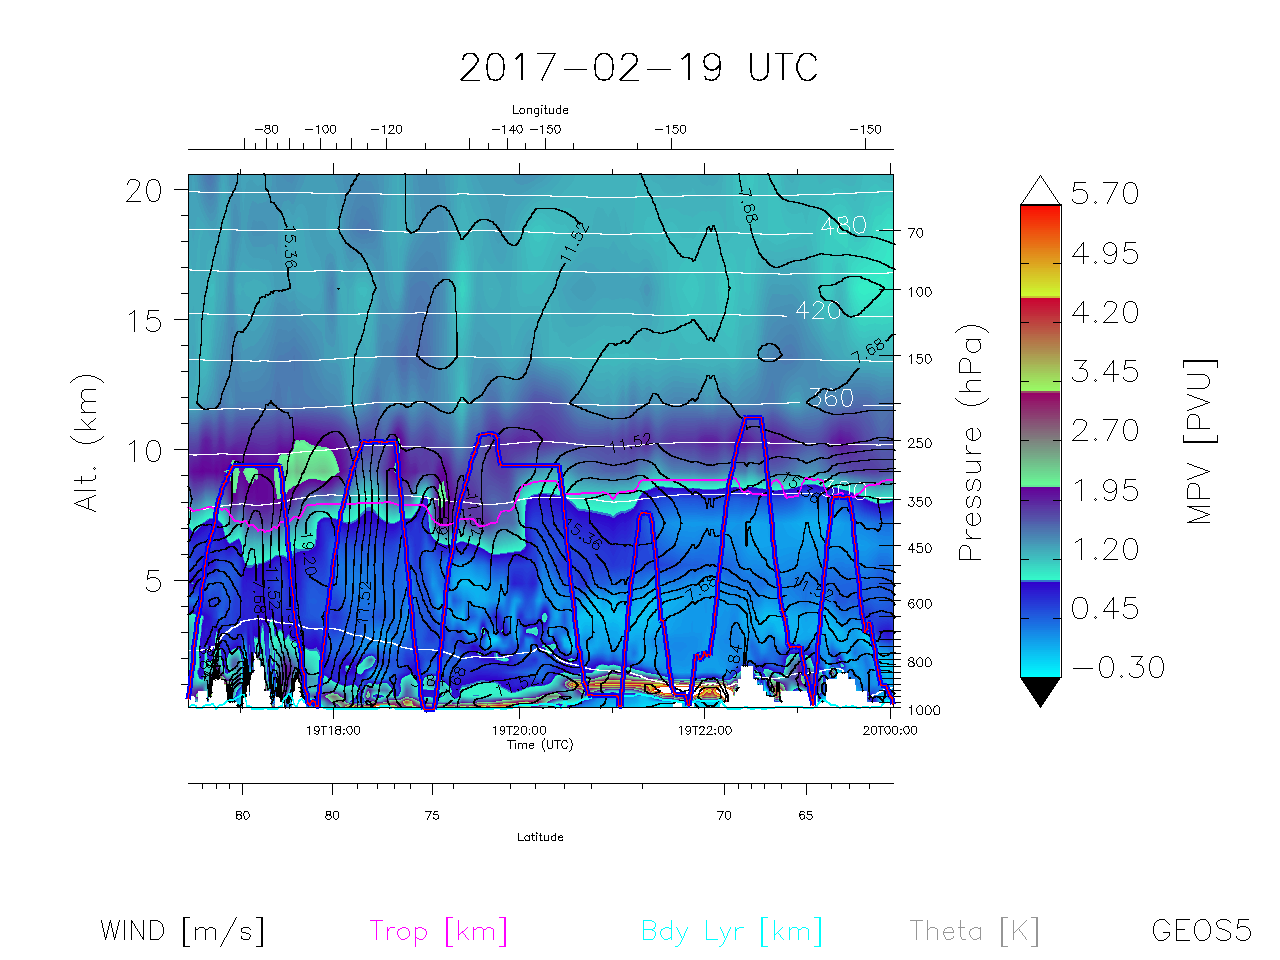
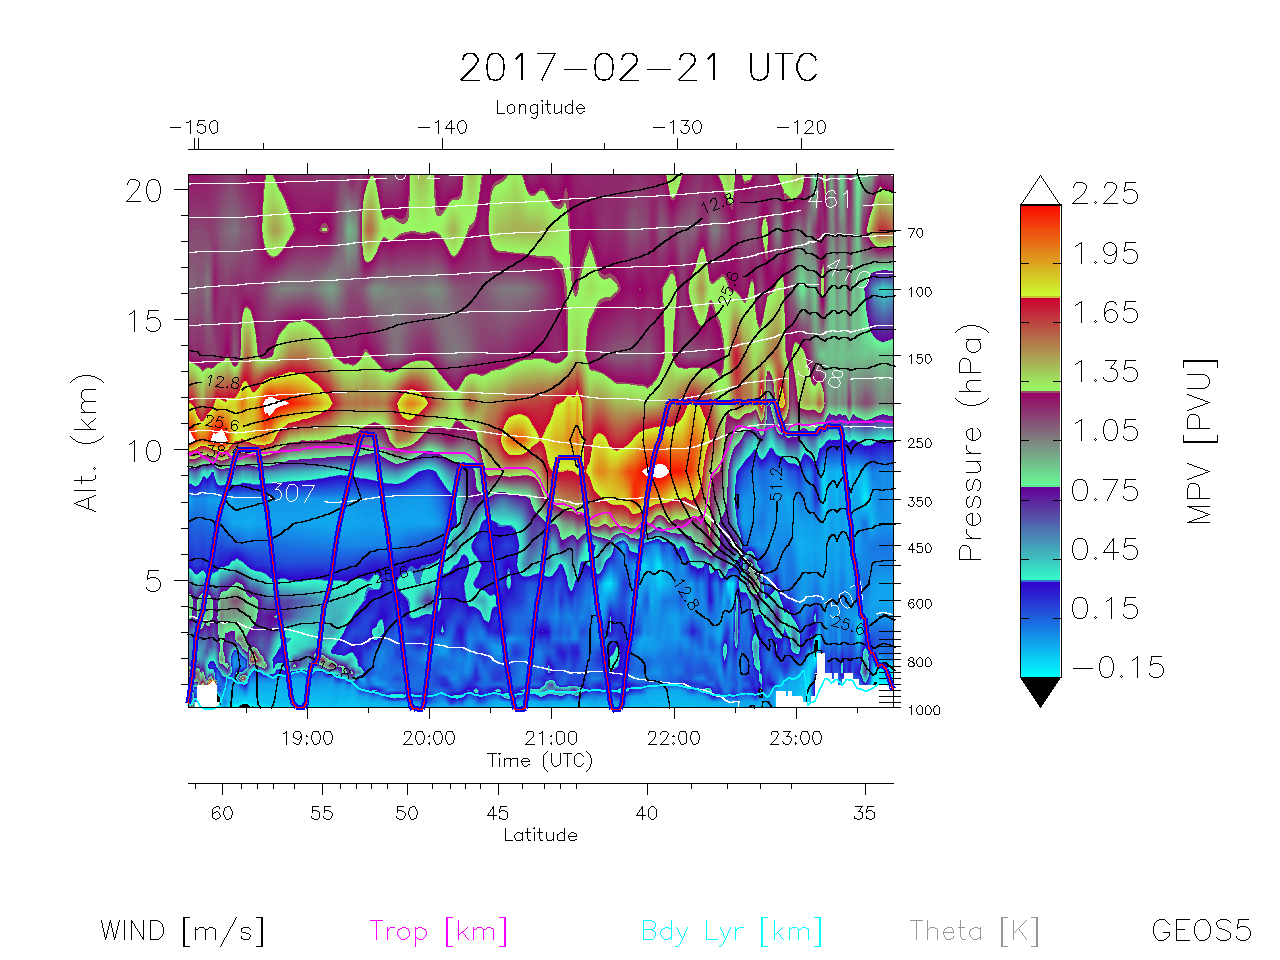
| Curtain of Wind Speeds, MPV | 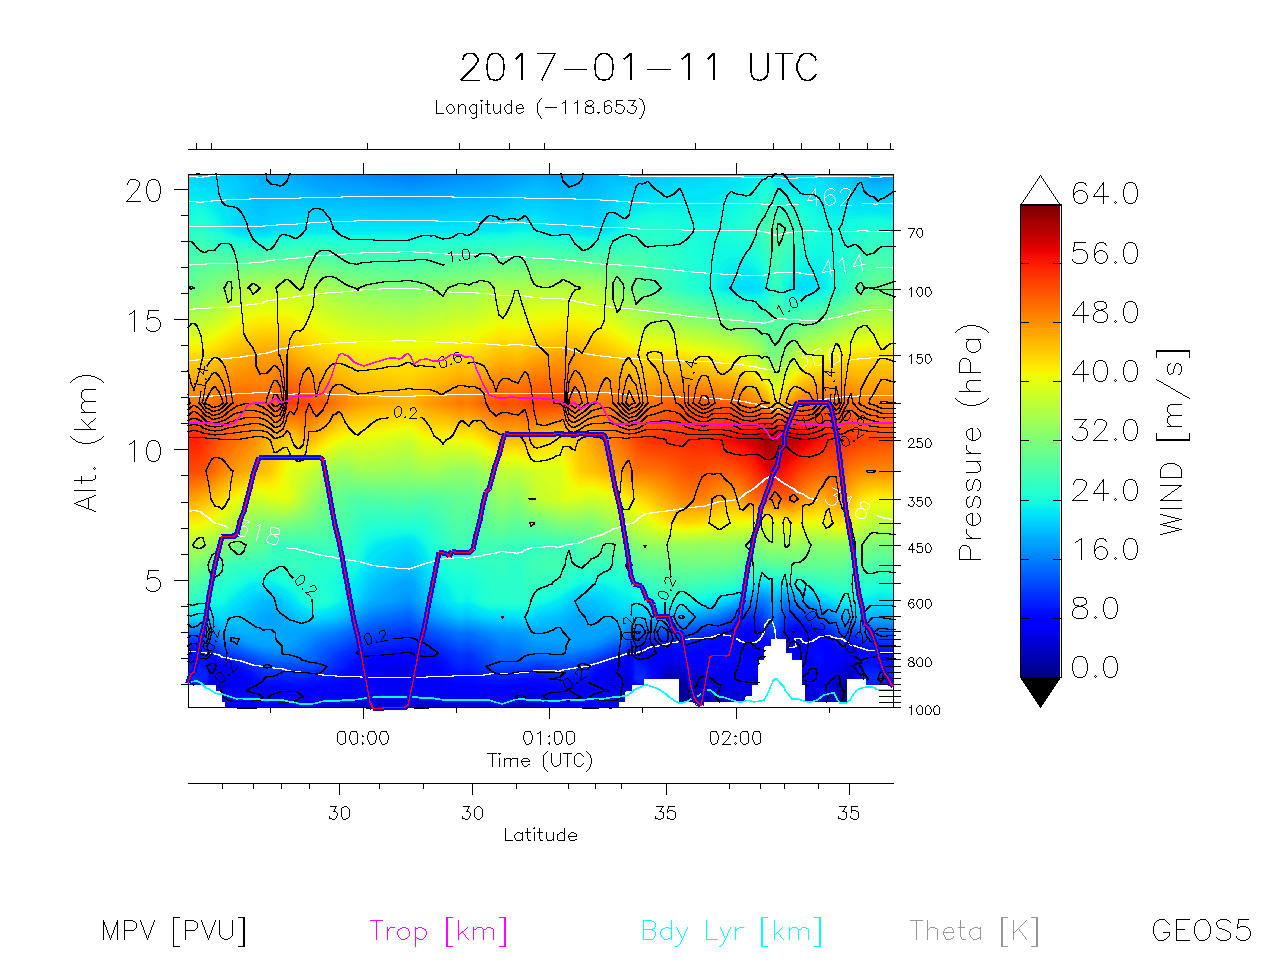 |
 |
 |
 |
 |
 |
 |
 |
 |
 |
 |
 |
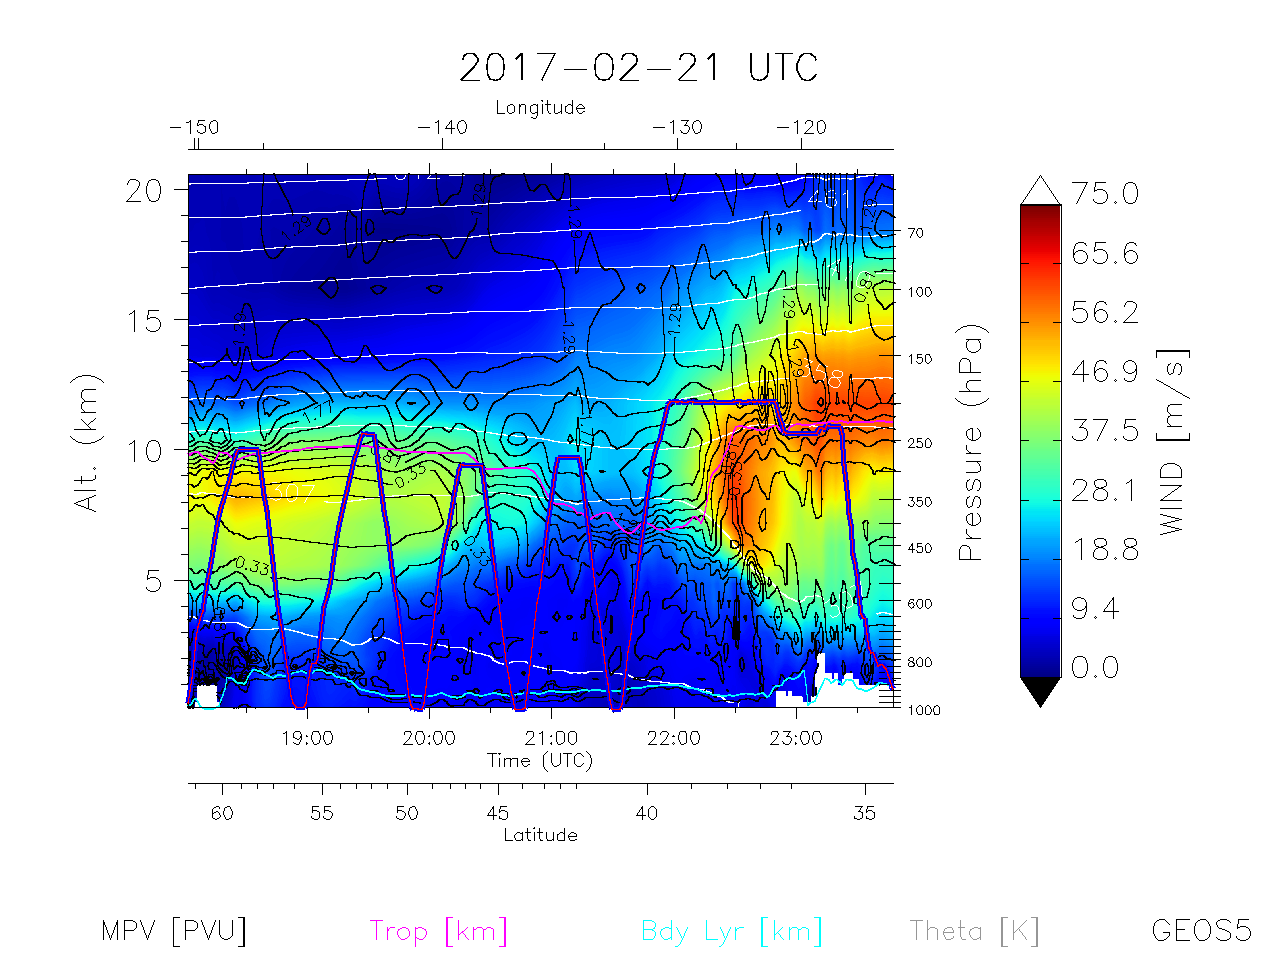 |
Curtain of Wind Speeds, MPV |
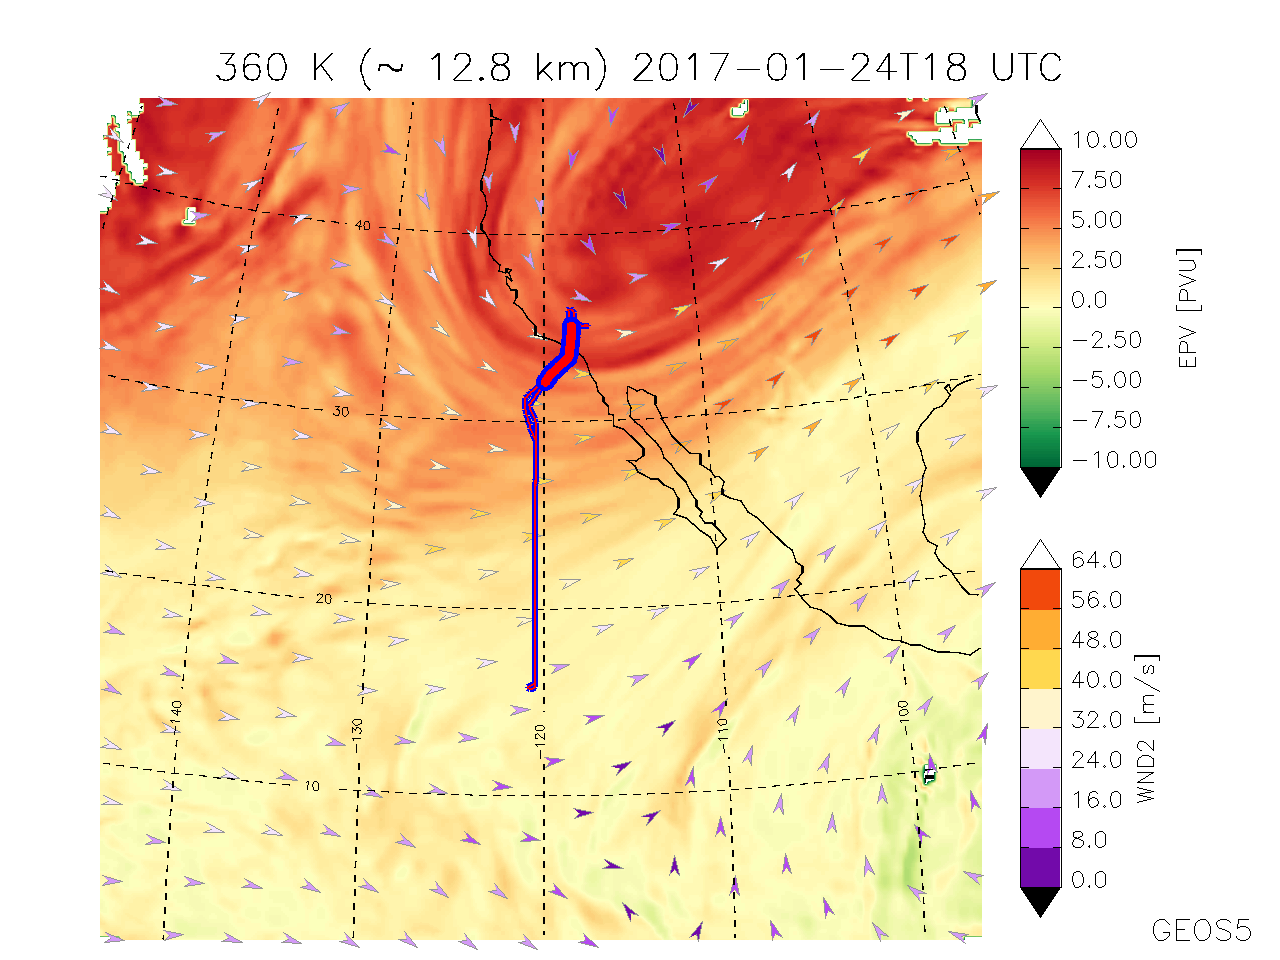
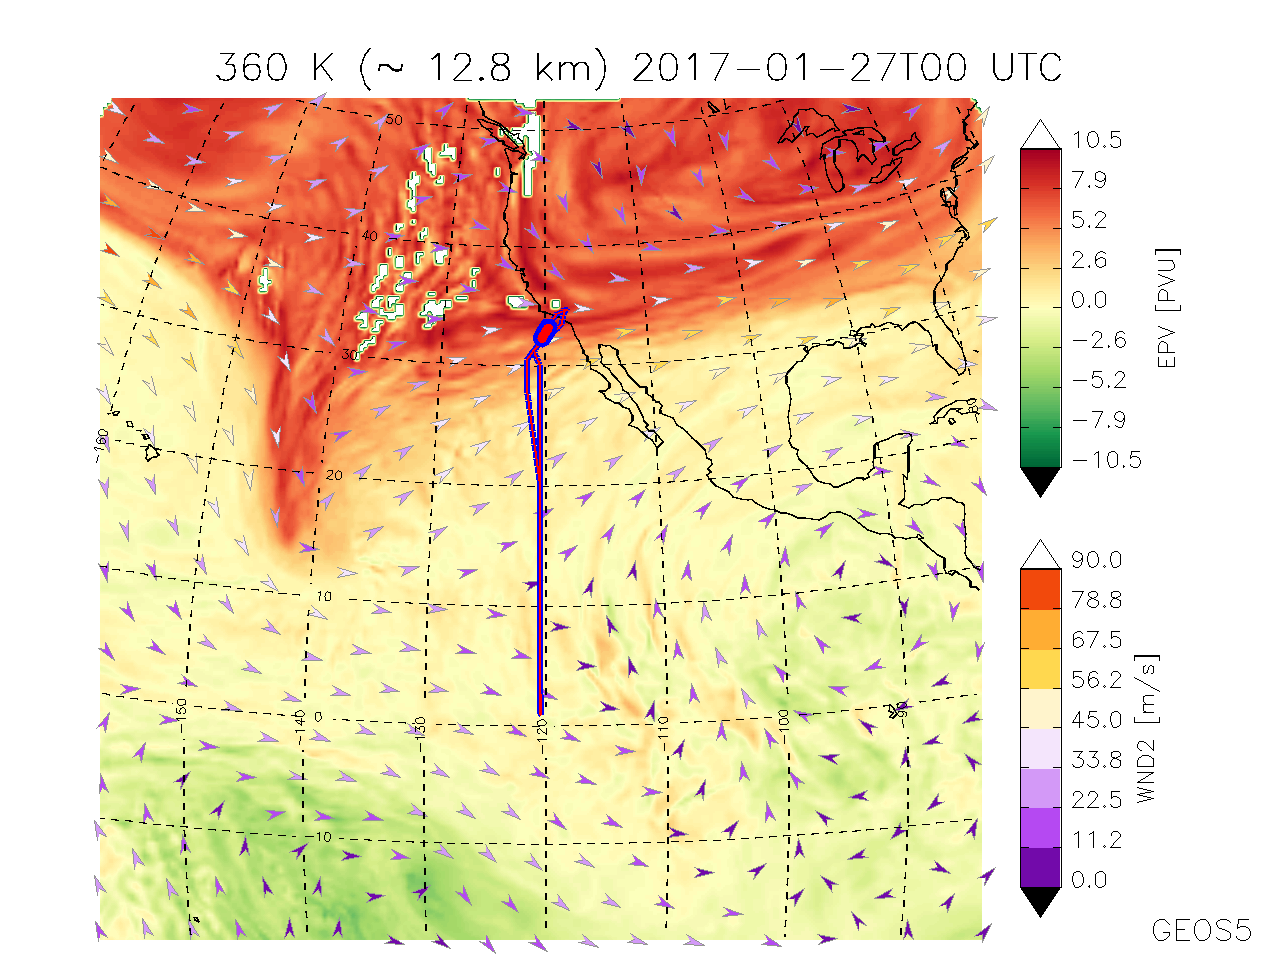
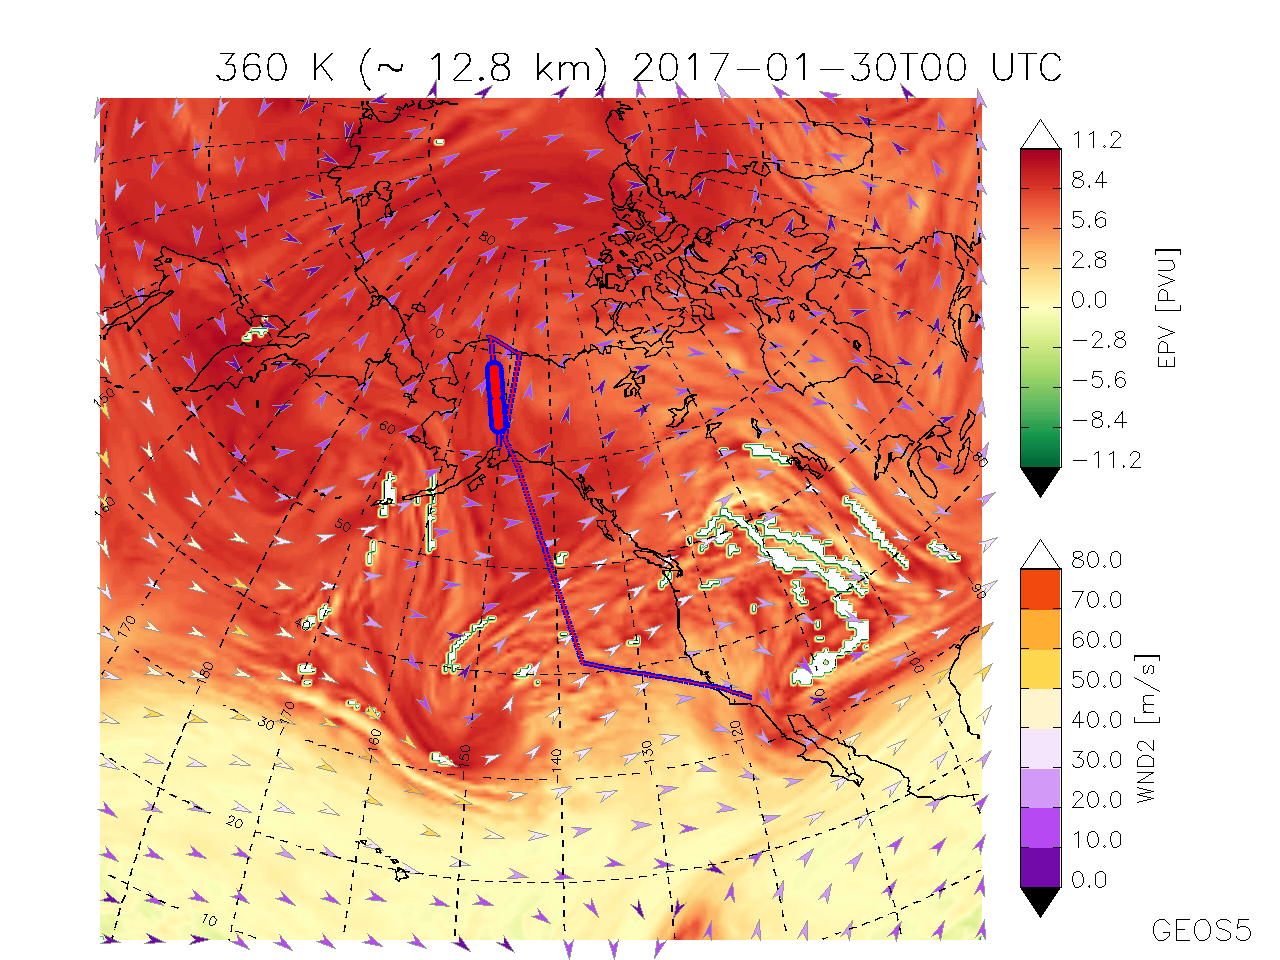
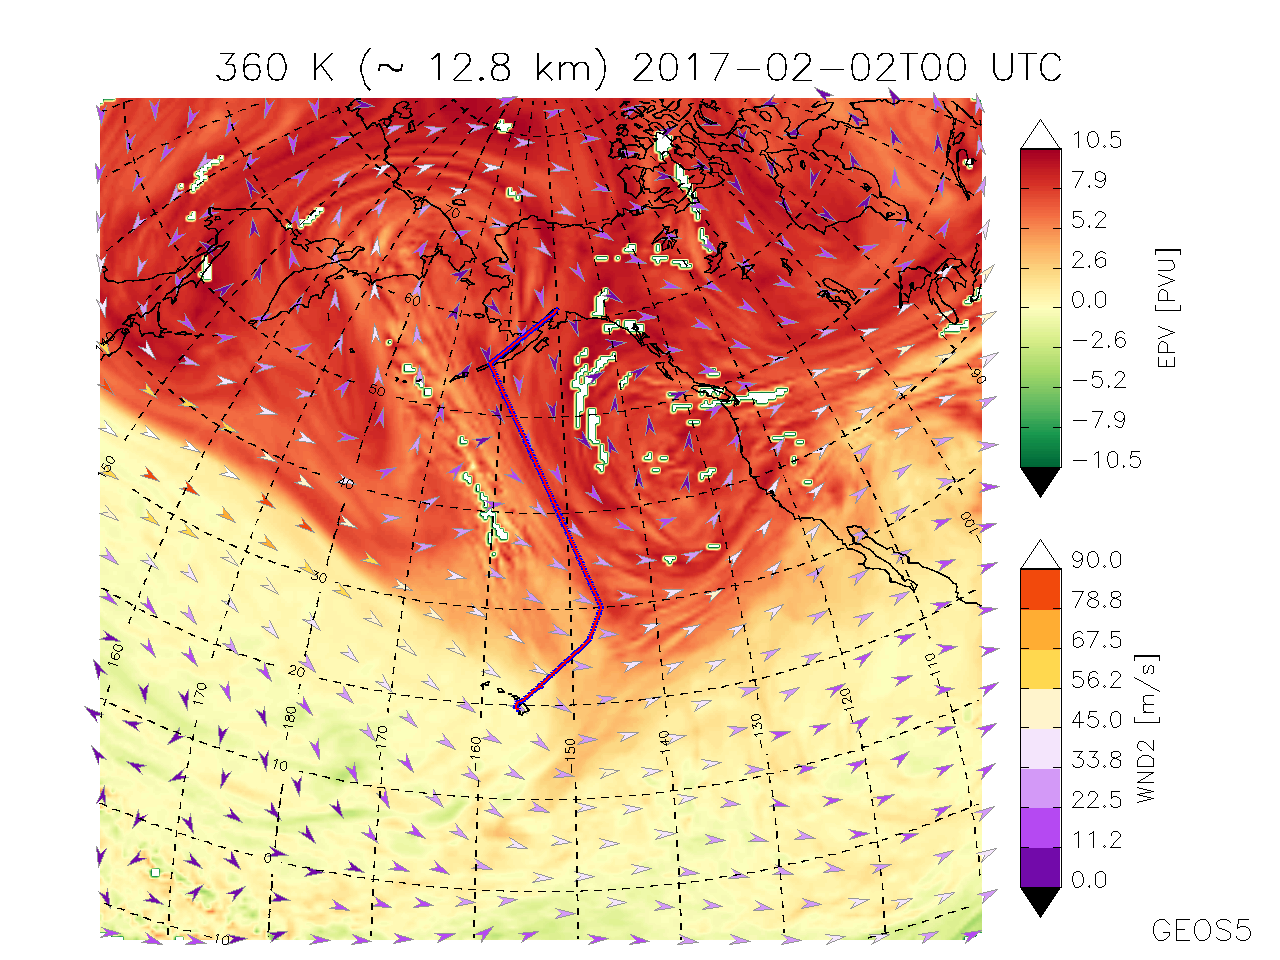
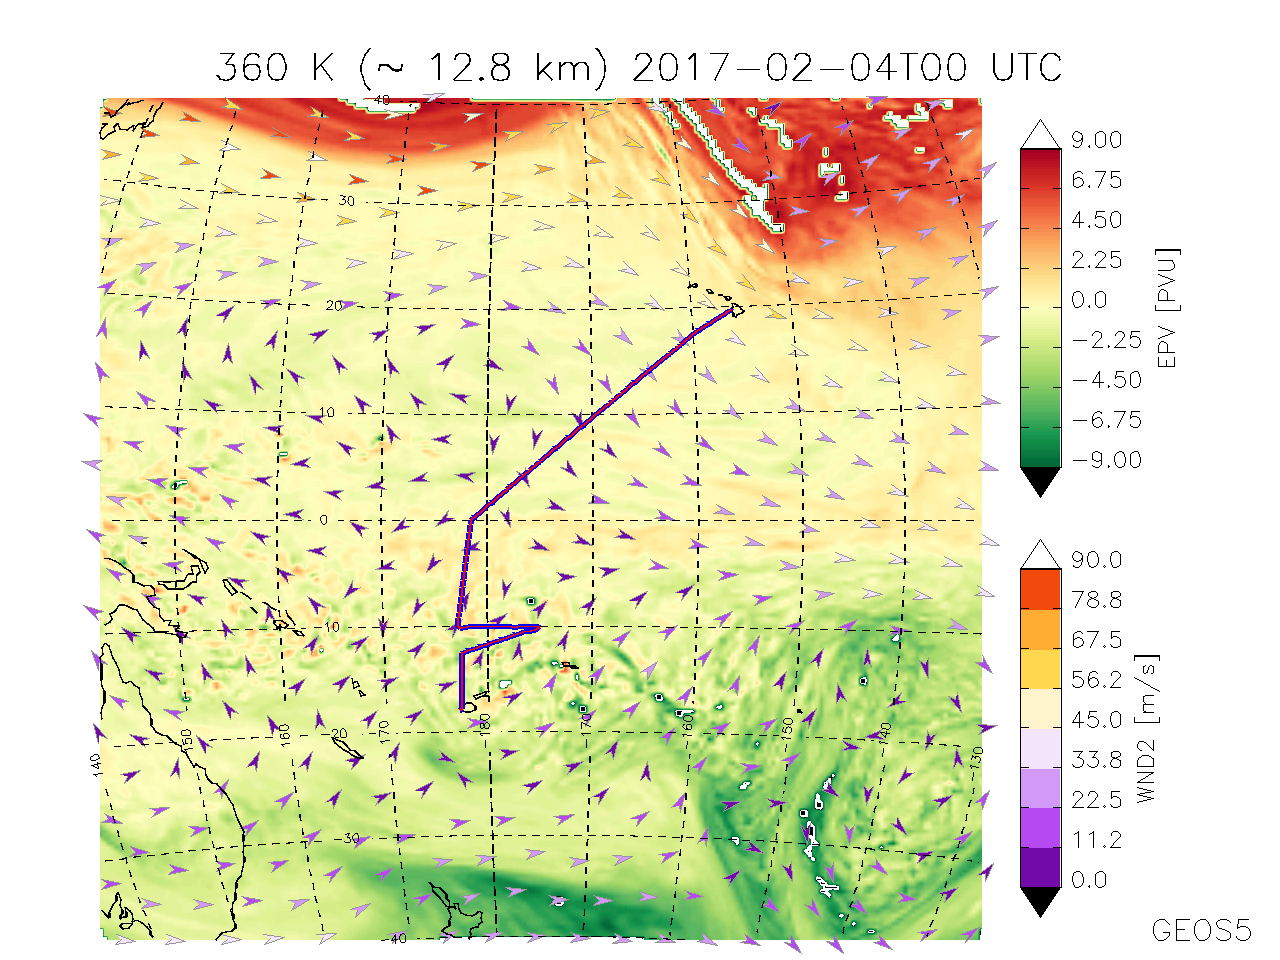
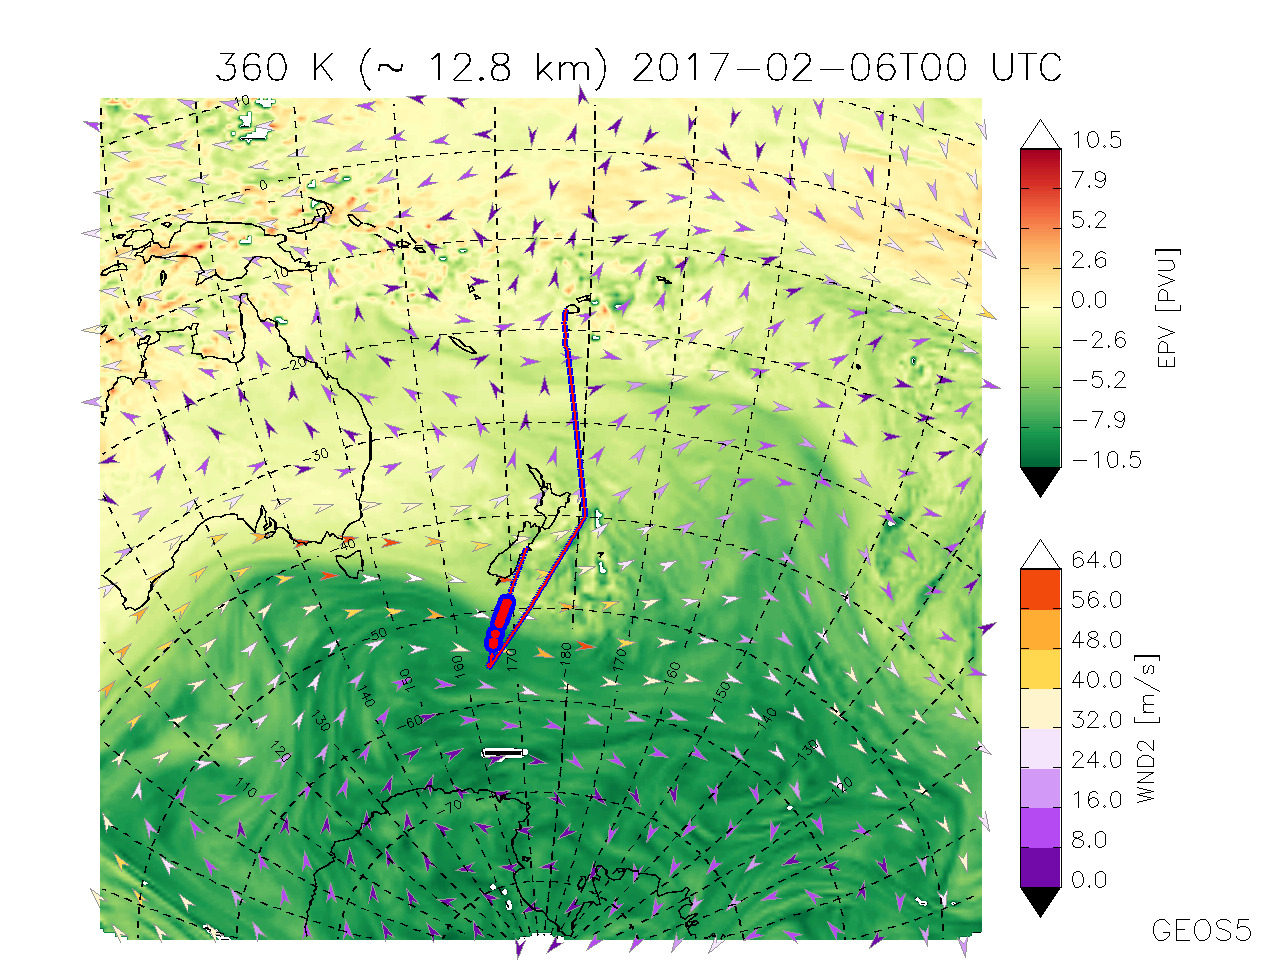
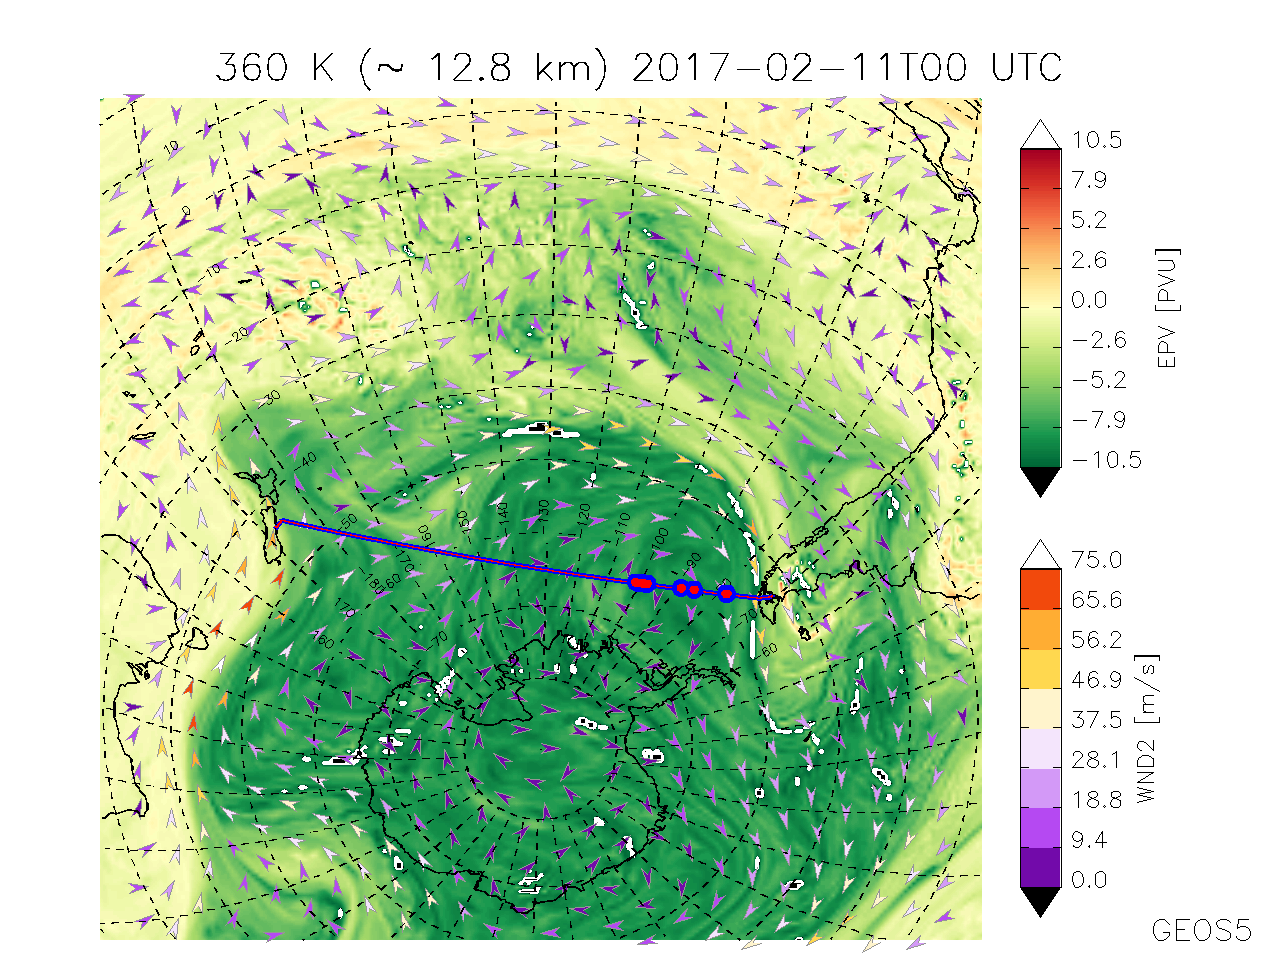
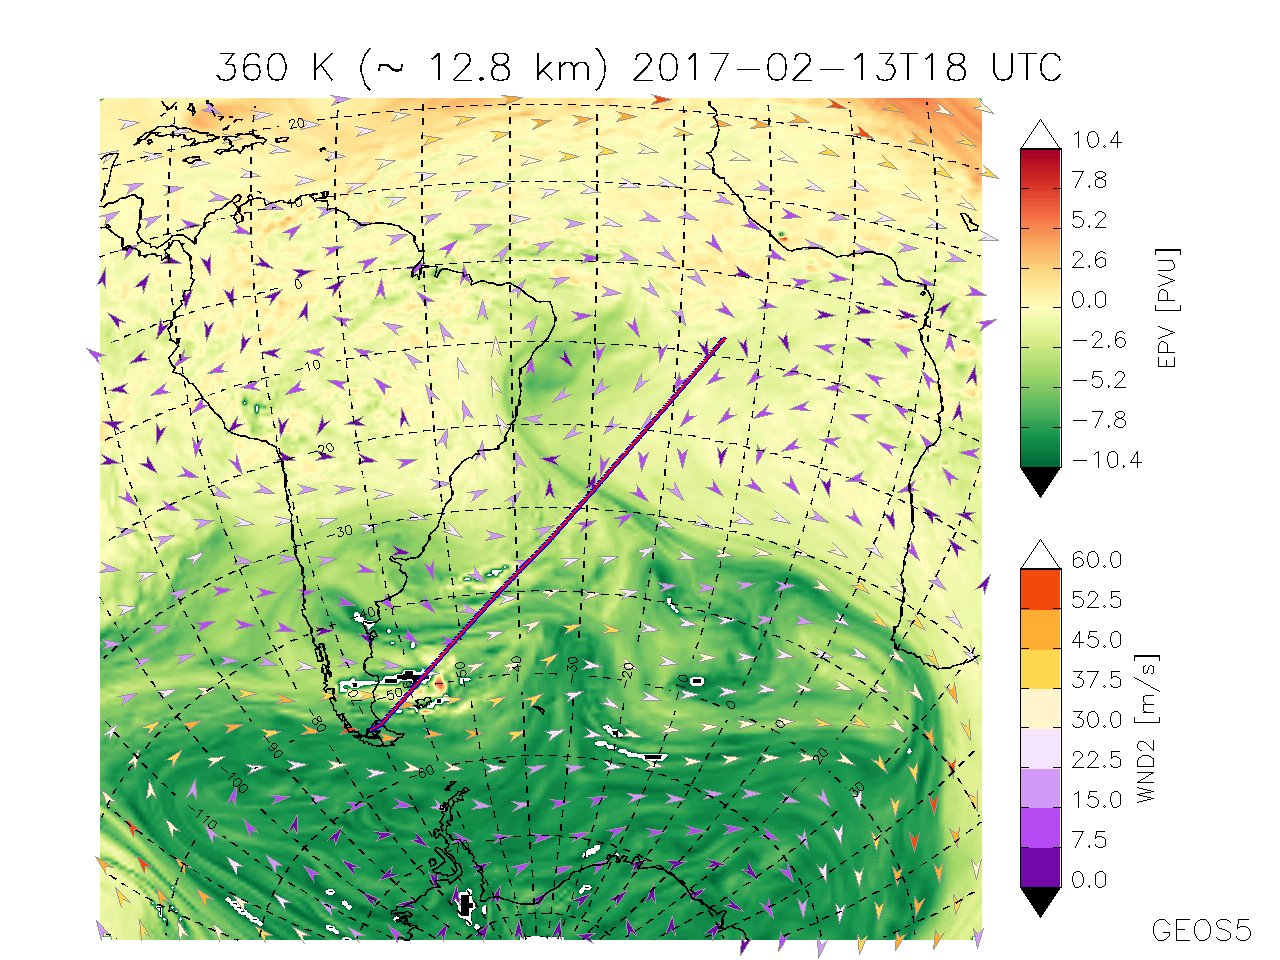
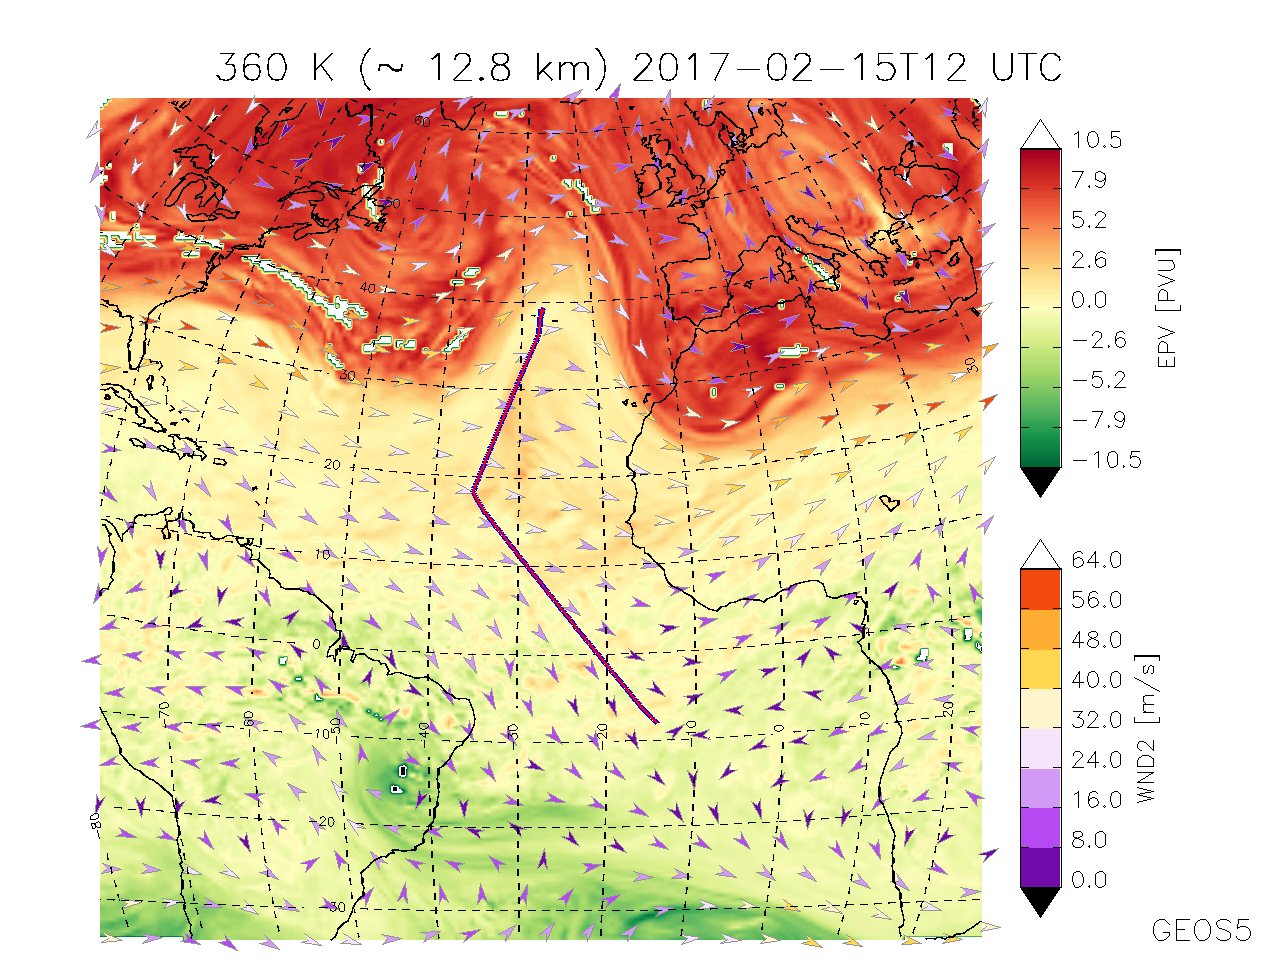
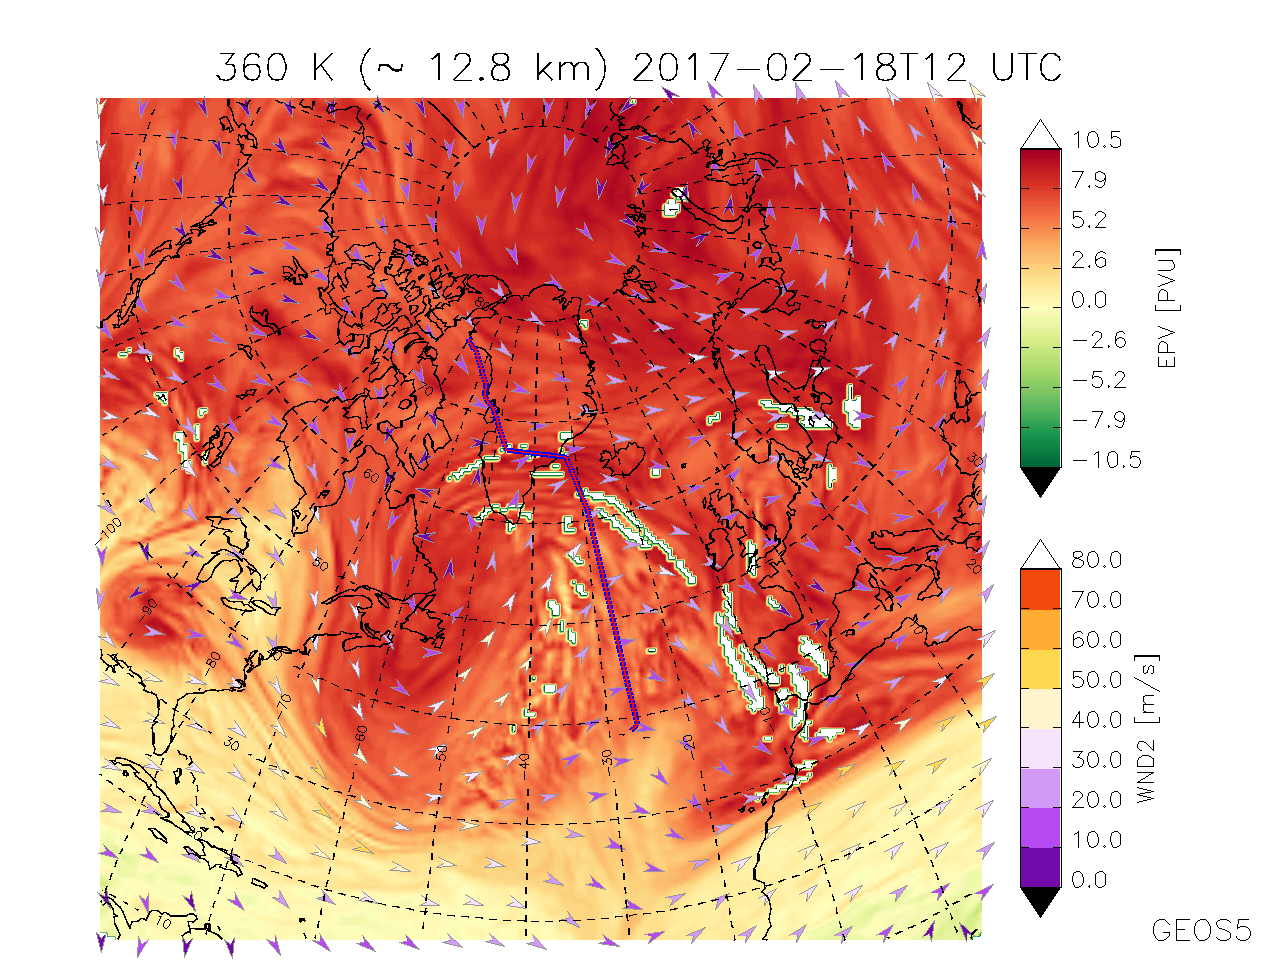
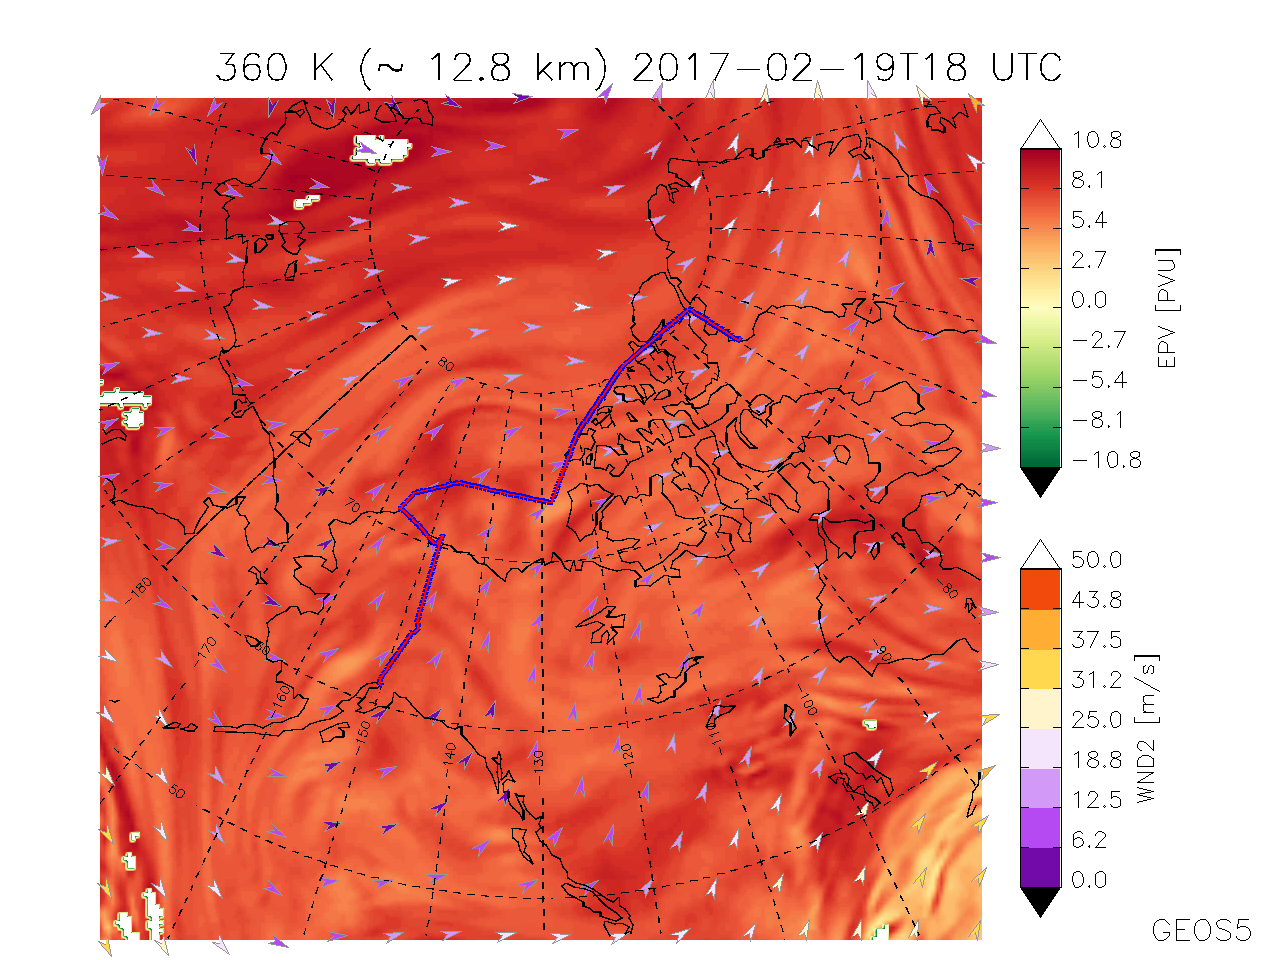
| Map of EPV @ 360 K | 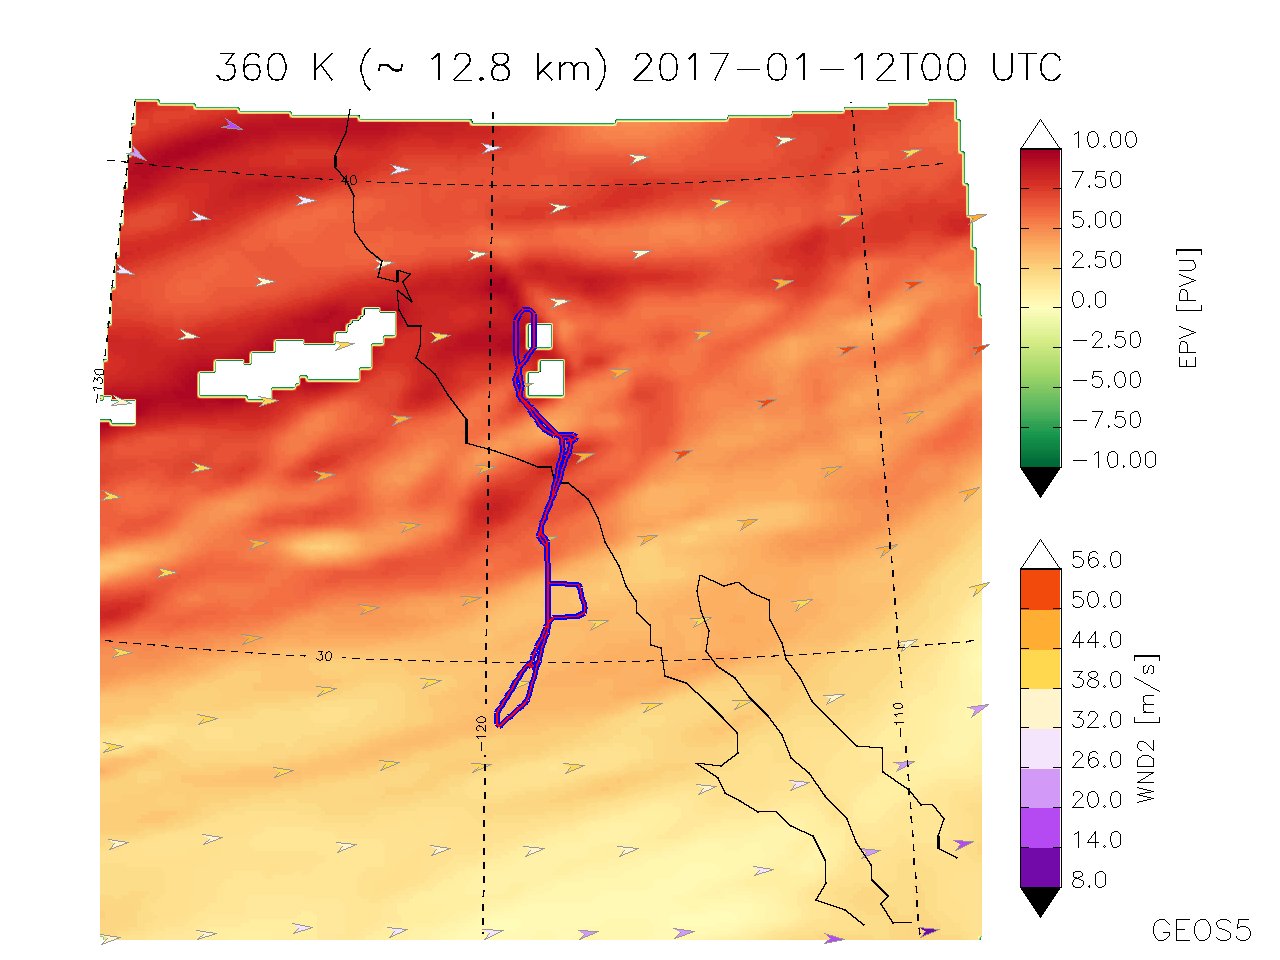 |
 |
 |
 |
 |
 |
 |
 |
 |
 |
 |
 |
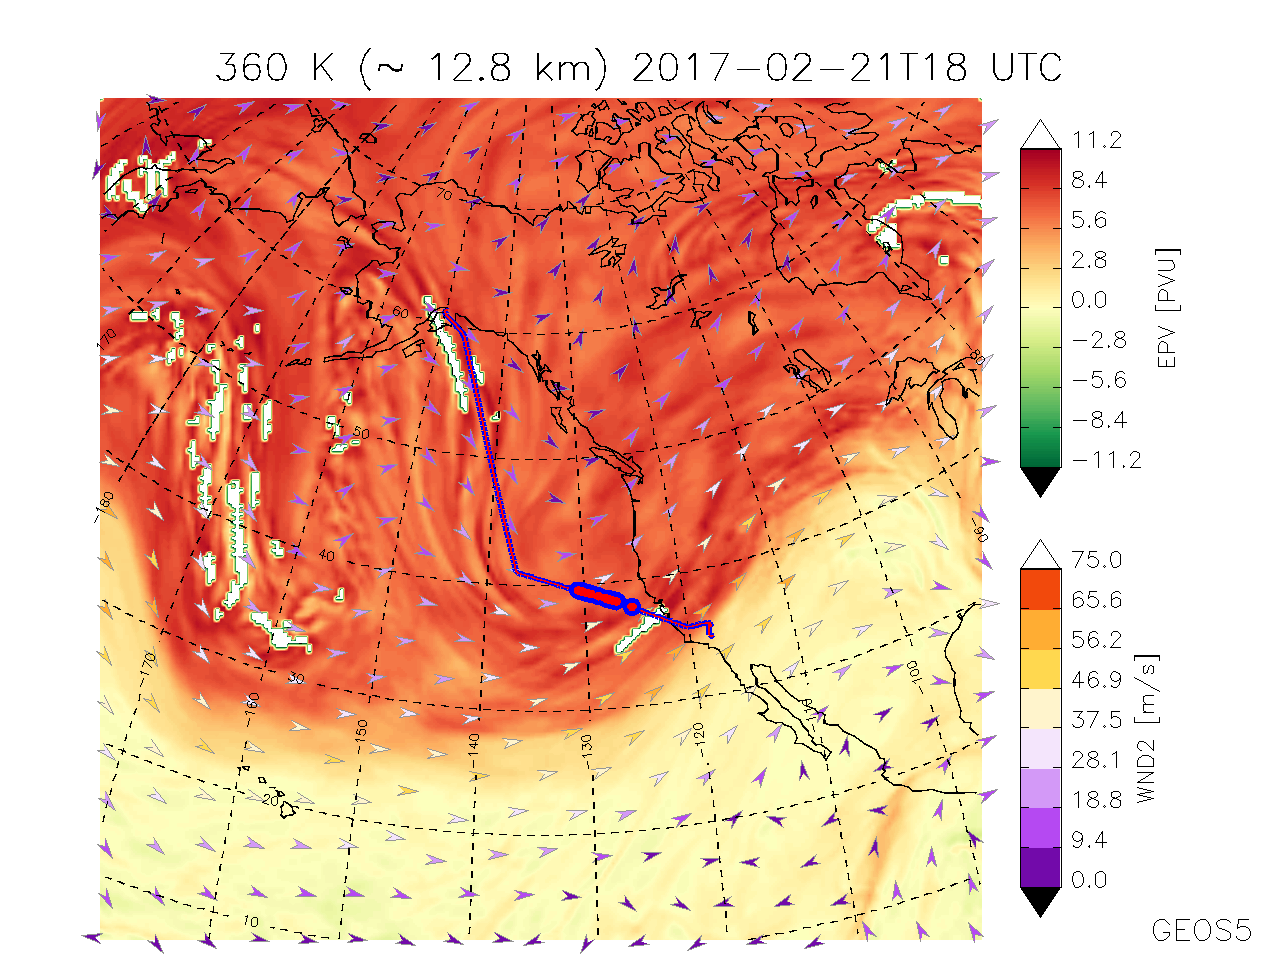 |
Map of EPV @ 360 K |
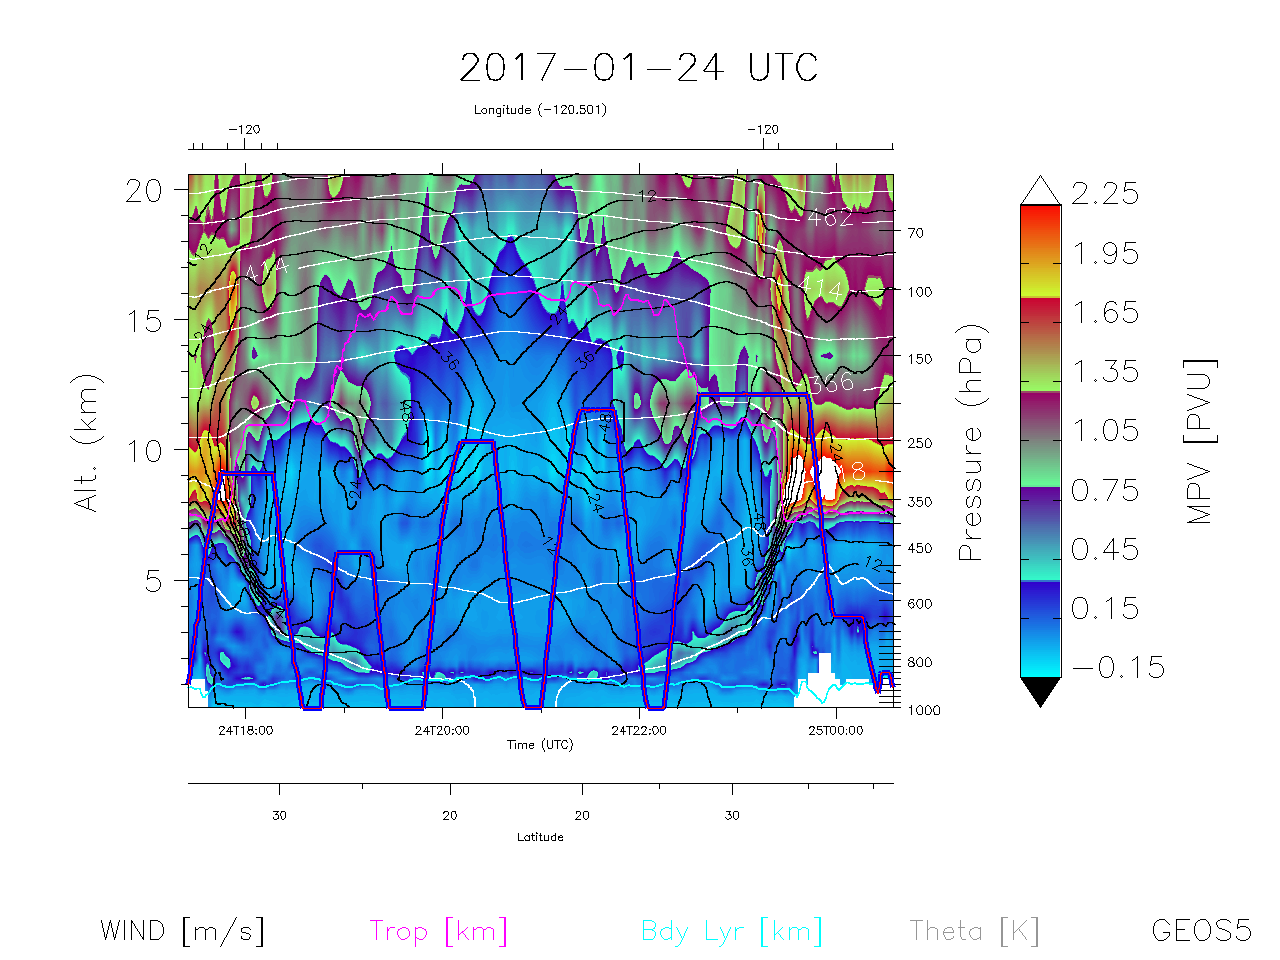
| Curtain of Mod. PV | 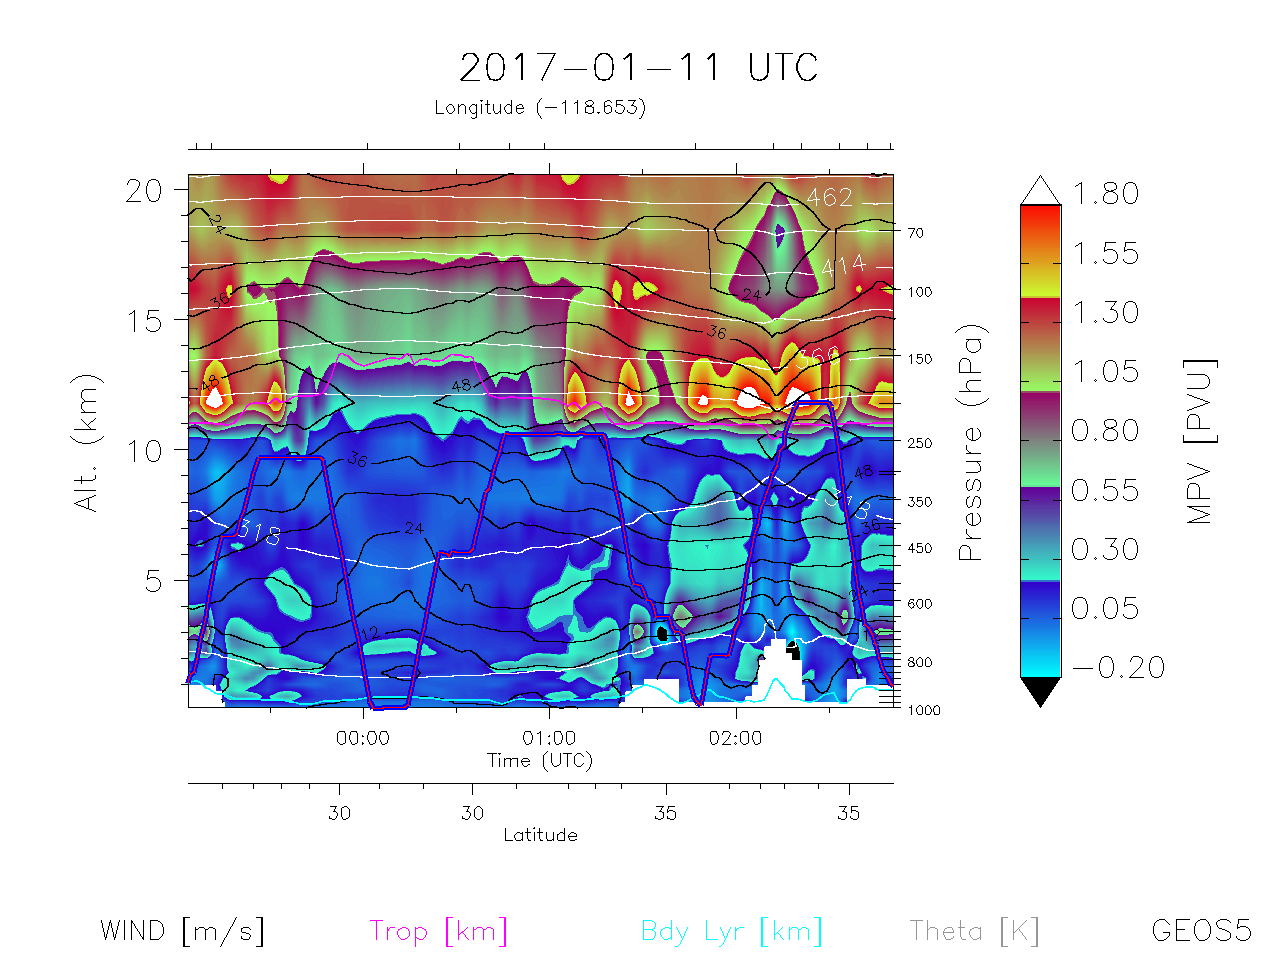 |
 |
 |
 |
 |
 |
 |
 |
 |
 |
 |
 |
 |
Curtain of Mod. PV |
| Plot | 2017-01-11 | 2017-01-24 | 2017-01-26 | 2017-01-29 | 2017-02-01 | 2017-02-03 | 2017-02-05 | 2017-02-10 | 2017-02-13 | 2017-02-15 | 2017-02-18 | 2017-02-19 | 2017-02-21 | Plot |
|---|---|---|---|---|---|---|---|---|---|---|---|---|---|---|
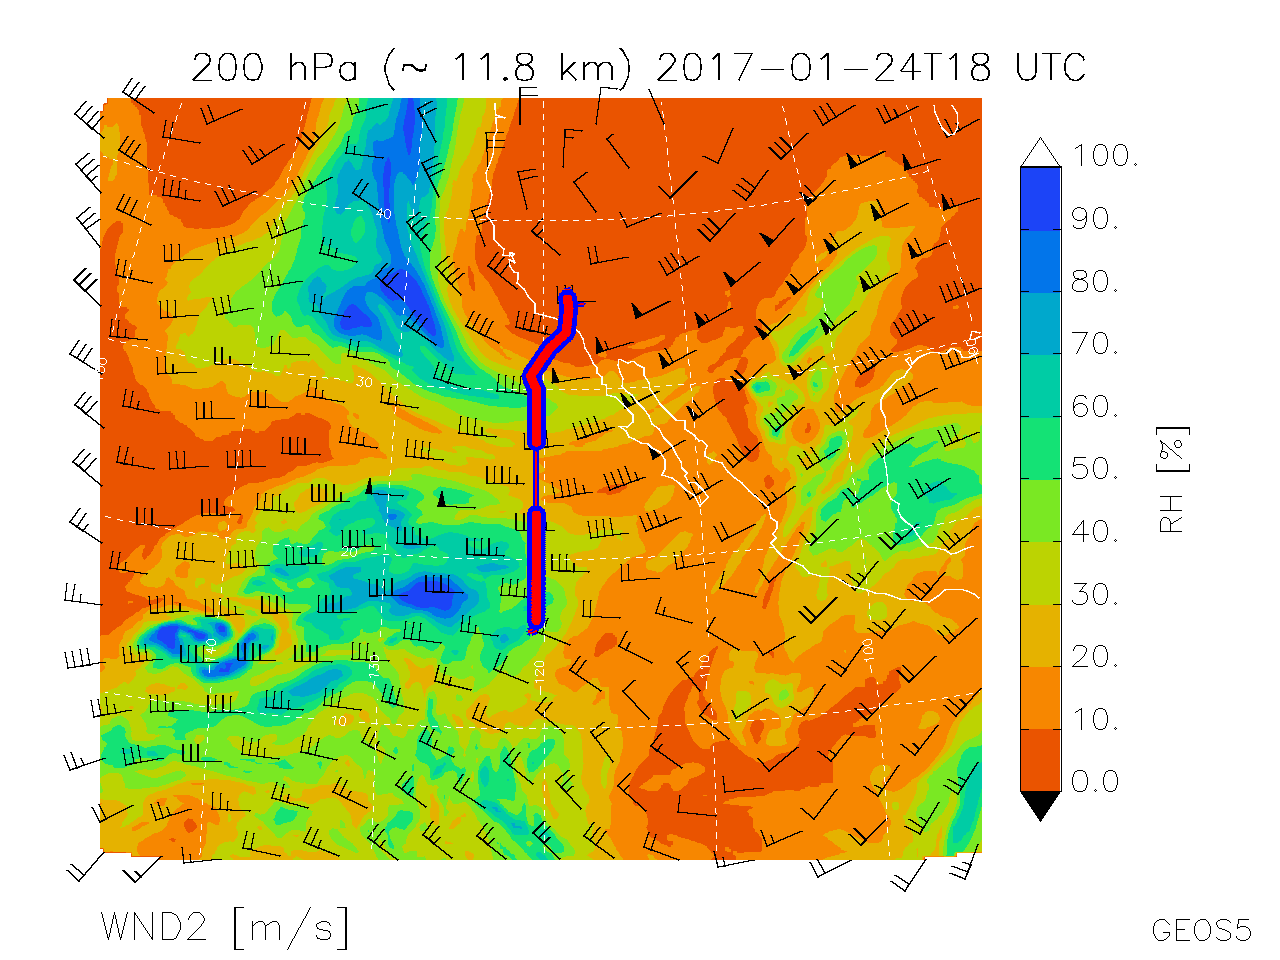
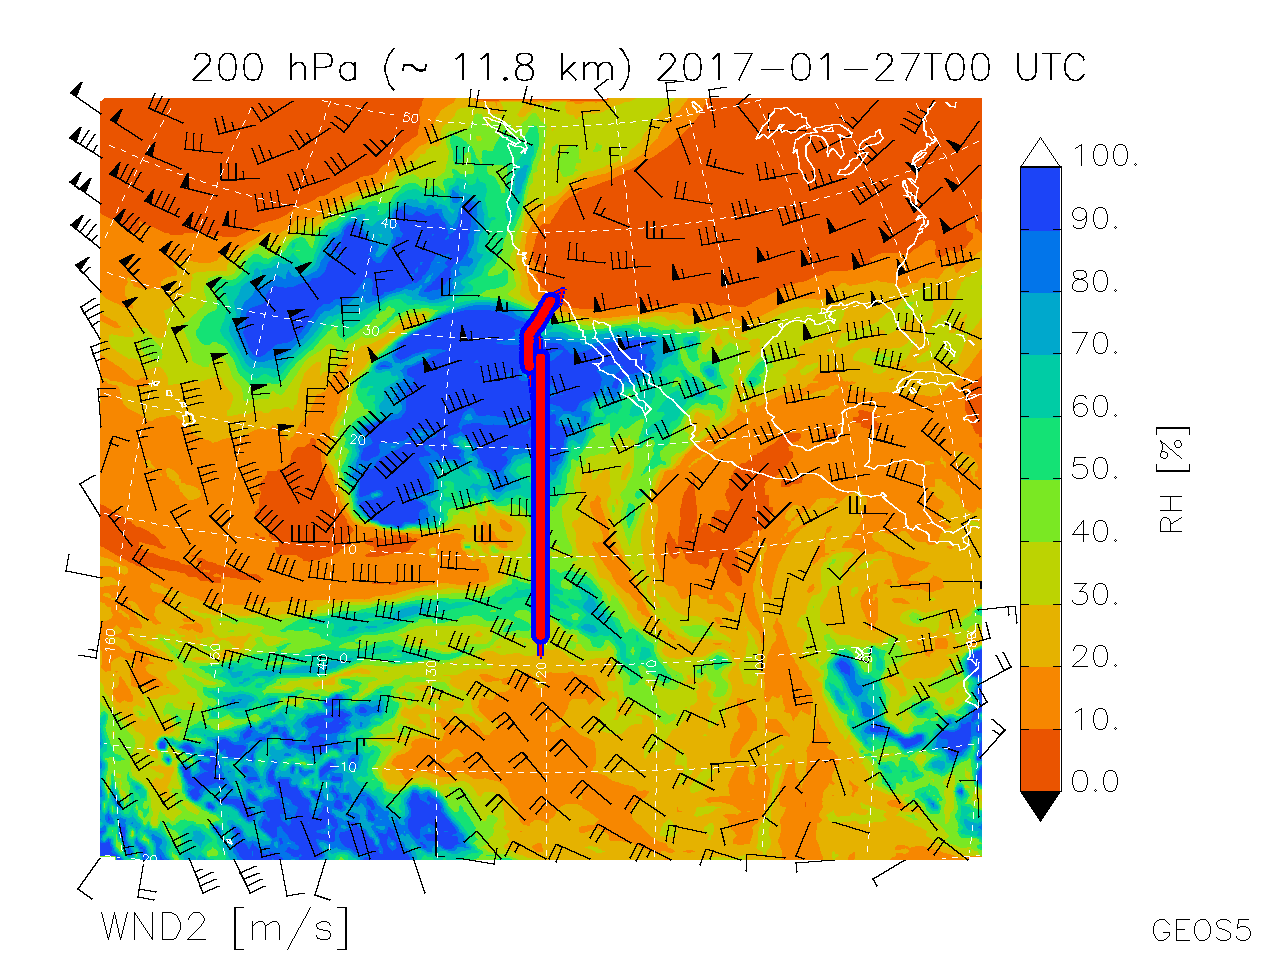
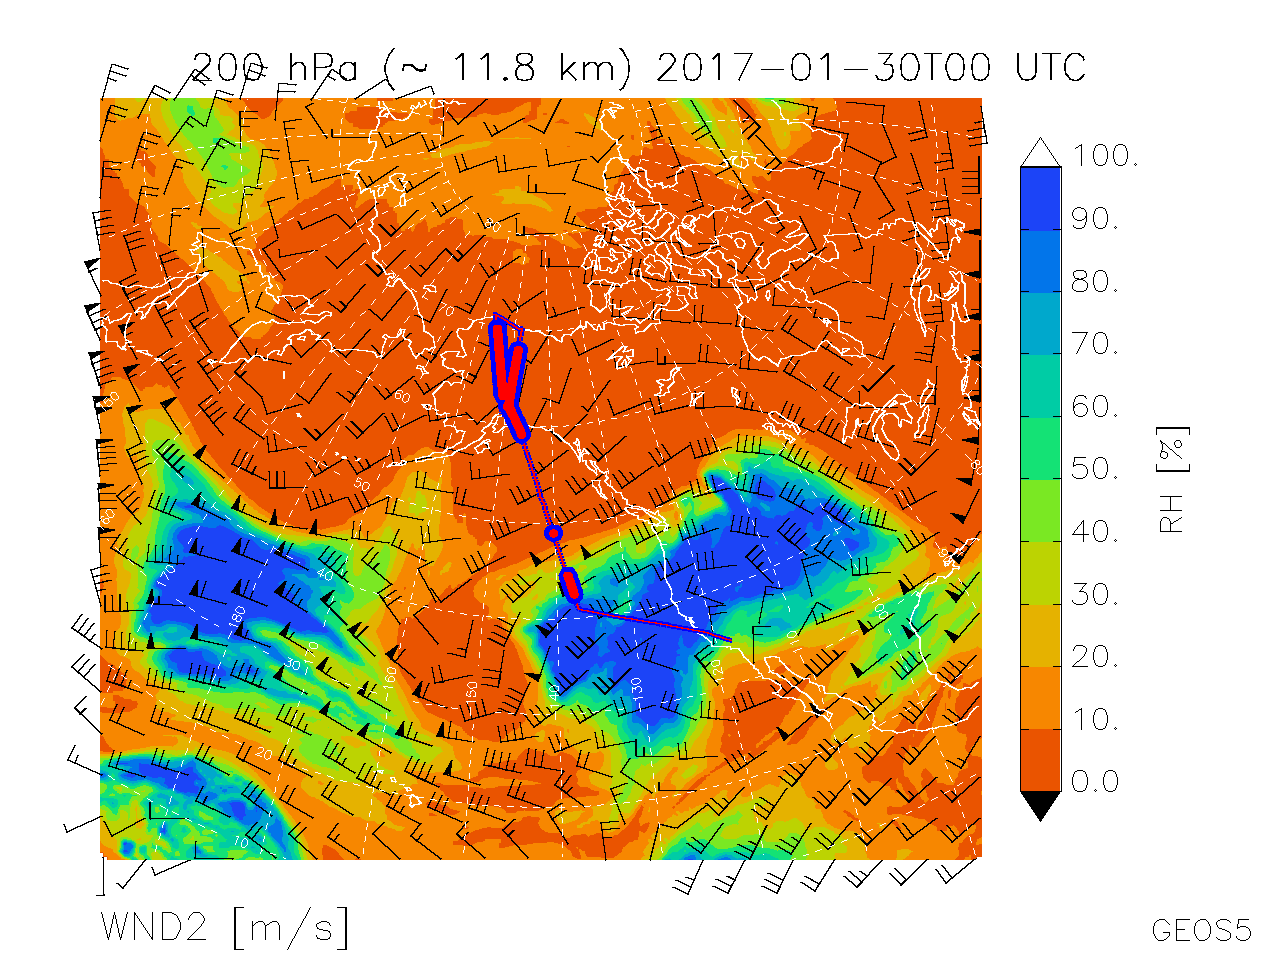
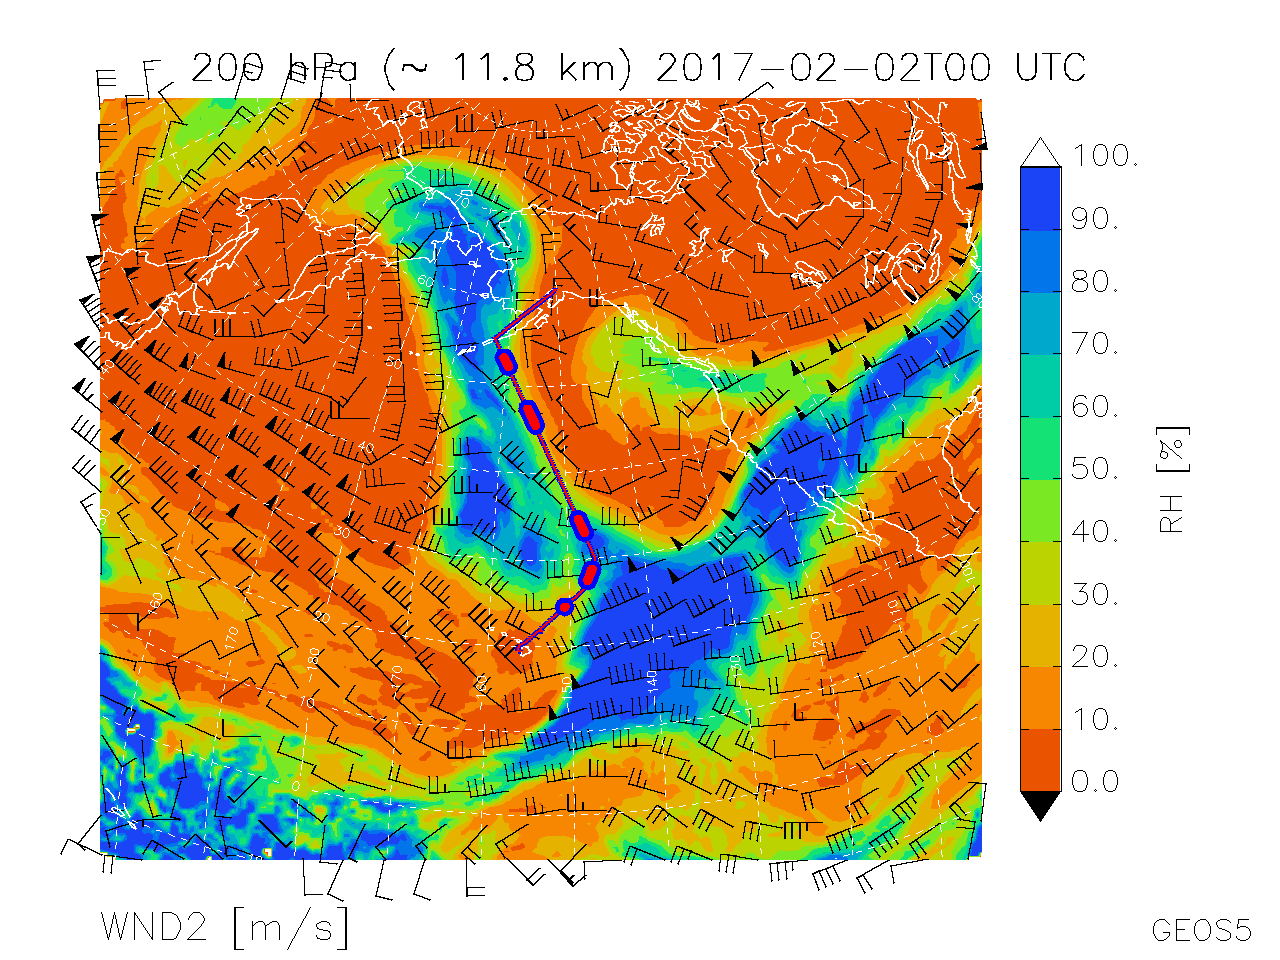
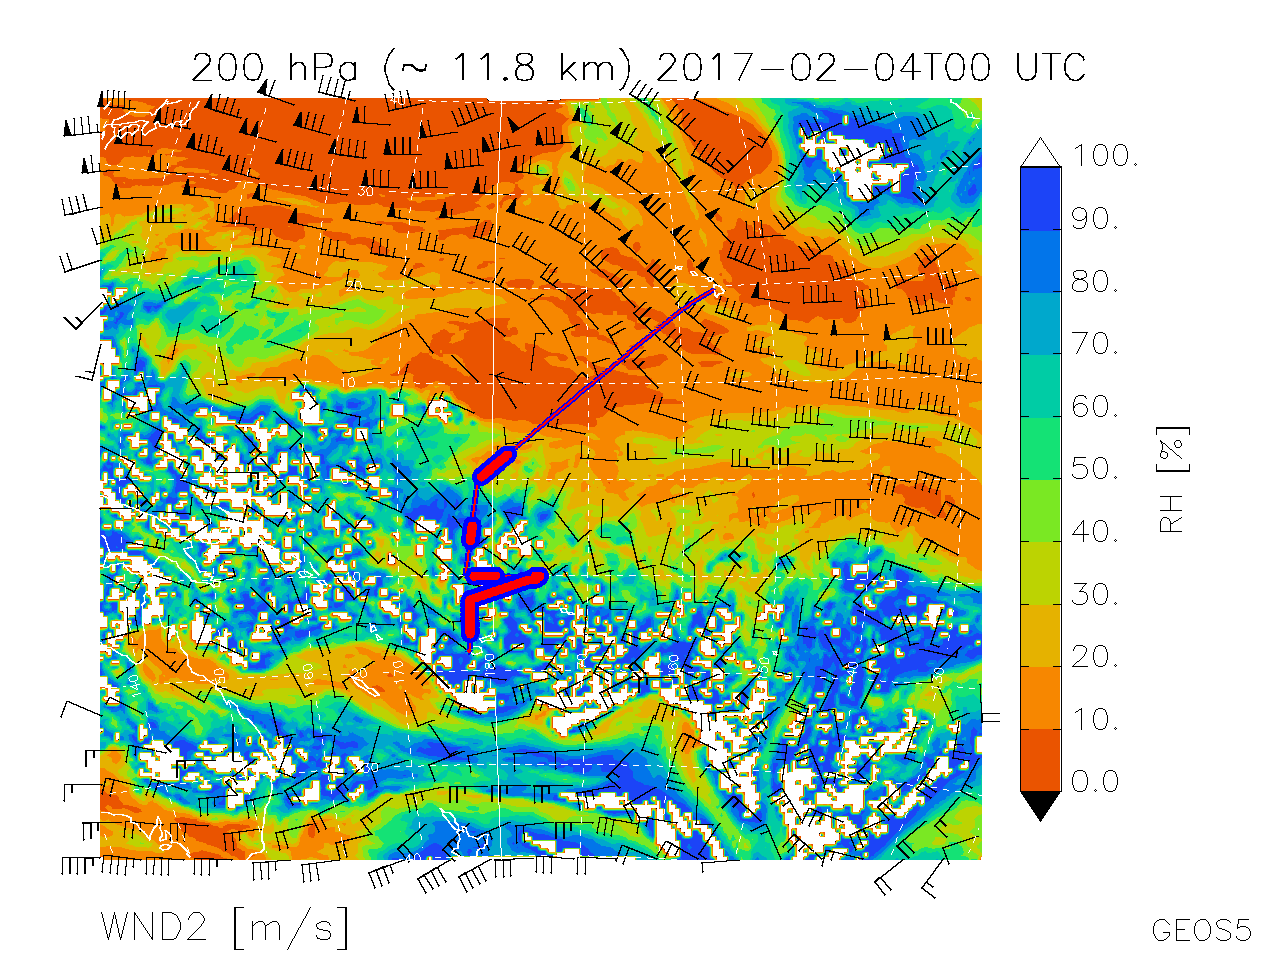
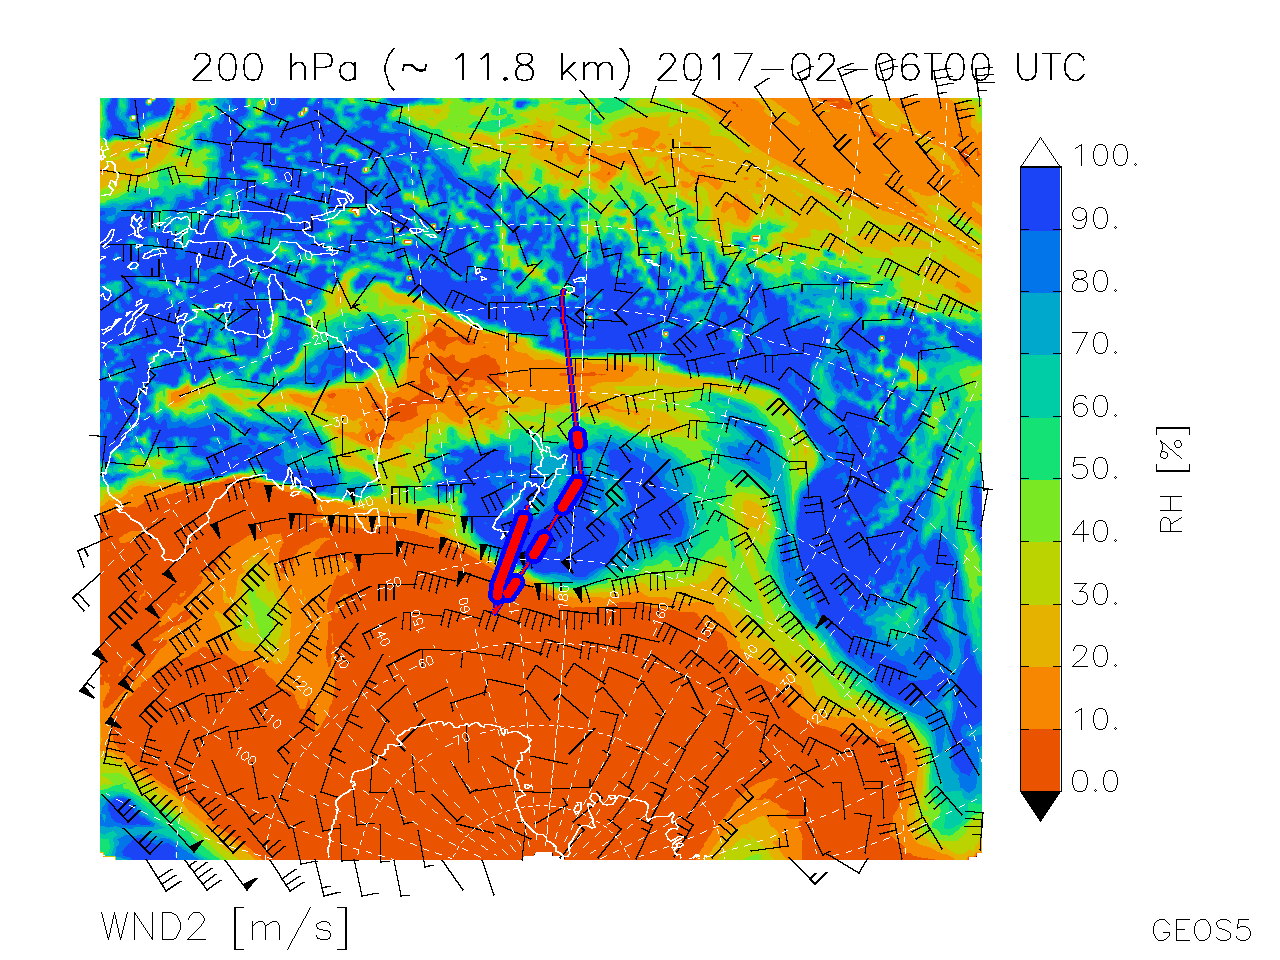
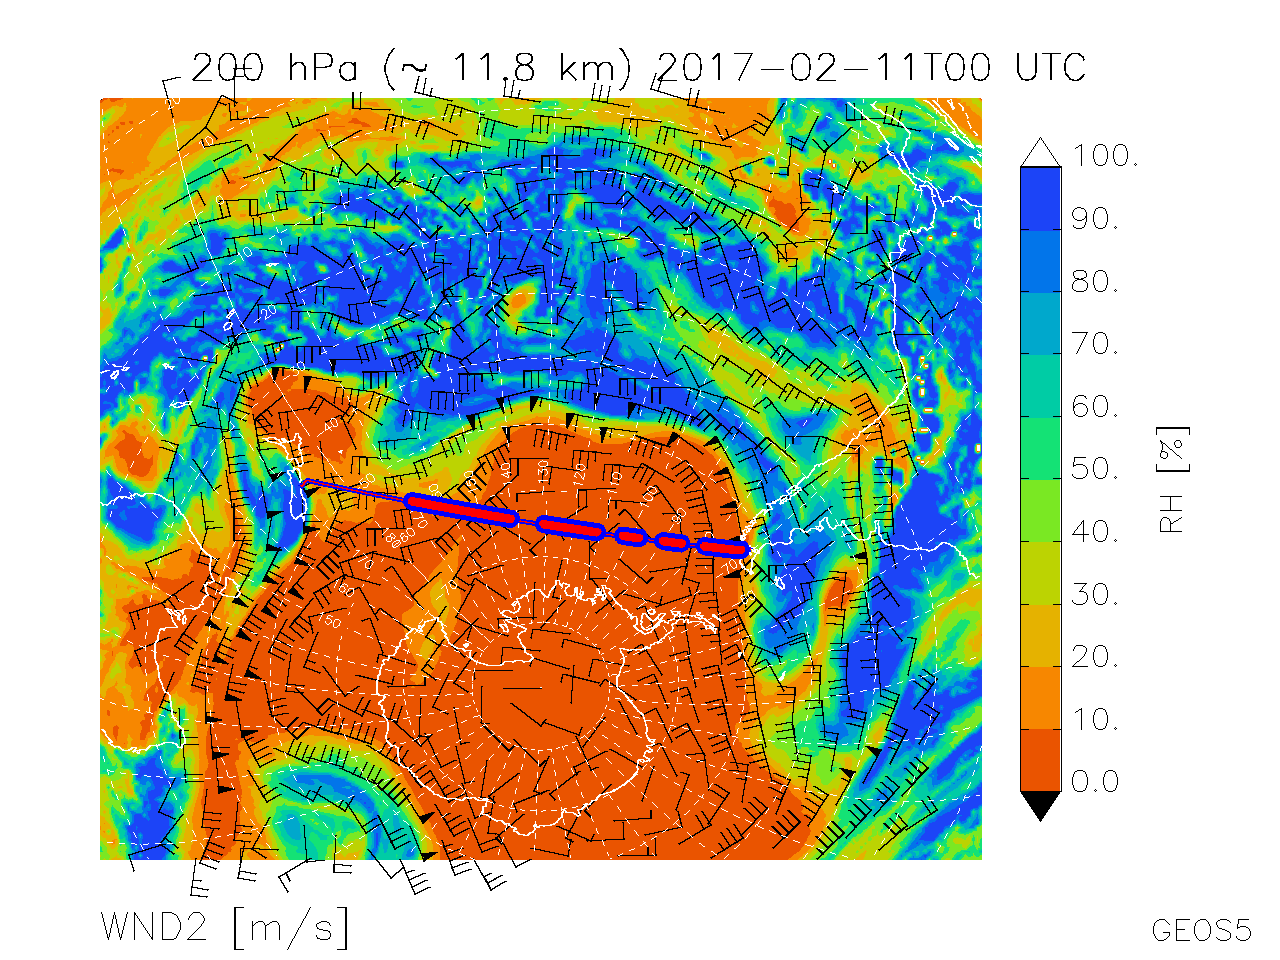
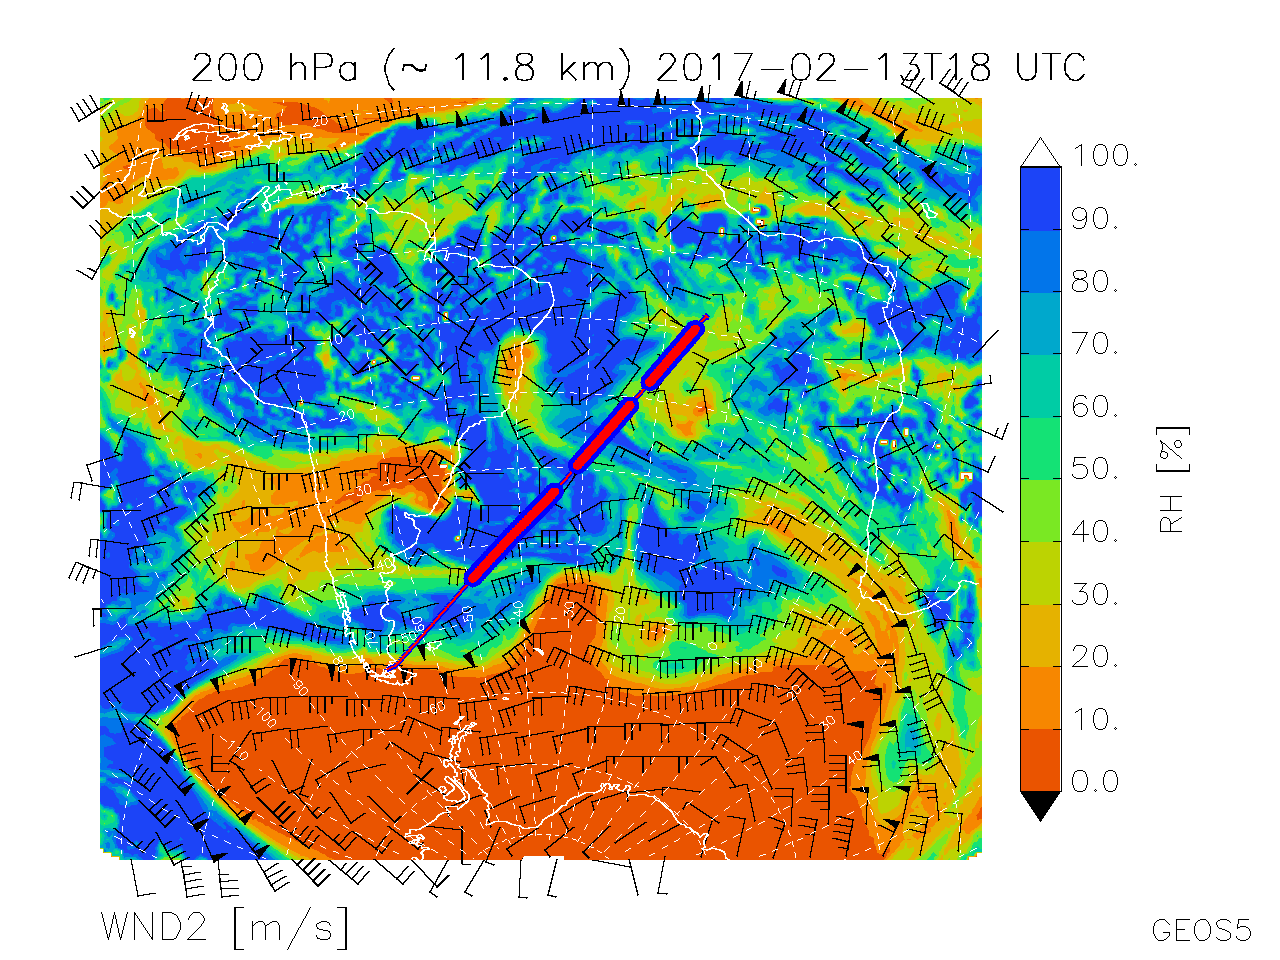
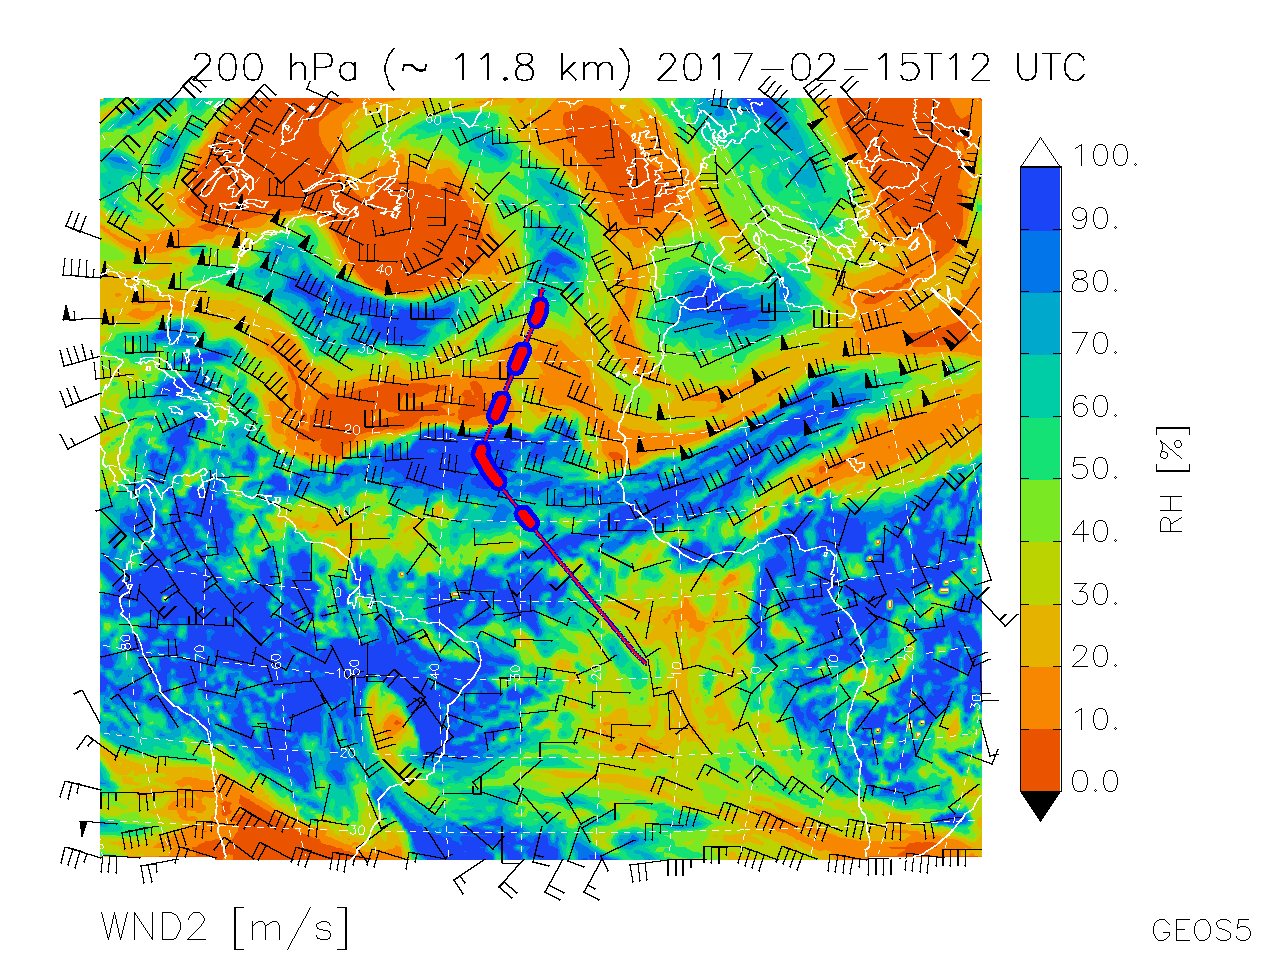
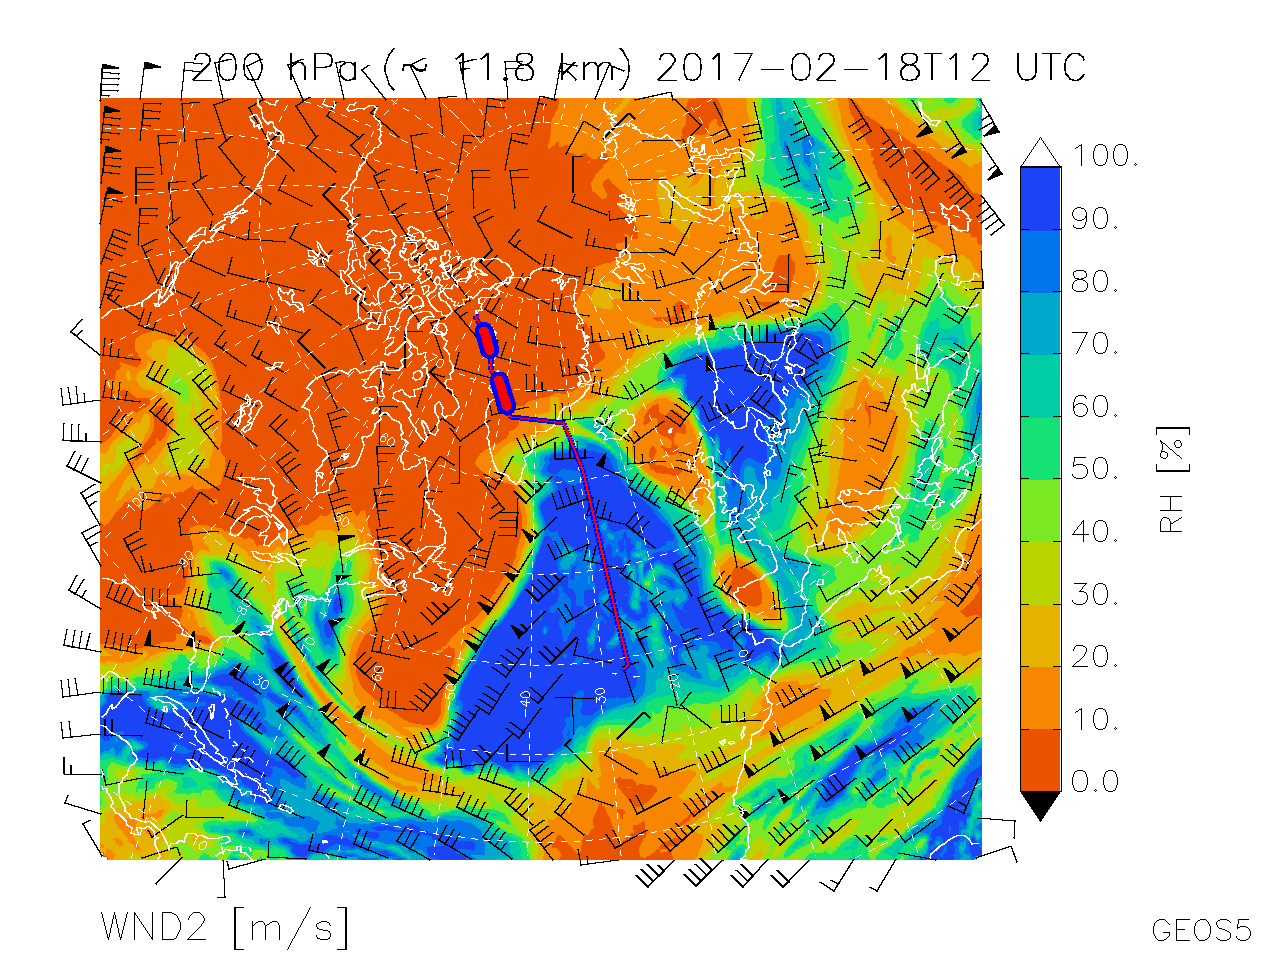
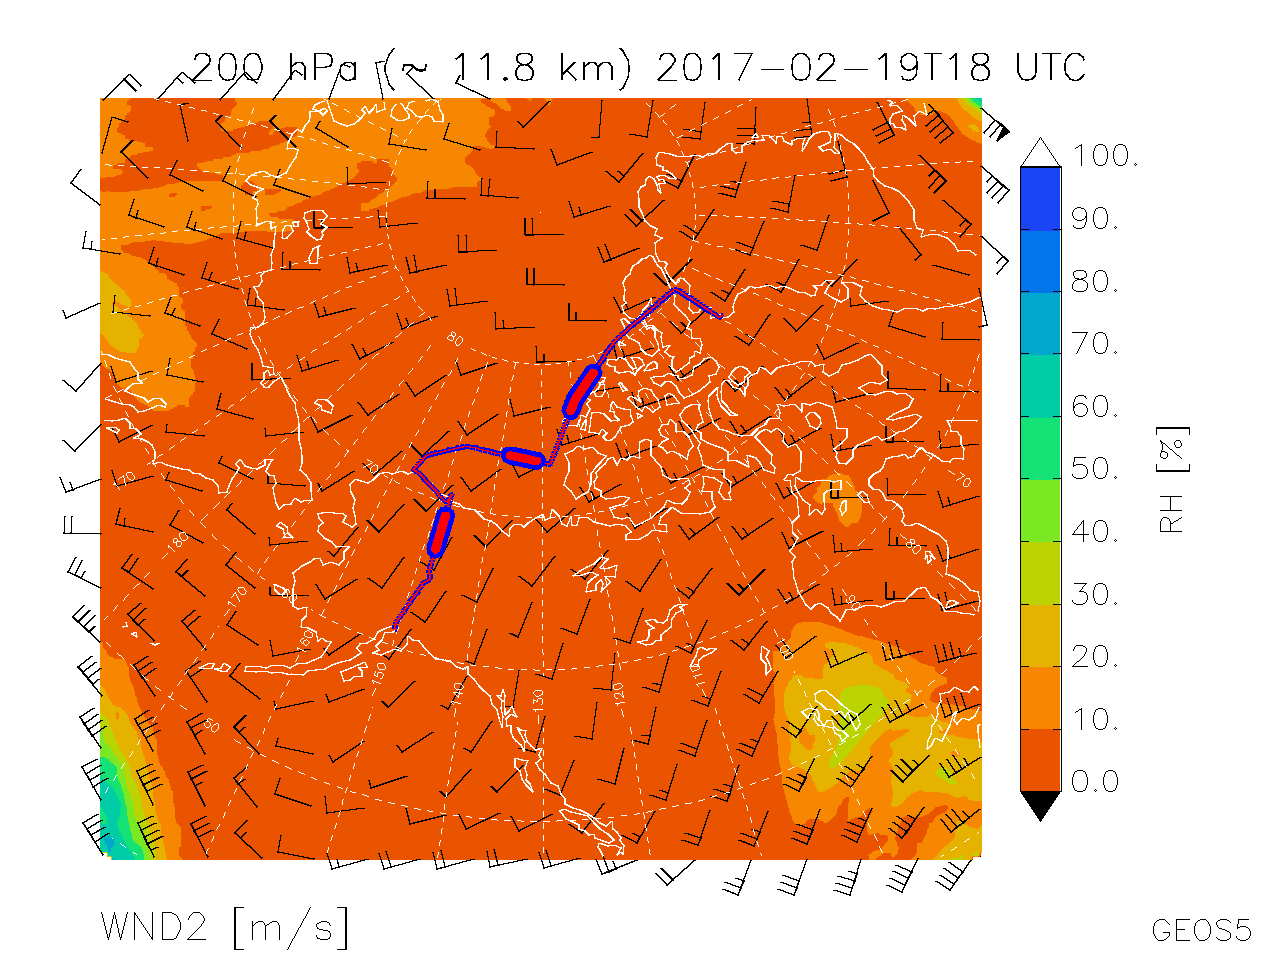
| Map of Rel. Humidity, Winds @ 200 hPa | 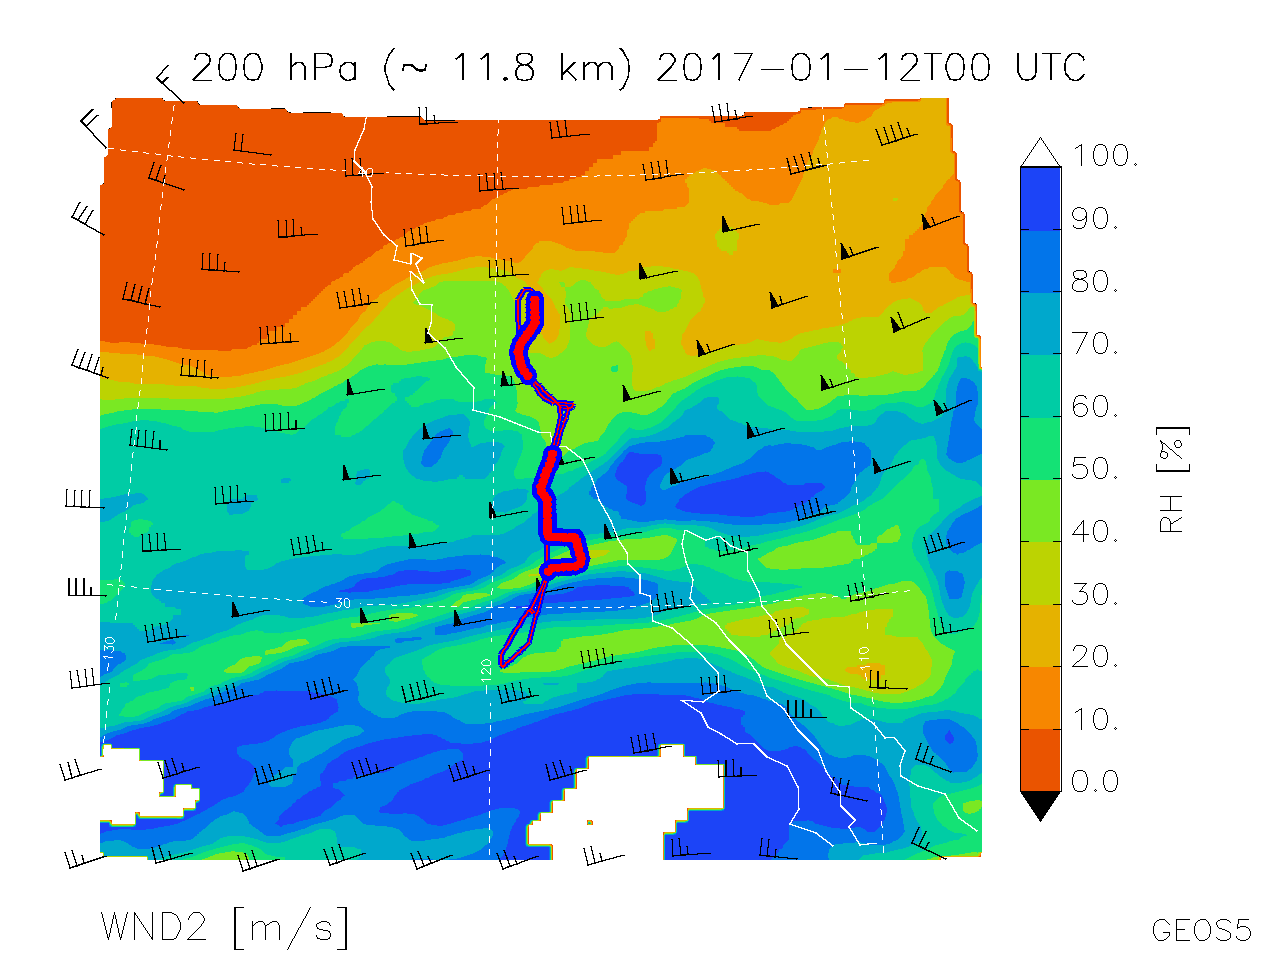 |
 |
 |
 |
 |
 |
 |
 |
 |
 |
 |
 |
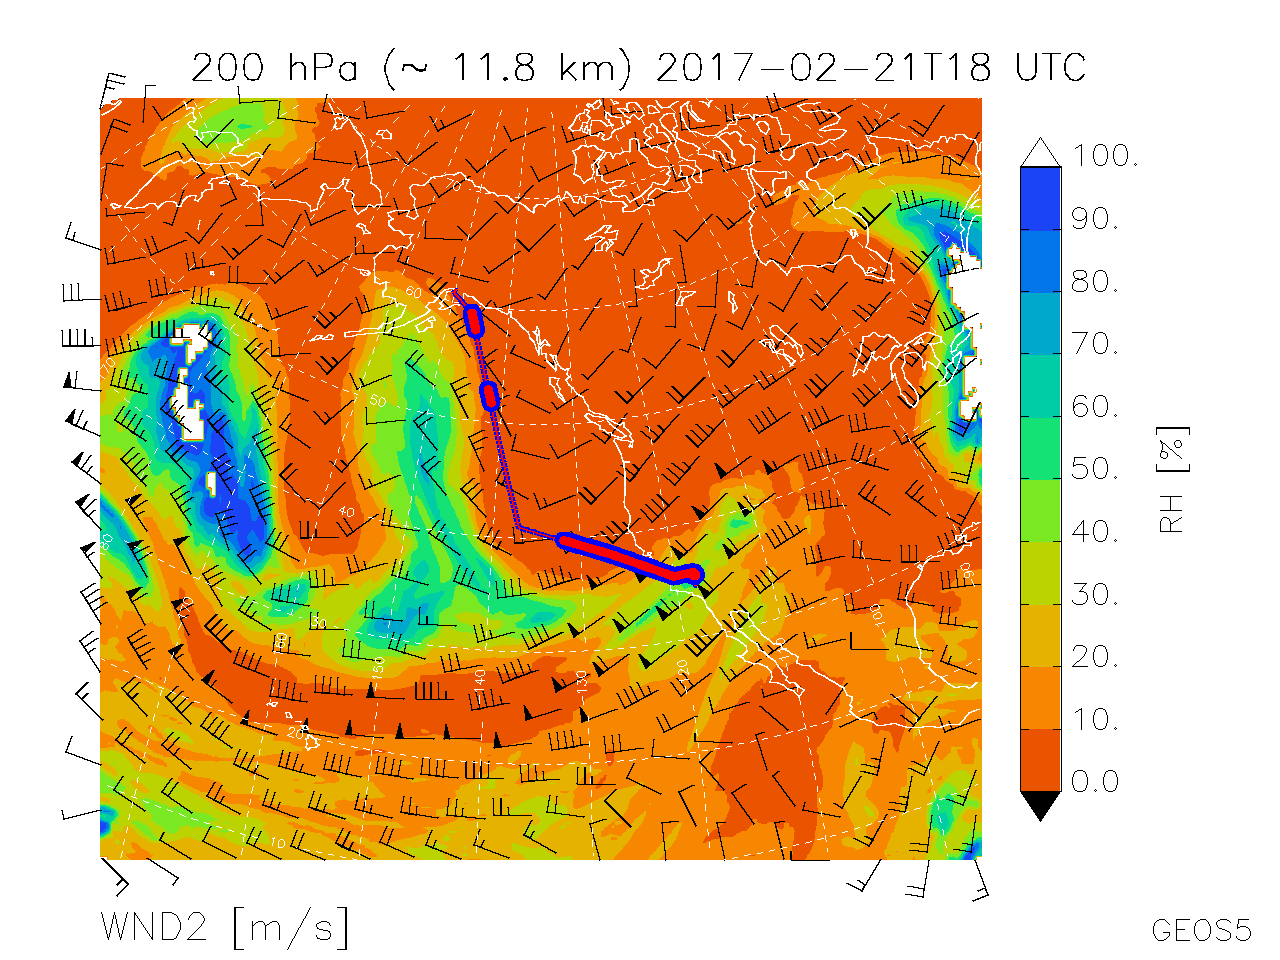 |
Map of Rel. Humidity, Winds @ 200 hPa |
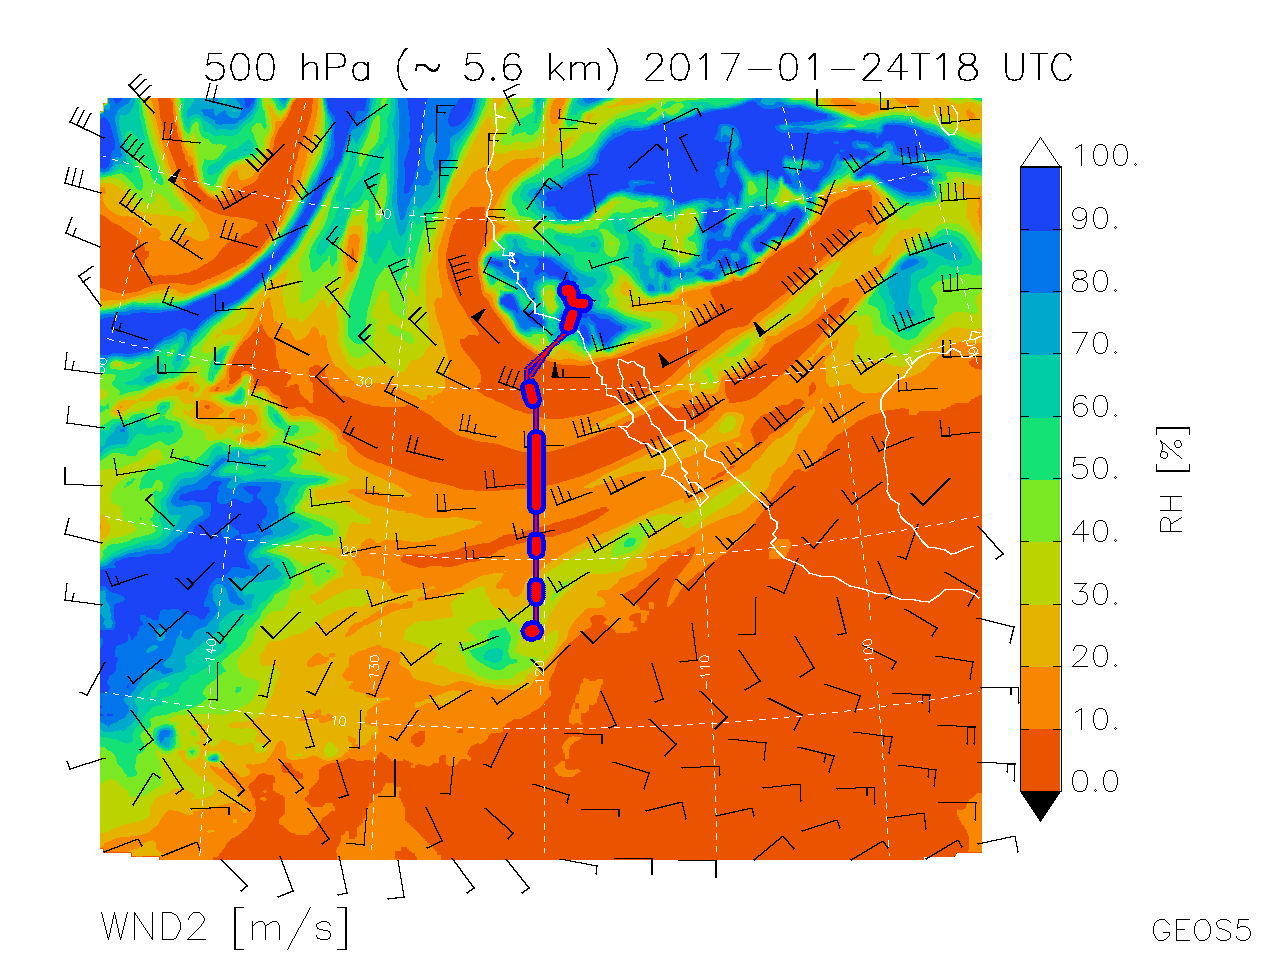
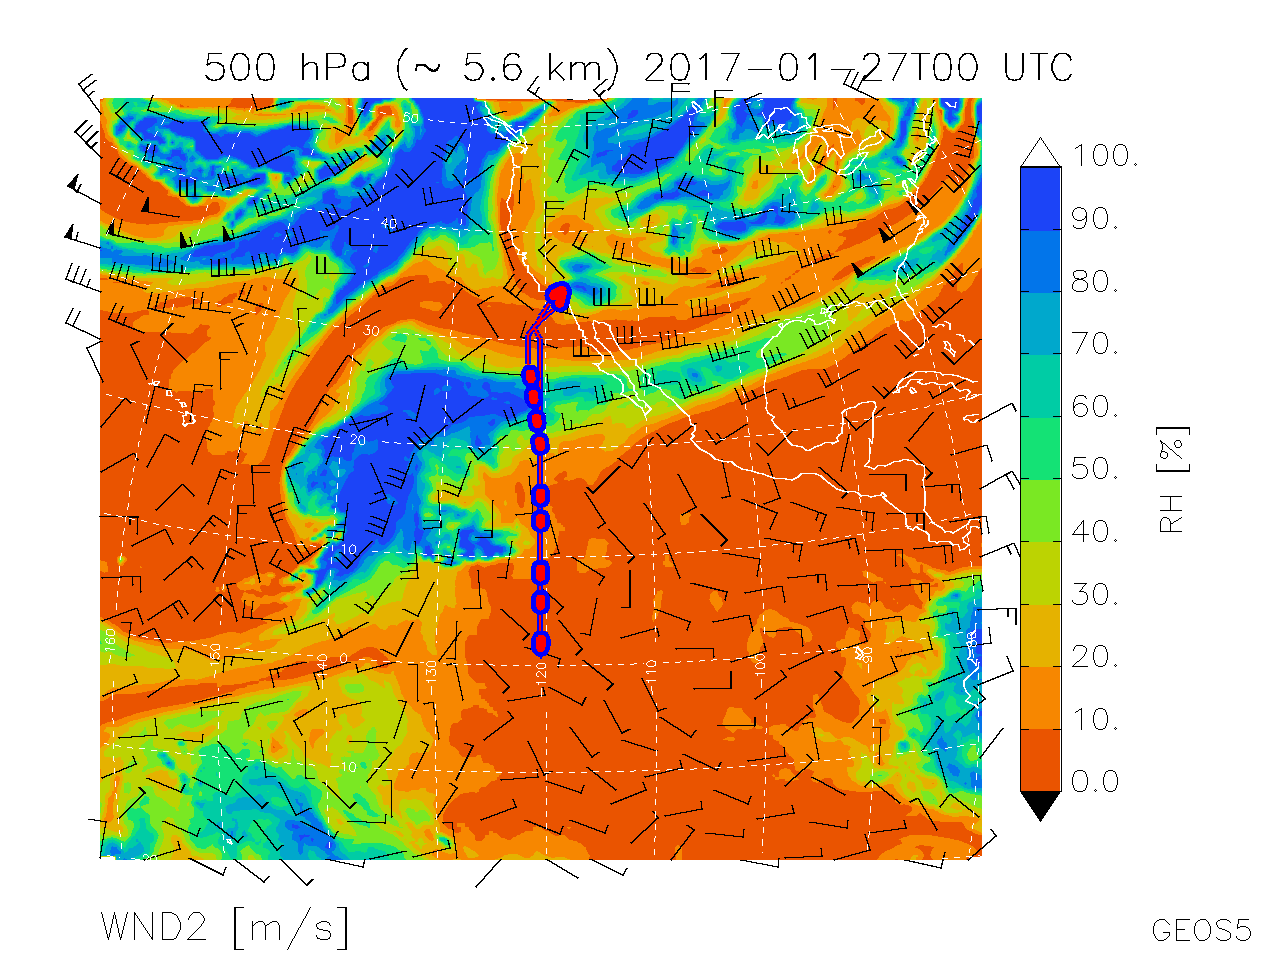
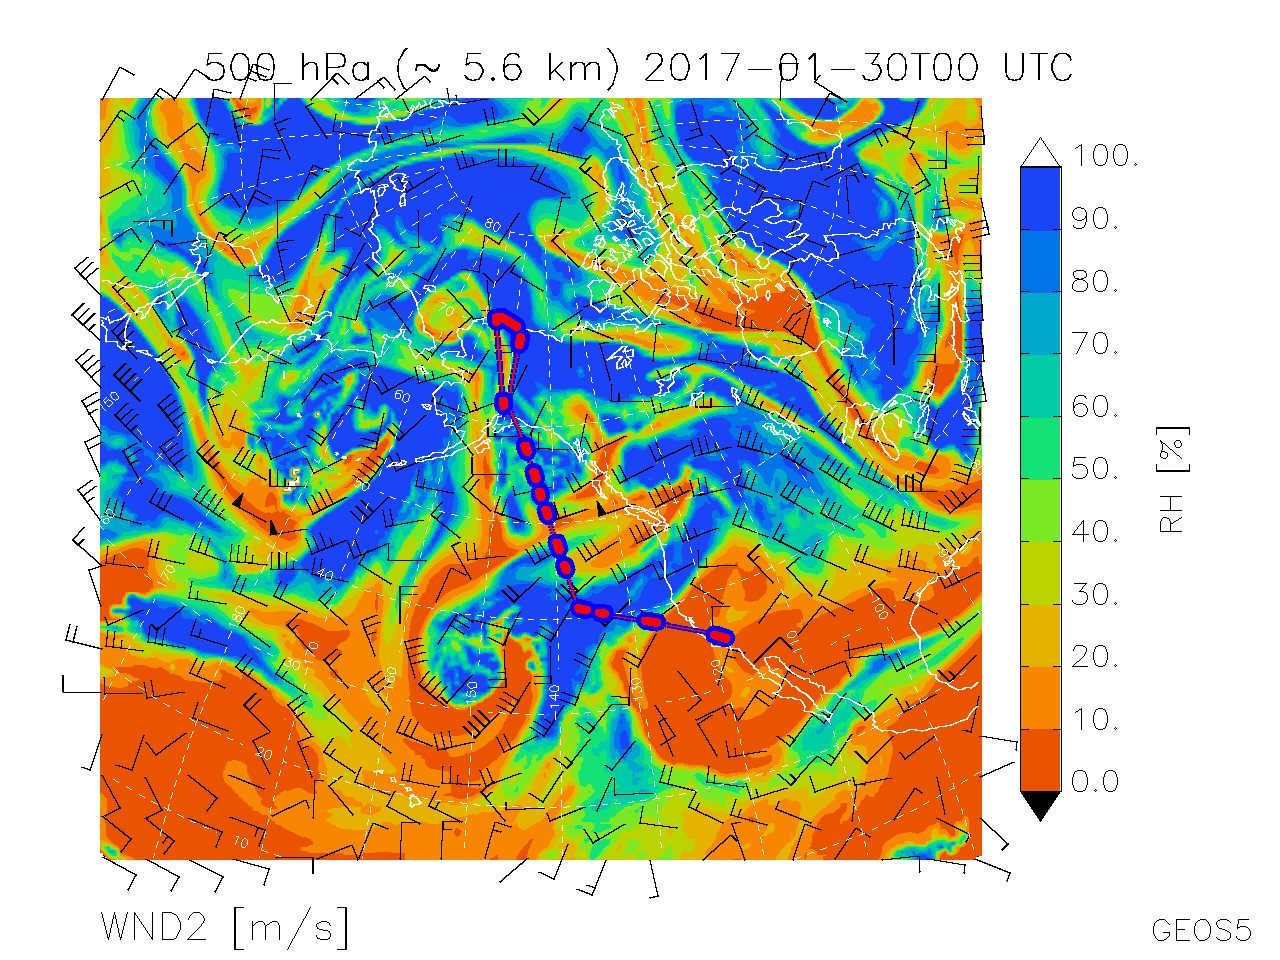
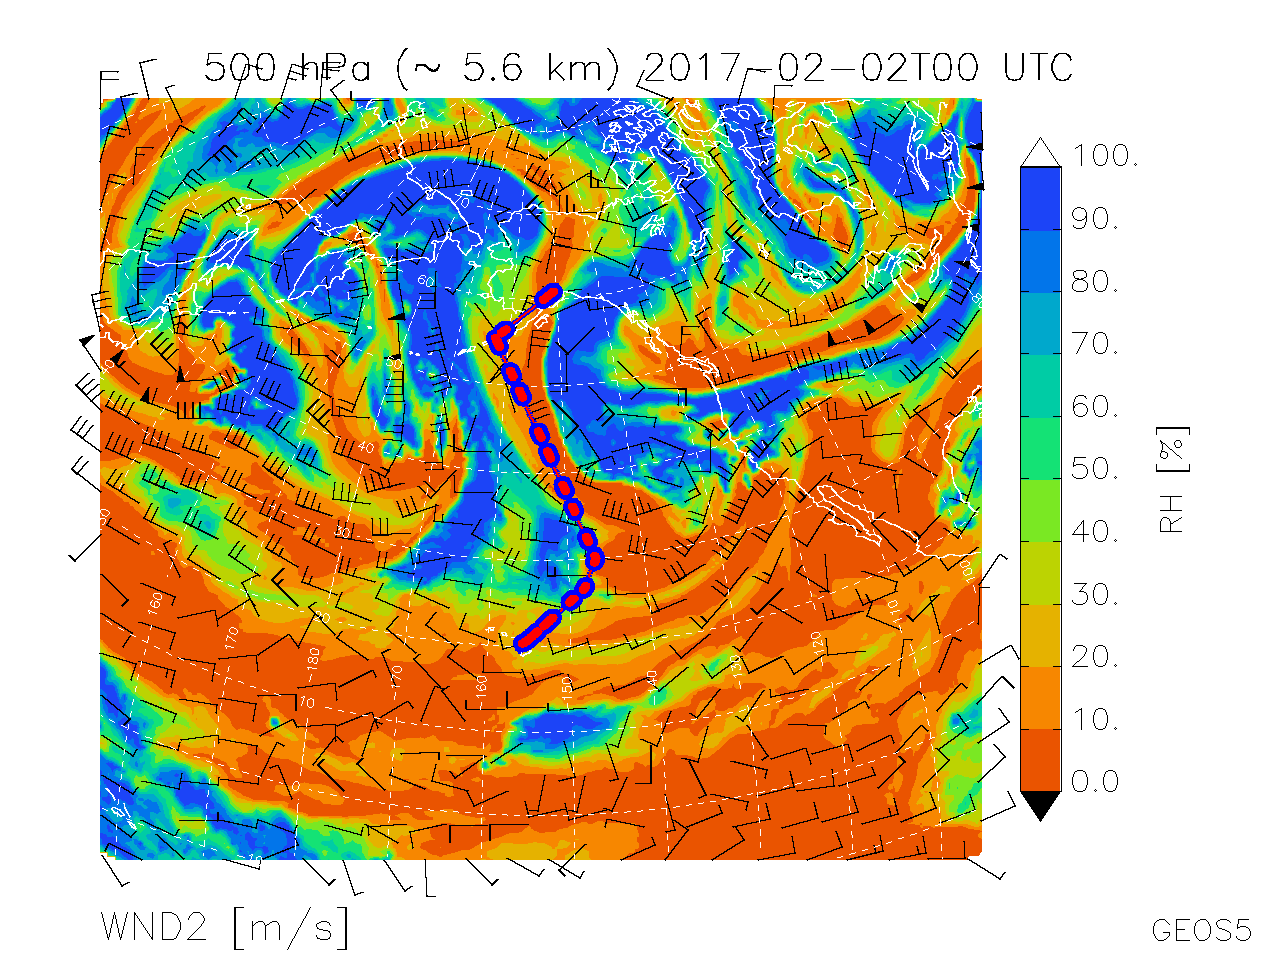
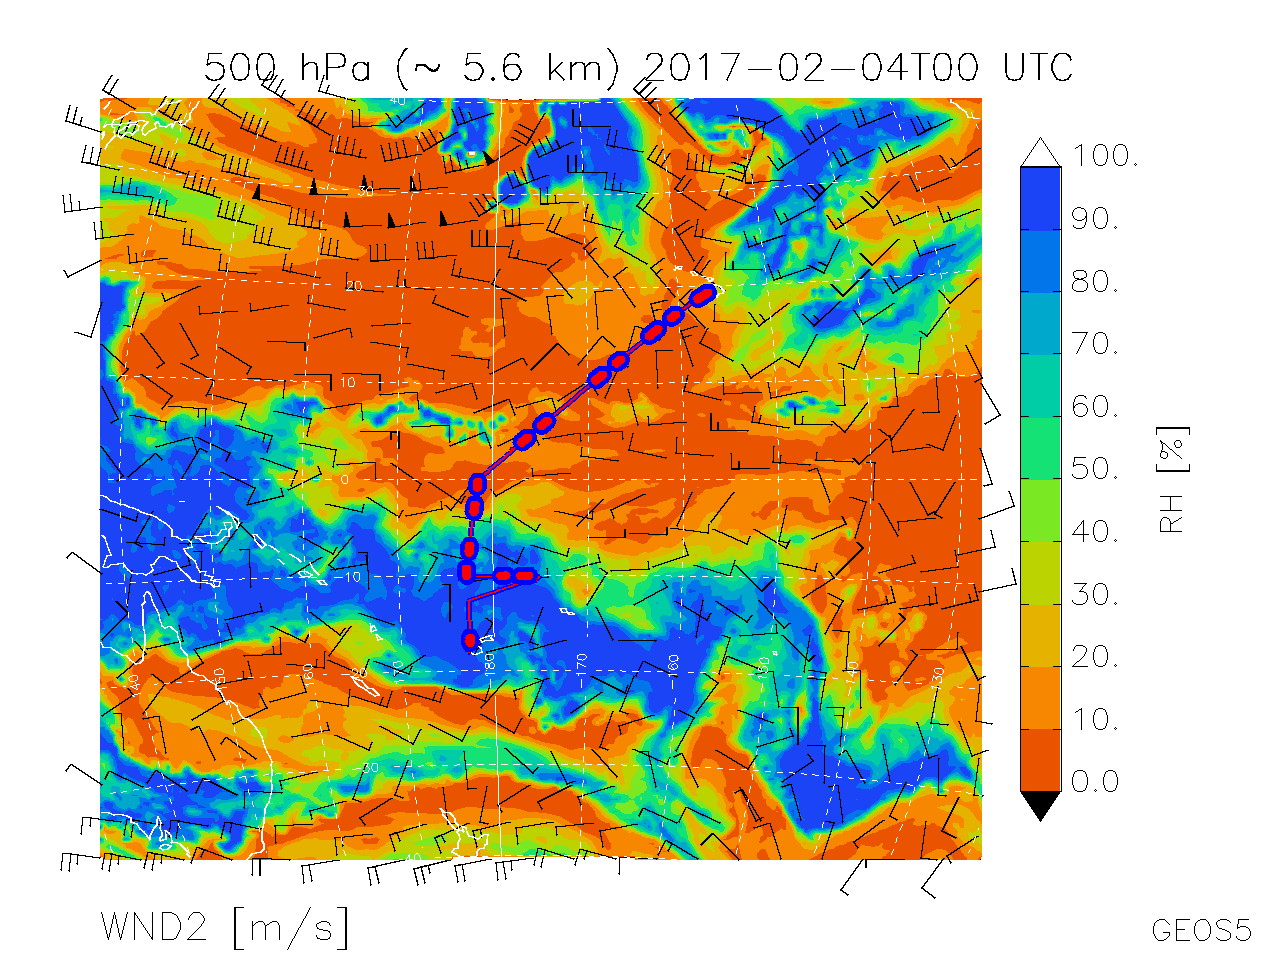
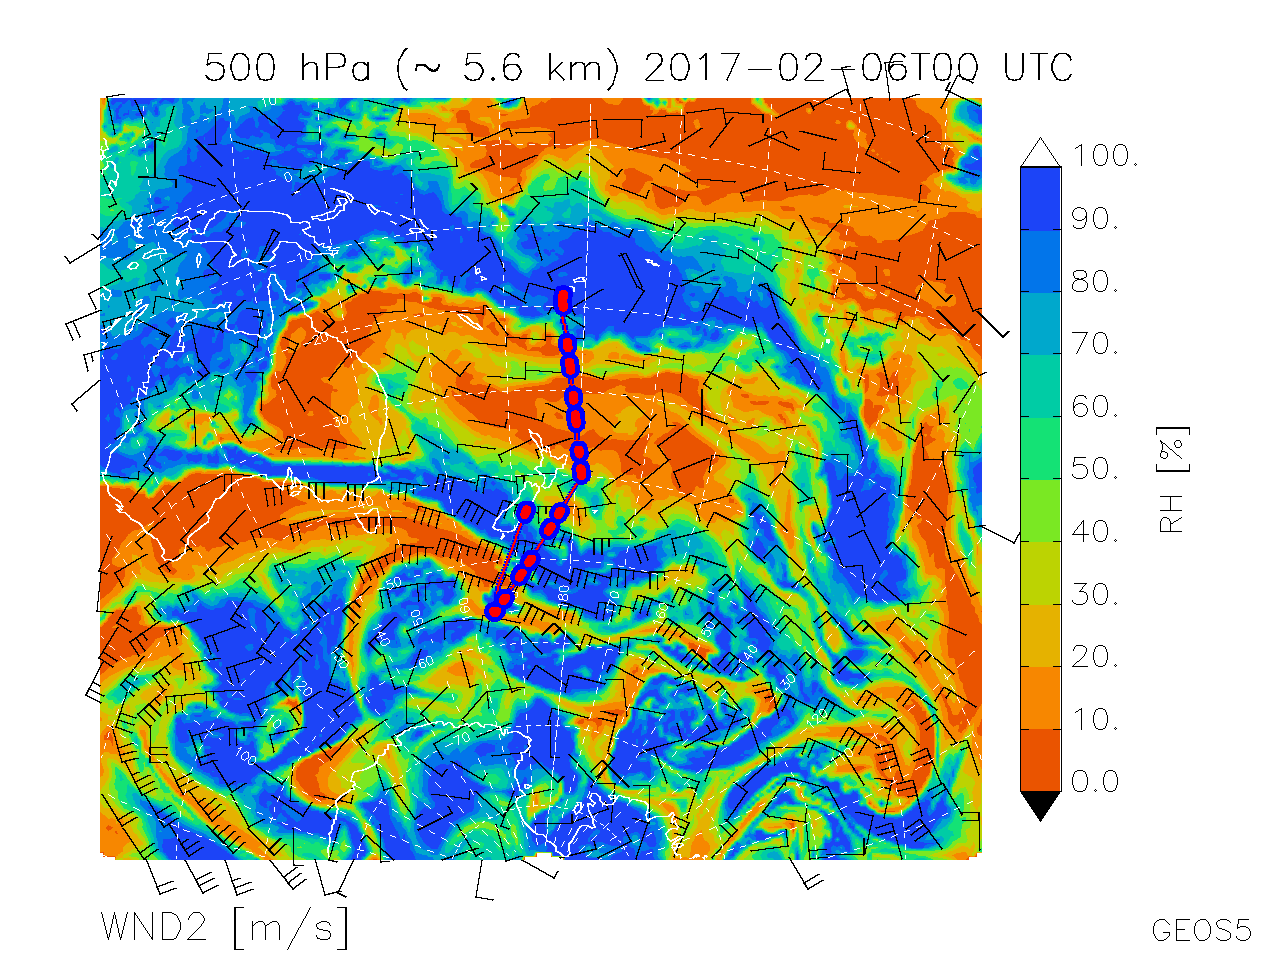
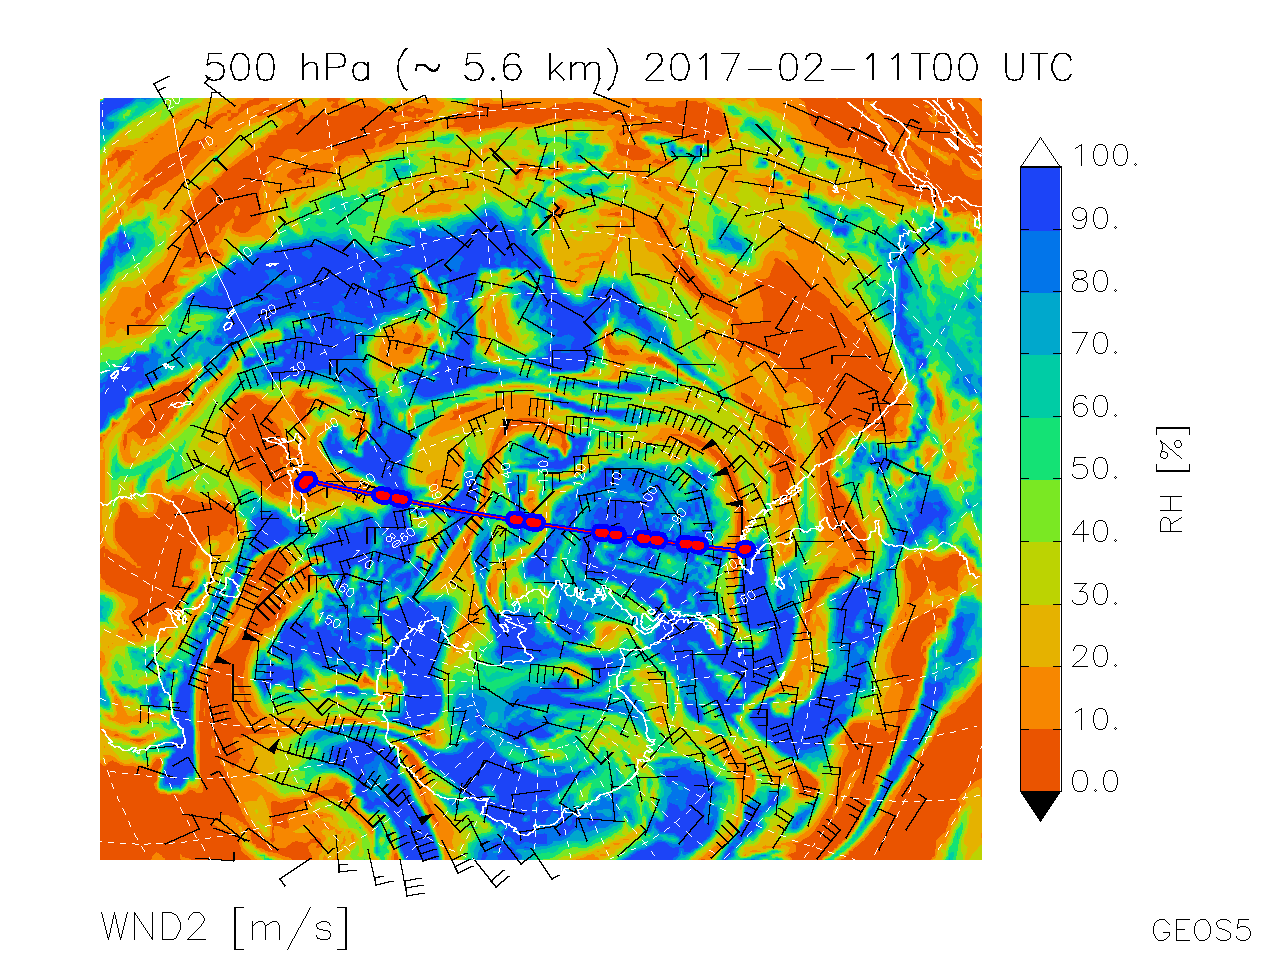
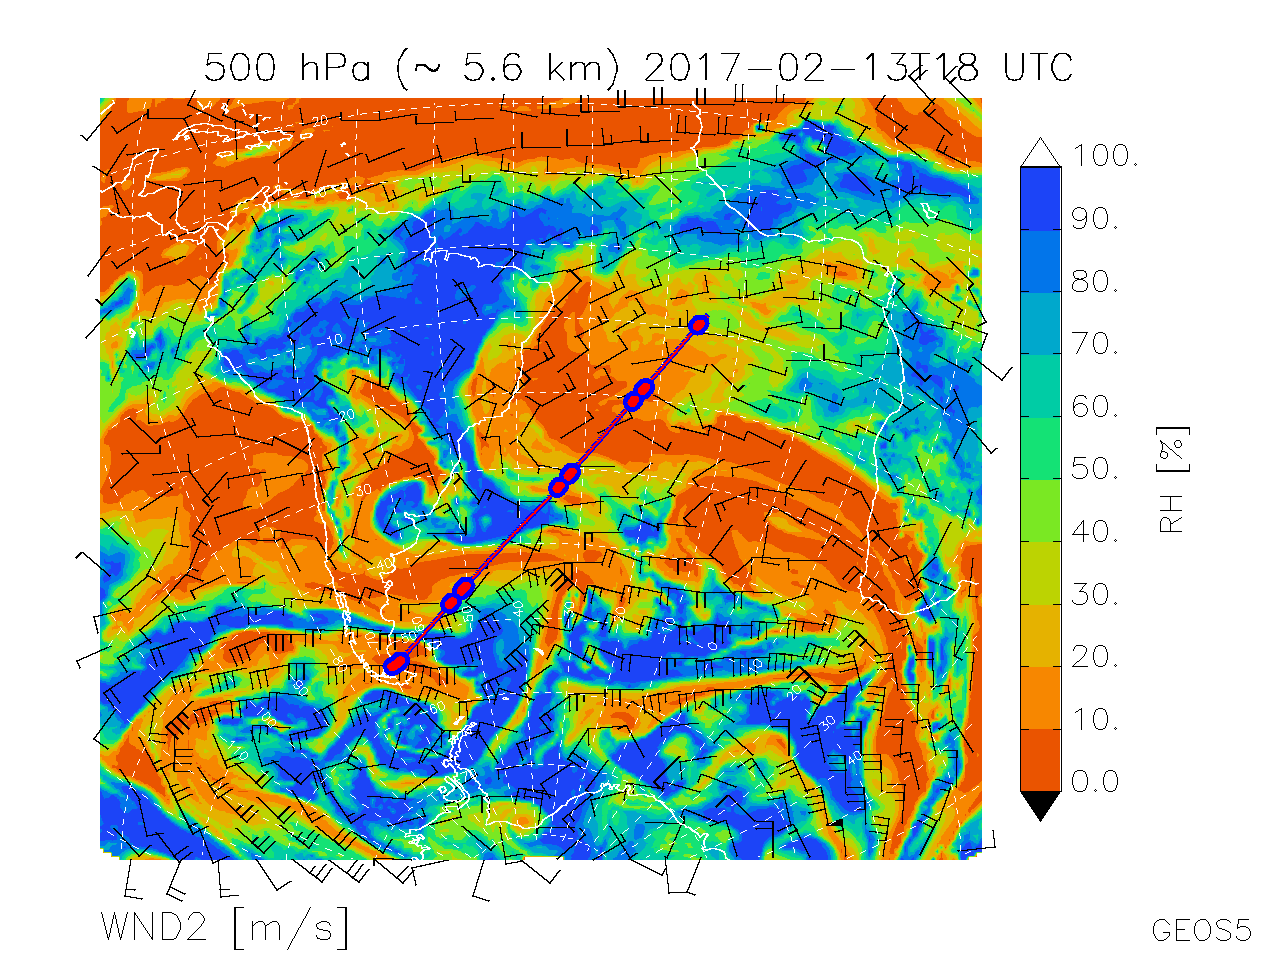
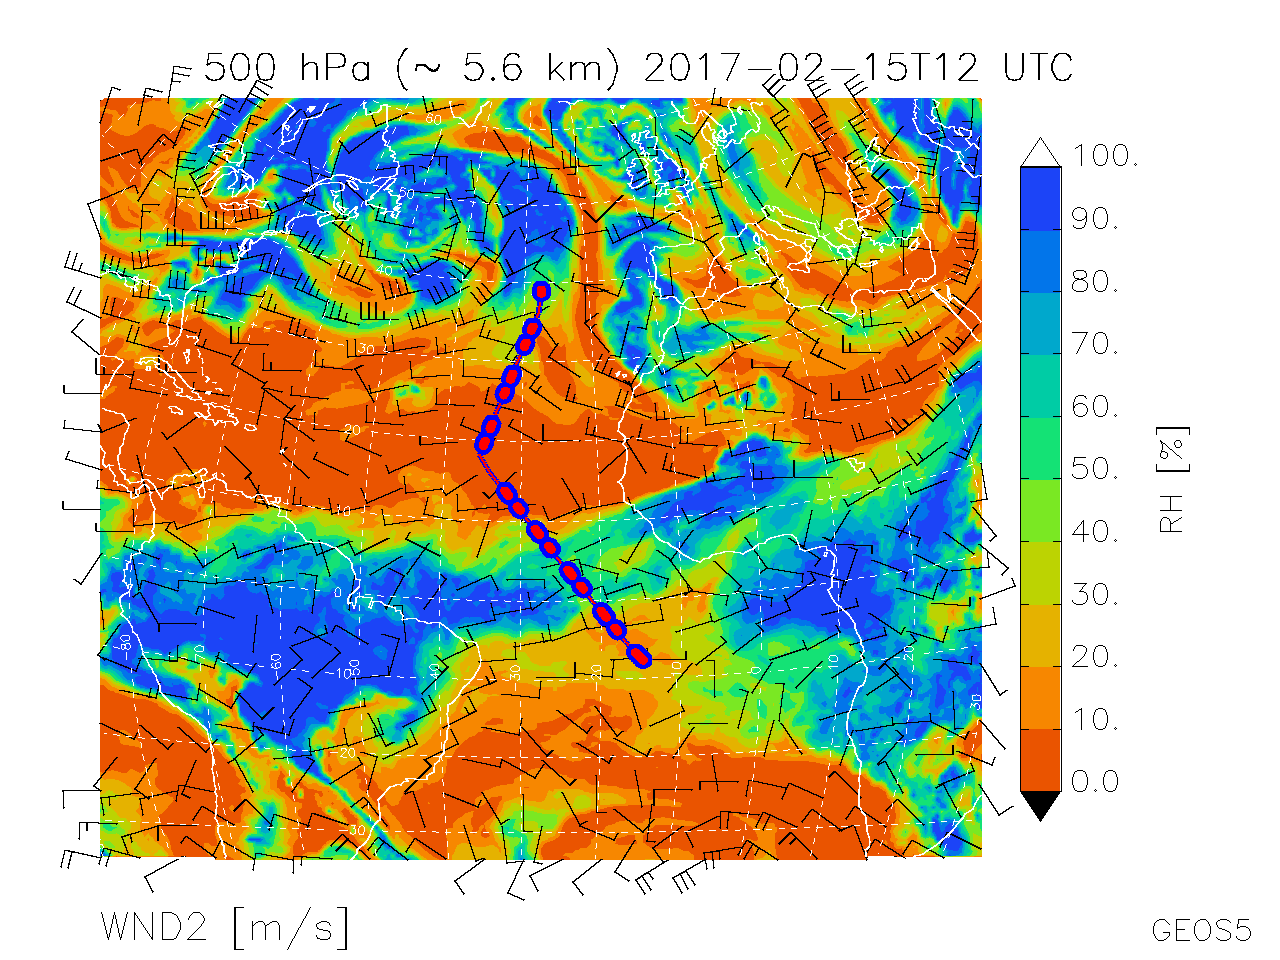
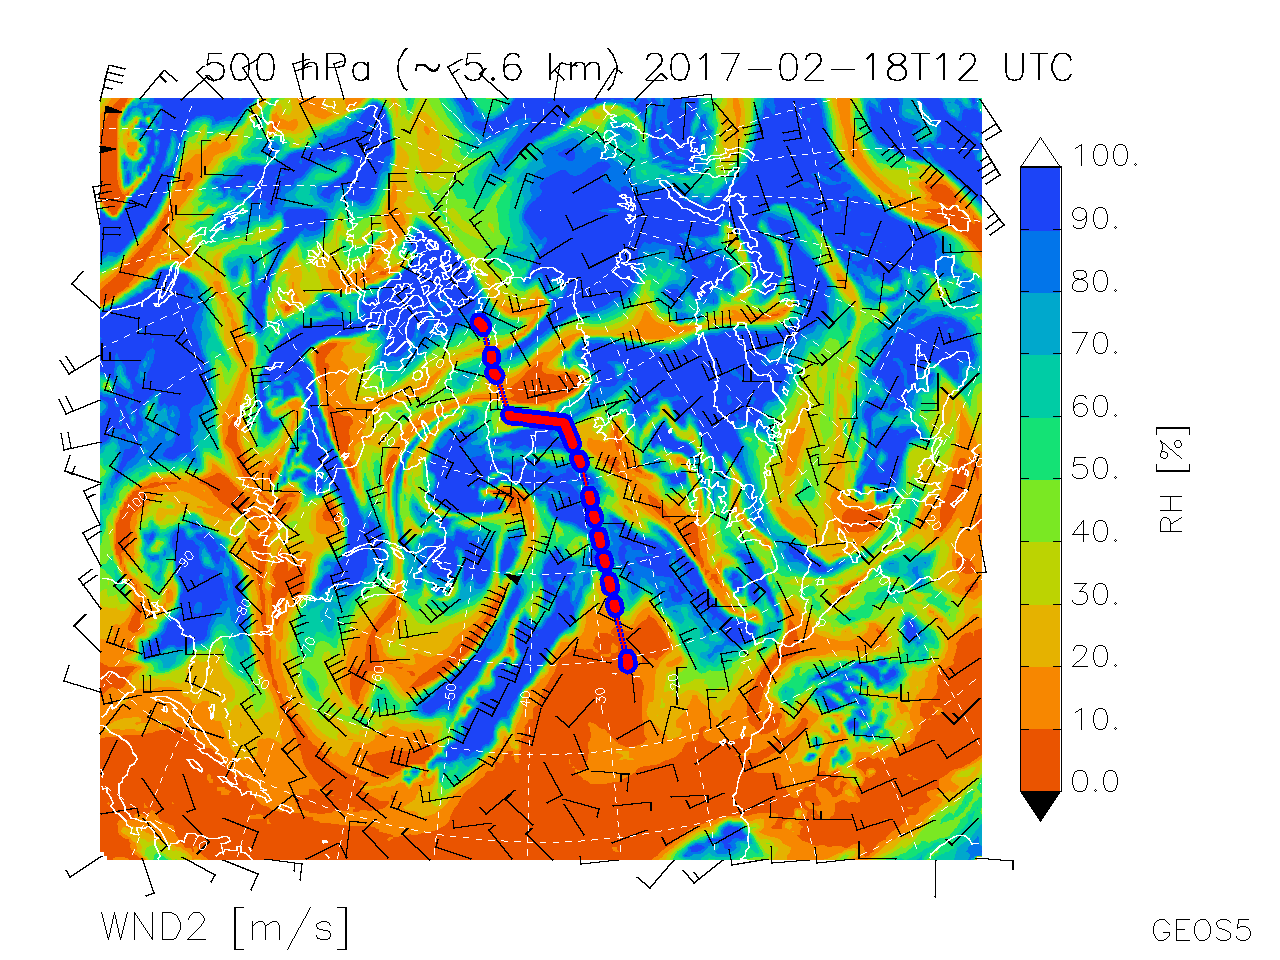
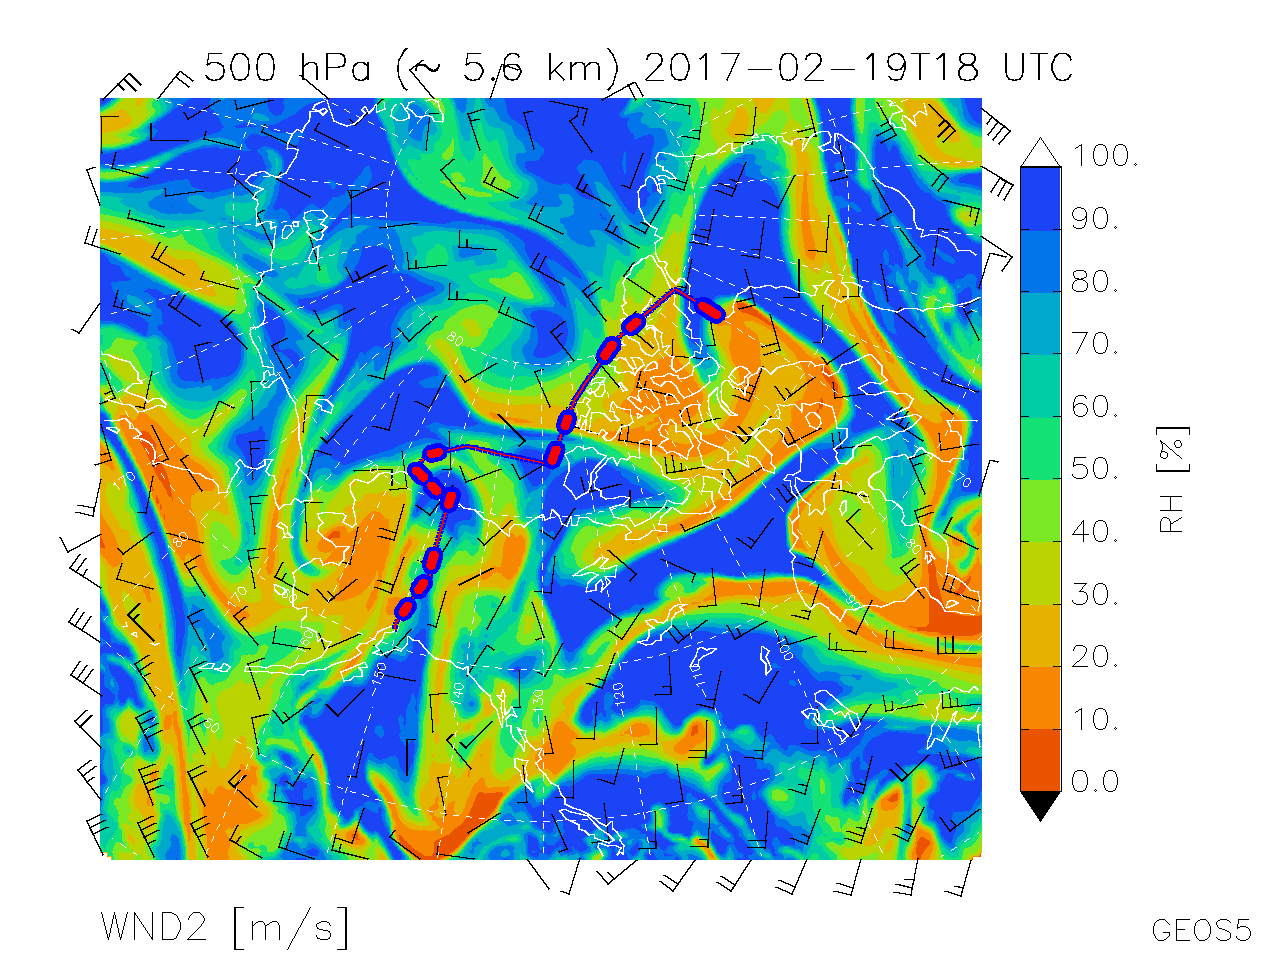
| Map of Rel. Humidity, Winds @ 500 hPa | 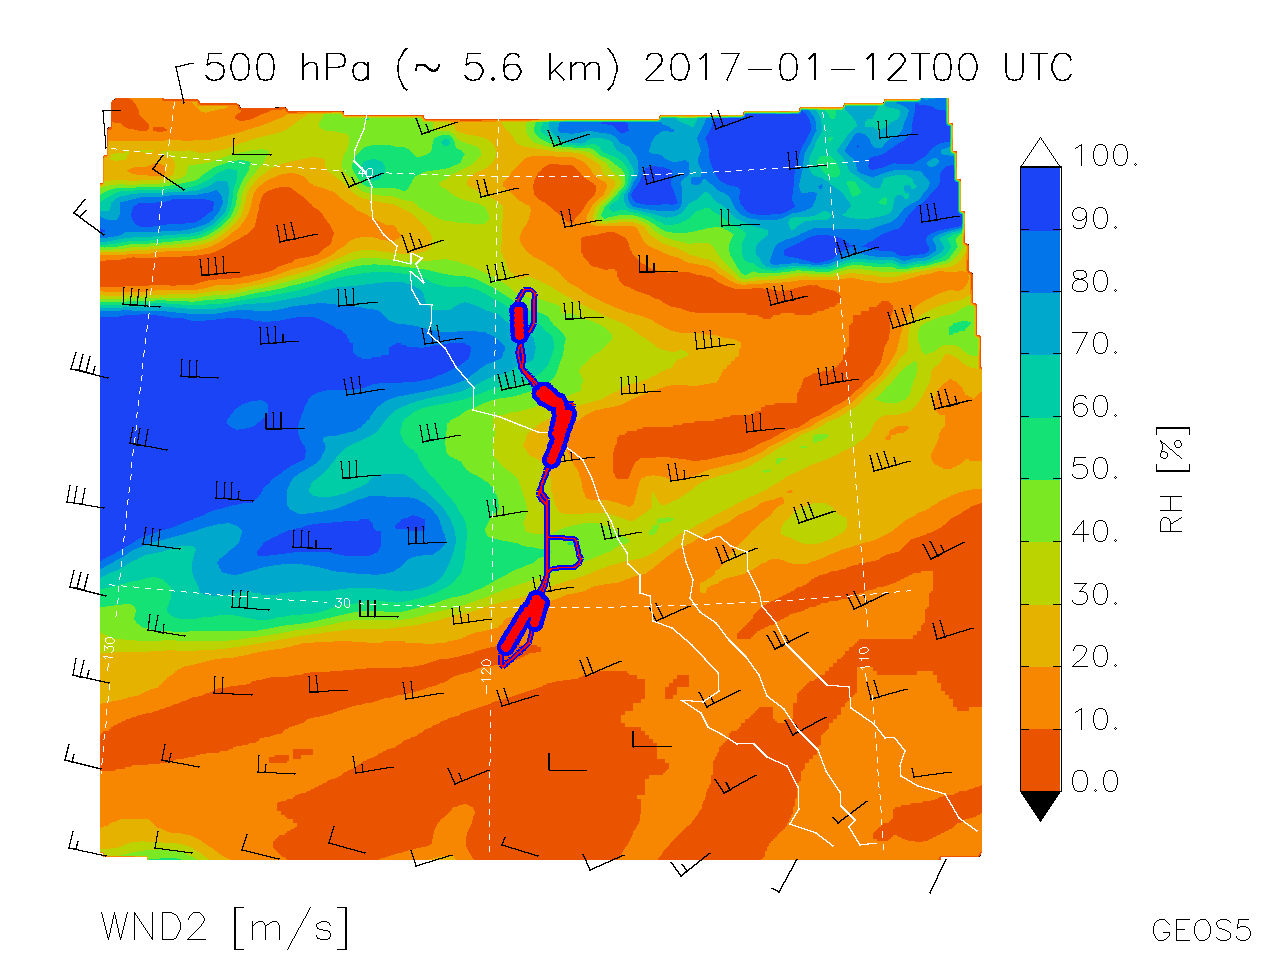 |
 |
 |
 |
 |
 |
 |
 |
 |
 |
 |
 |
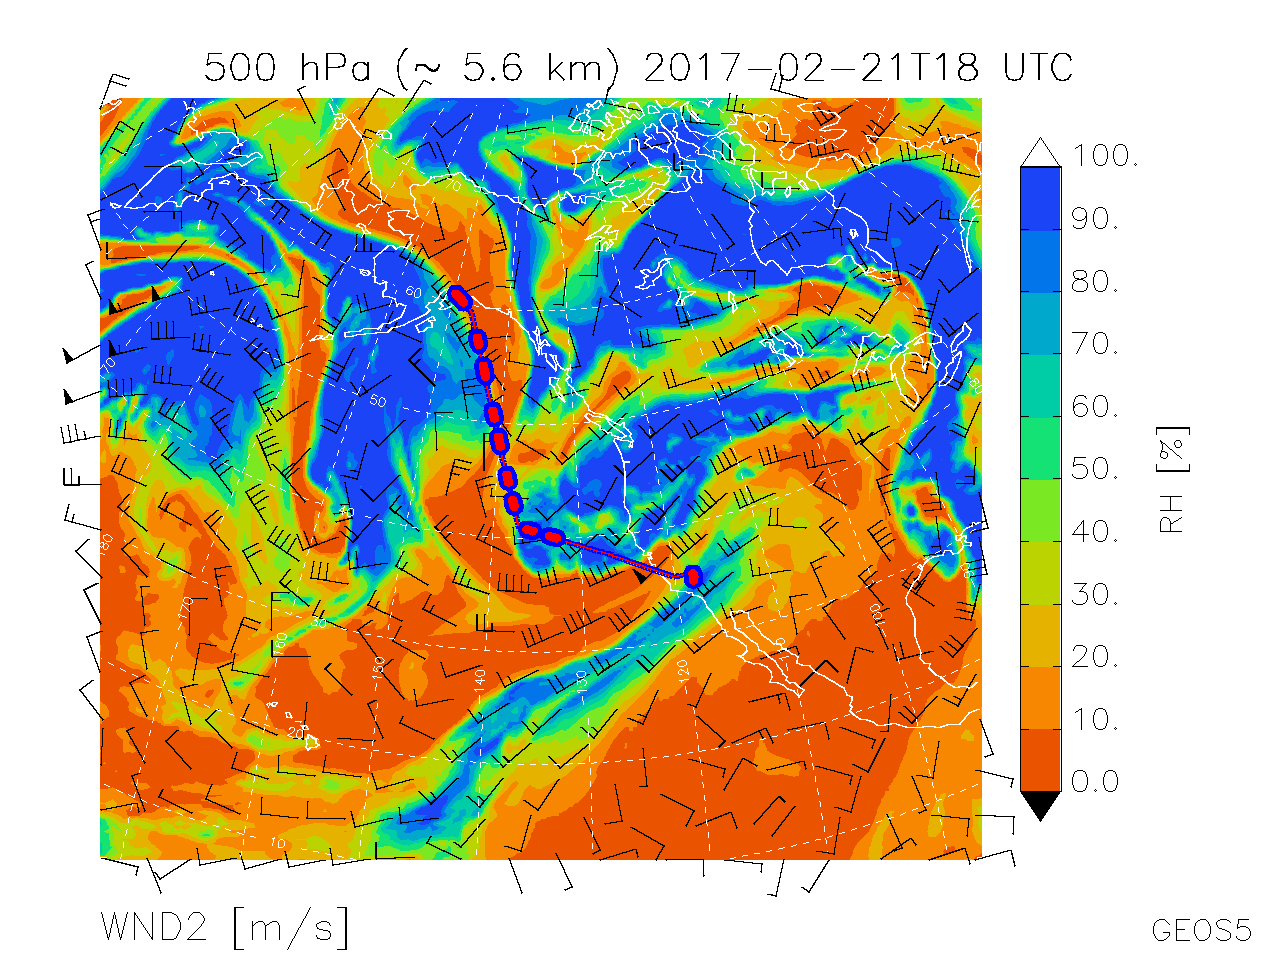 |
Map of Rel. Humidity, Winds @ 500 hPa |
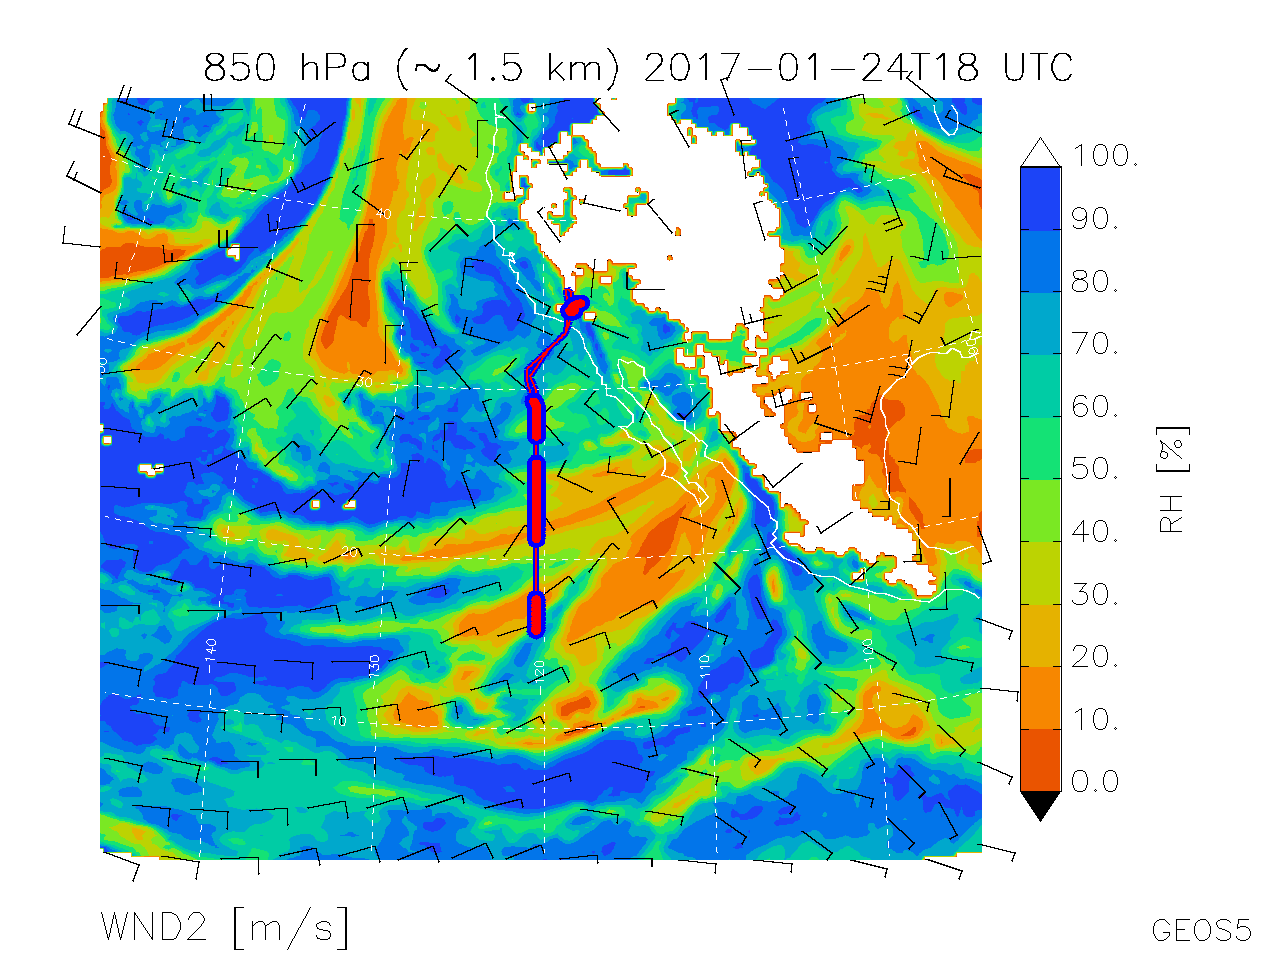
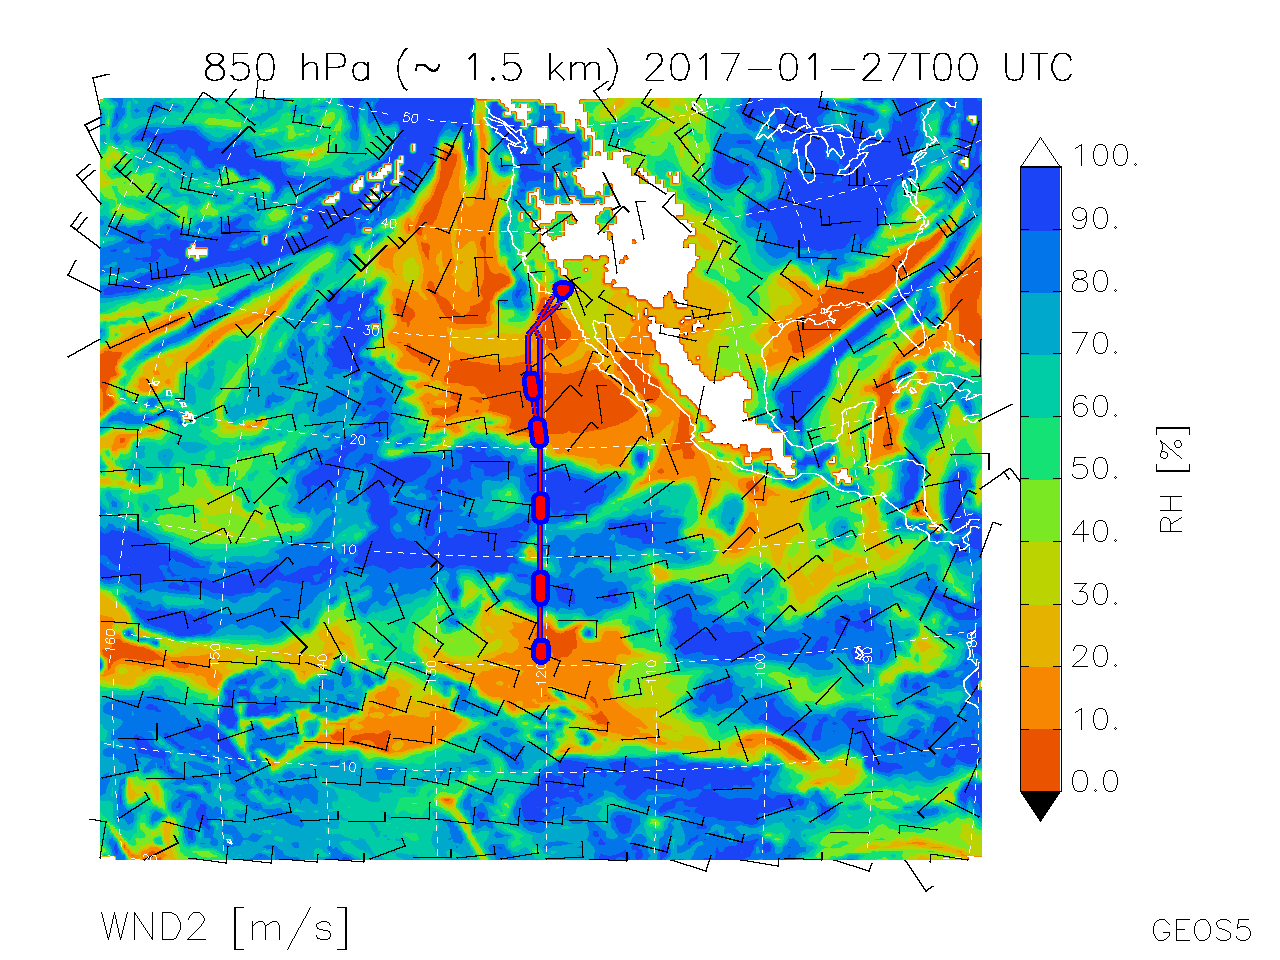
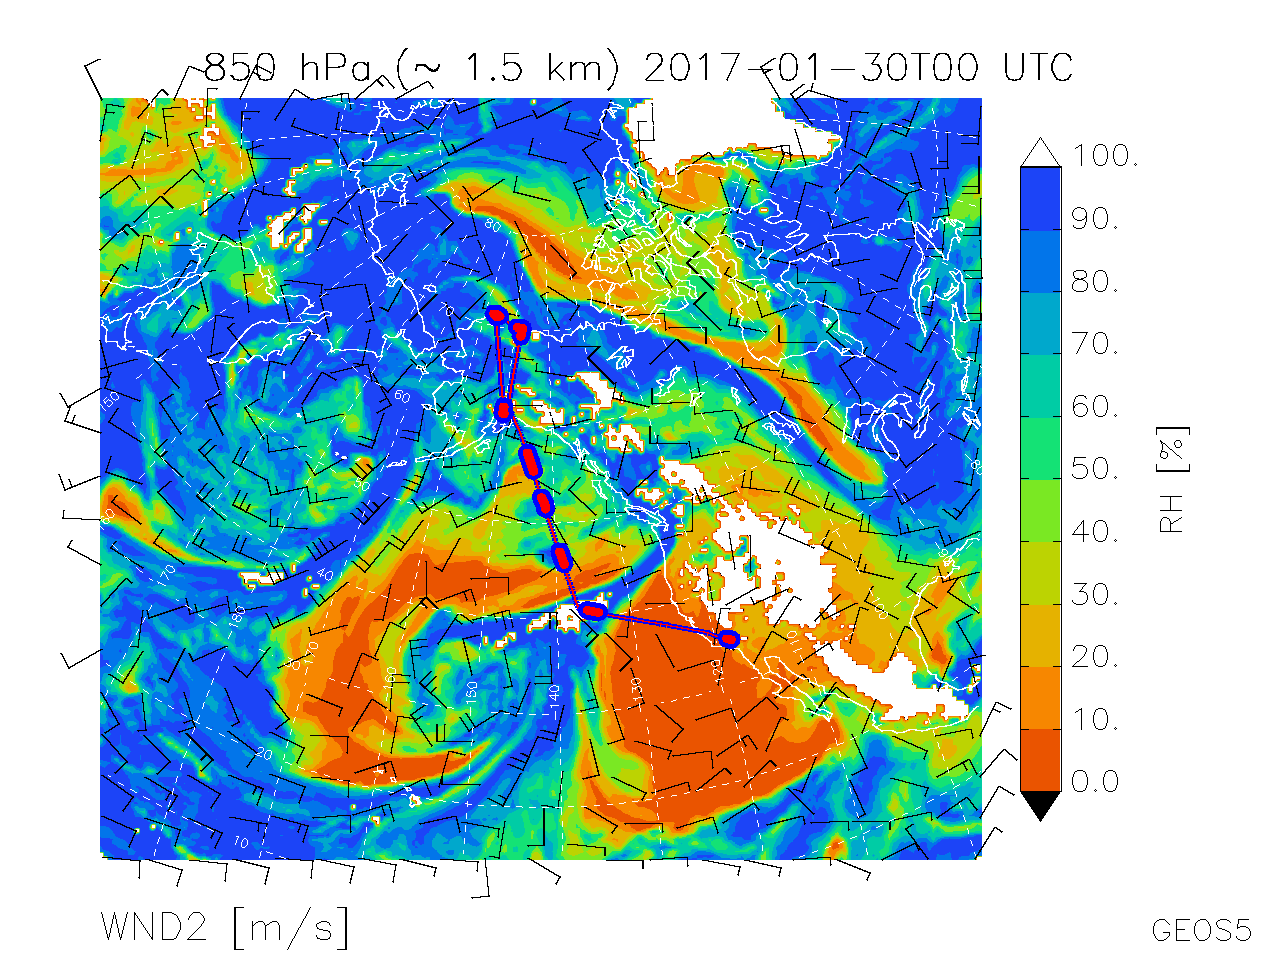
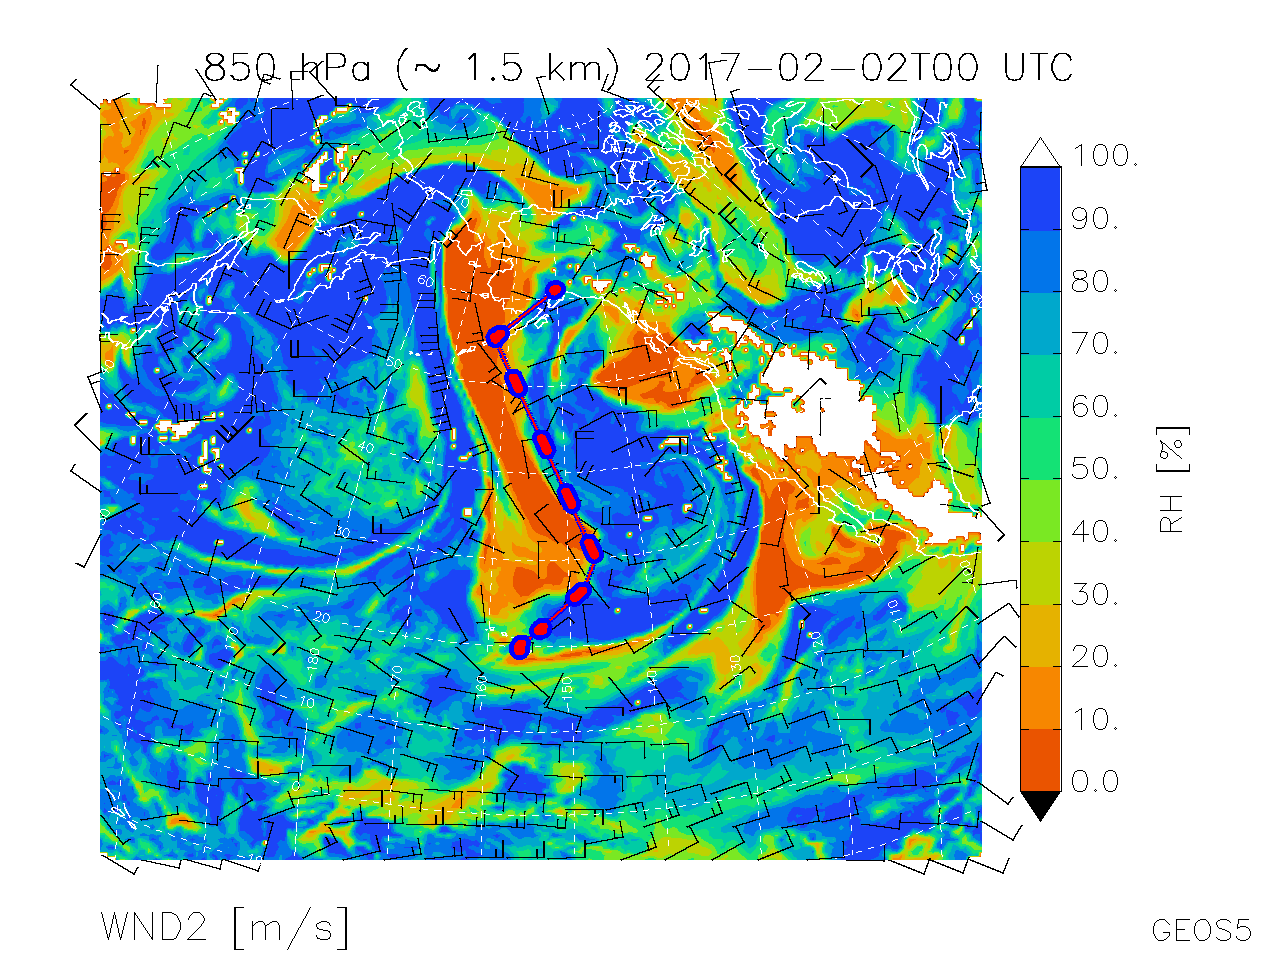
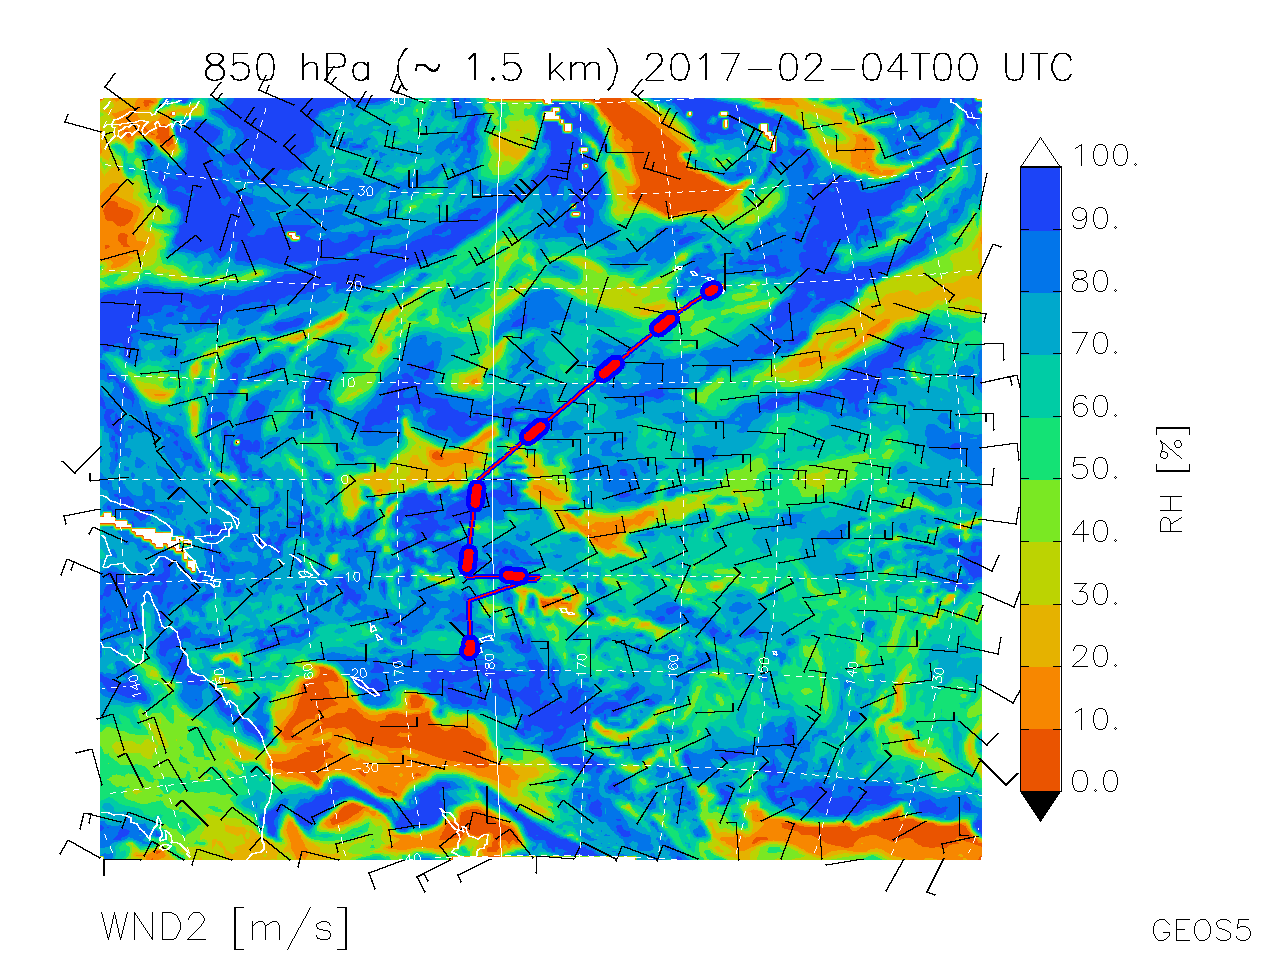
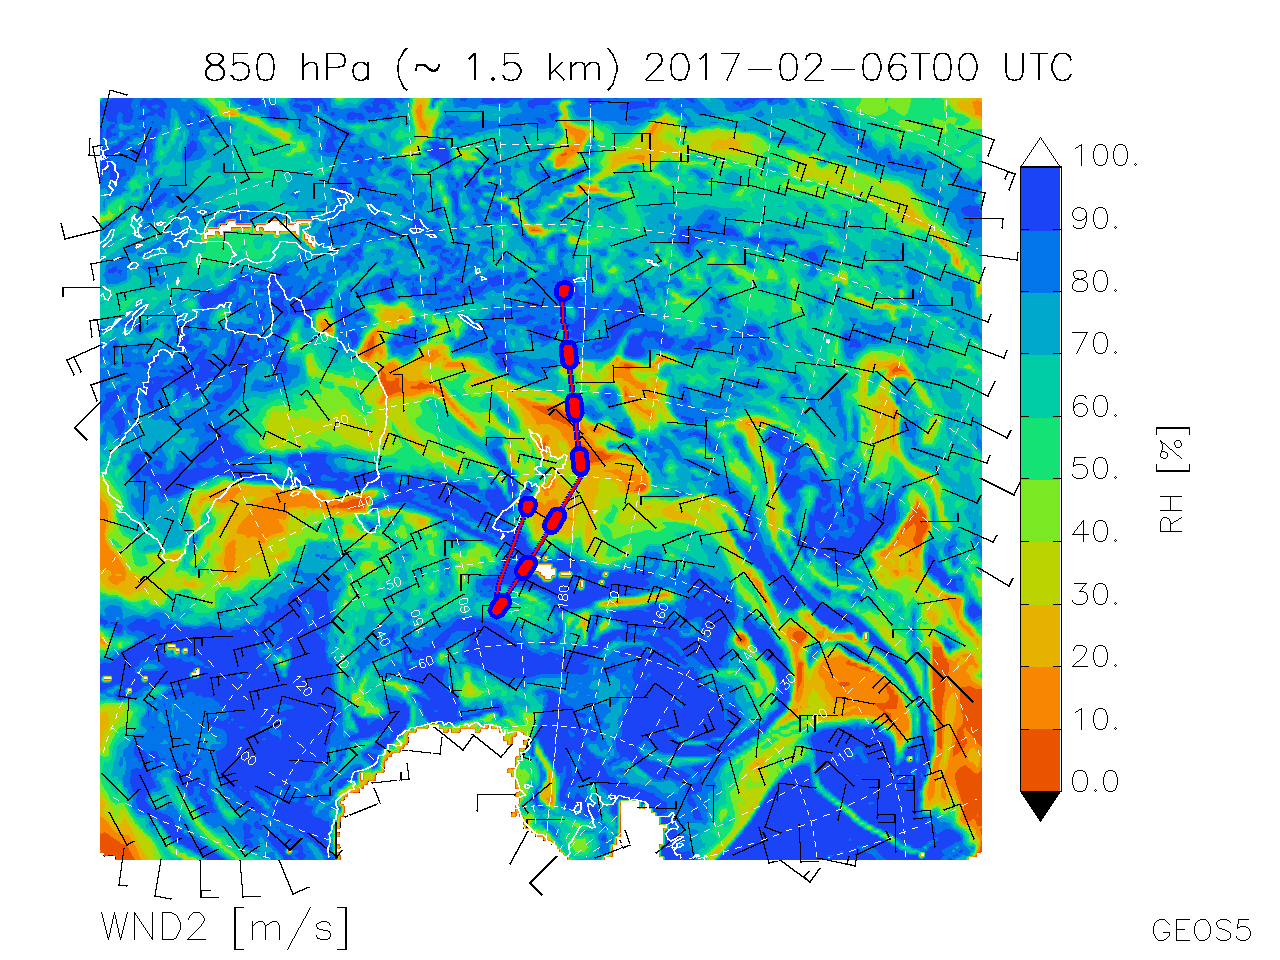
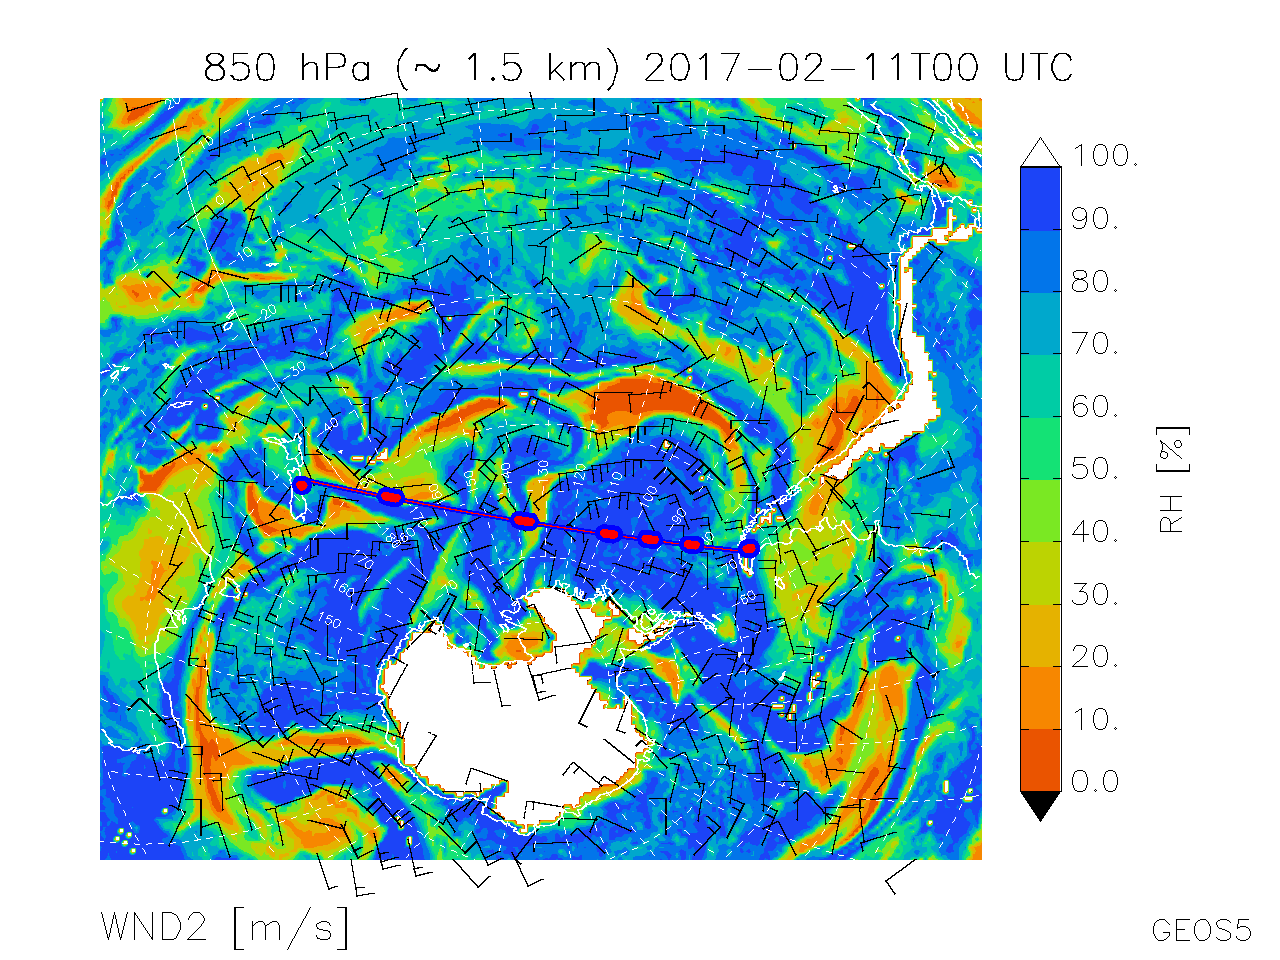
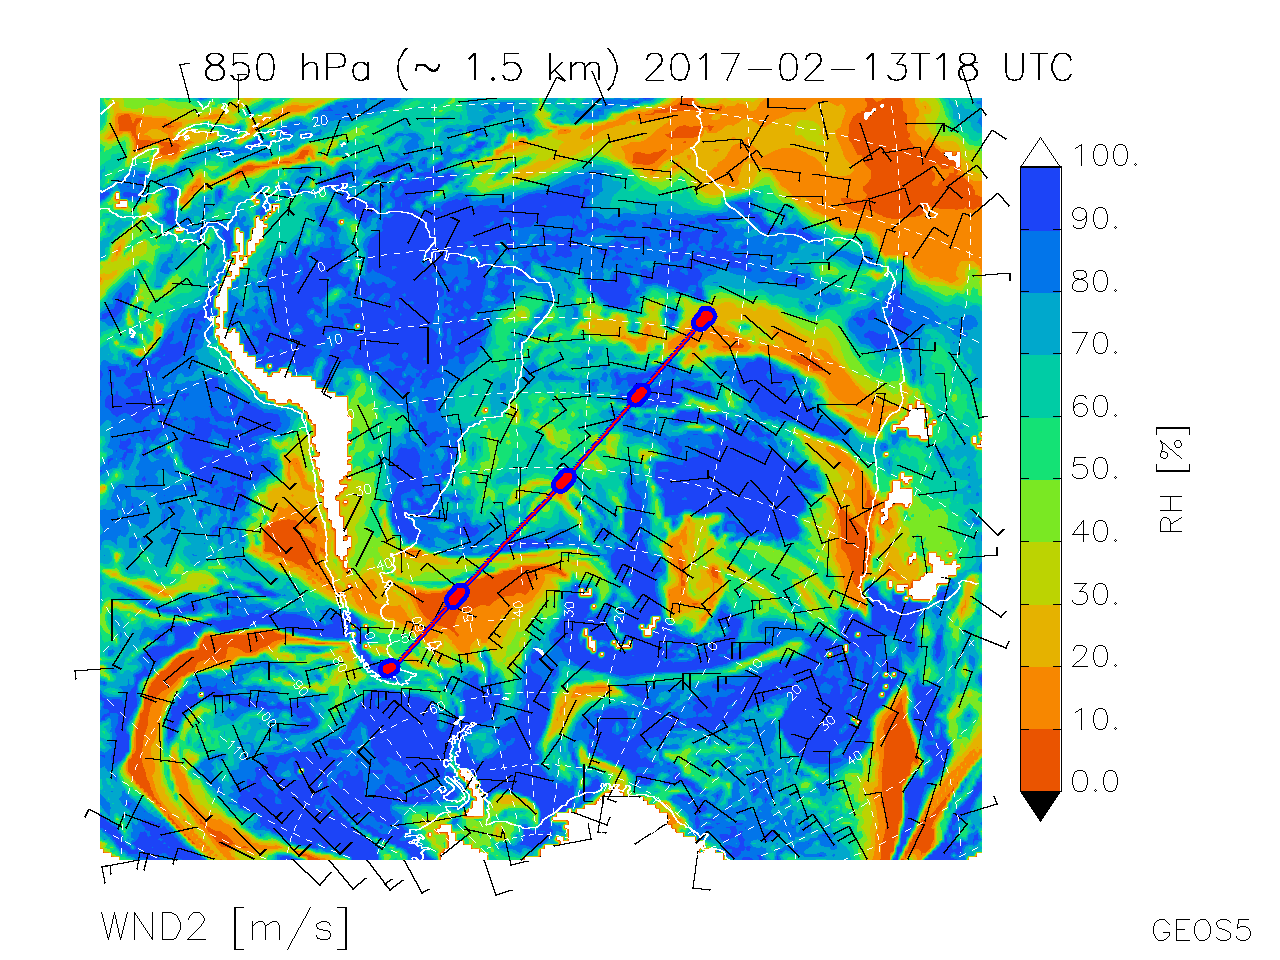
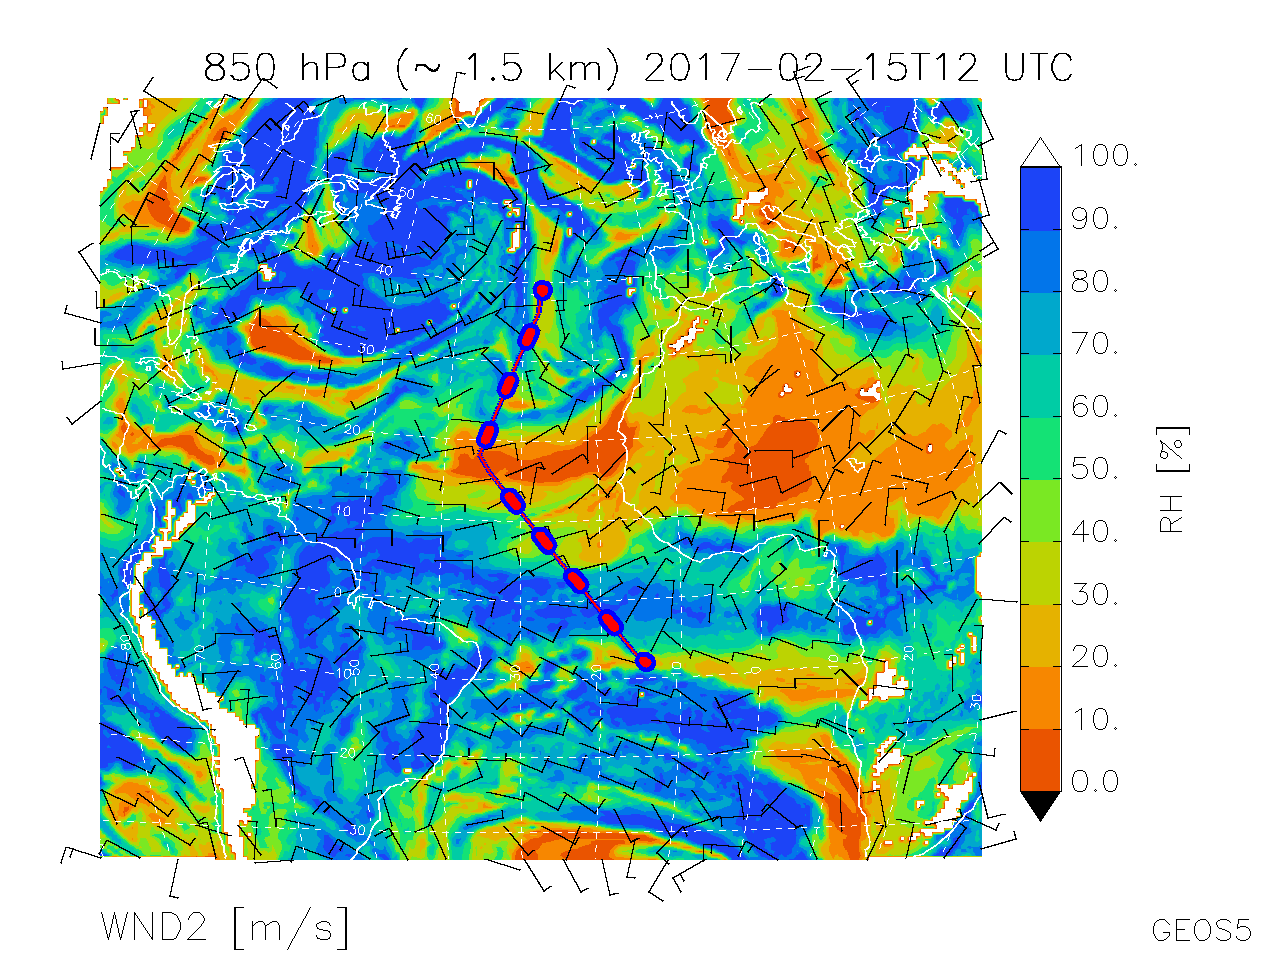
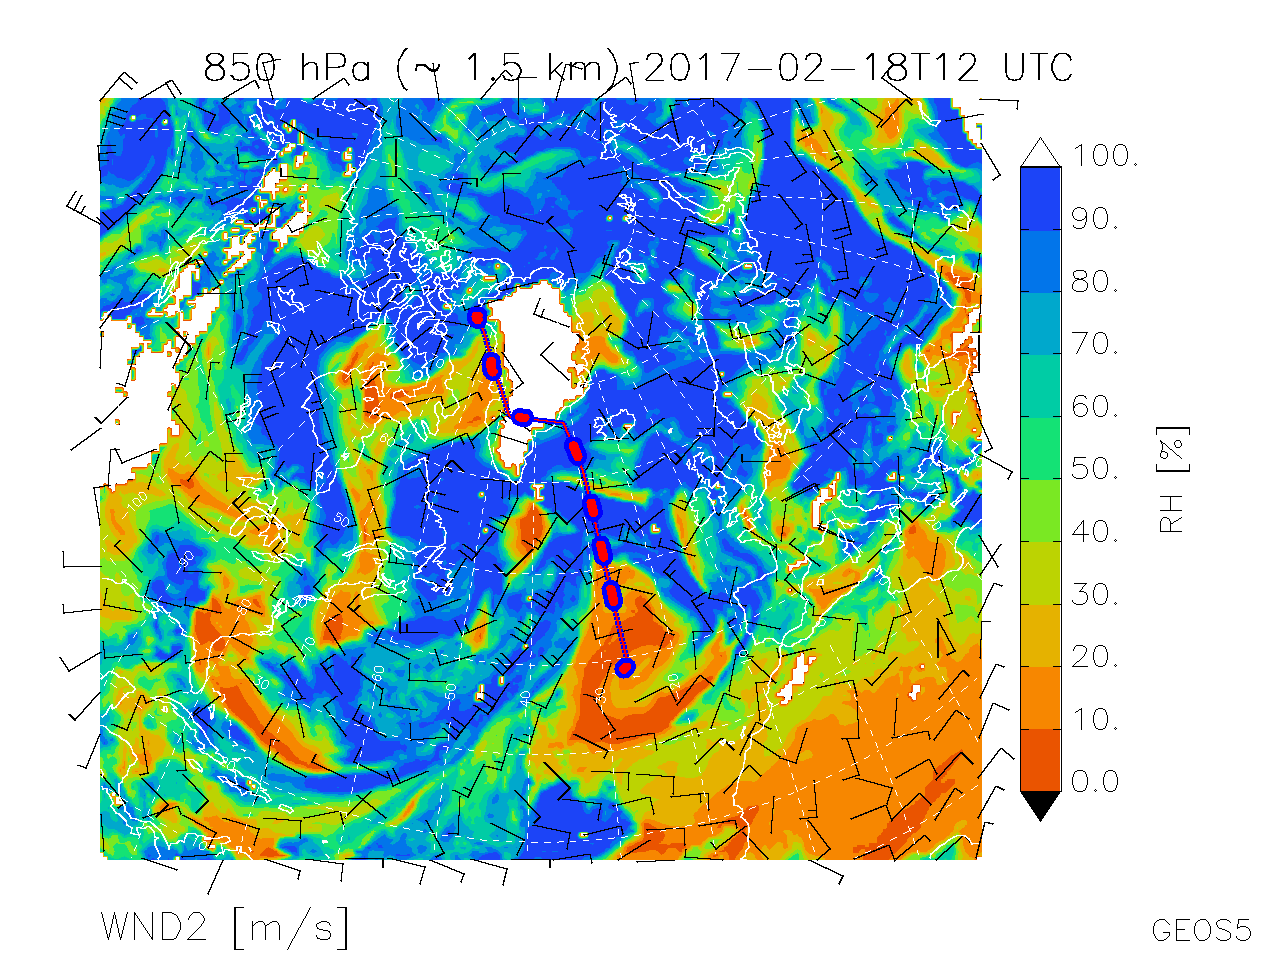
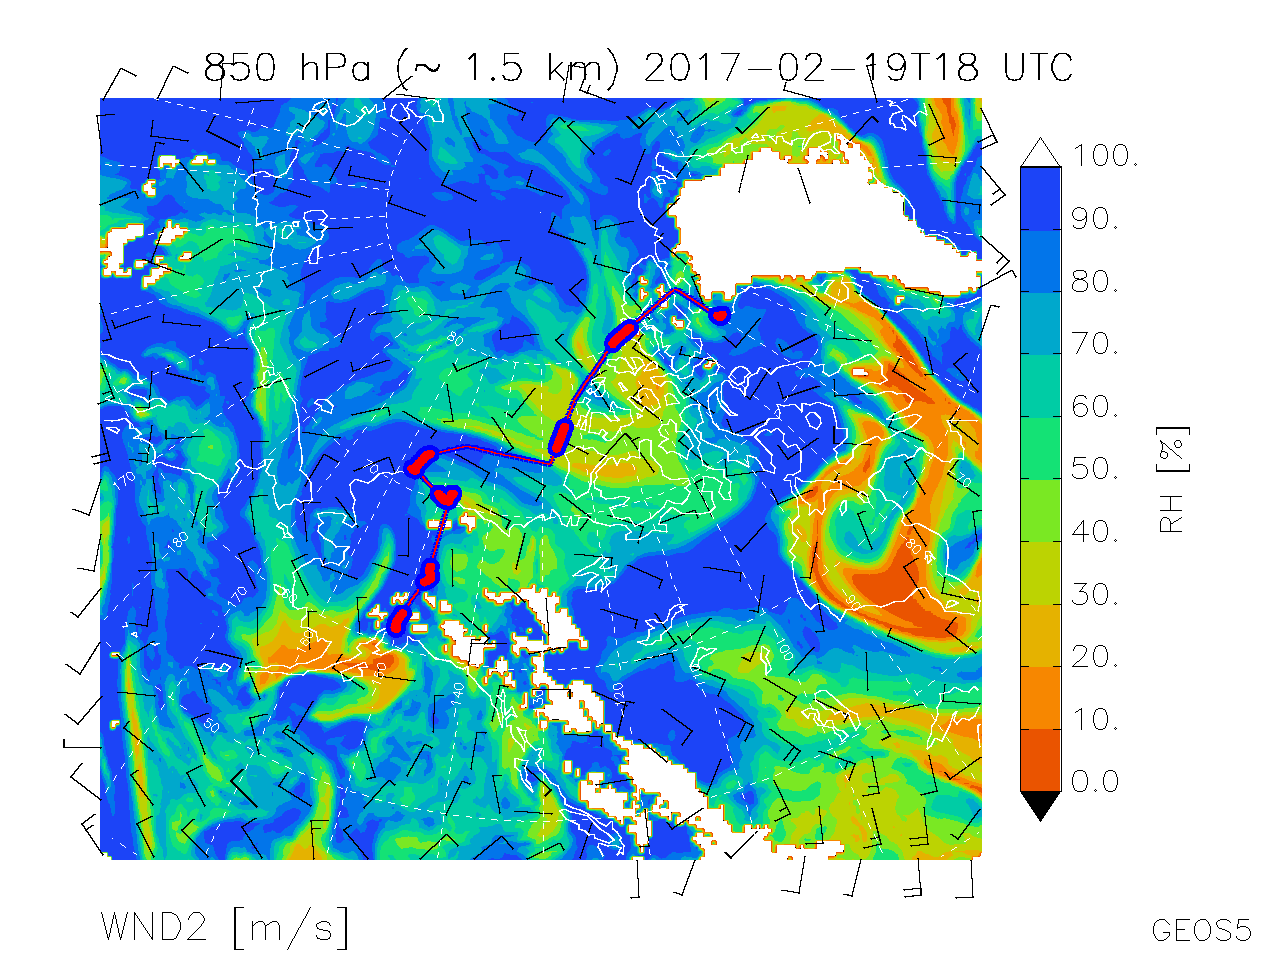
| Map of Rel. Humidity, Winds @ 850 hPa | 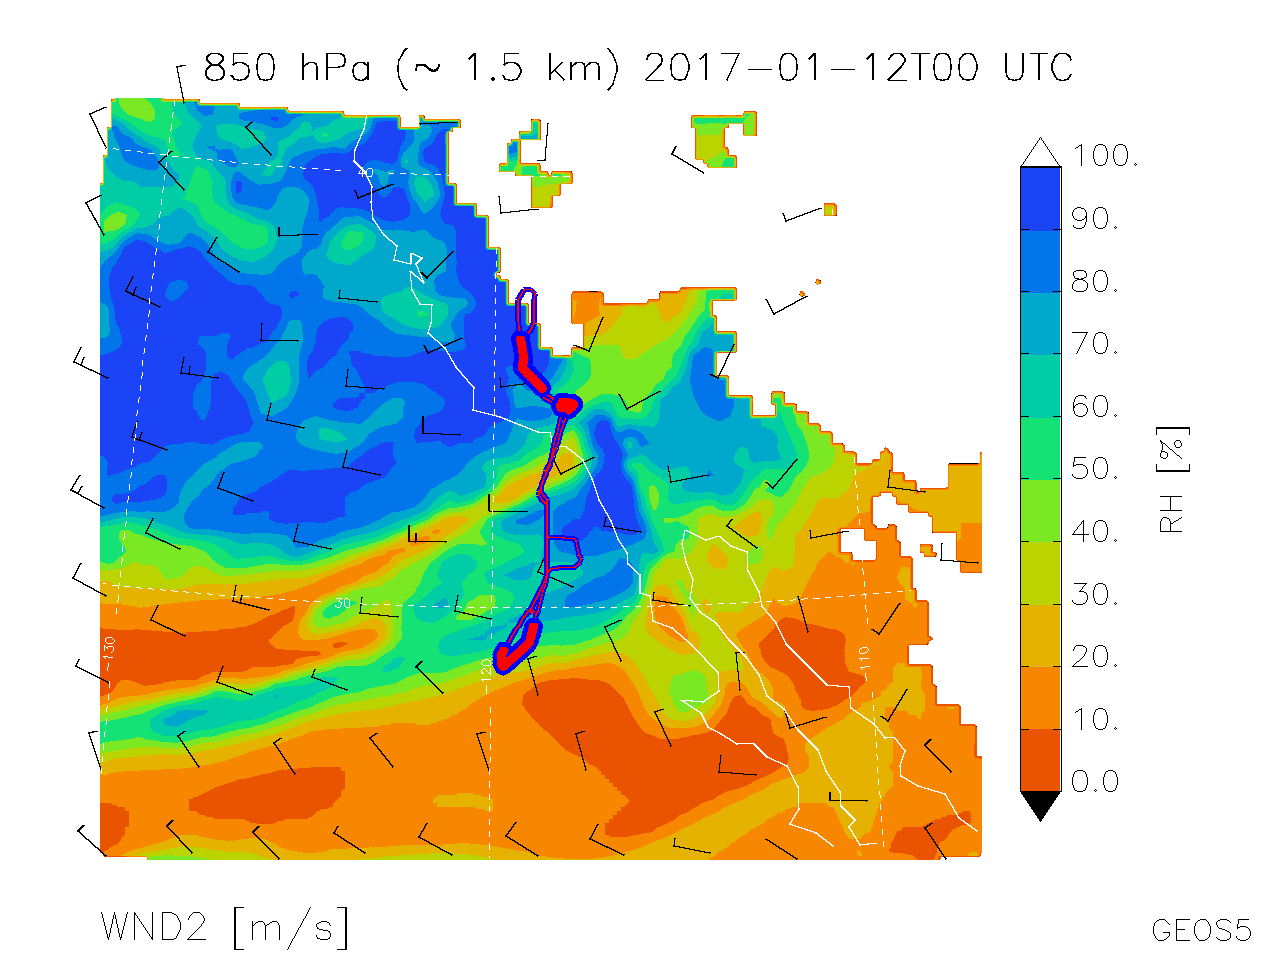 |
 |
 |
 |
 |
 |
 |
 |
 |
 |
 |
 |
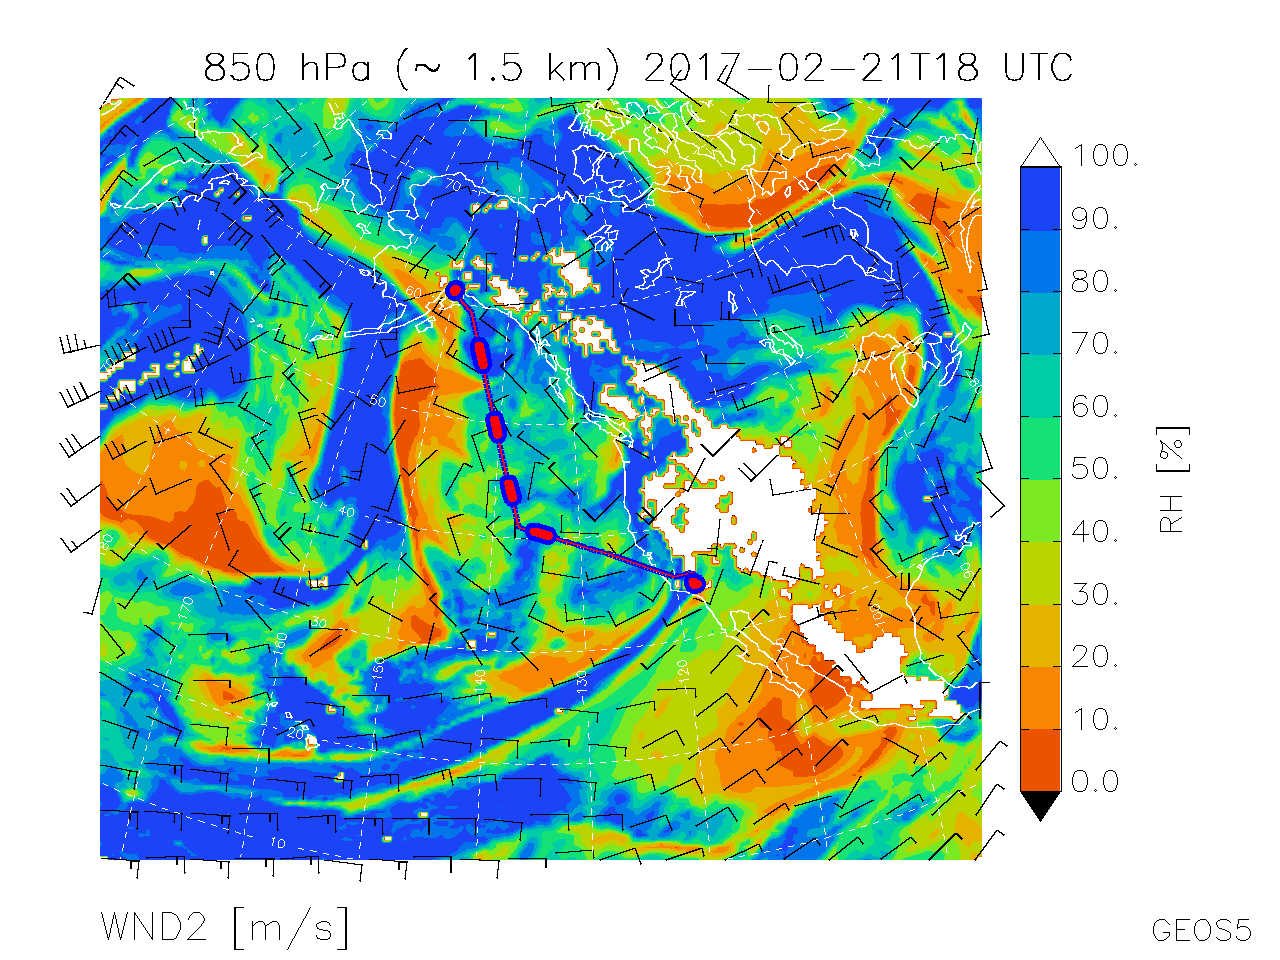 |
Map of Rel. Humidity, Winds @ 850 hPa |
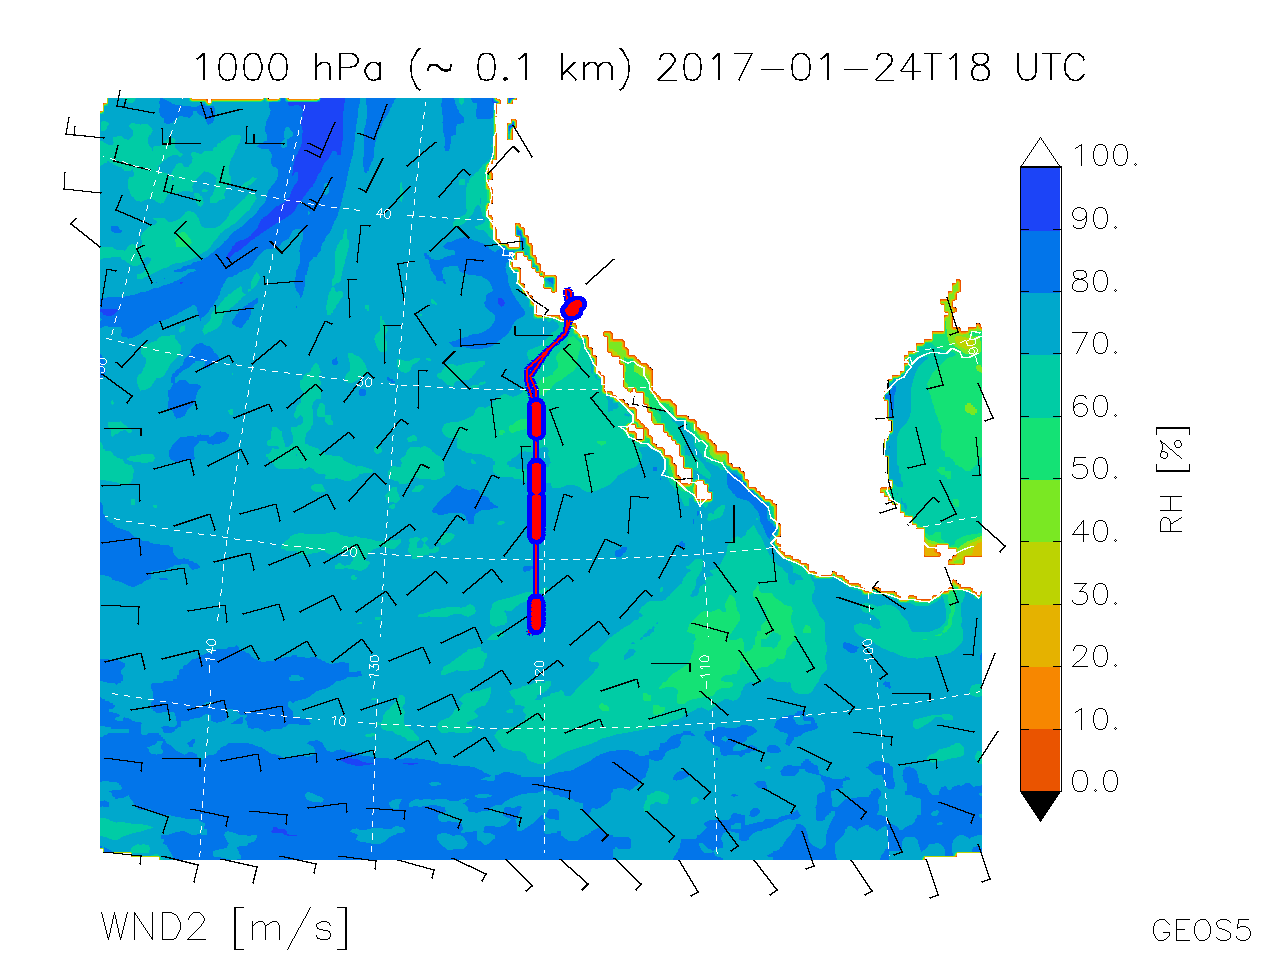
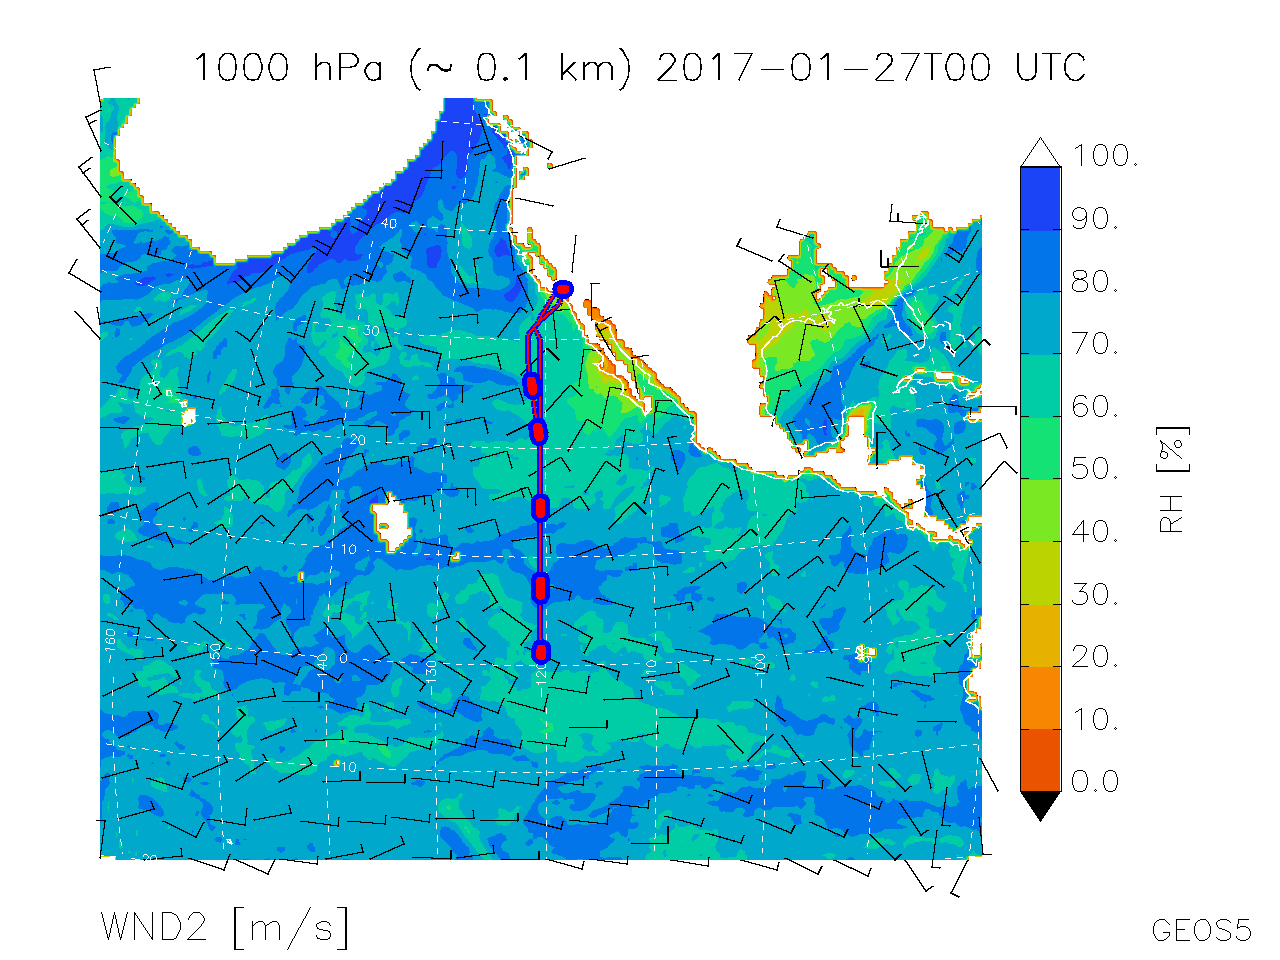
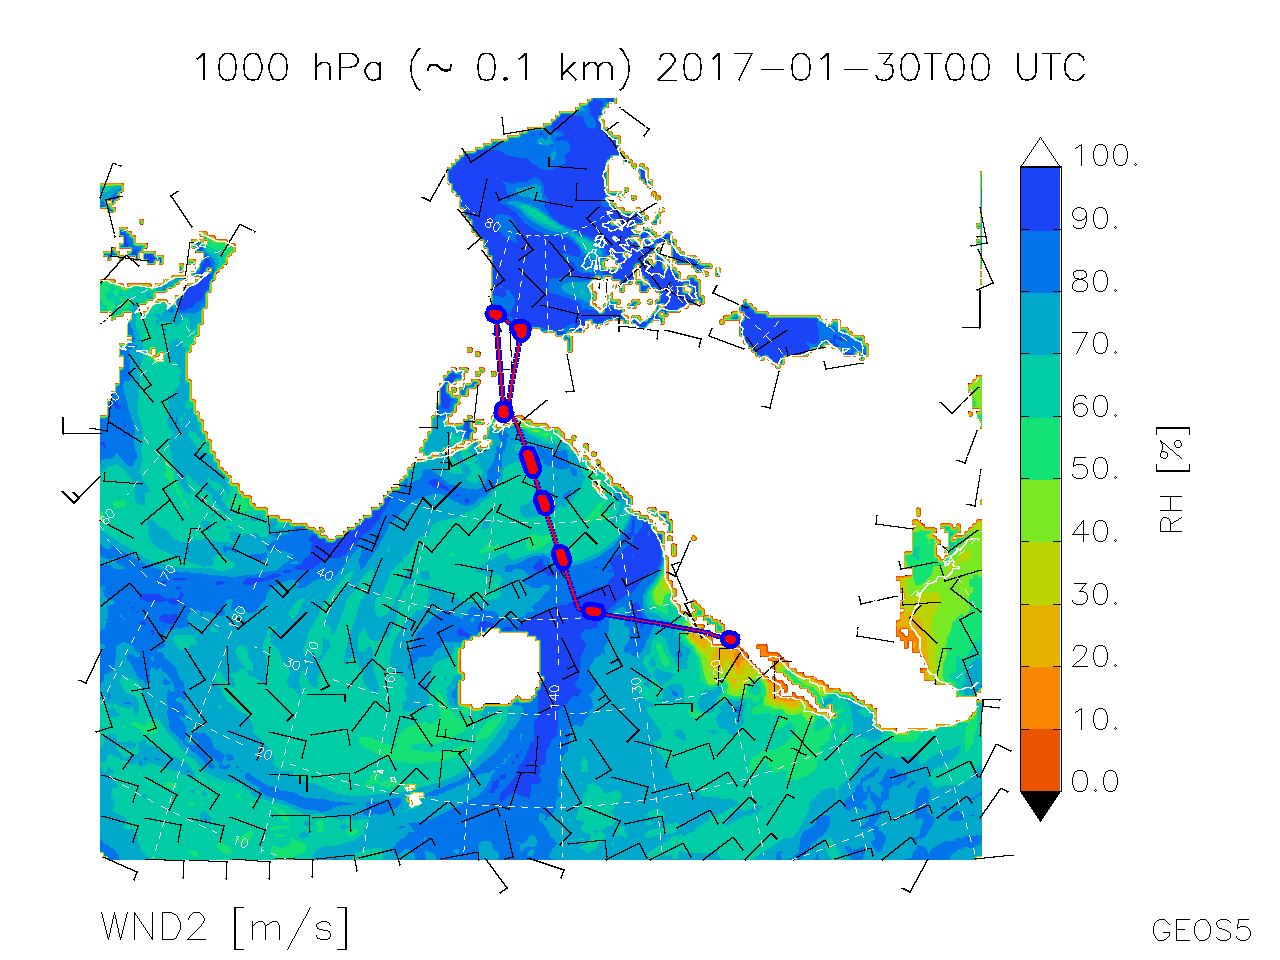
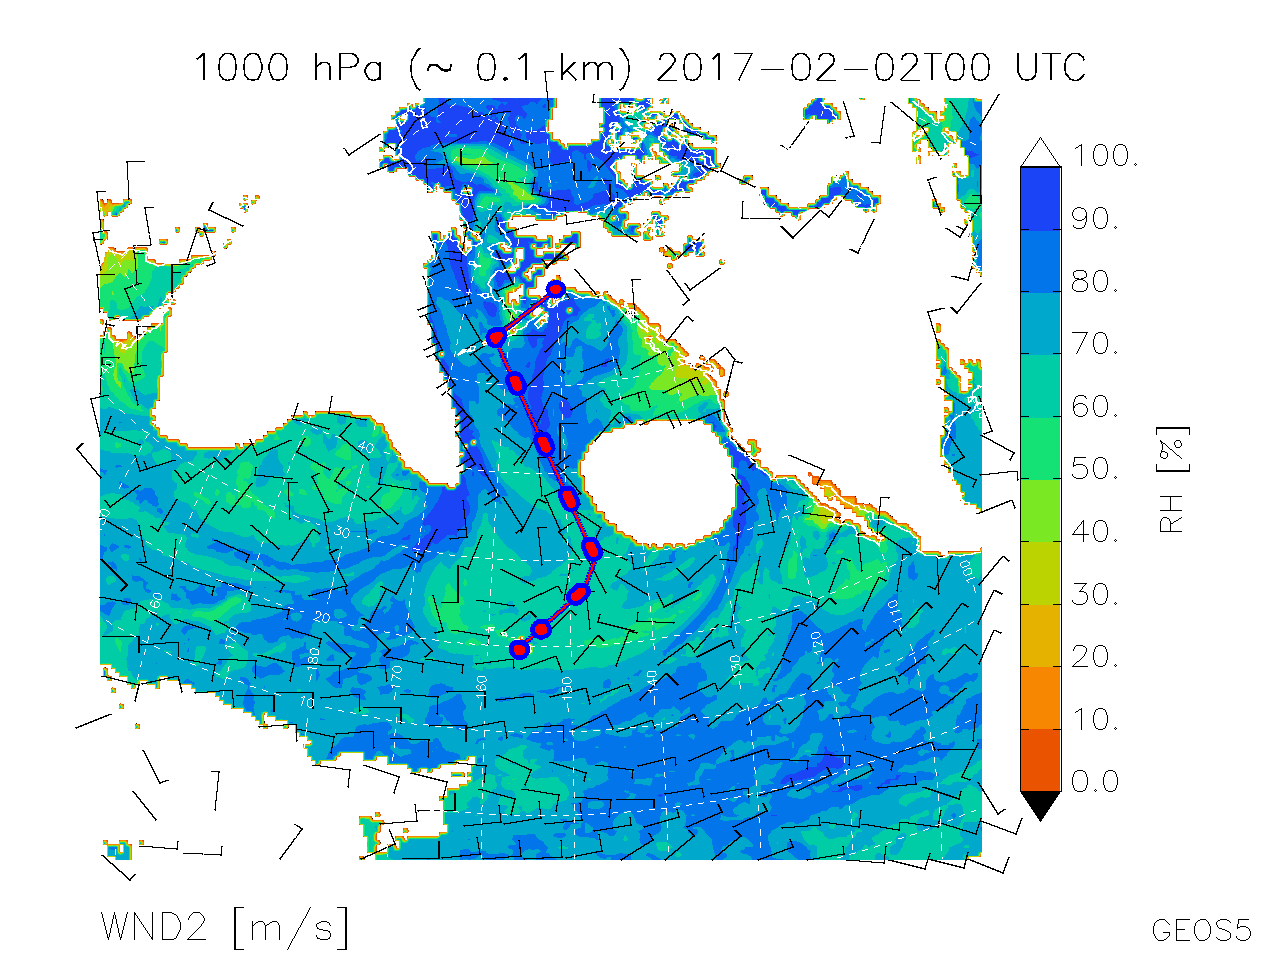
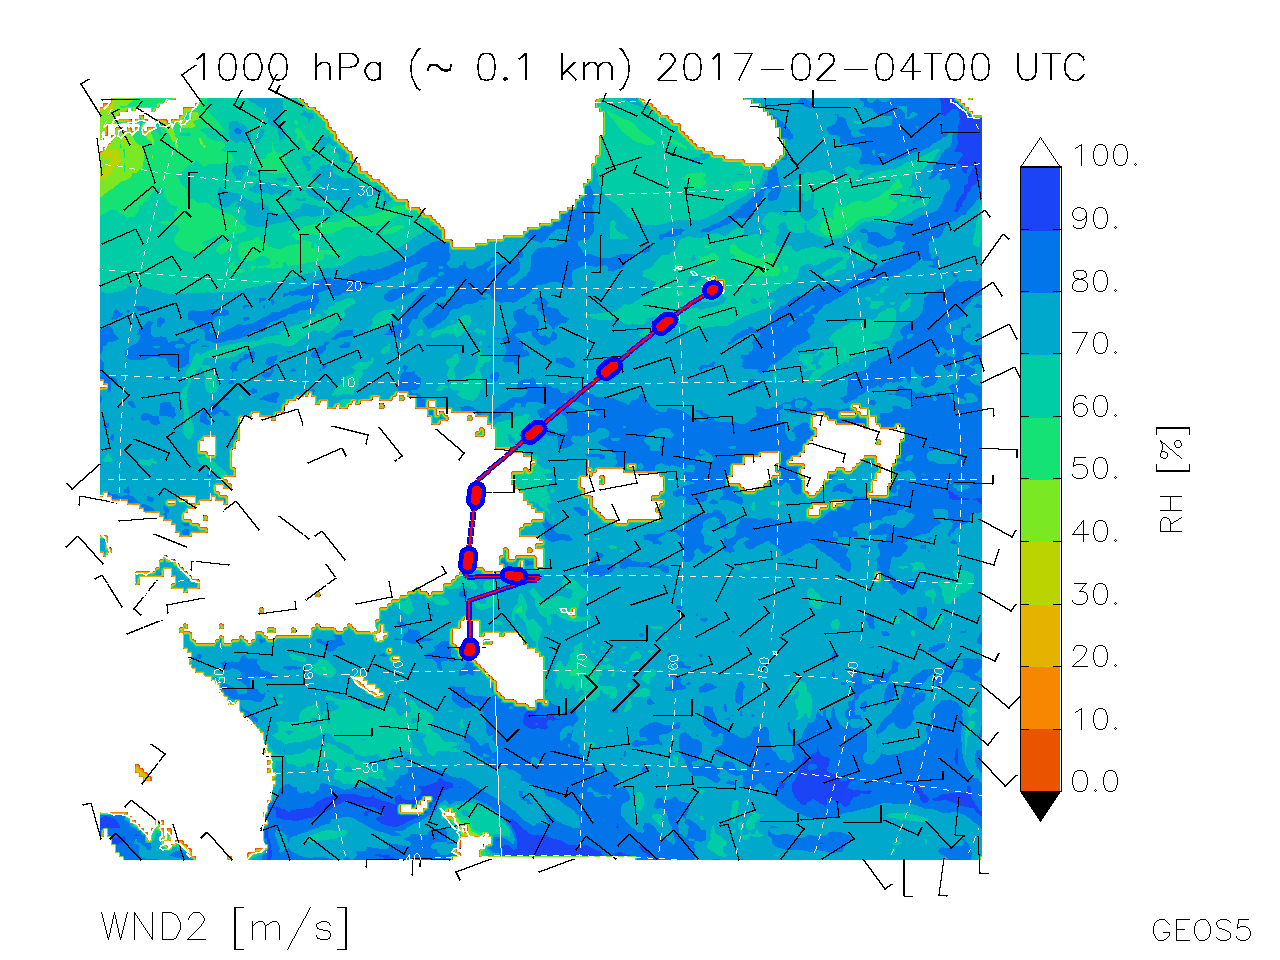
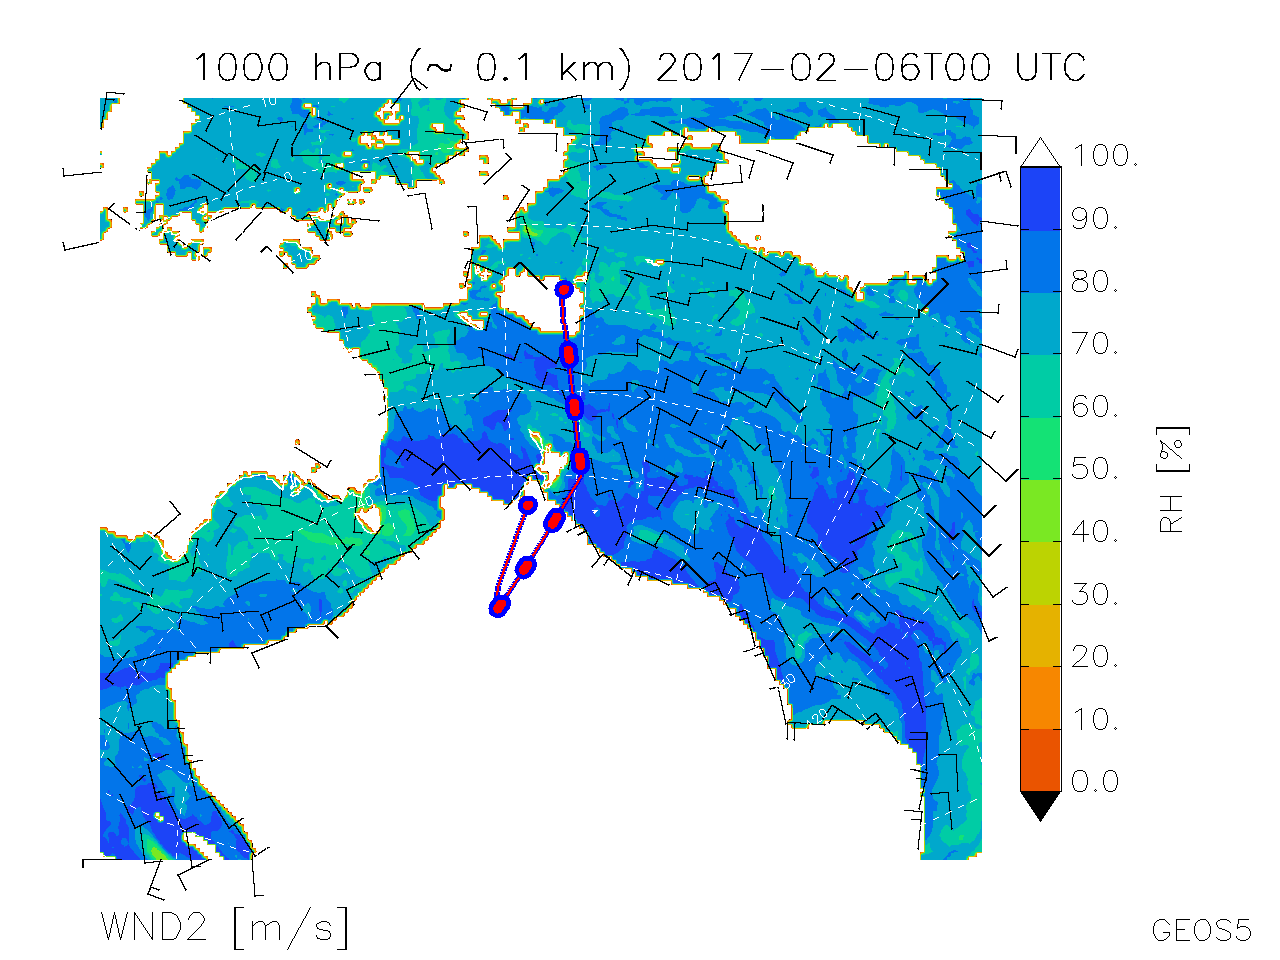
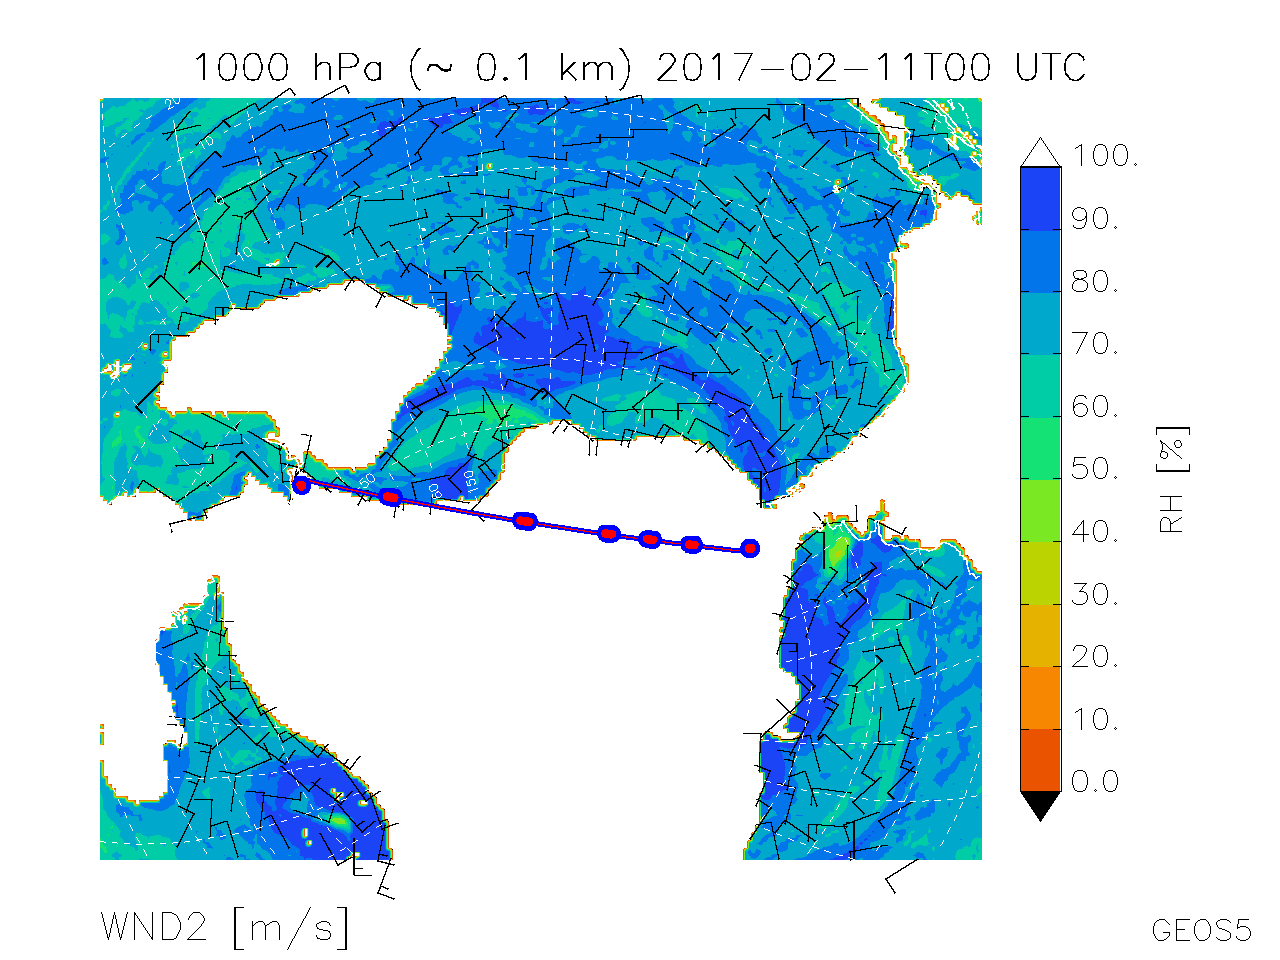
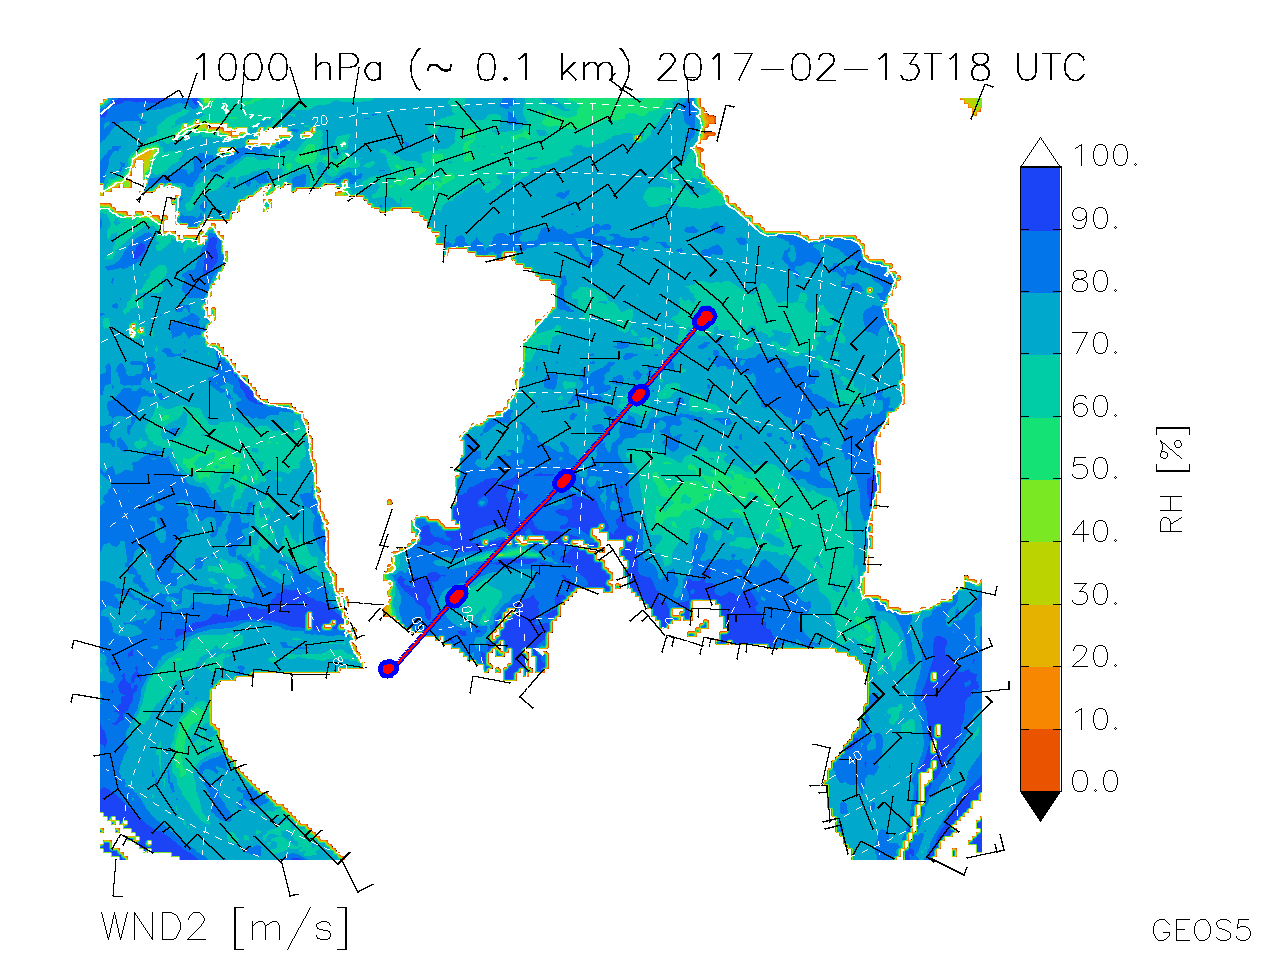
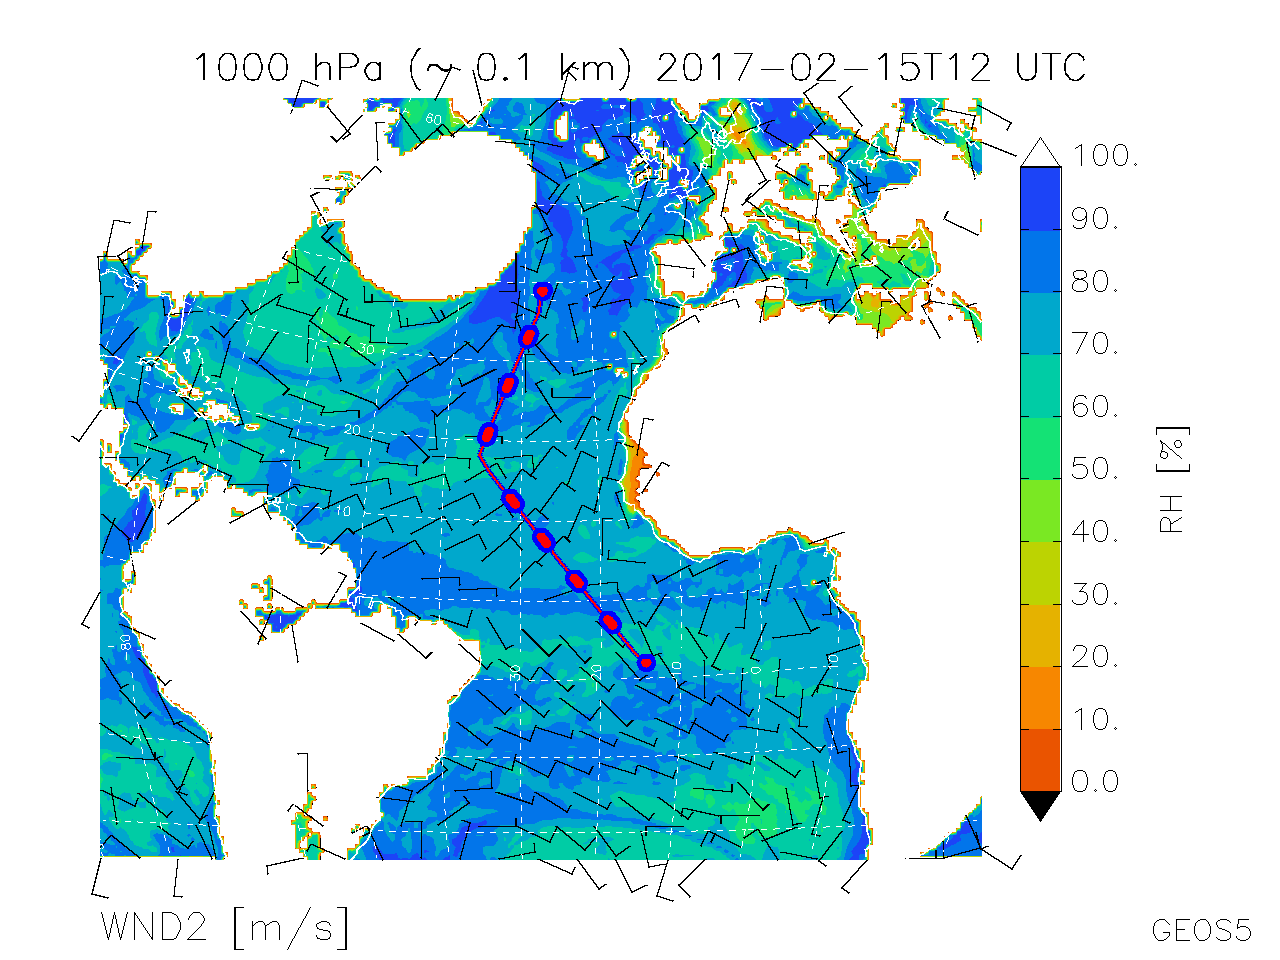
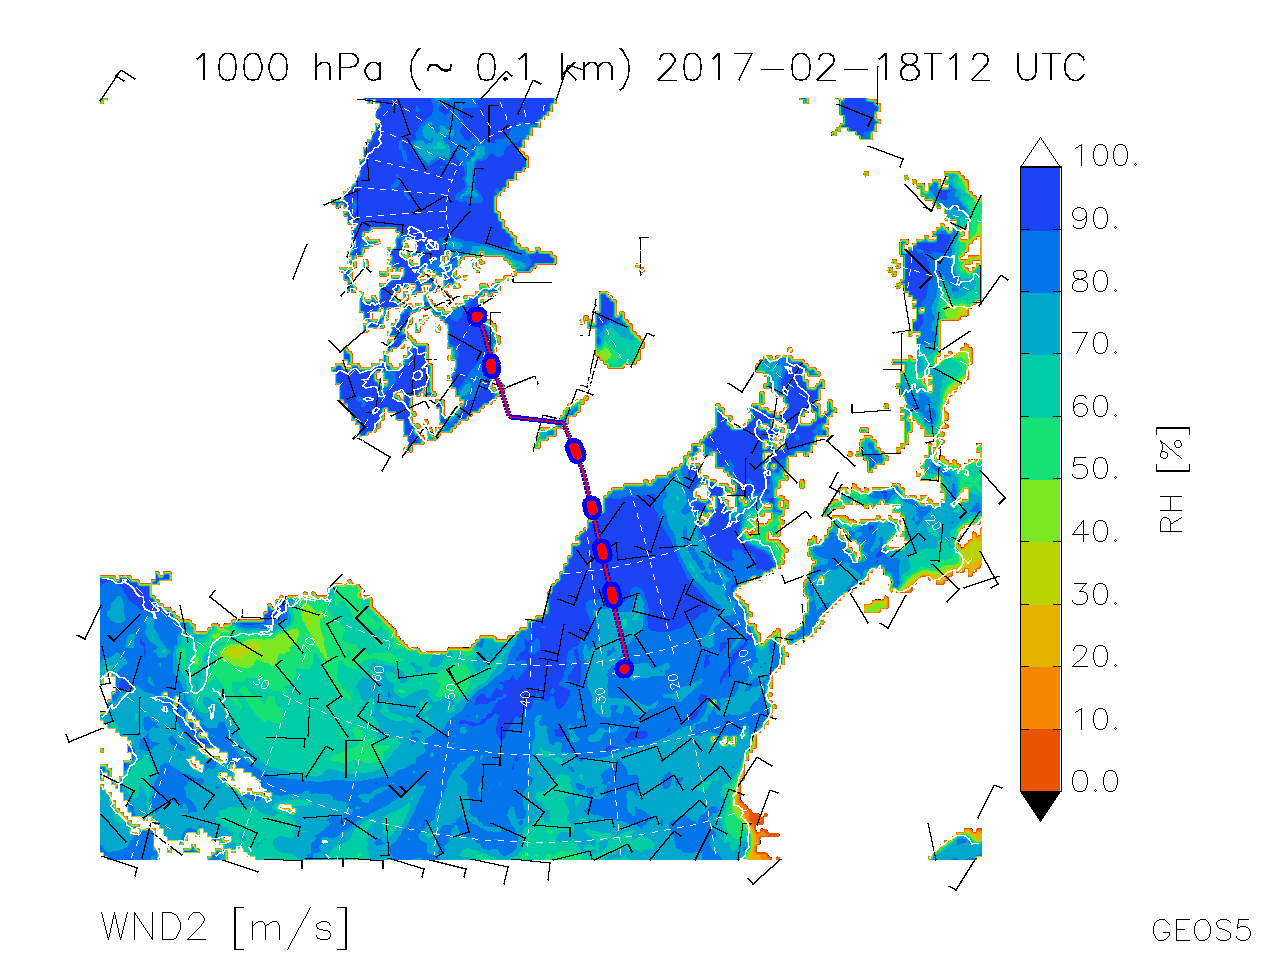
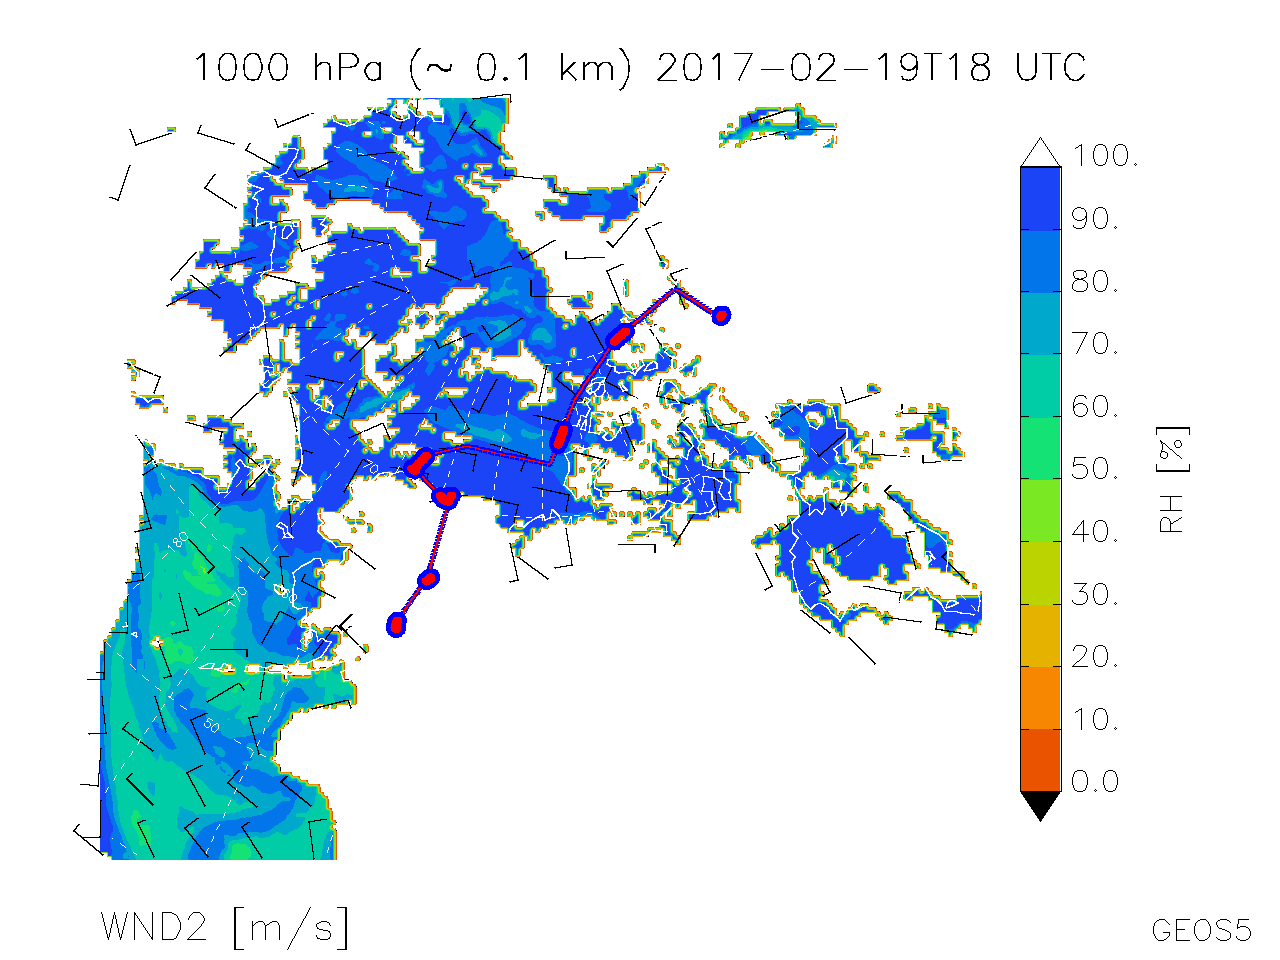
| Map of Rel. Humidity, Winds @ 1000 hPa | 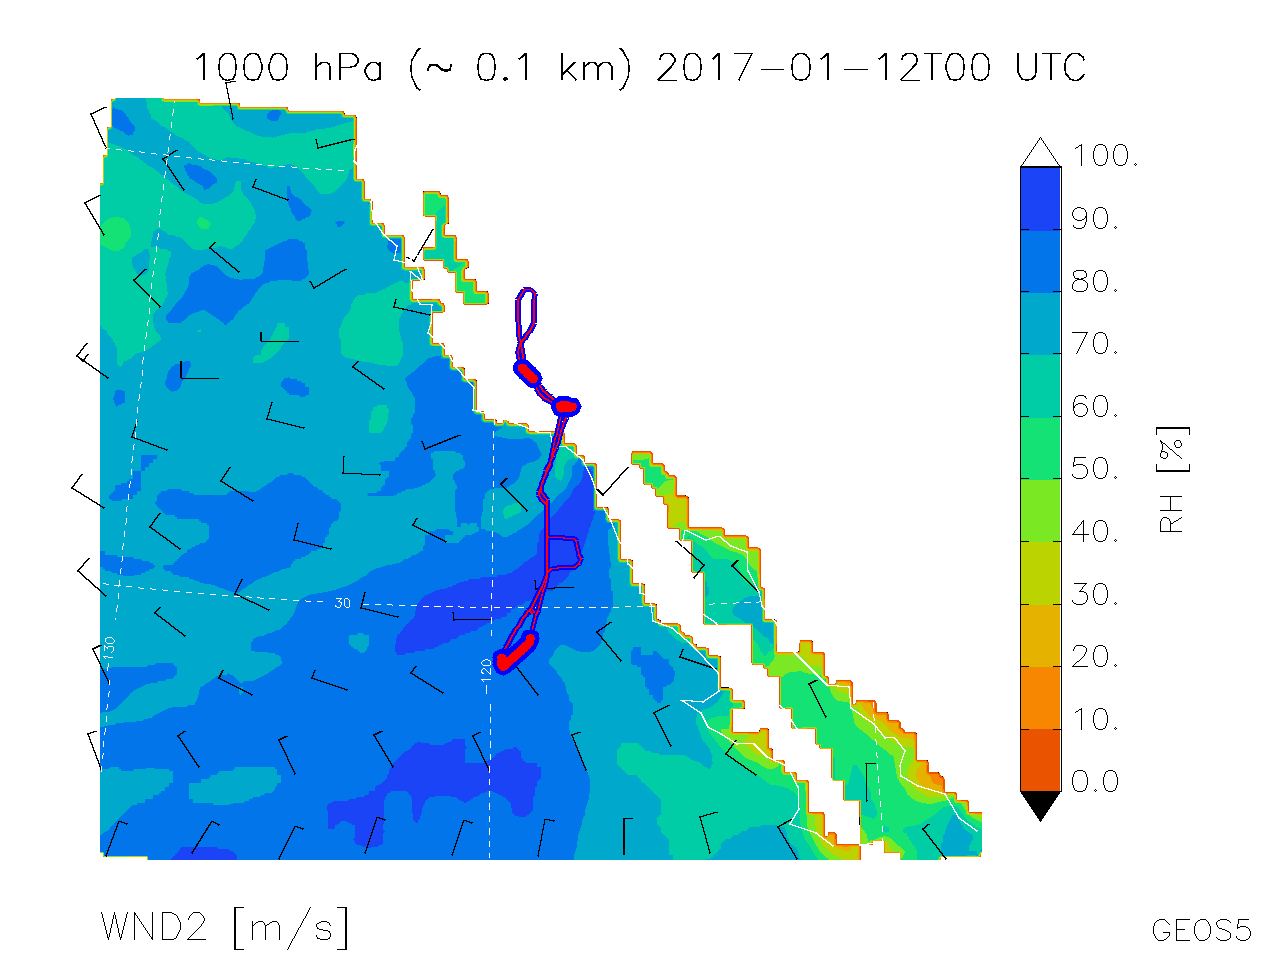 |
 |
 |
 |
 |
 |
 |
 |
 |
 |
 |
 |
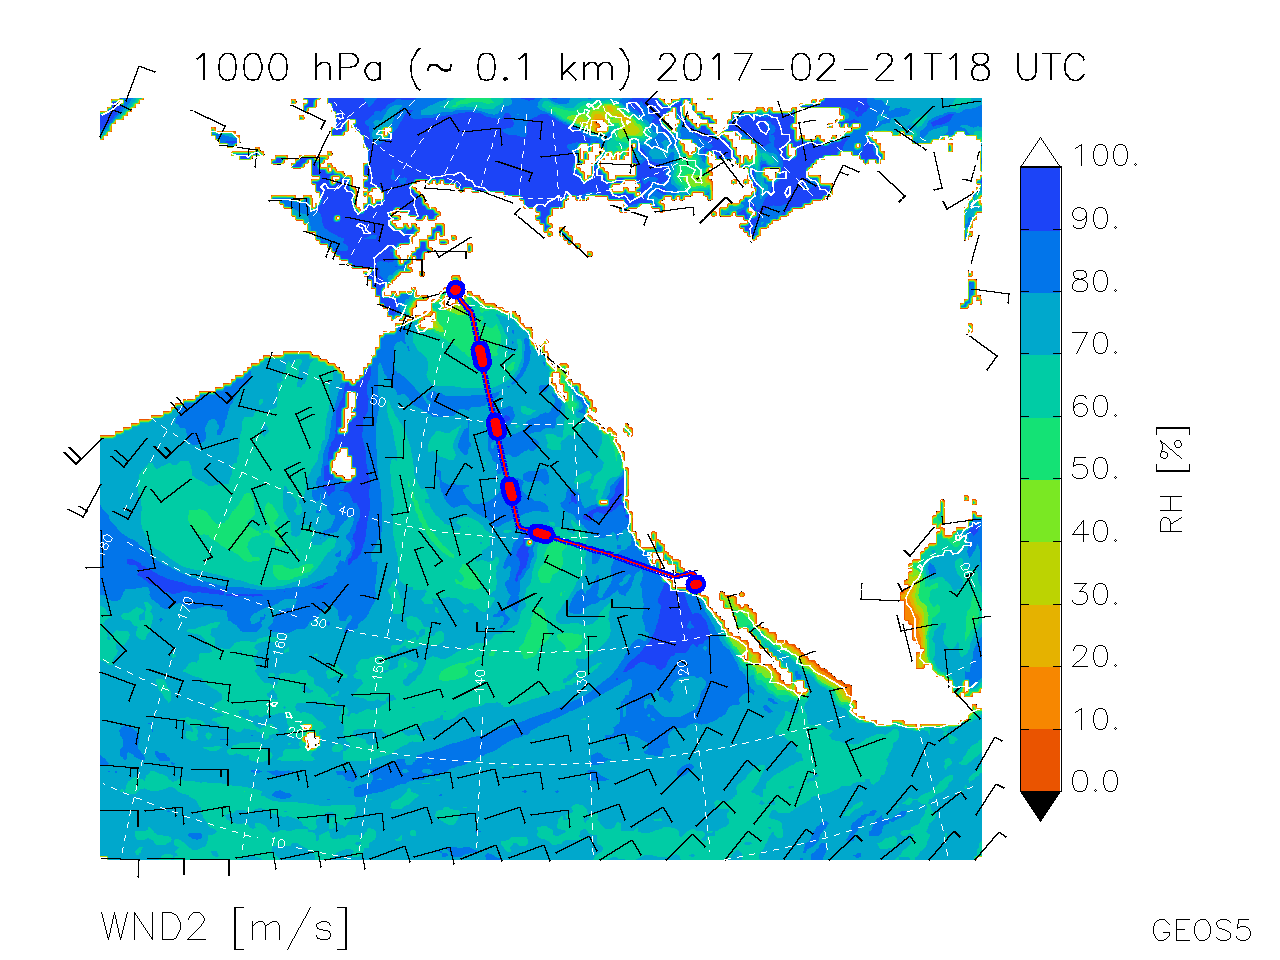 |
Map of Rel. Humidity, Winds @ 1000 hPa |
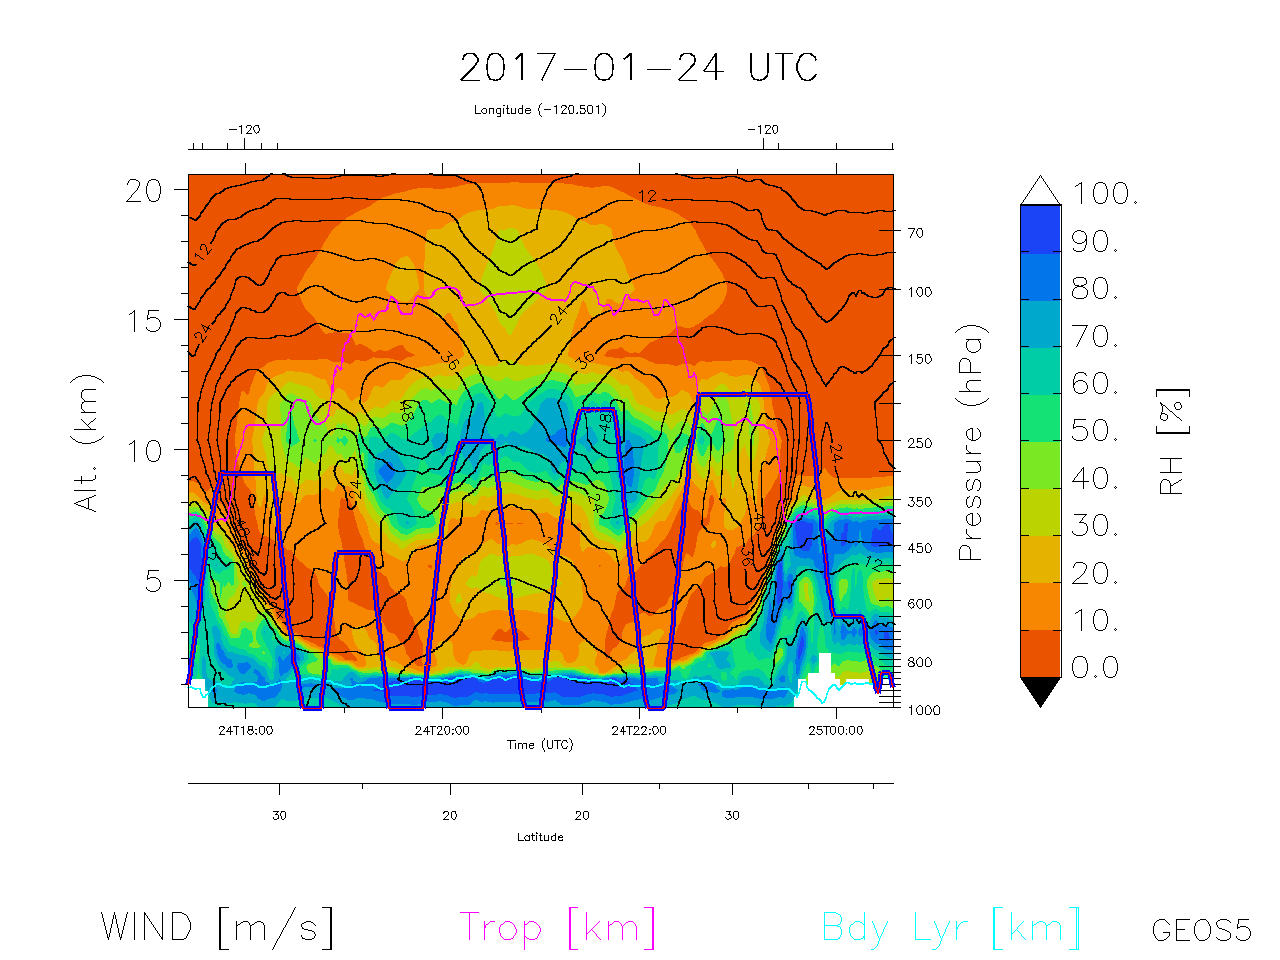
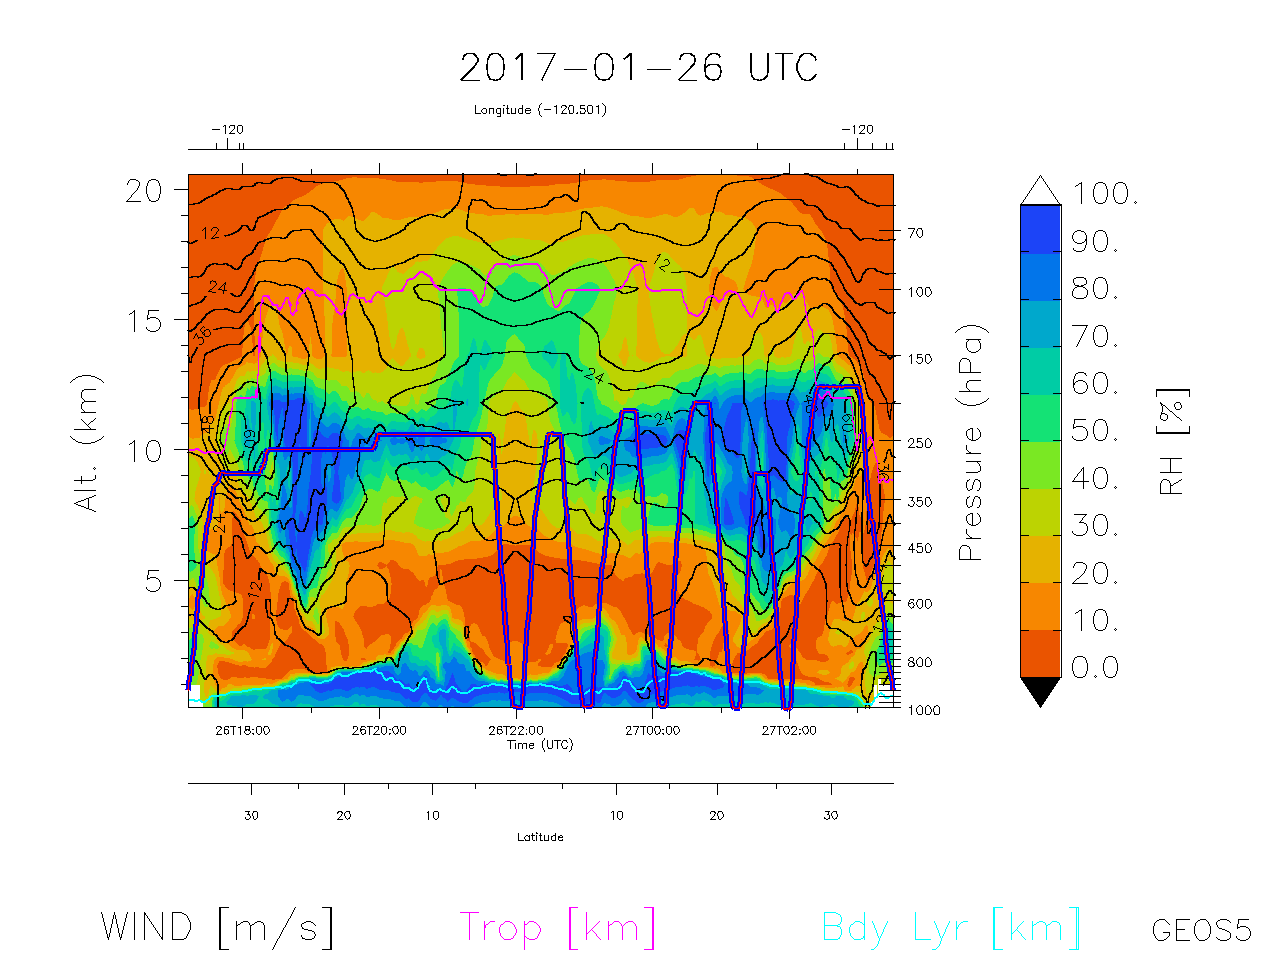
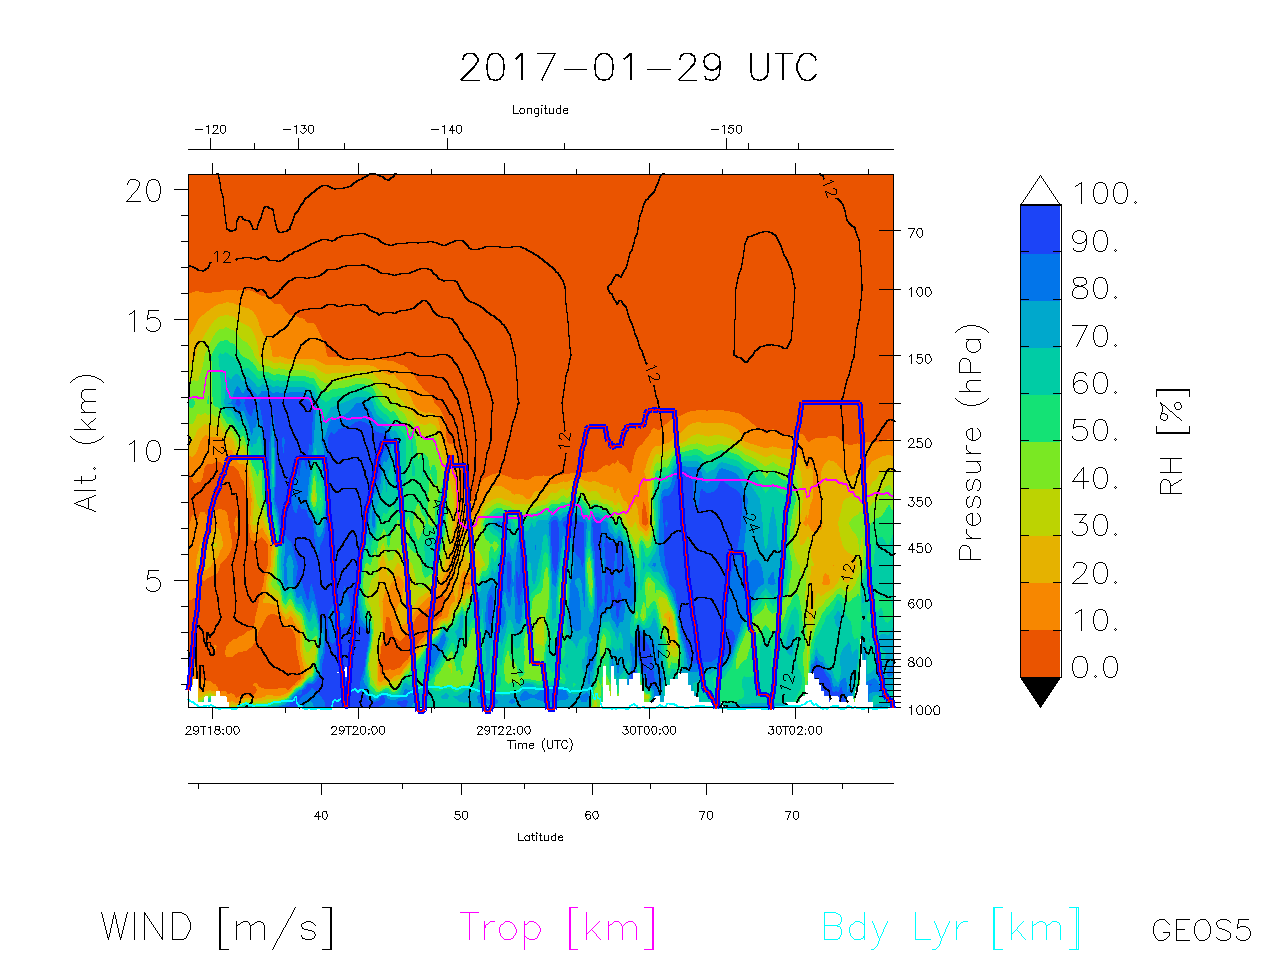
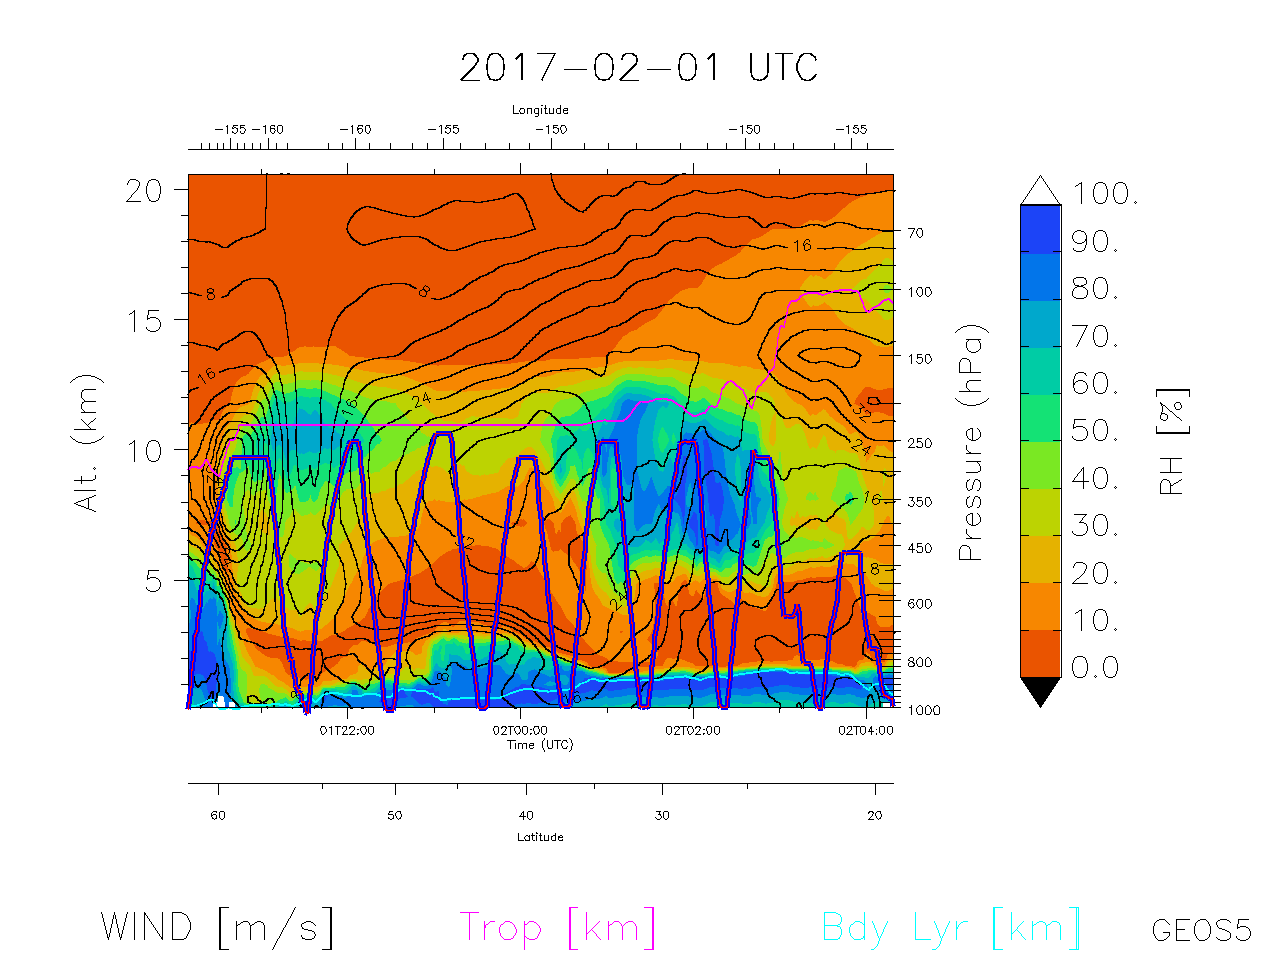
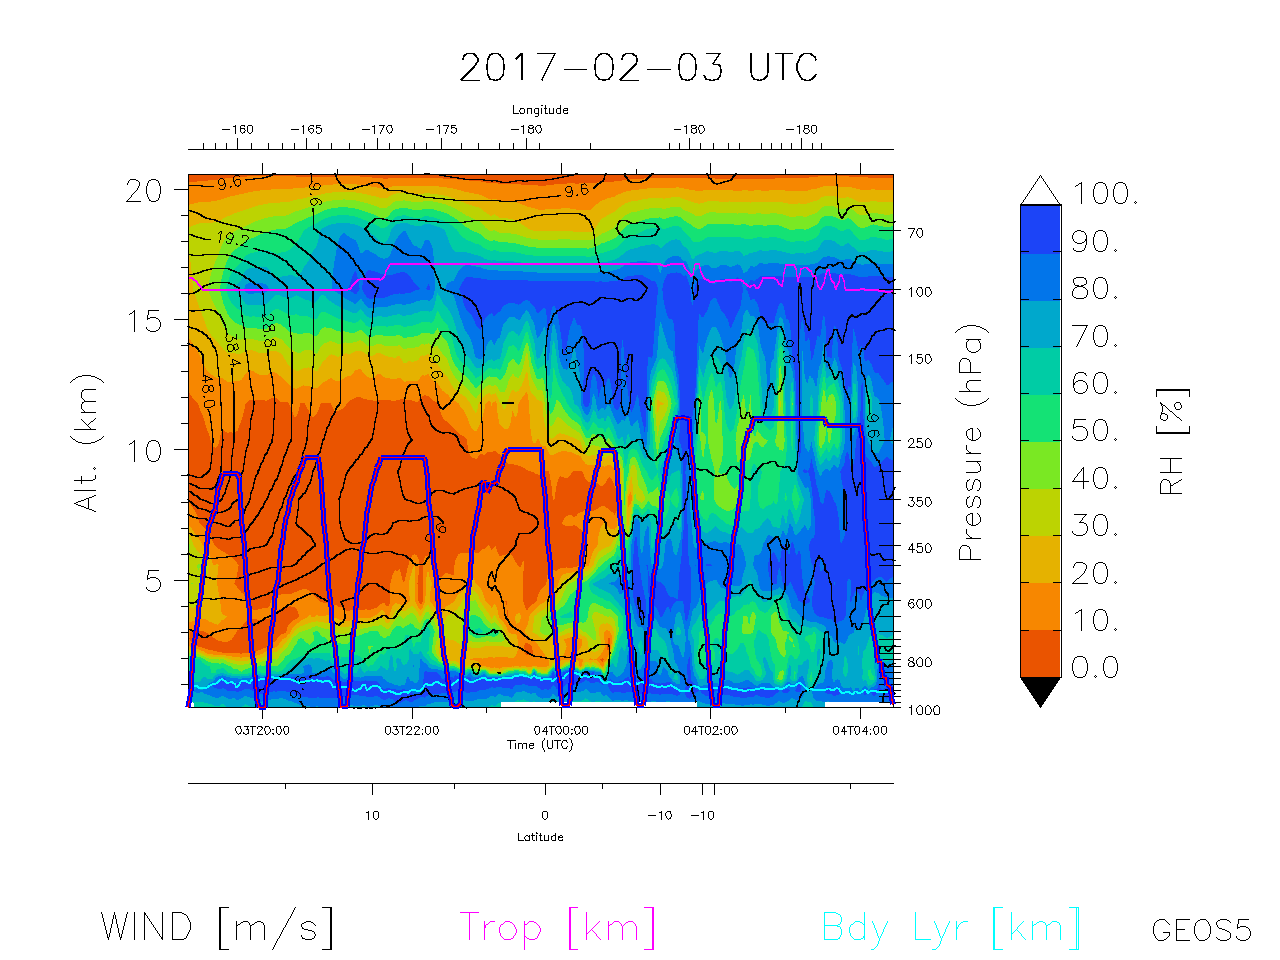
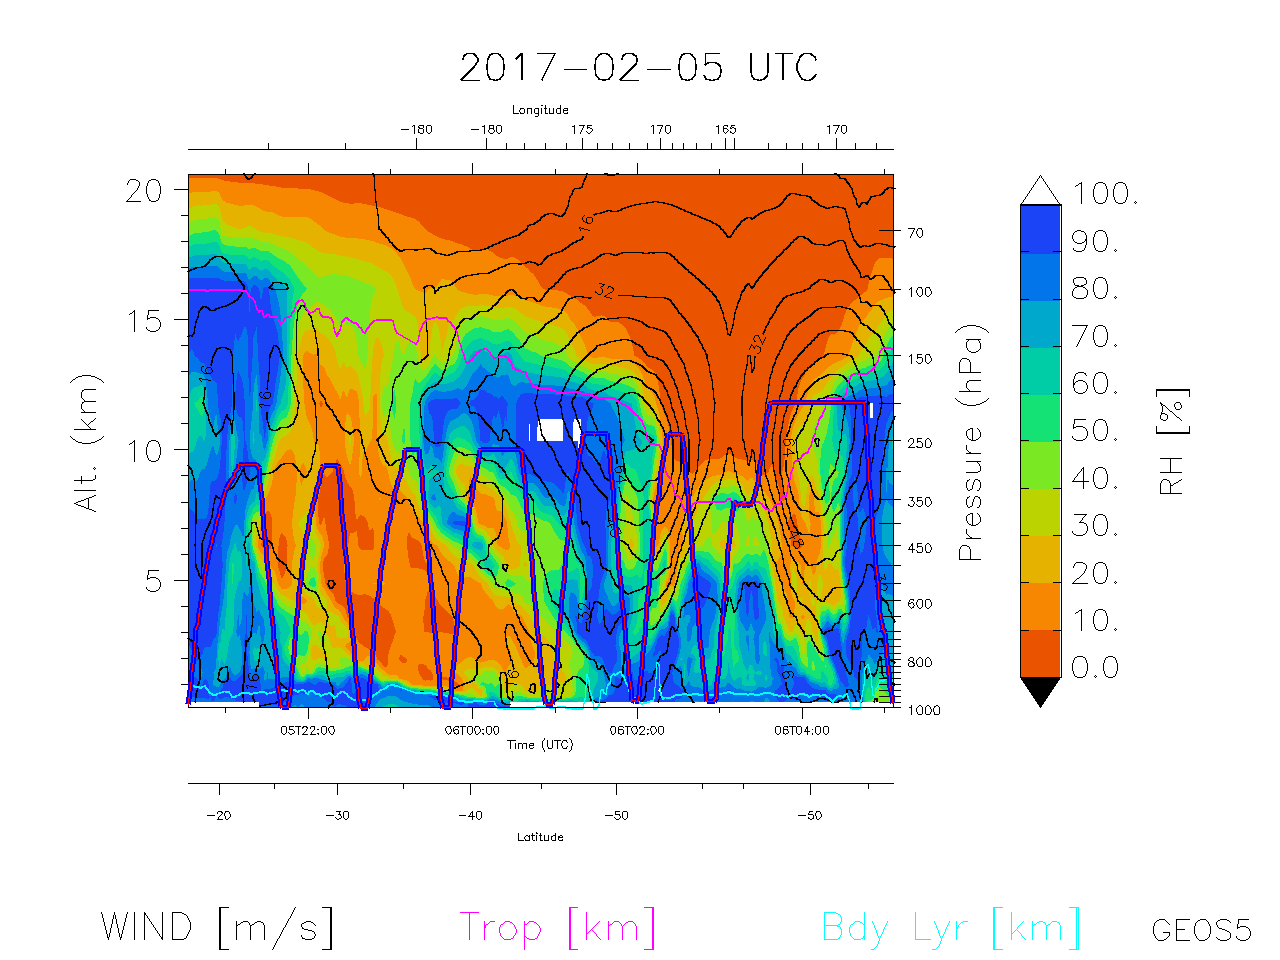
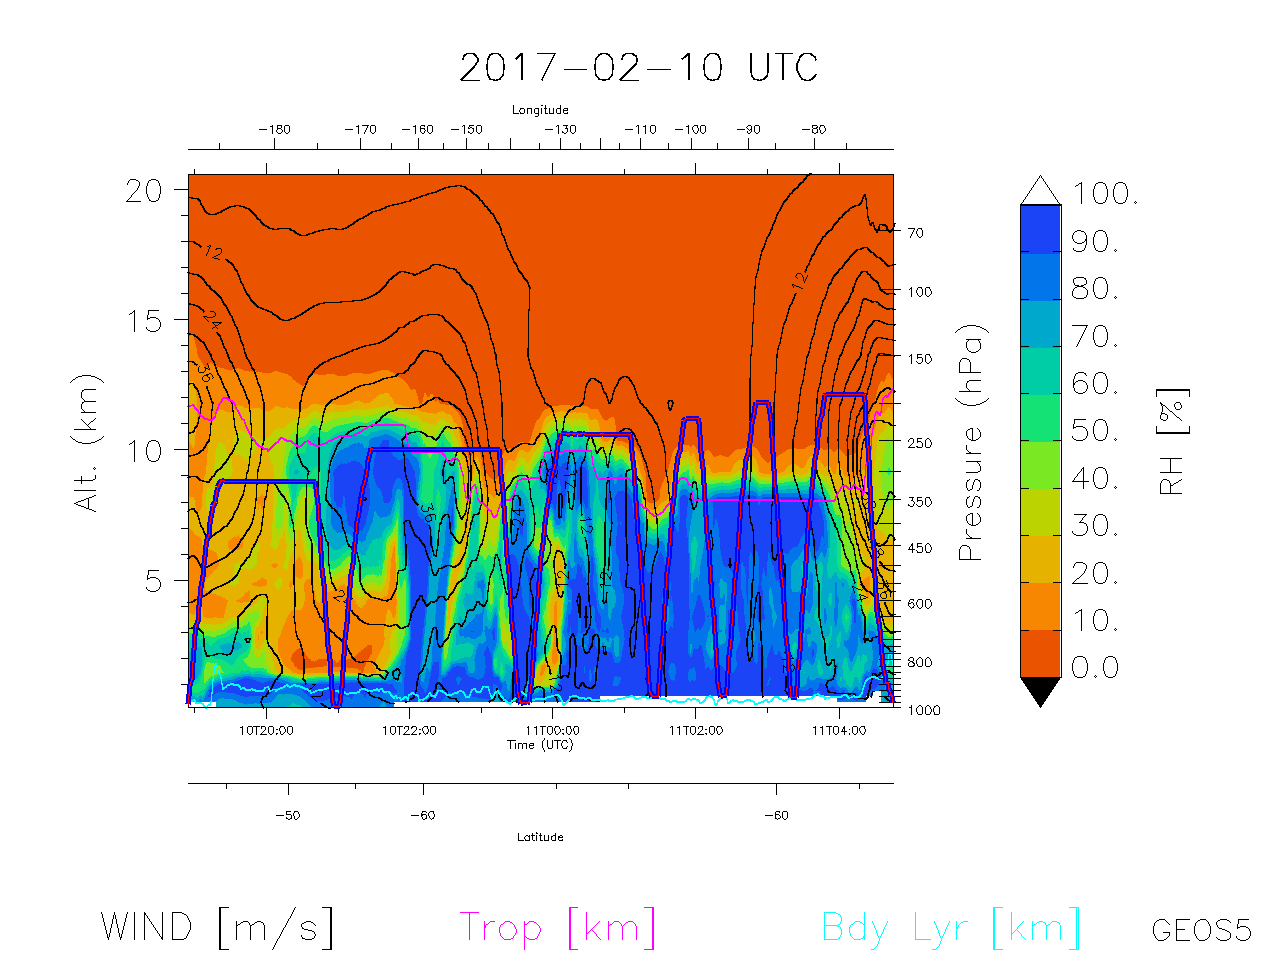
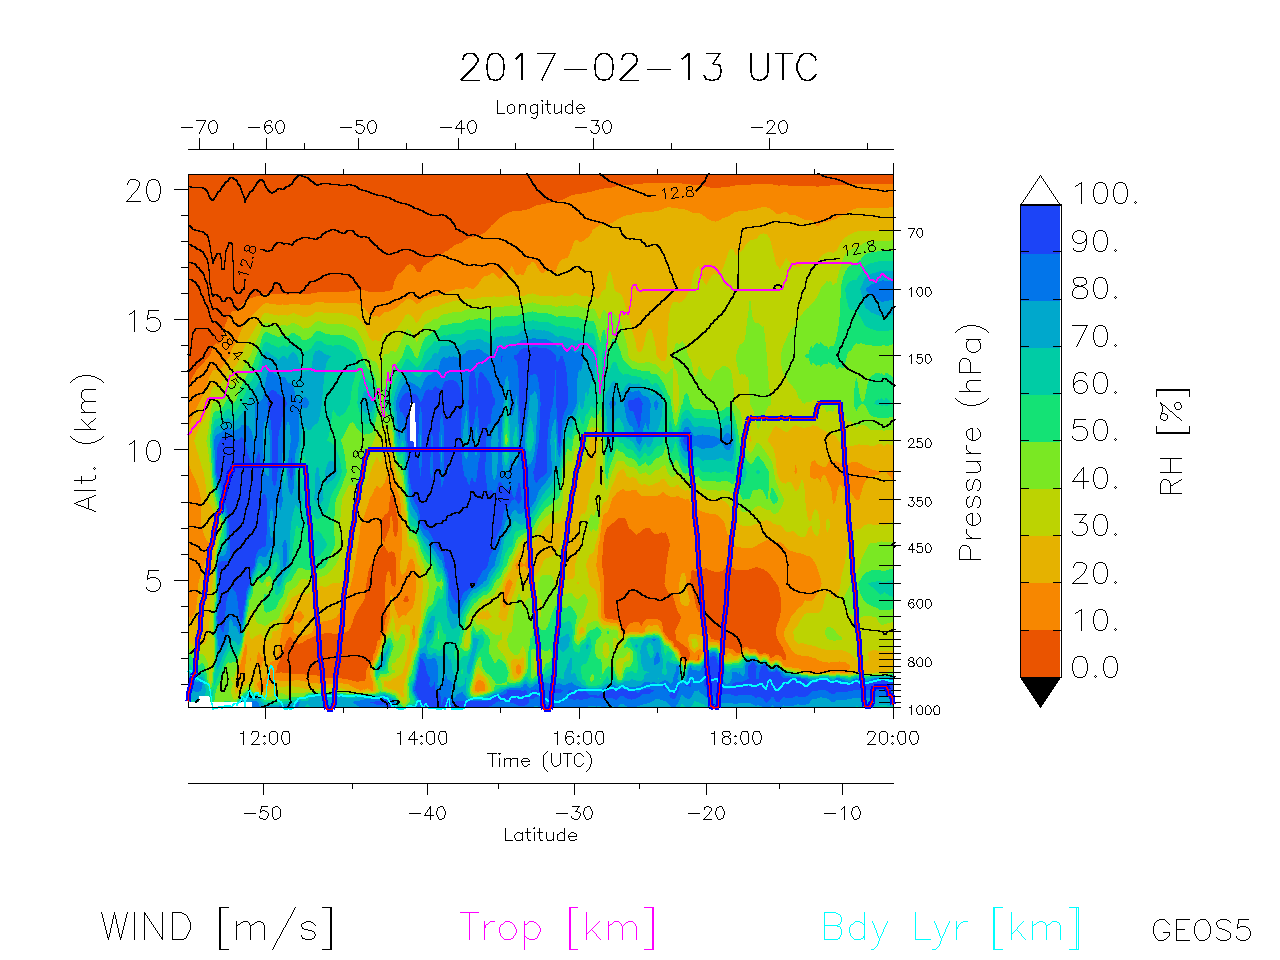
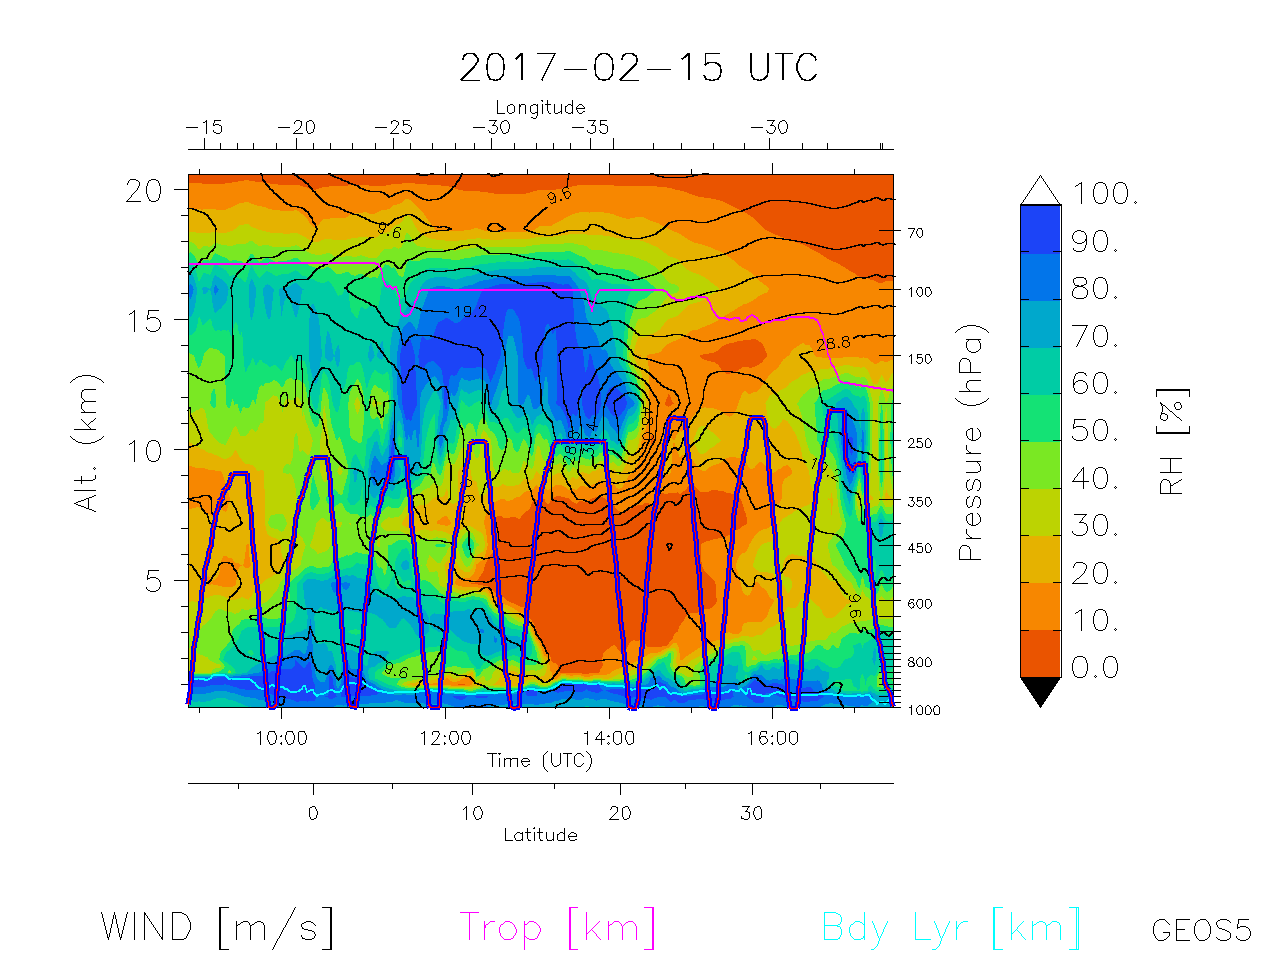
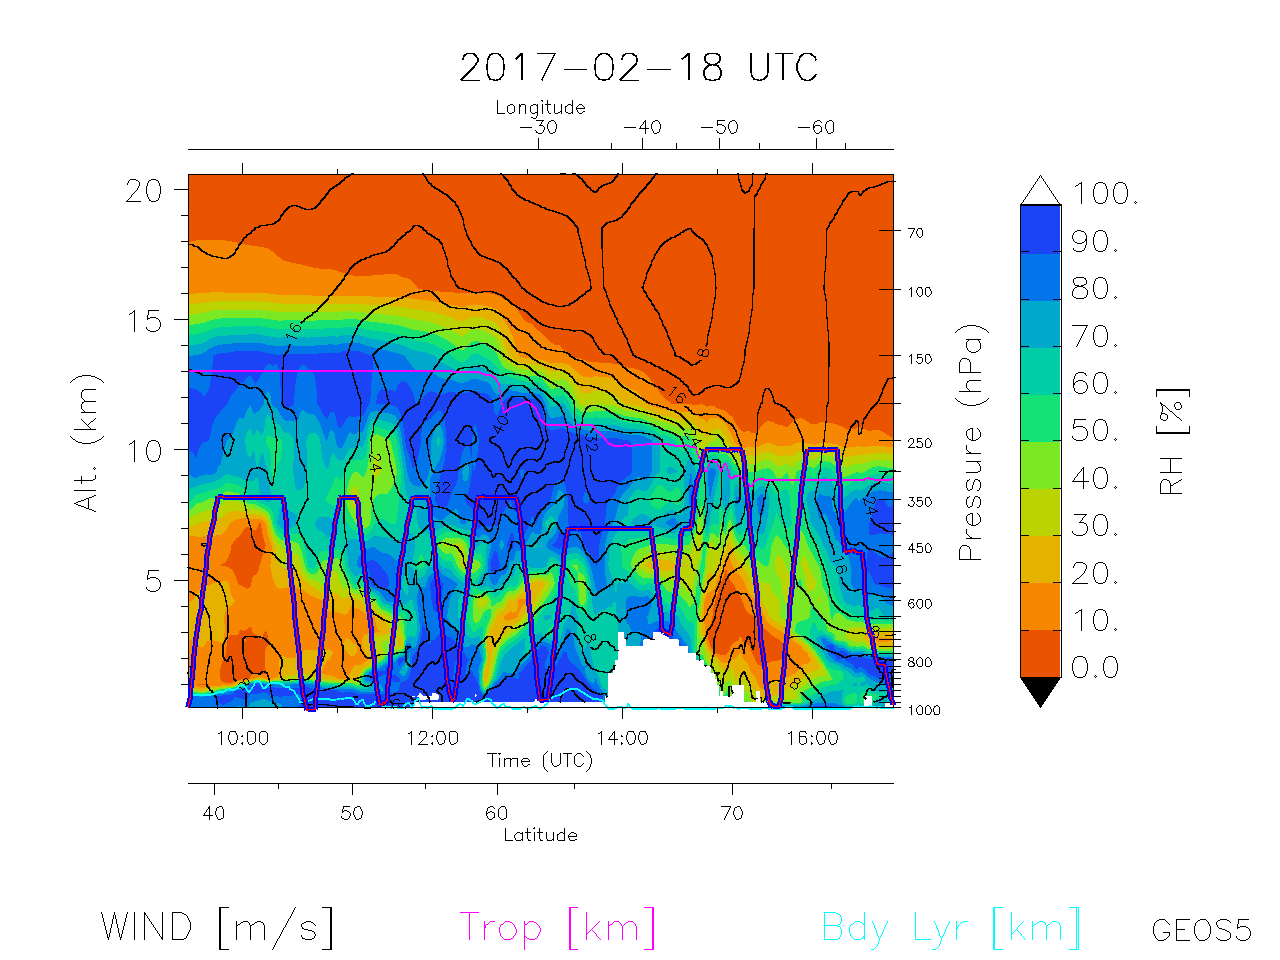
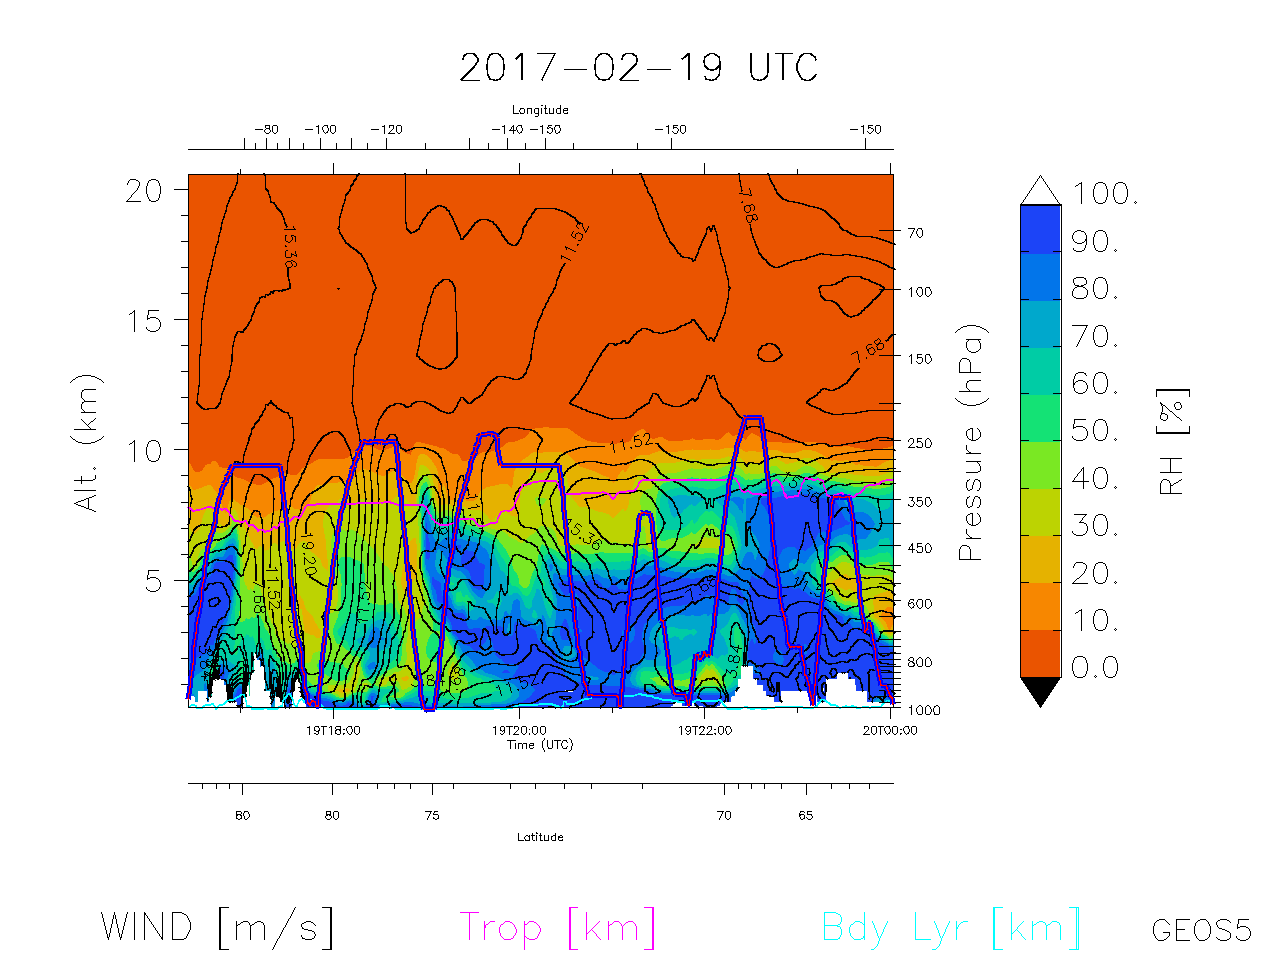
| Curtain of Rel Hum., Winds | 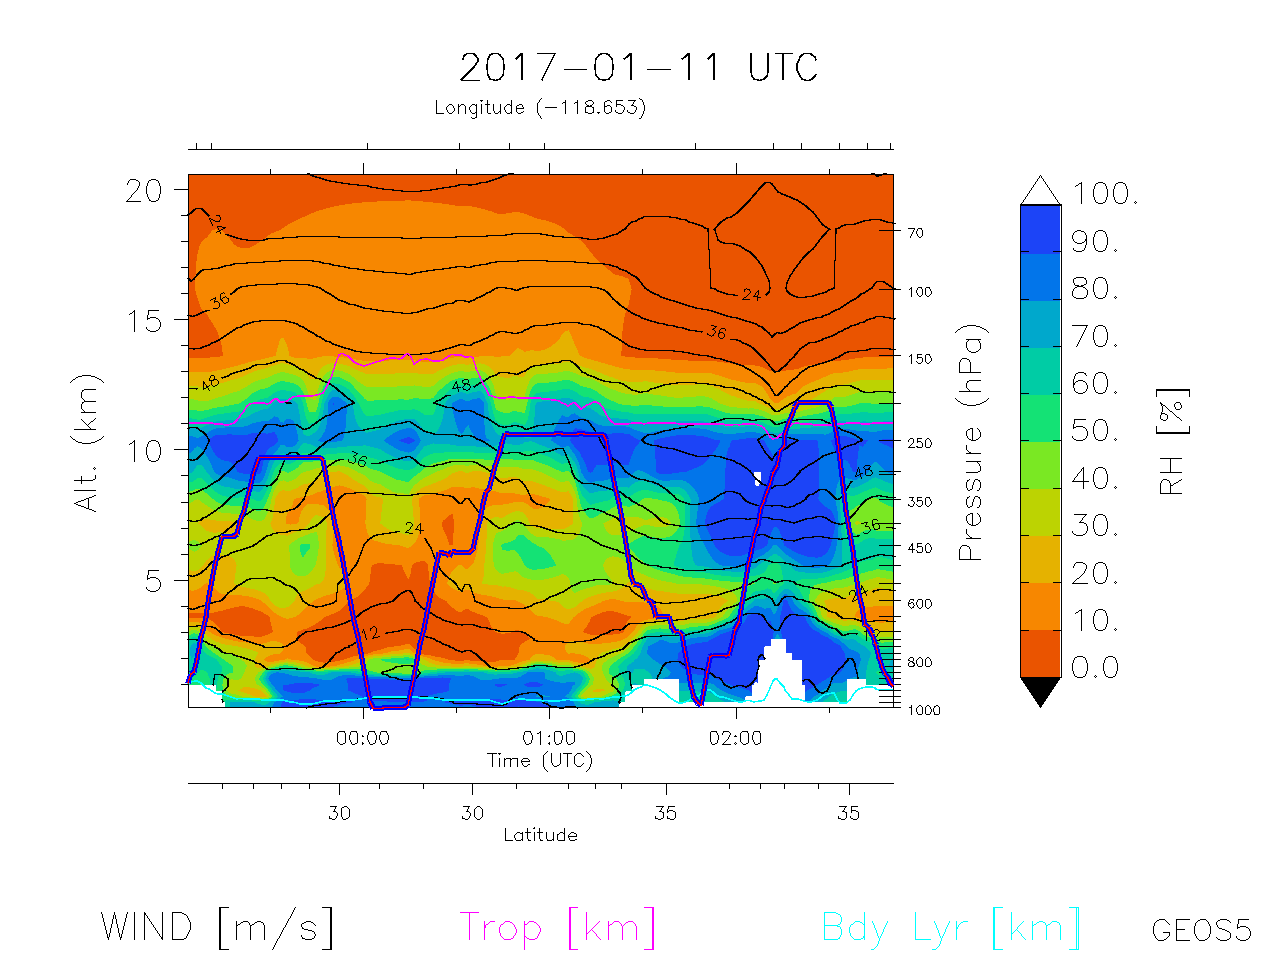 |
 |
 |
 |
 |
 |
 |
 |
 |
 |
 |
 |
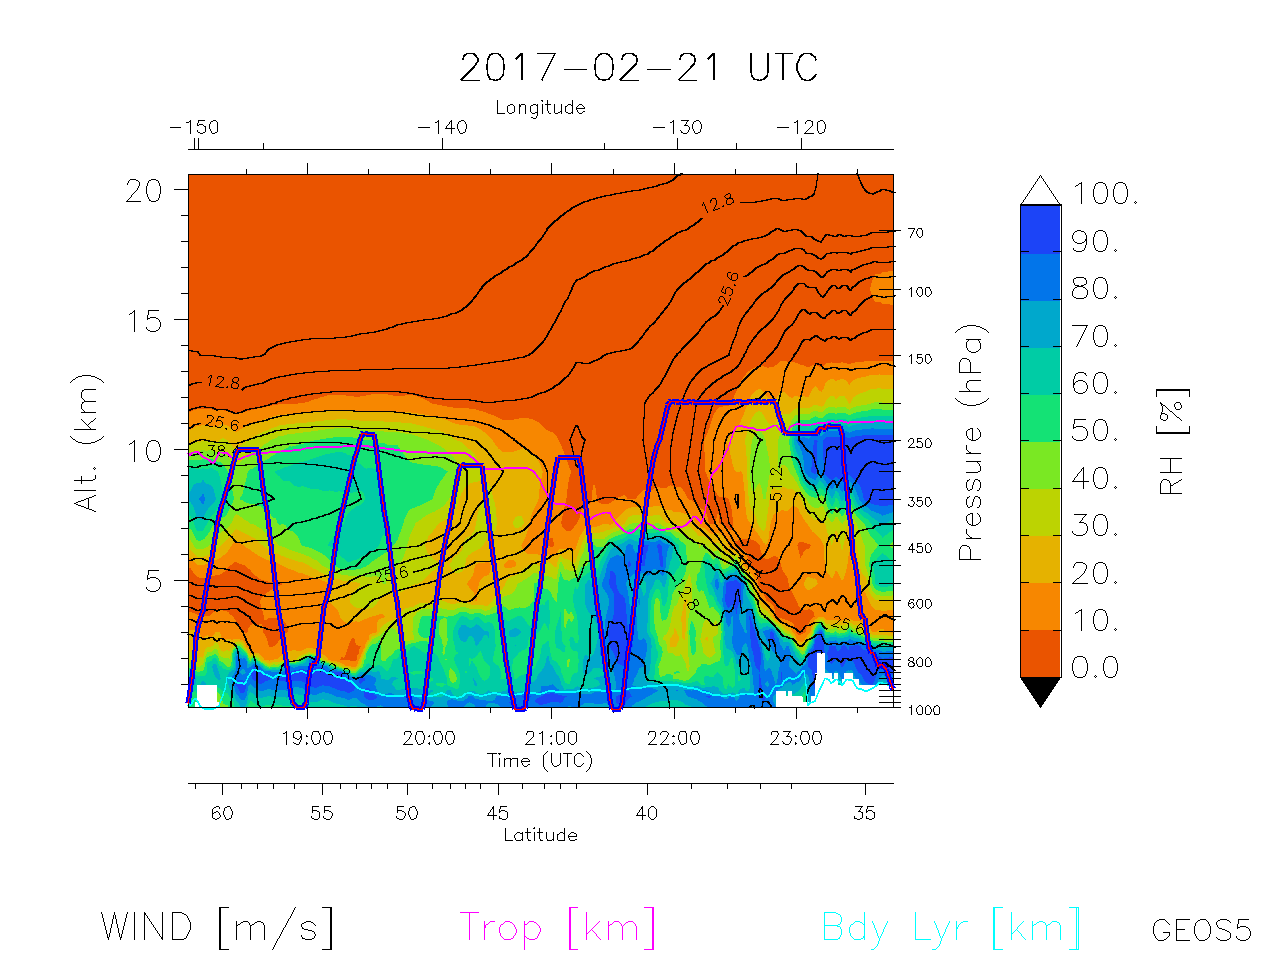 |
Curtain of Rel Hum., Winds |
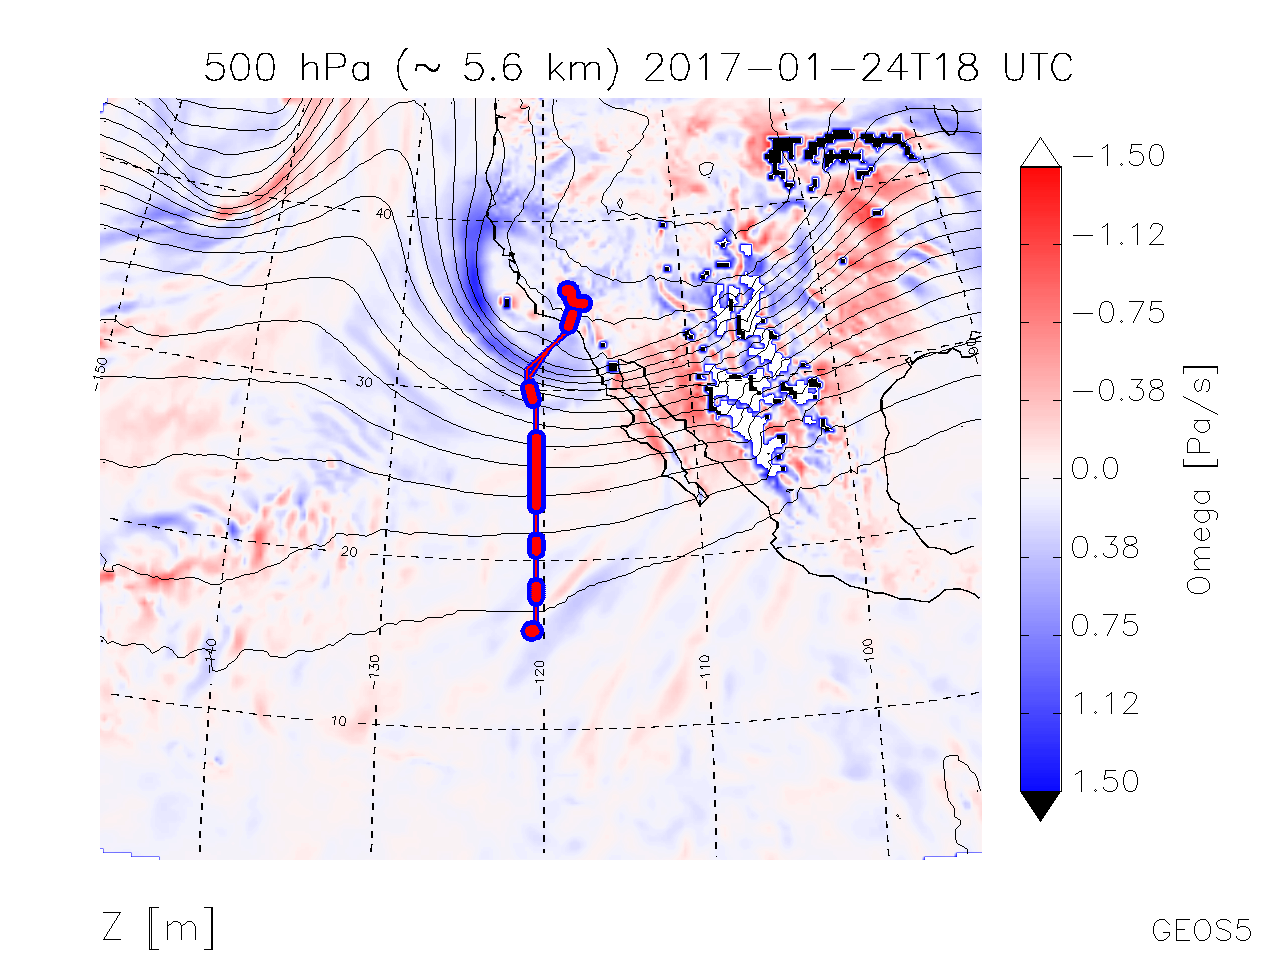
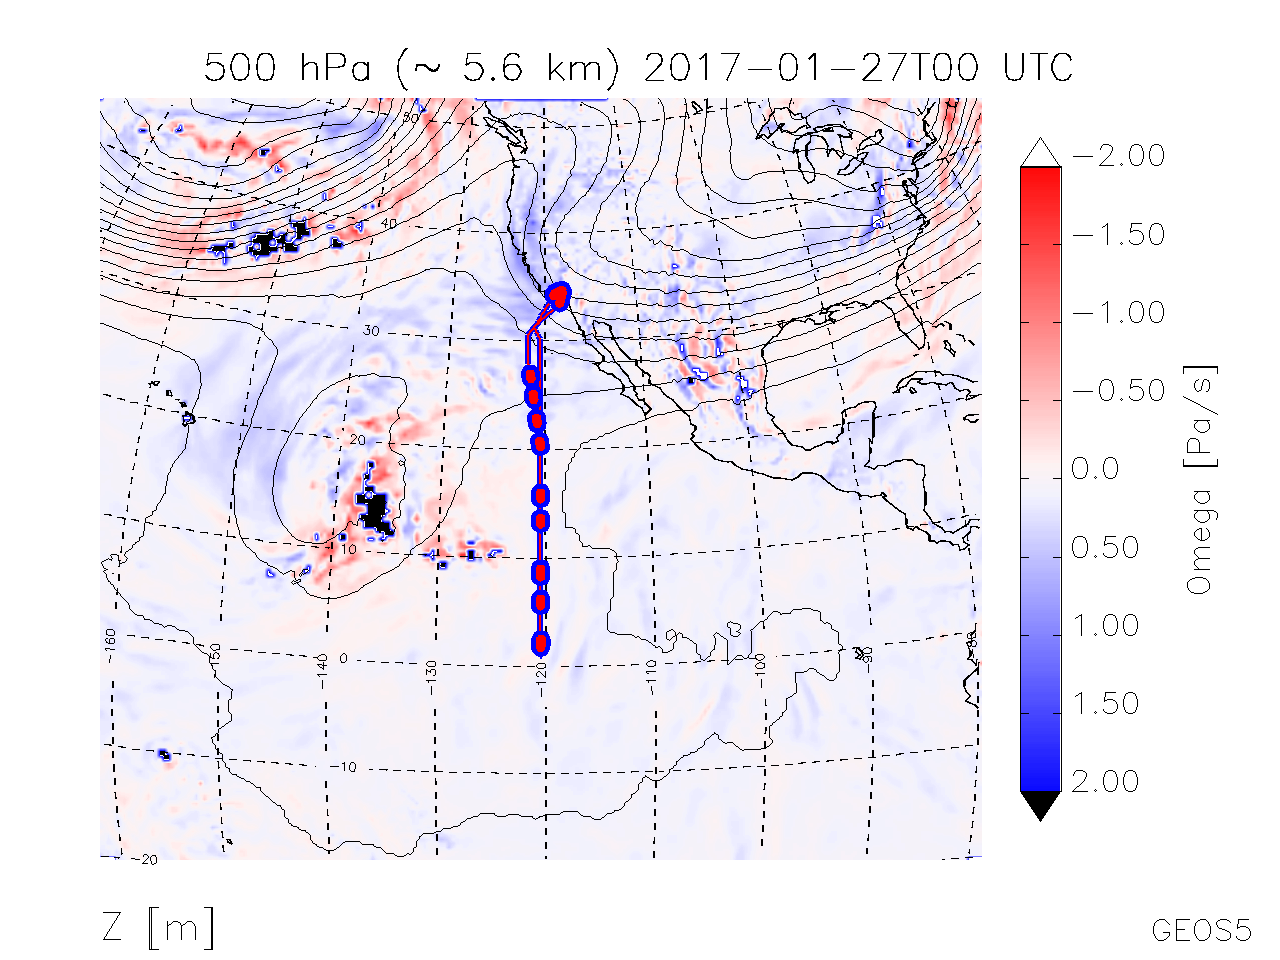
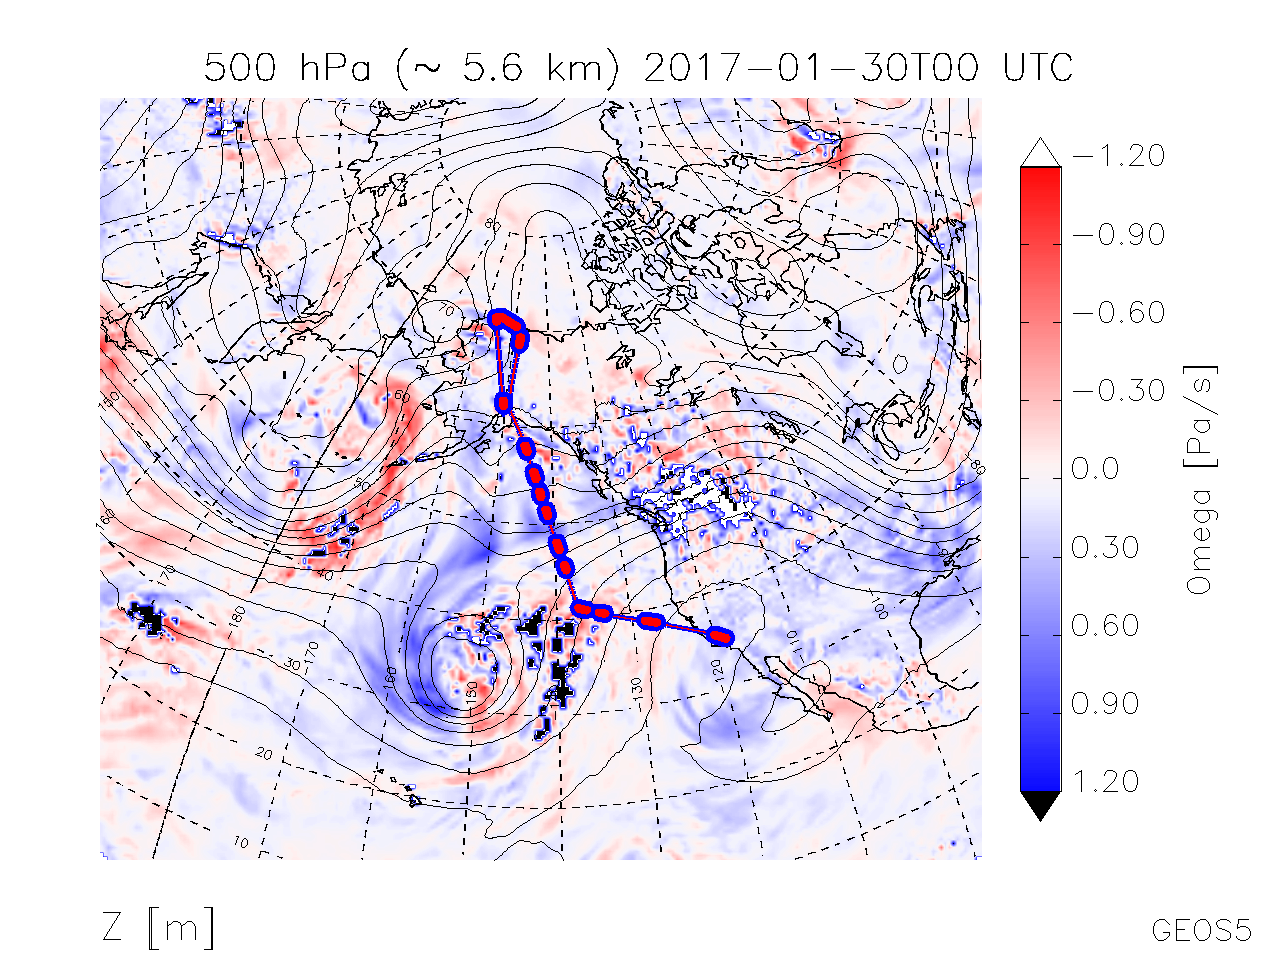
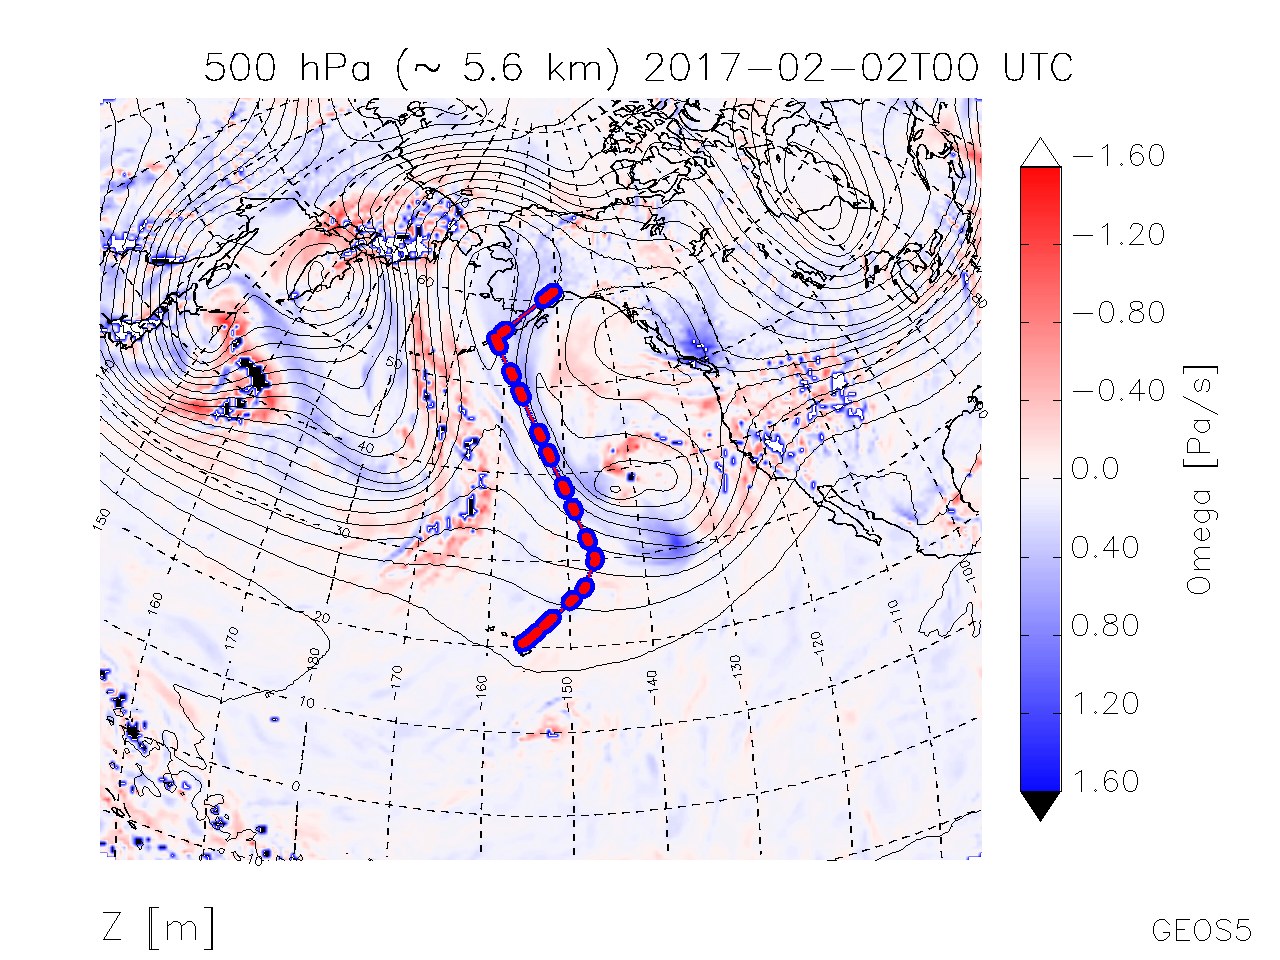
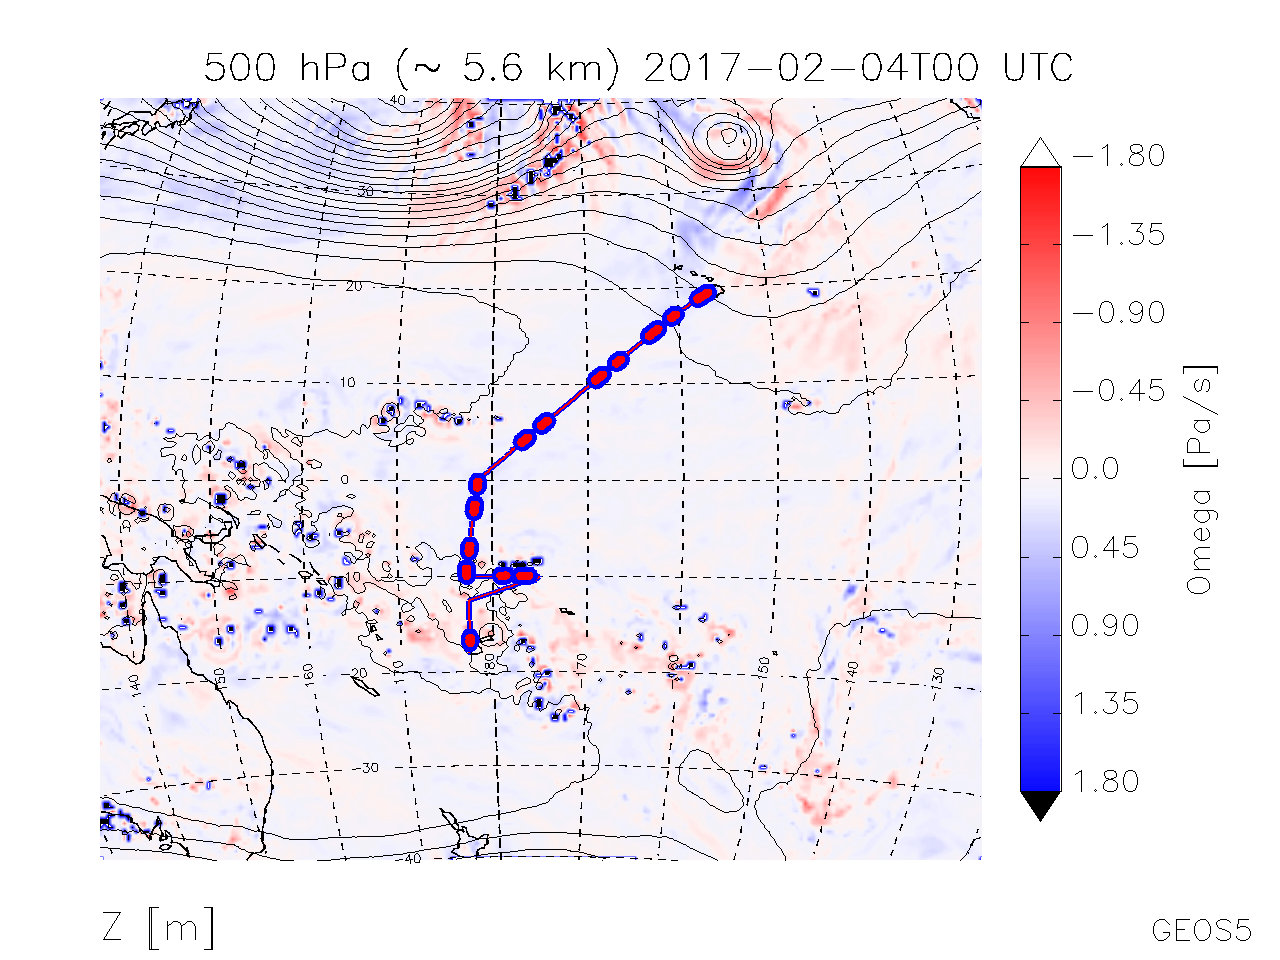
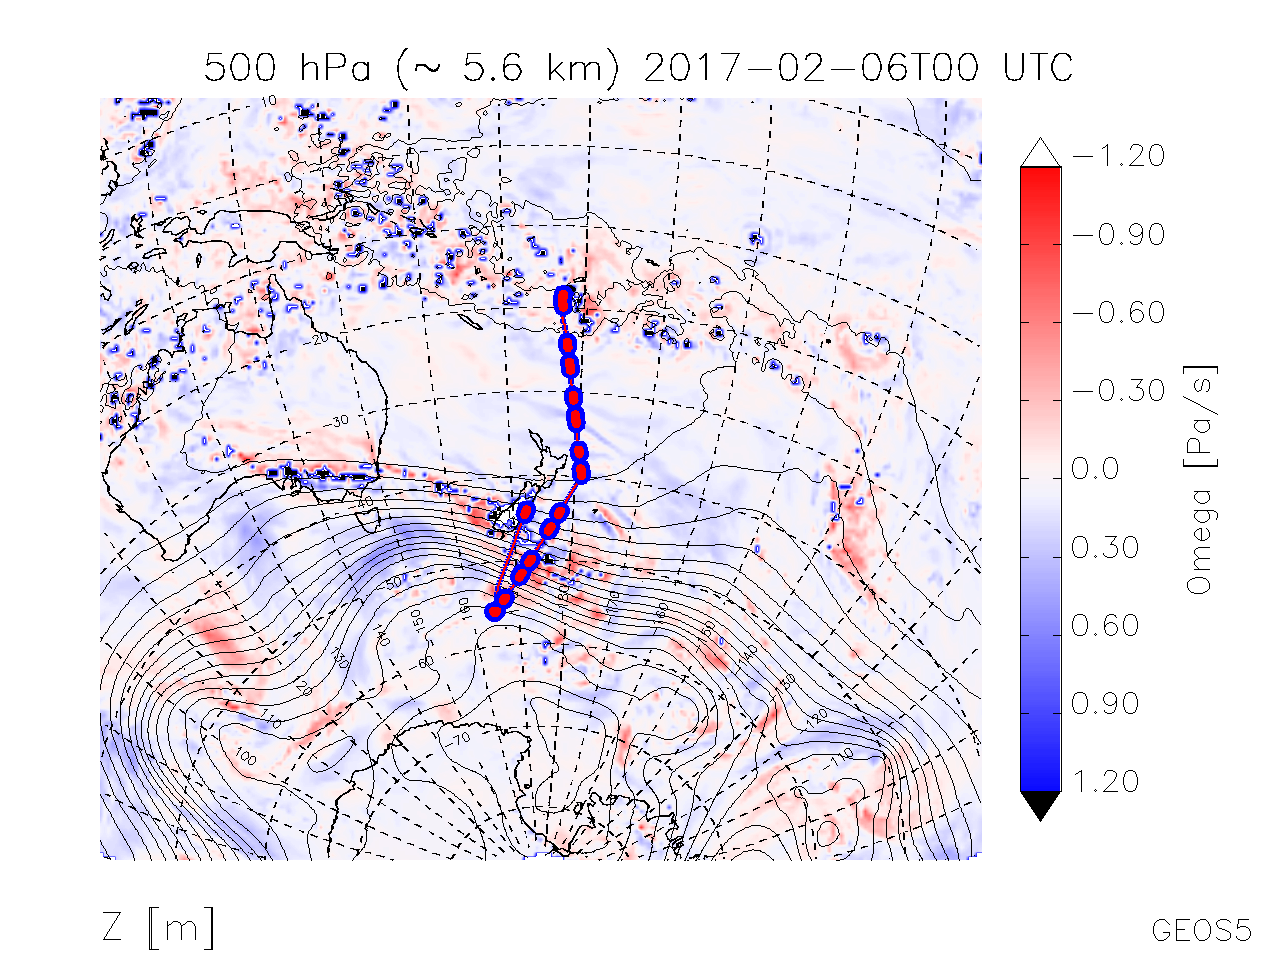
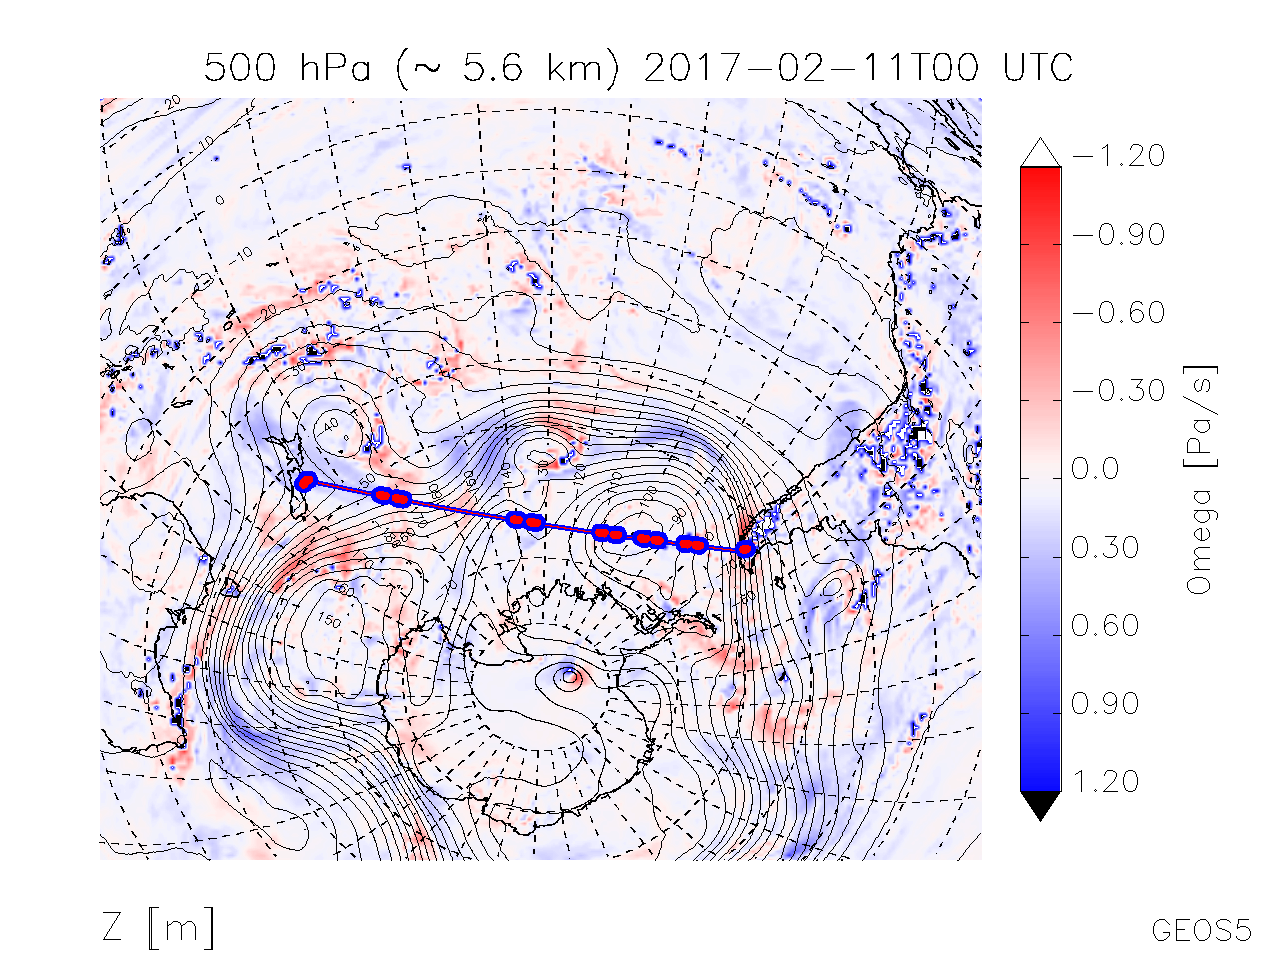
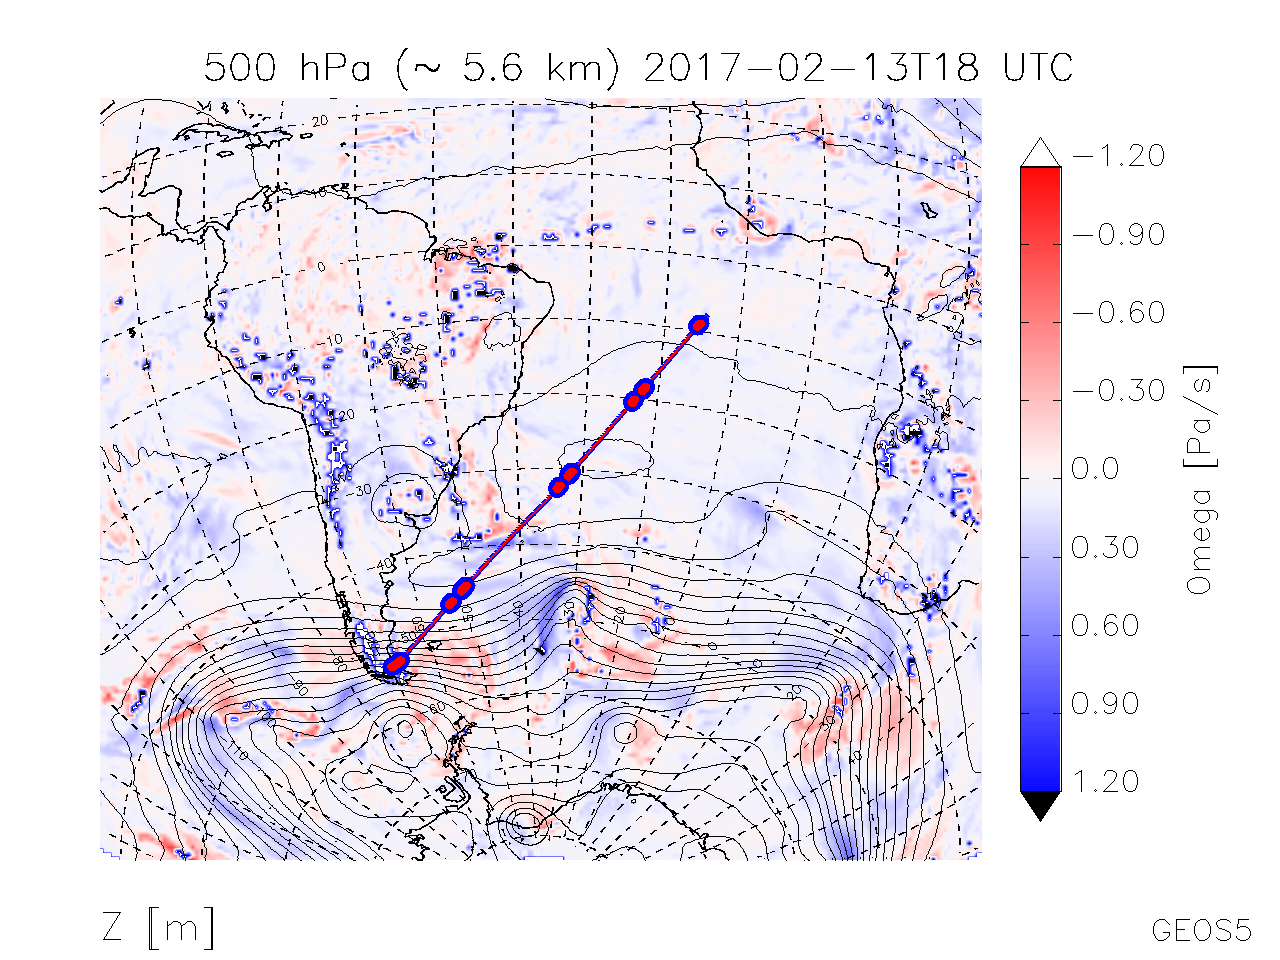
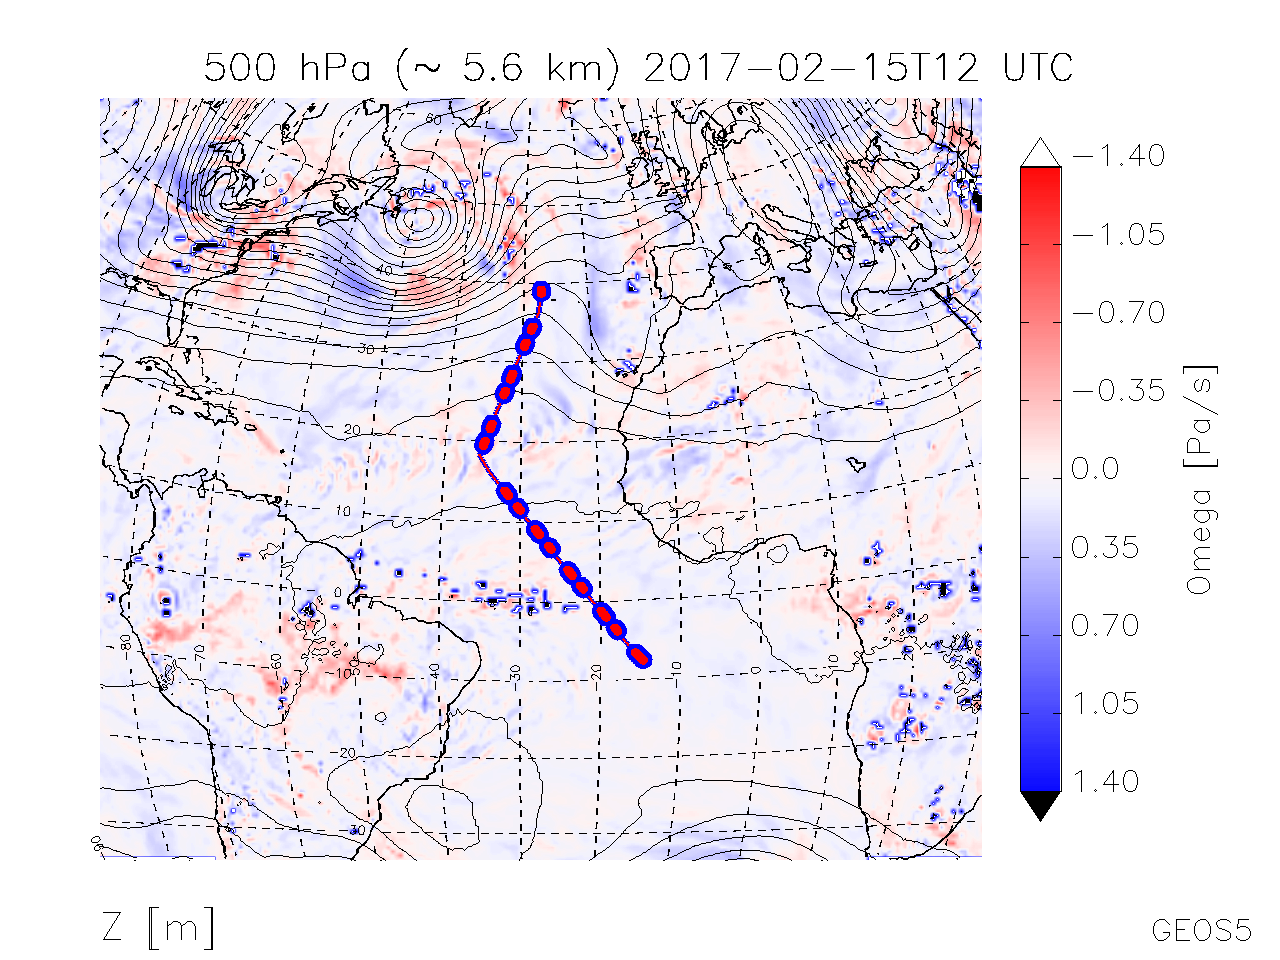
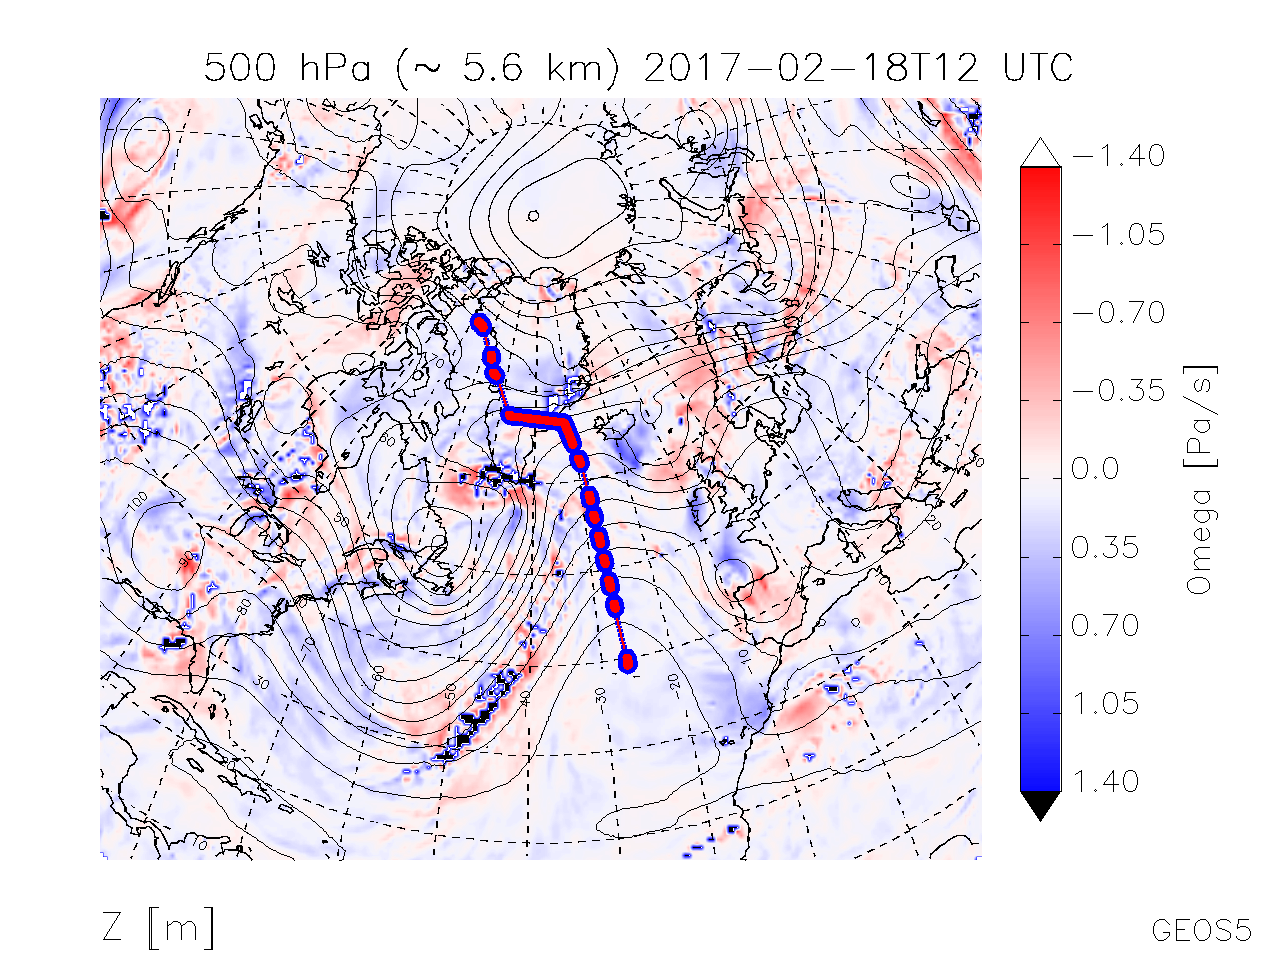
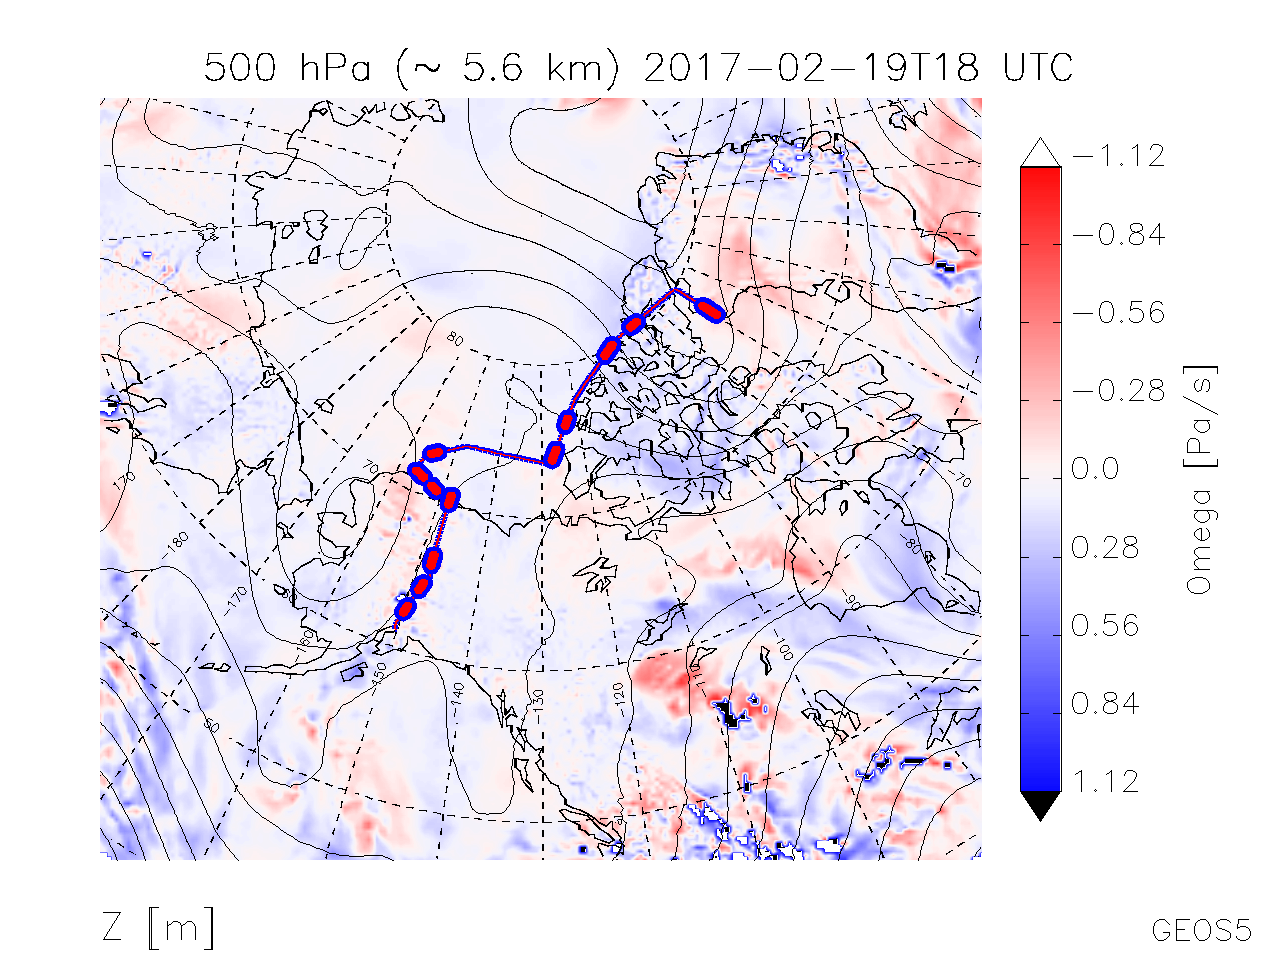
| Map of Omega @ 500 hPa | 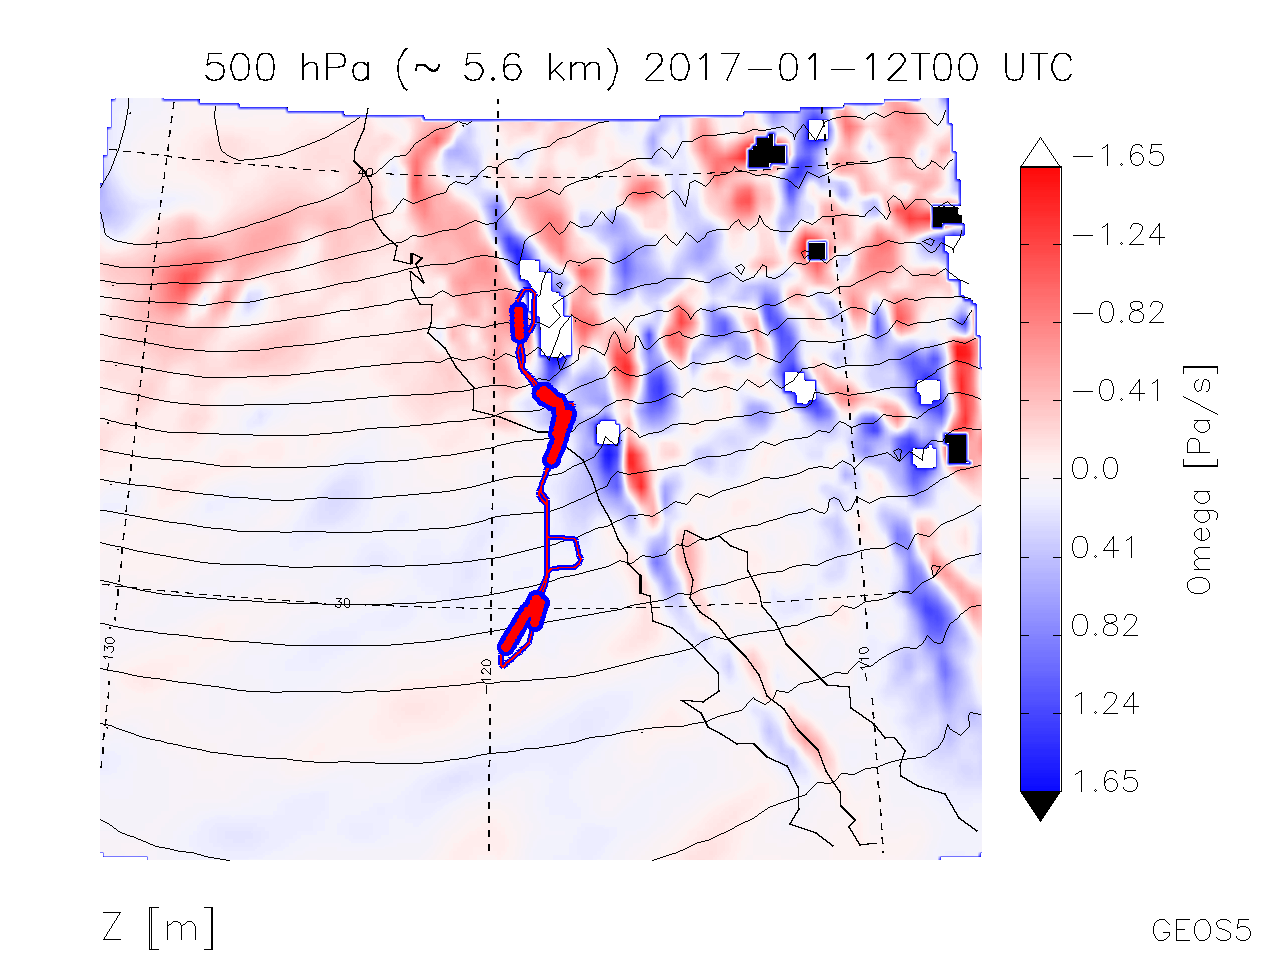 |
 |
 |
 |
 |
 |
 |
 |
 |
 |
 |
 |
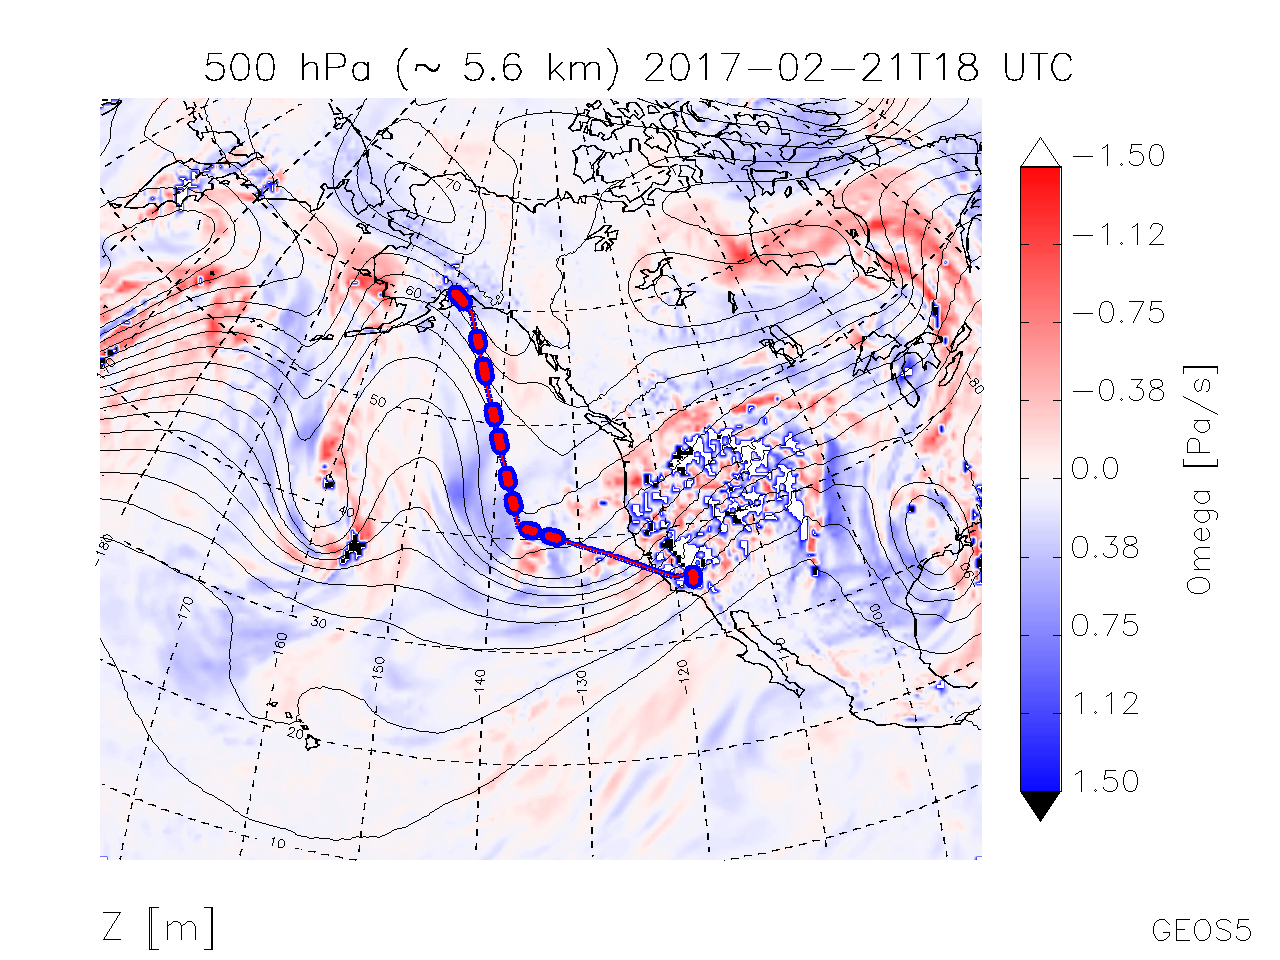 |
Map of Omega @ 500 hPa |
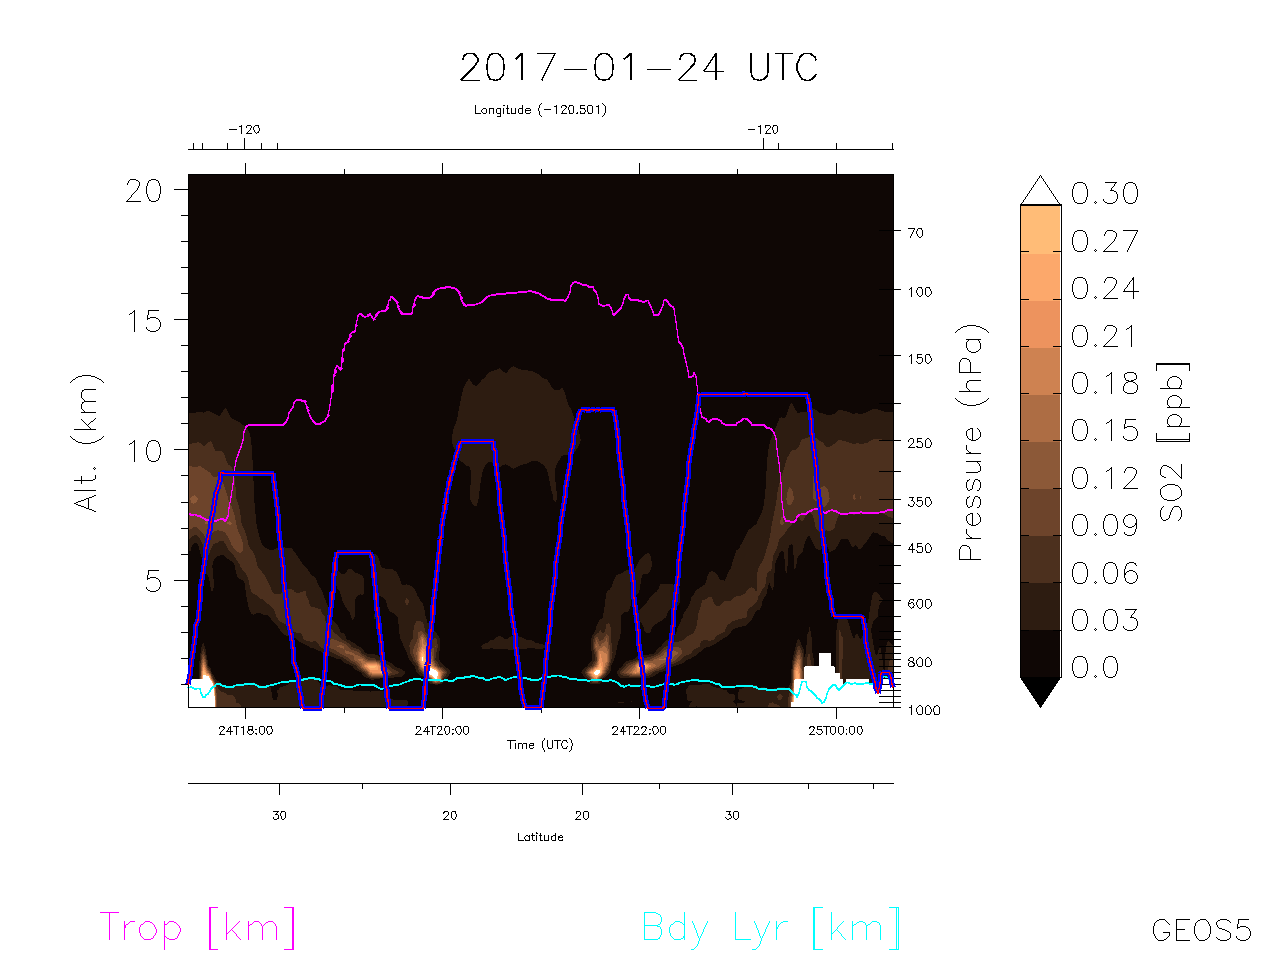
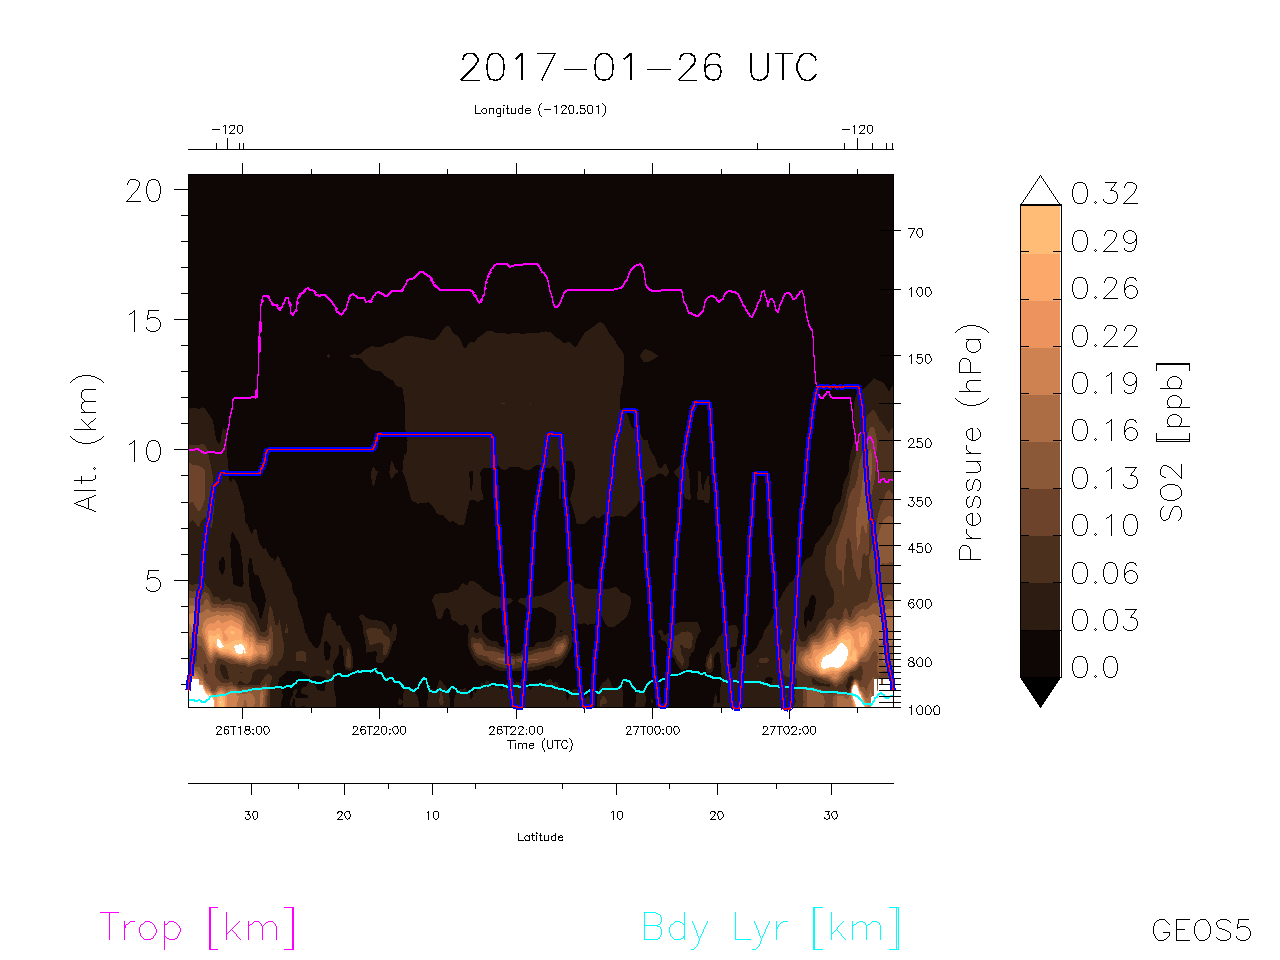
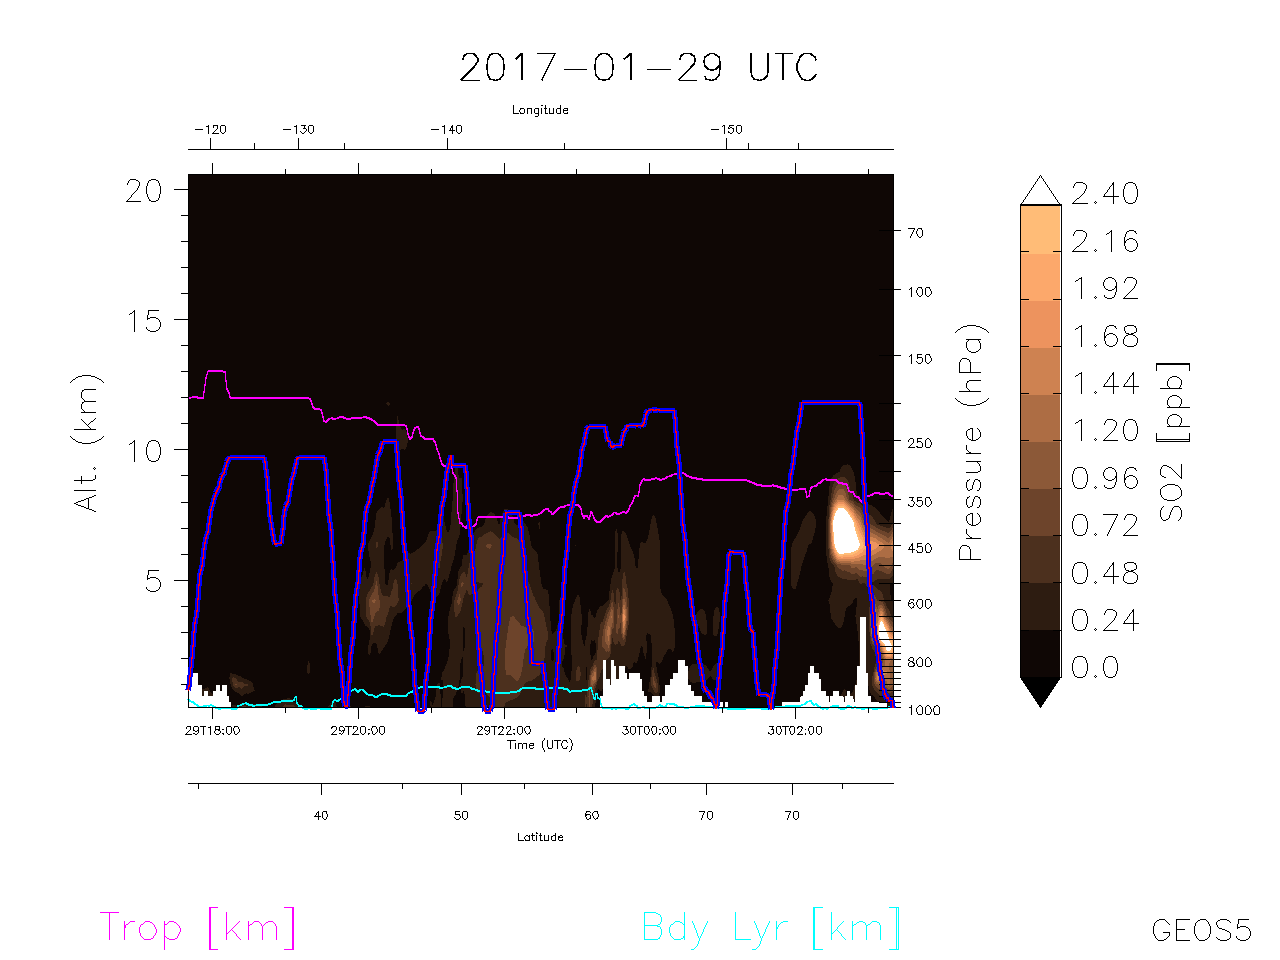
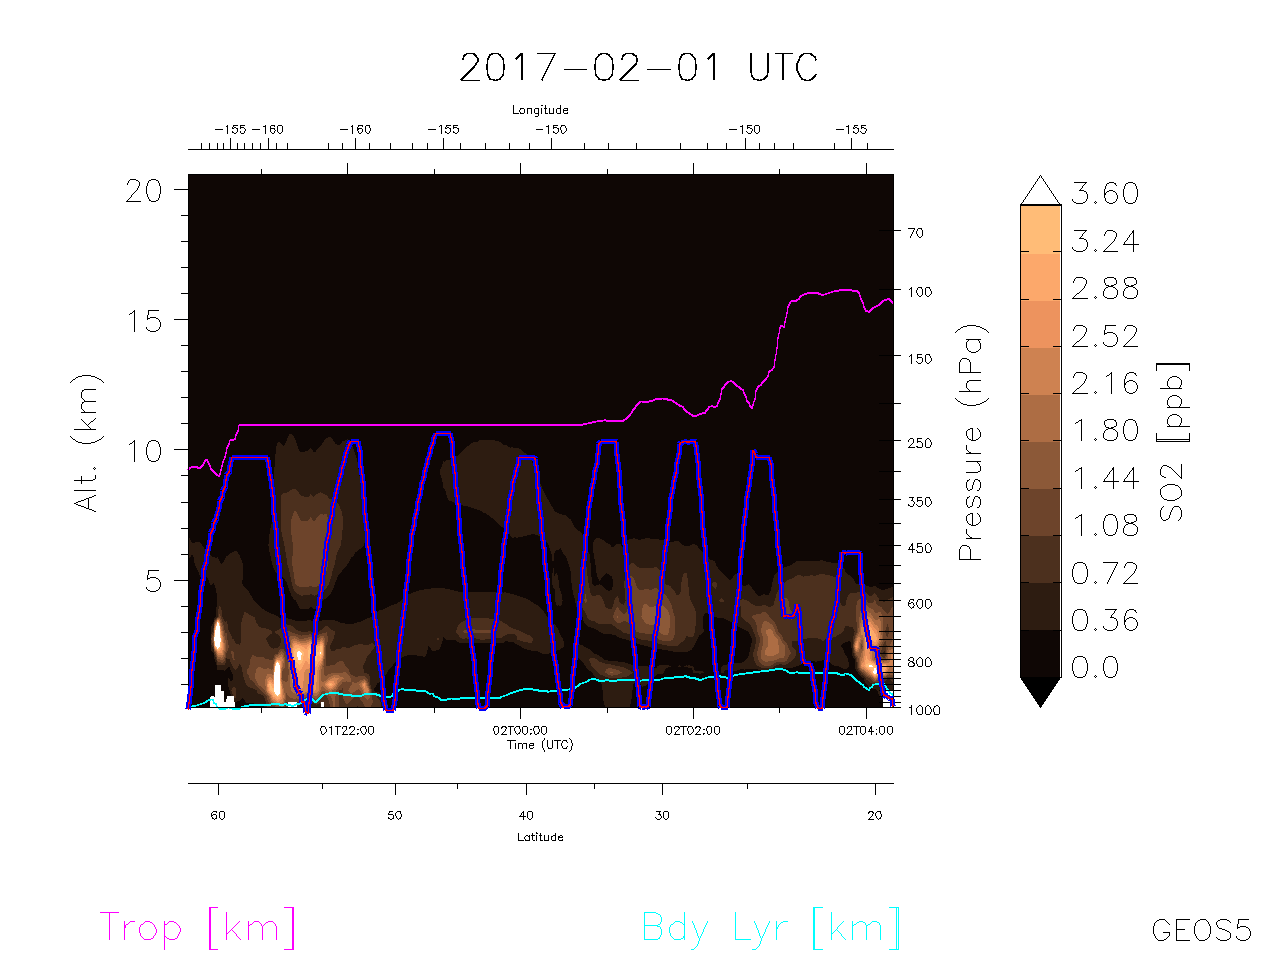
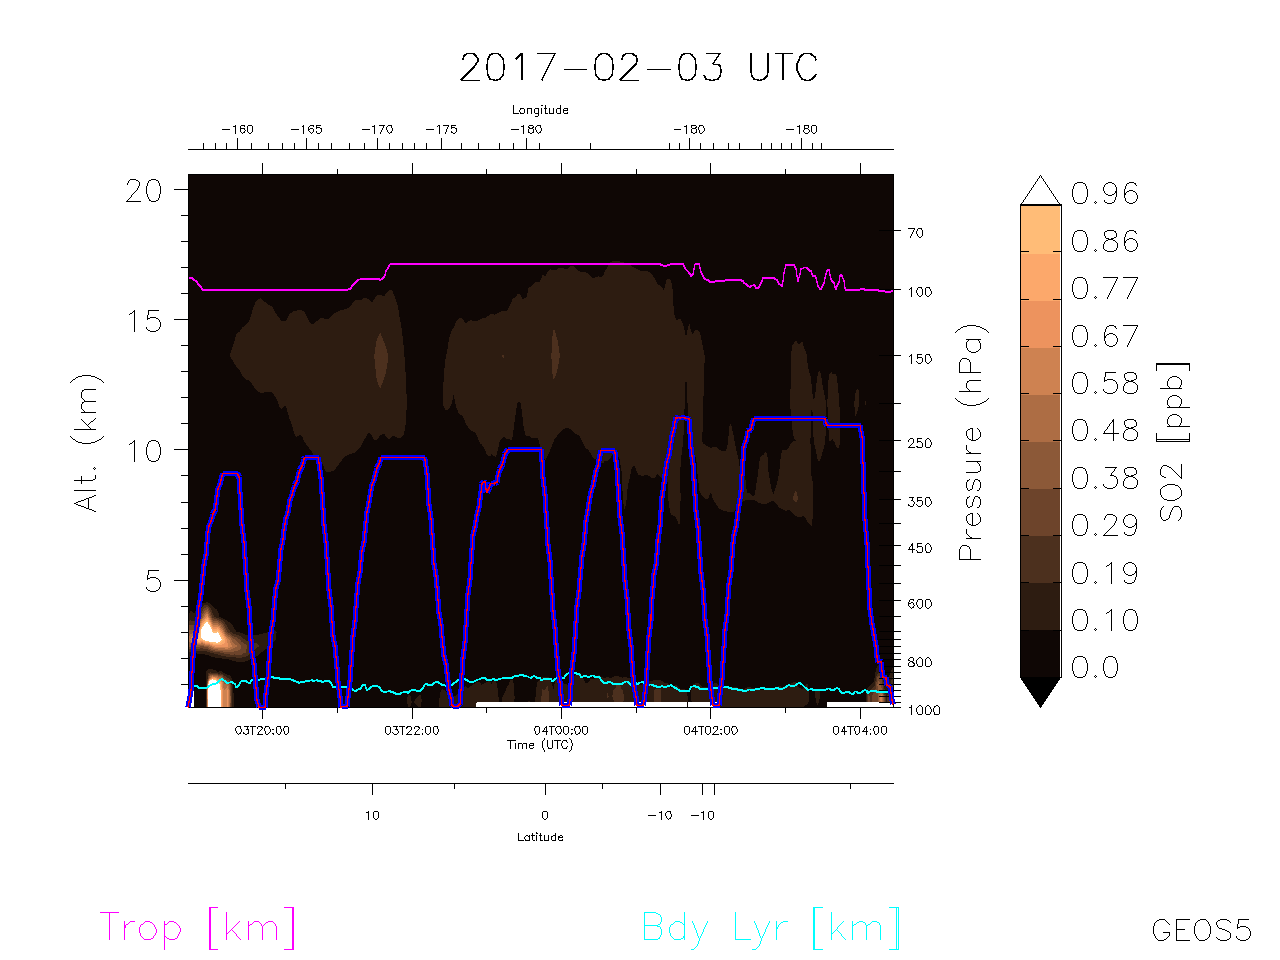
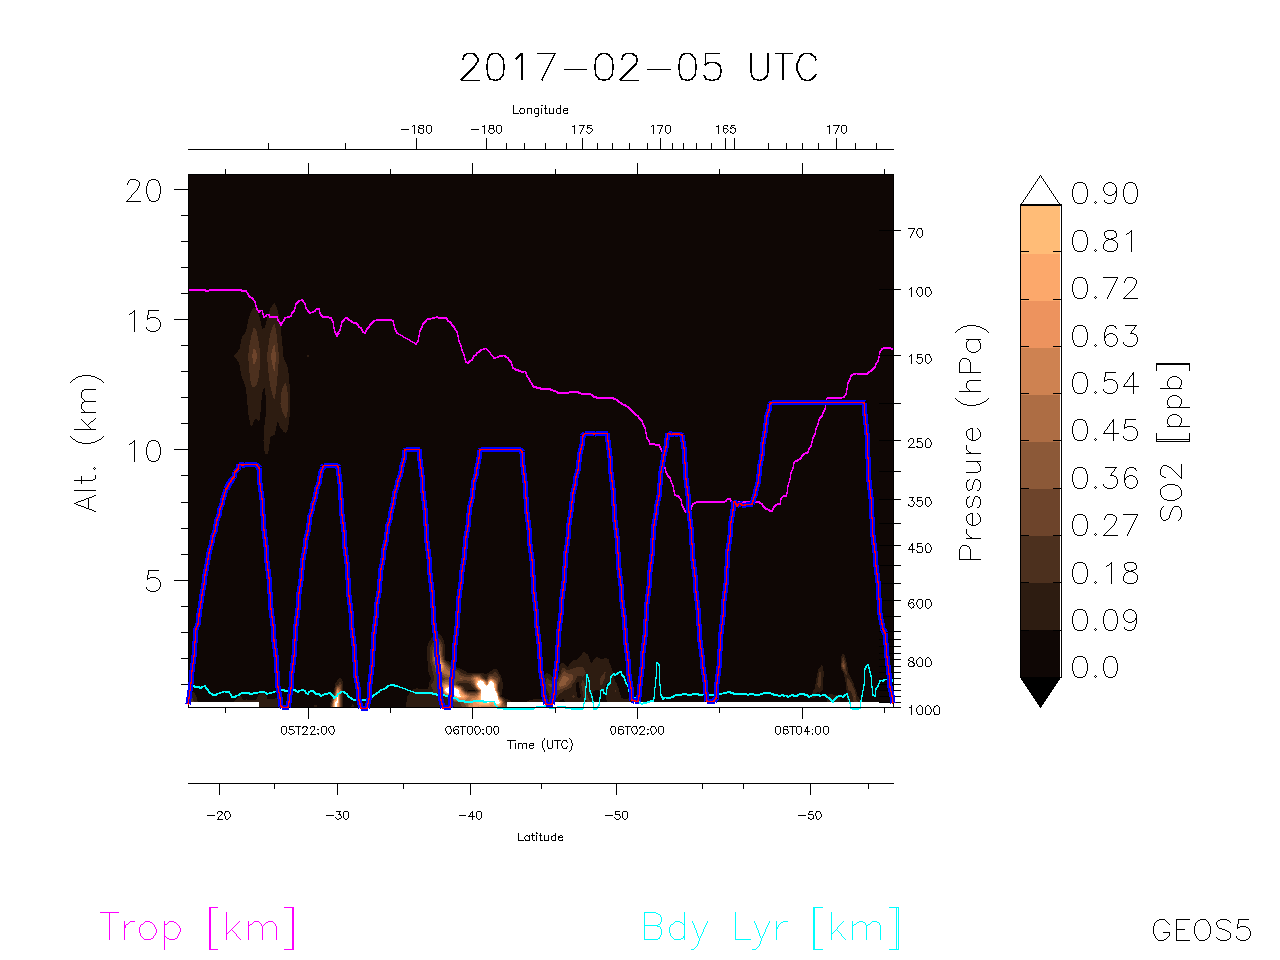
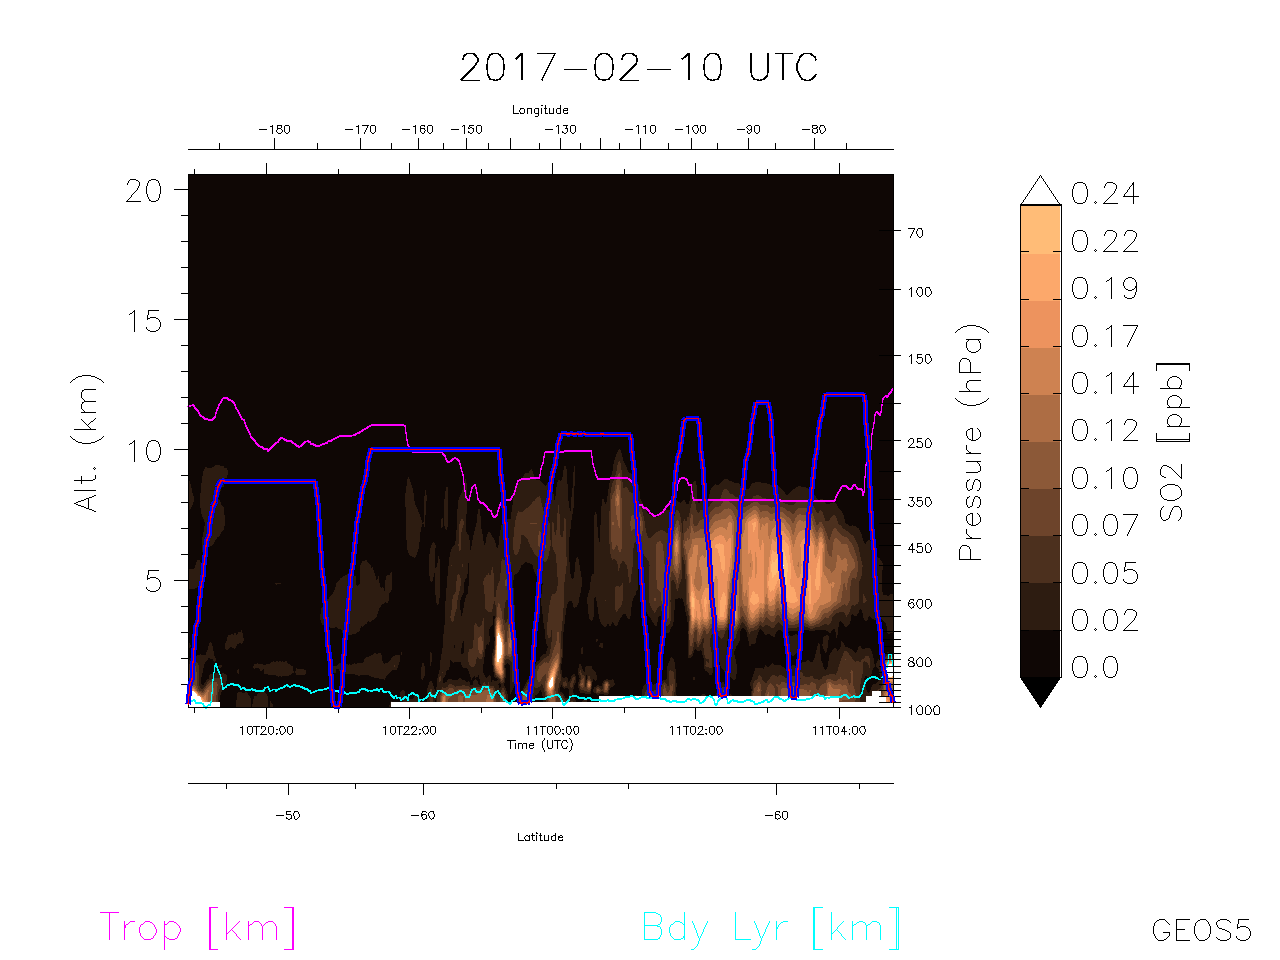
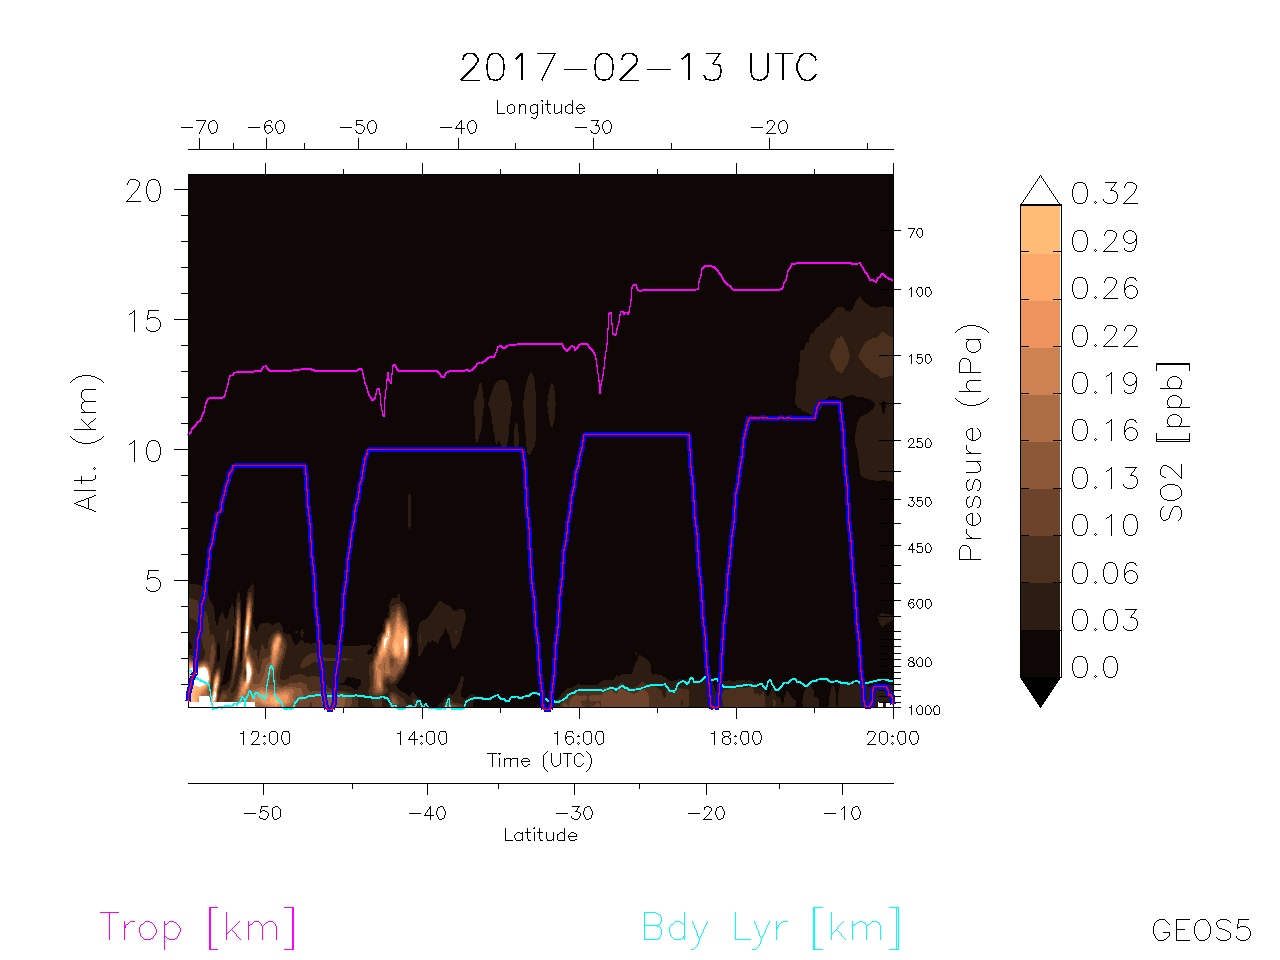
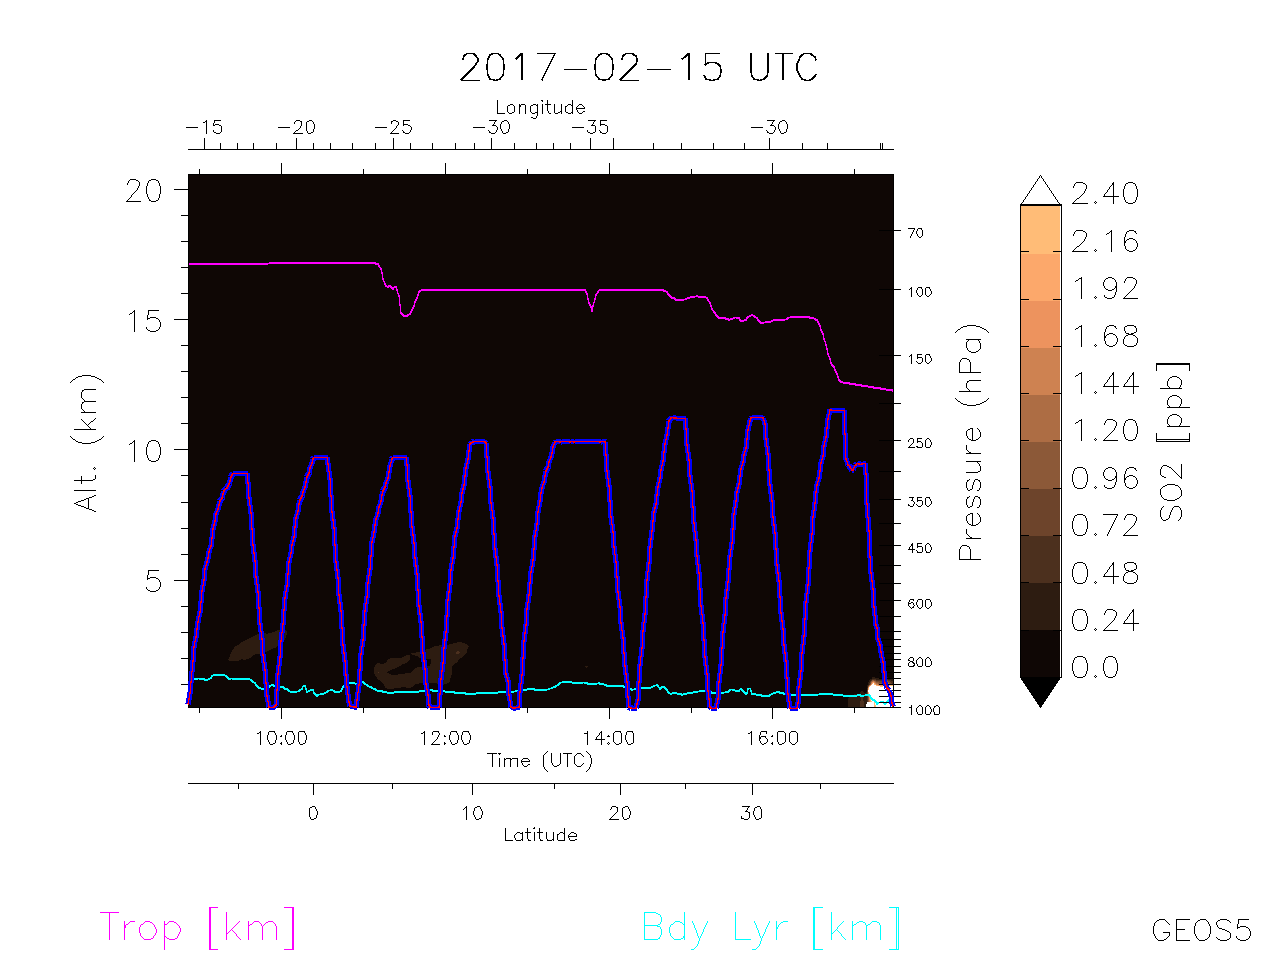
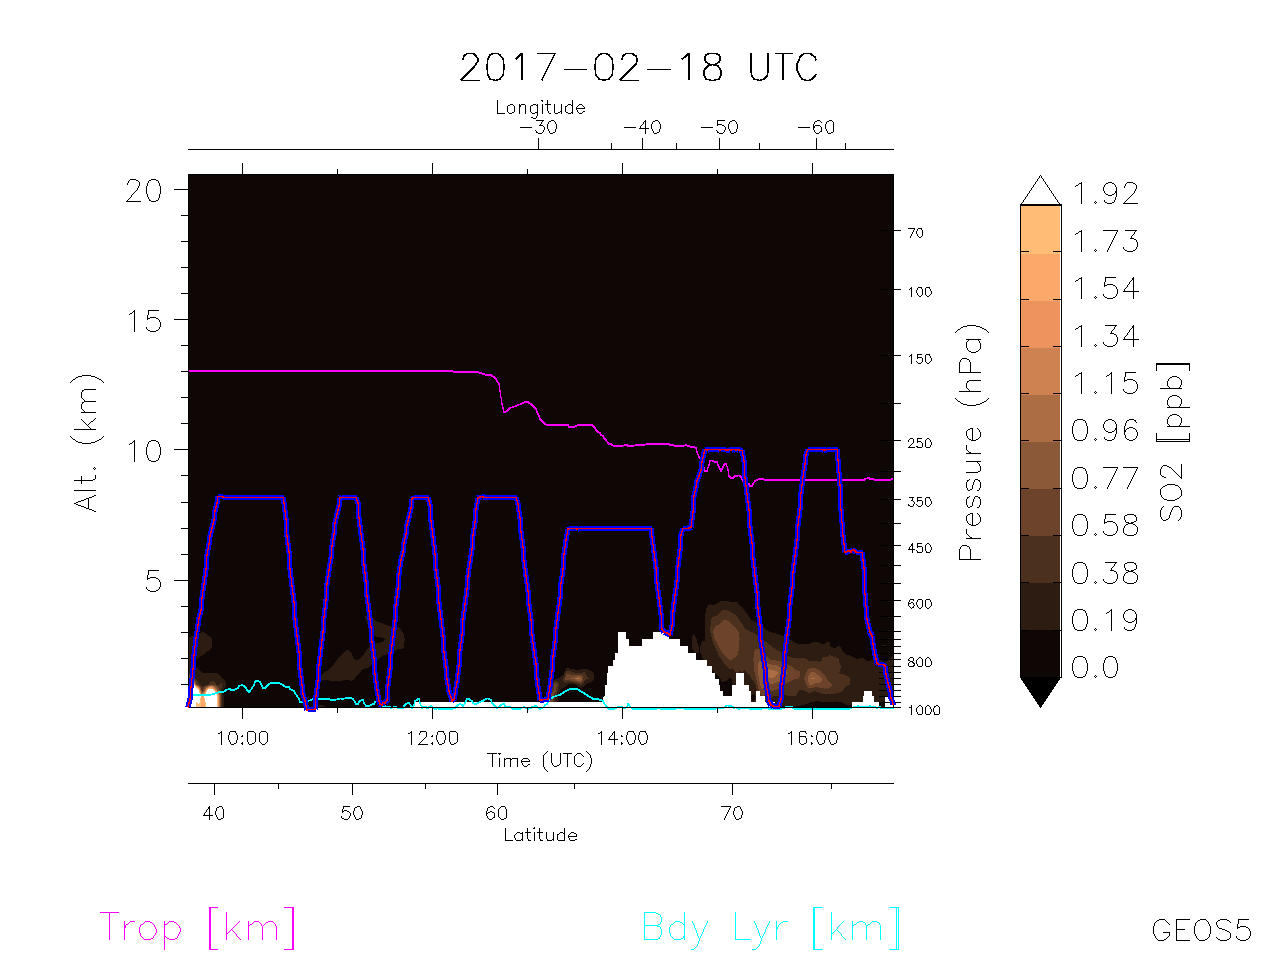
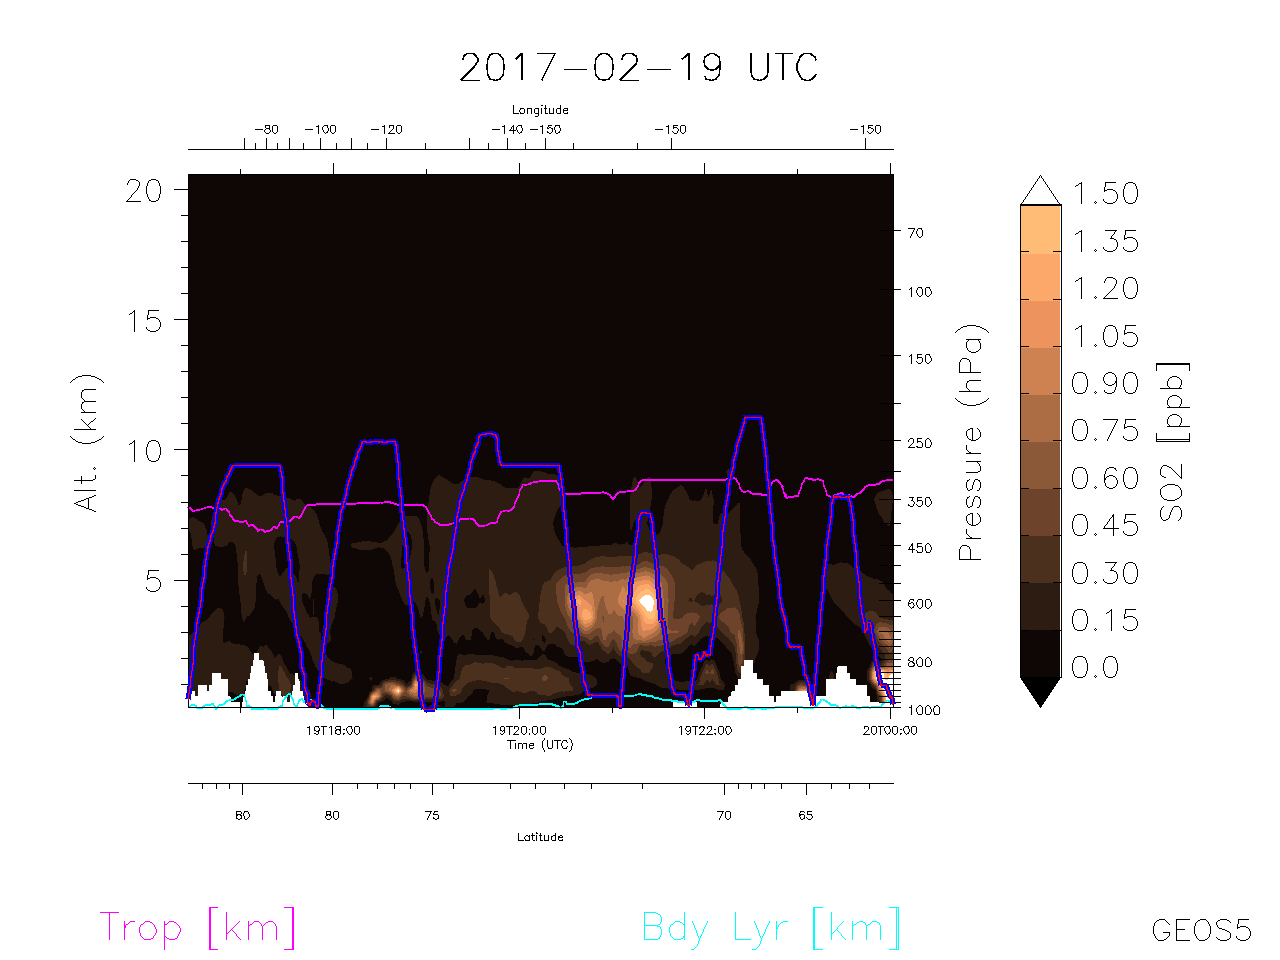
| Curtain of SO2 | 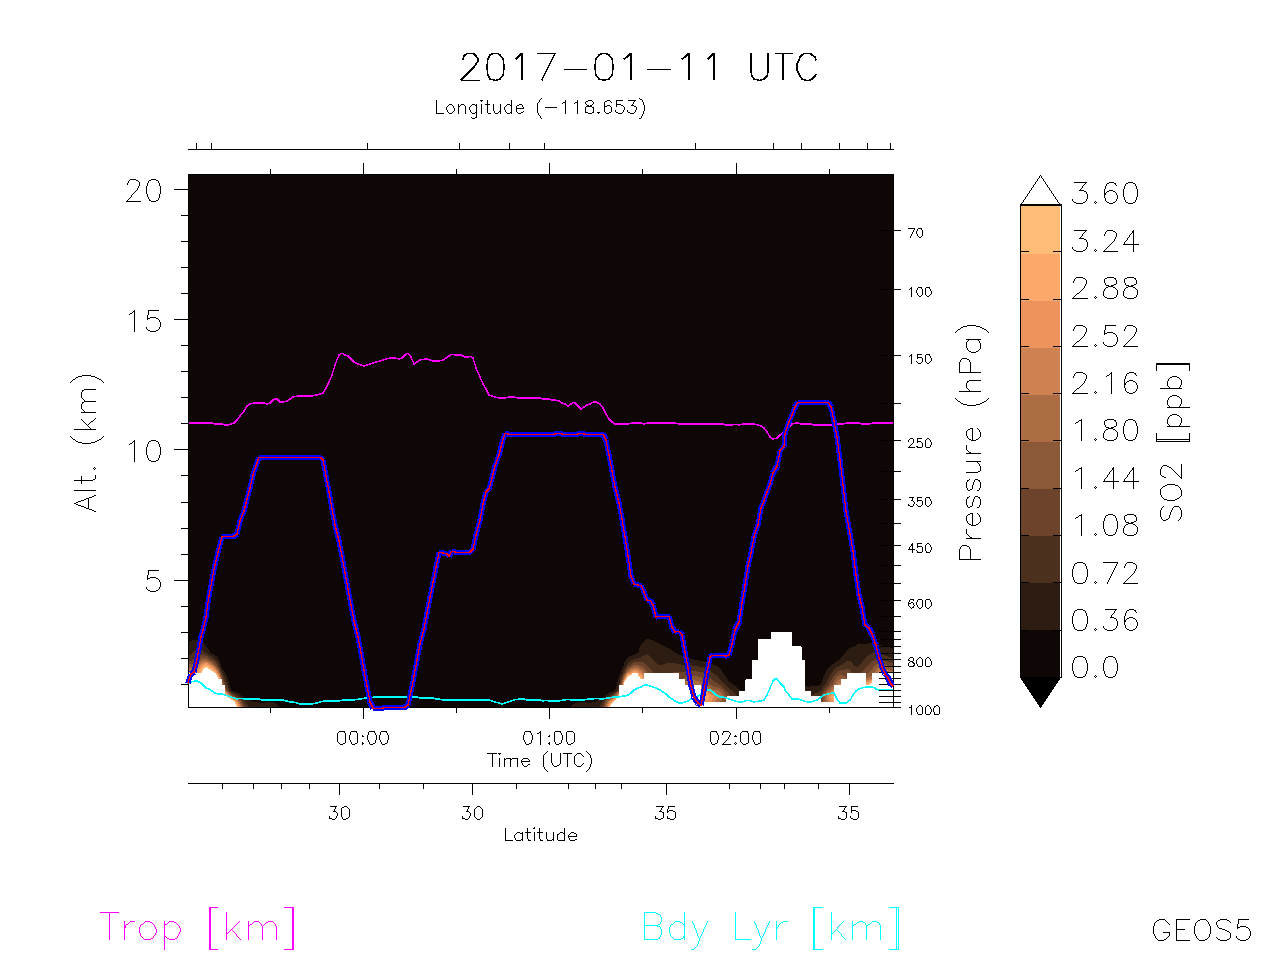 |
 |
 |
 |
 |
 |
 |
 |
 |
 |
 |
 |
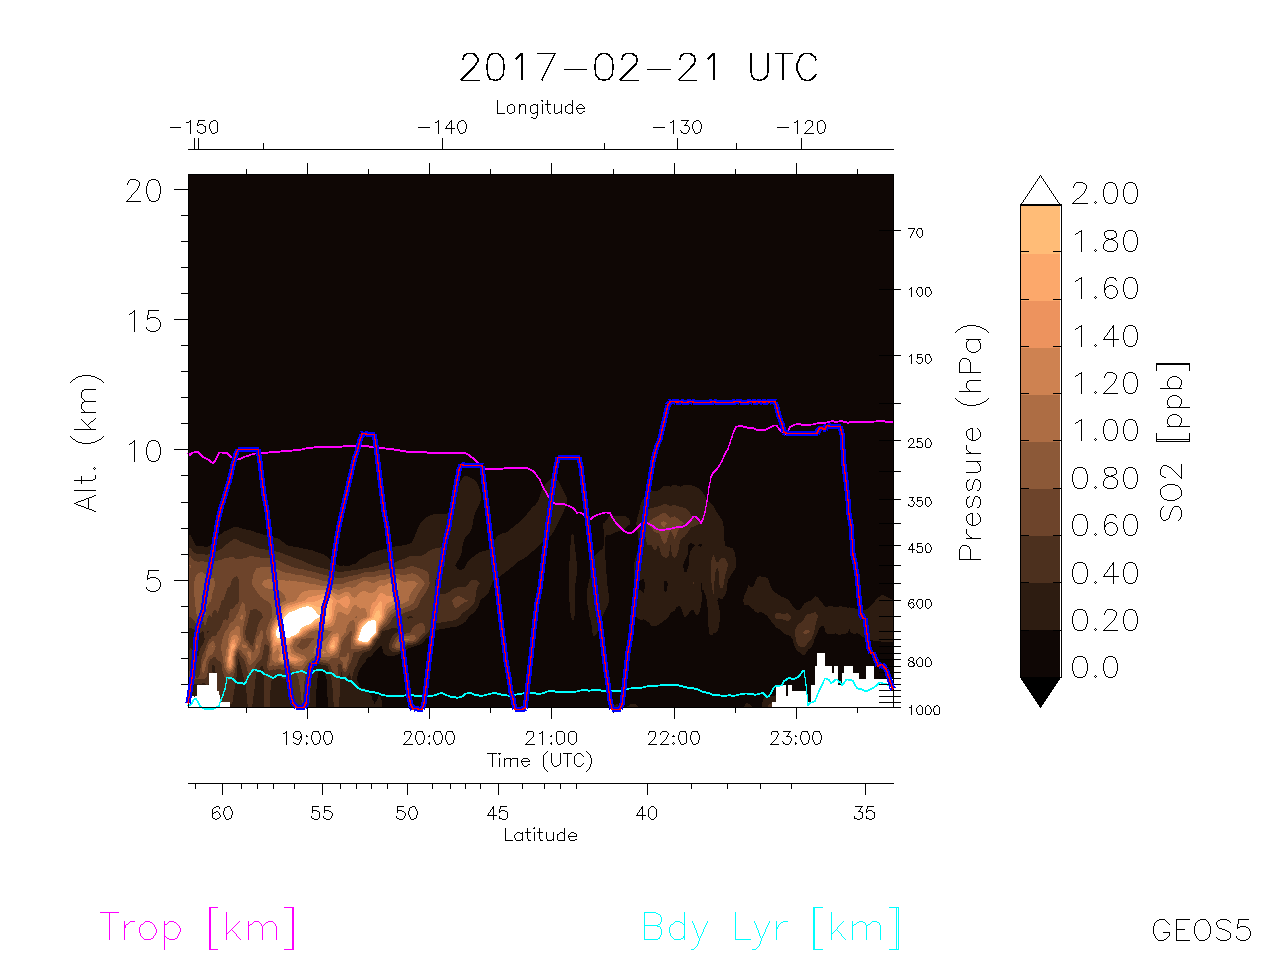 |
Curtain of SO2 |