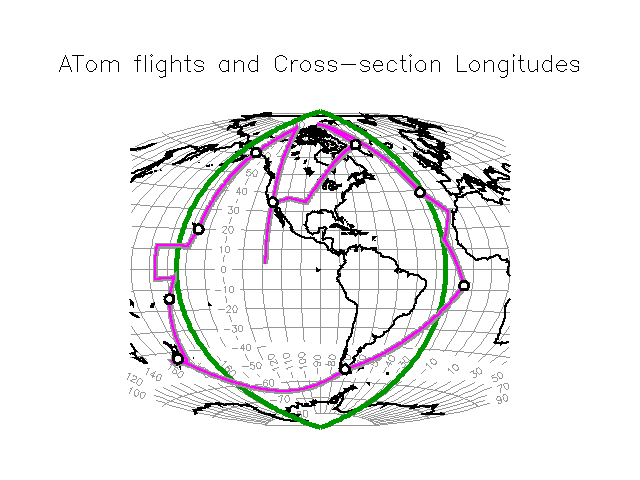
We have calculated statistics of meteorological fields for January 15, April 15, July 15, and October 15 over the 35-year period from 1980 through 2014. These four days give a view of the middle of each season. We provide plots of the mean and standard deviation of a field on pressure surfaces and on latitude-height cross-sections.
Two sources of meteorological data were used, resulting in two sets of plots:
For the pressure surface maps, a set of standard pressure levels was chosen spaced roughly 10,000 feet apart in altitude between the surface and near 50,000 ft. The Hammer map projection is used to get all the flight paths on one map with a minimum of distortion. For the latitude-height cross-sections, two longitude lines were chosen near ATom's Pacific (165 W) and Altantic (25 W) routes, respectively, as shown on the map below.

Rough tentative flight paths have been worked up for the ATom-4 flights.
Rough tentative flight paths have been worked up for the ATom-3 flights.
Rough tentative flight paths have been worked up for the ATom-2 flights.
Rough tentative flight paths have been worked up for the ATom-1 flights. The timings shown include vertical profile maneuvers (VPMs) from maximum altitude to near the surface. Note that over some regions (e.g., North America) the number of VPMs will be very much reduced, shortening the flight duration; thus these timings are conservative estimates.
Note that the airport codes for the takeoff and landing sites are part of the flight name. (E.g., "BGSF" is Kangerlussuaq.) Great circle routes are used throughout. The routes are shown on the map above.
There are "ten" flights. The last flight is broken into two parts separated by an overnight stay, but future ATom campaigns will use Thule instead of Kangerlussuaq, and the overnight stay may no longer be necessary. Because these two parts may be combined into one flight, for ease of reference when comparing campaigns we will refer to these both as flight "09": "09a" and "09b".