
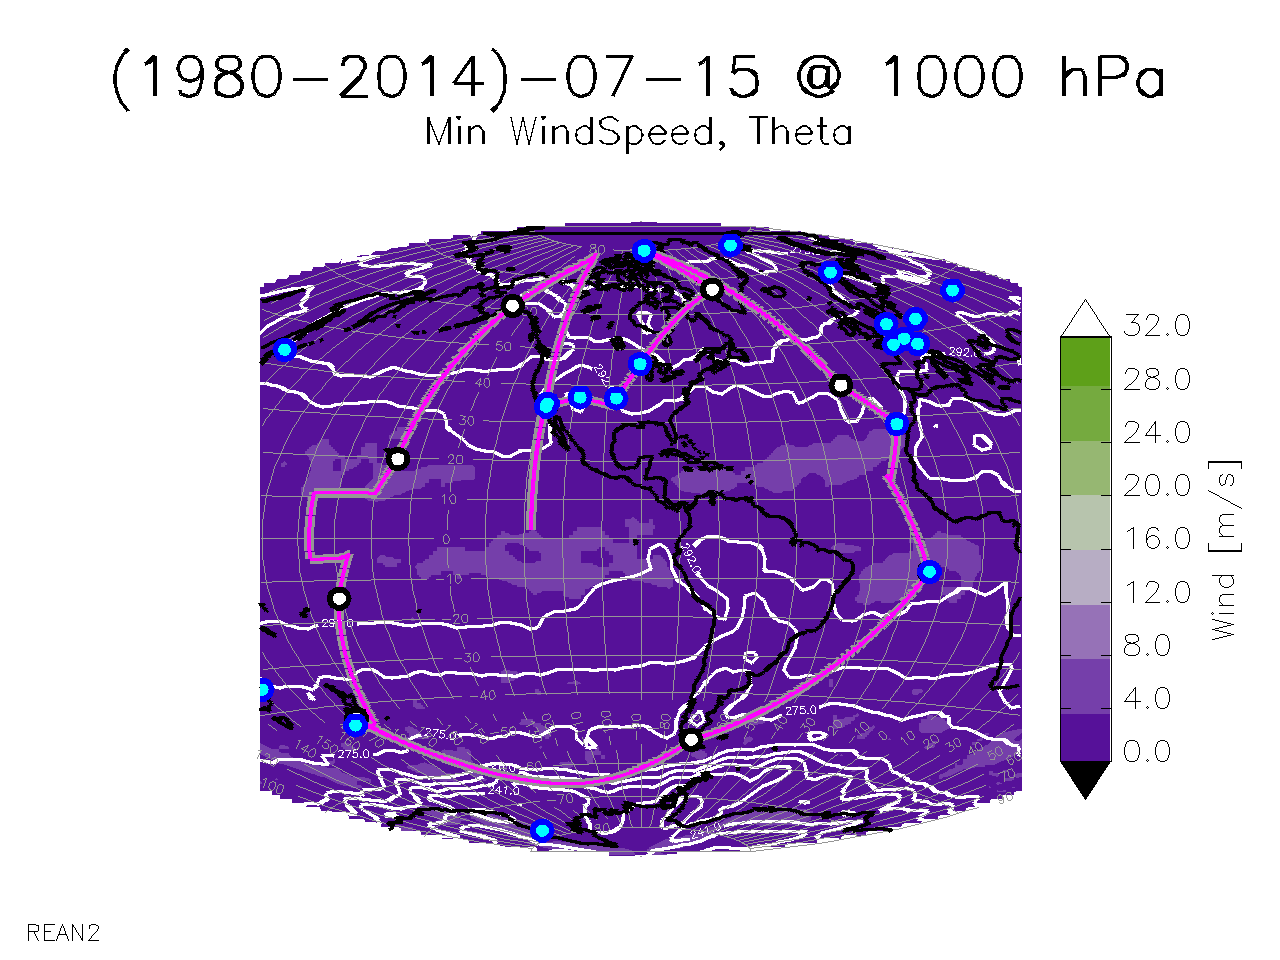
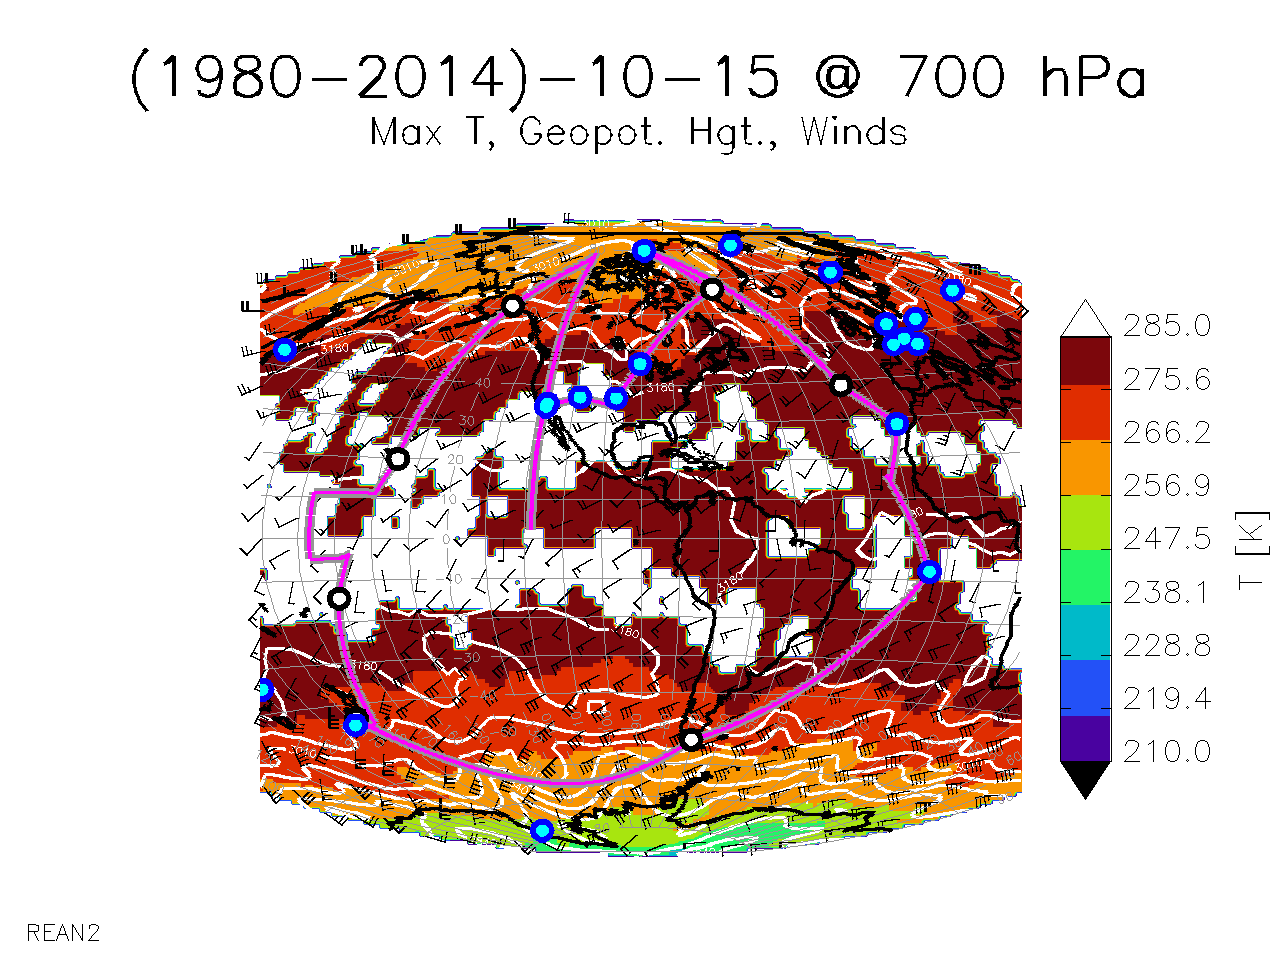
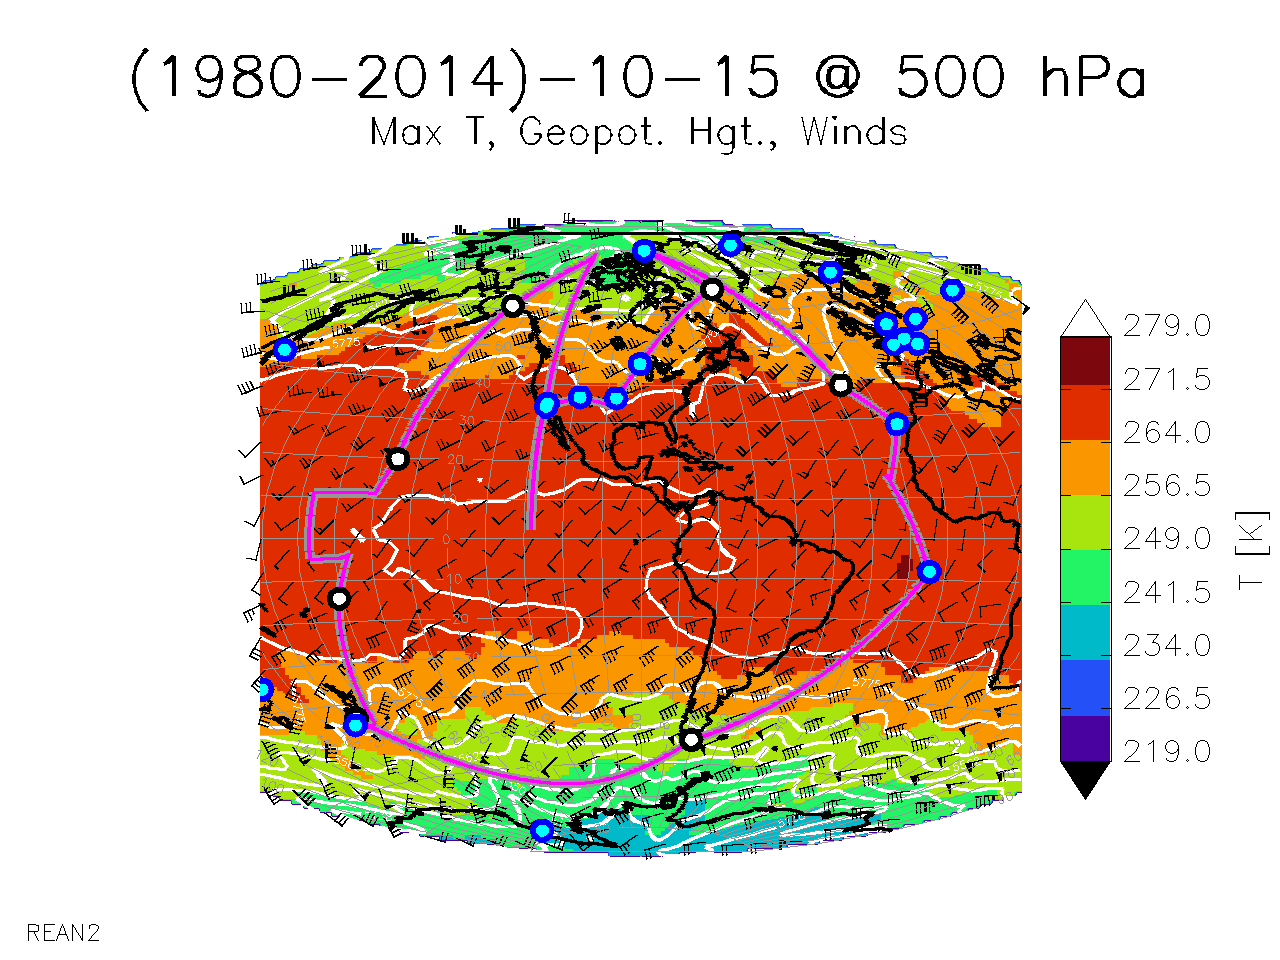
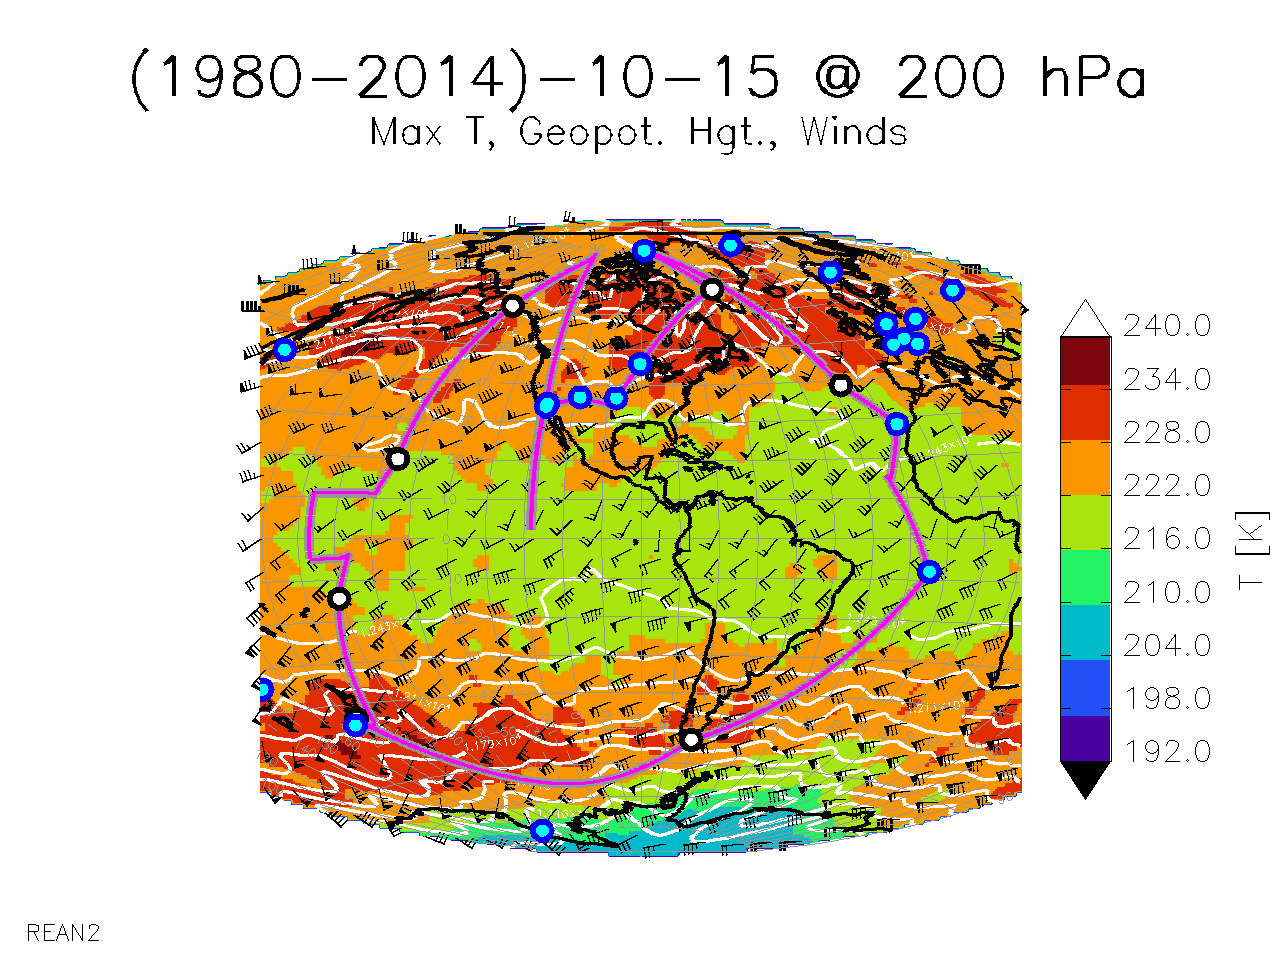
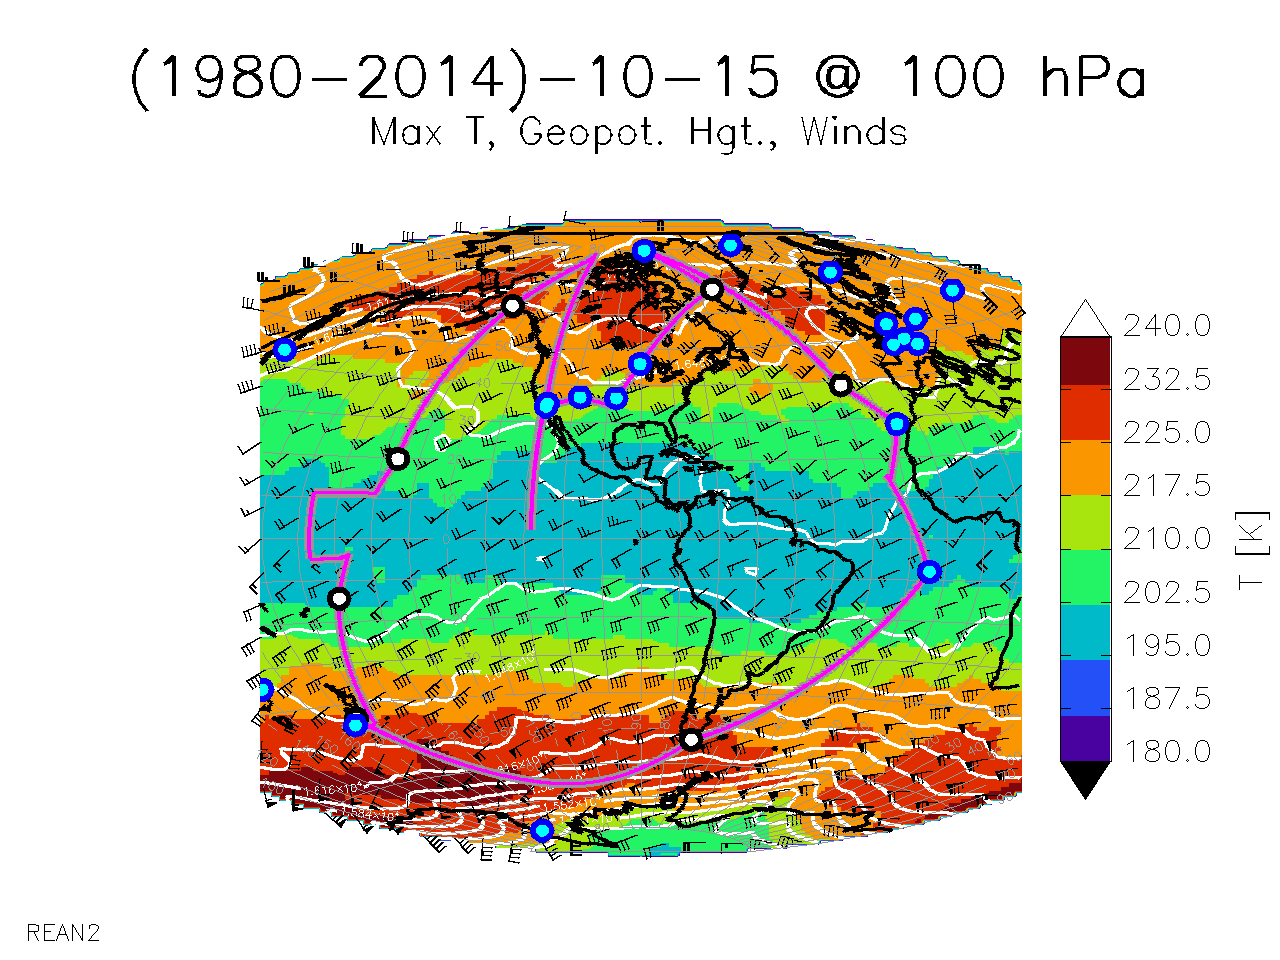
In the table below, sample thumbnail images only are shown. Follow the links underneath each image to view the individual plot that you want.
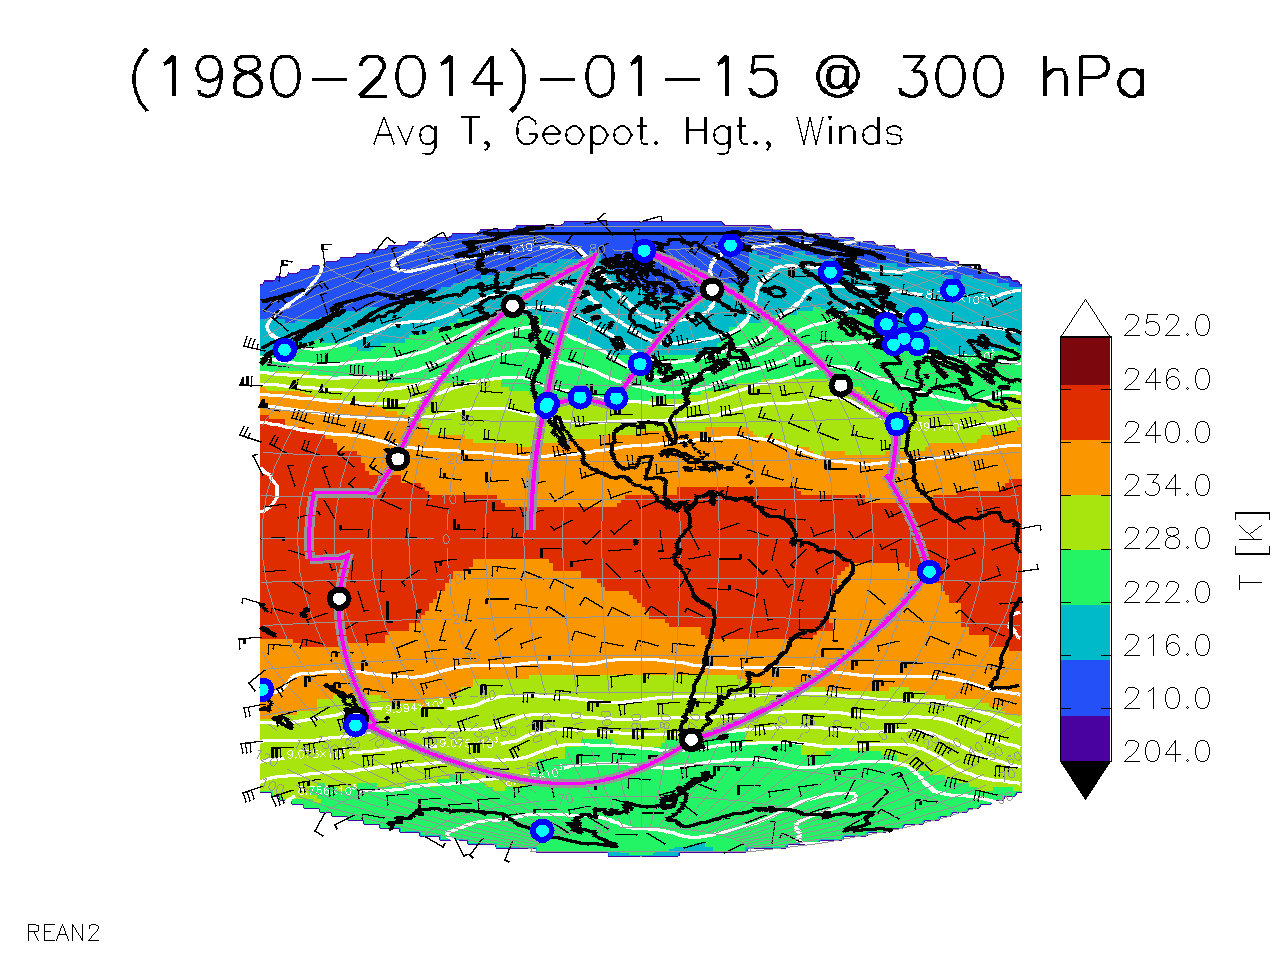
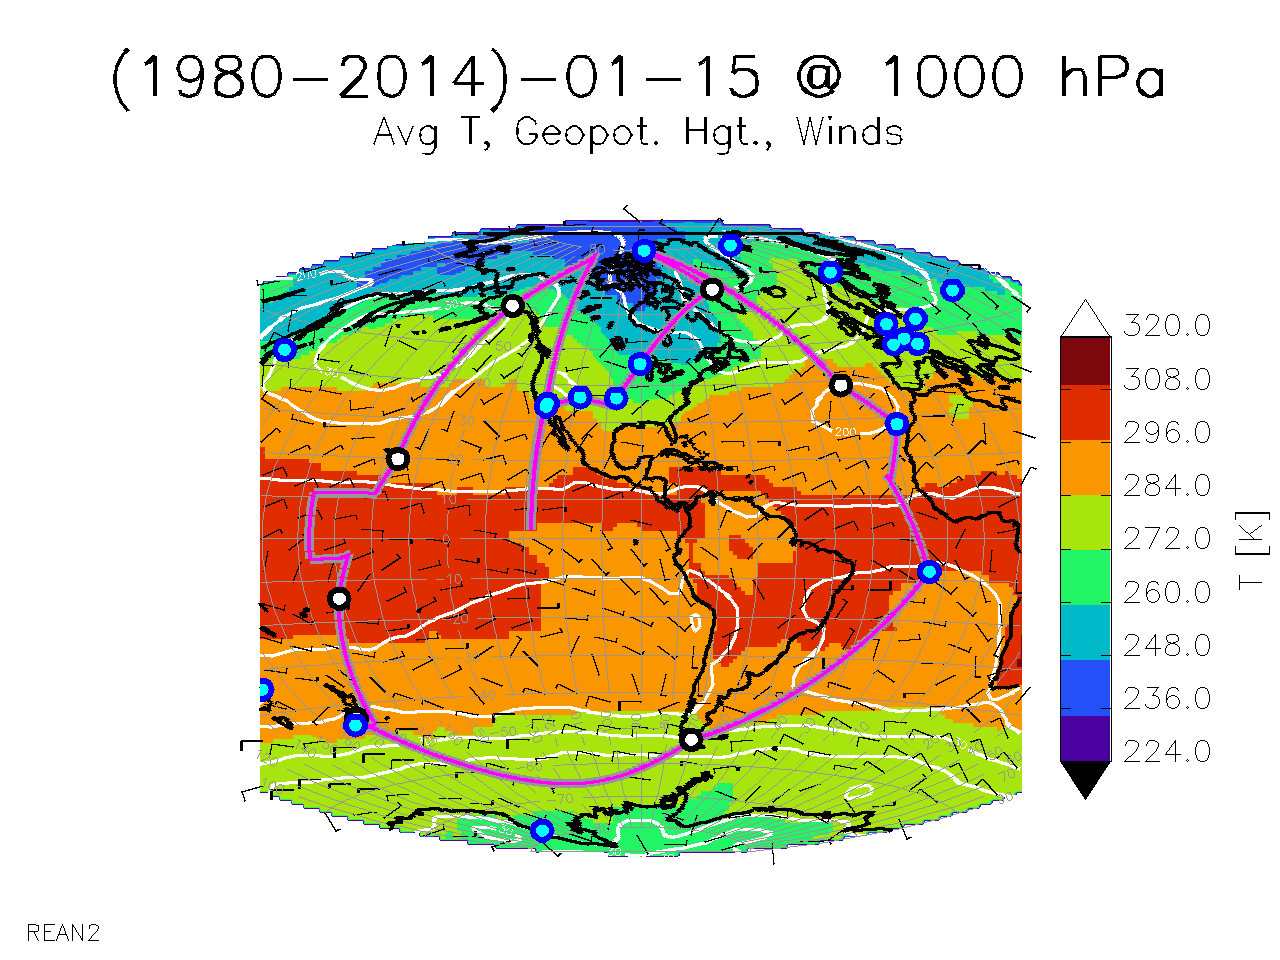
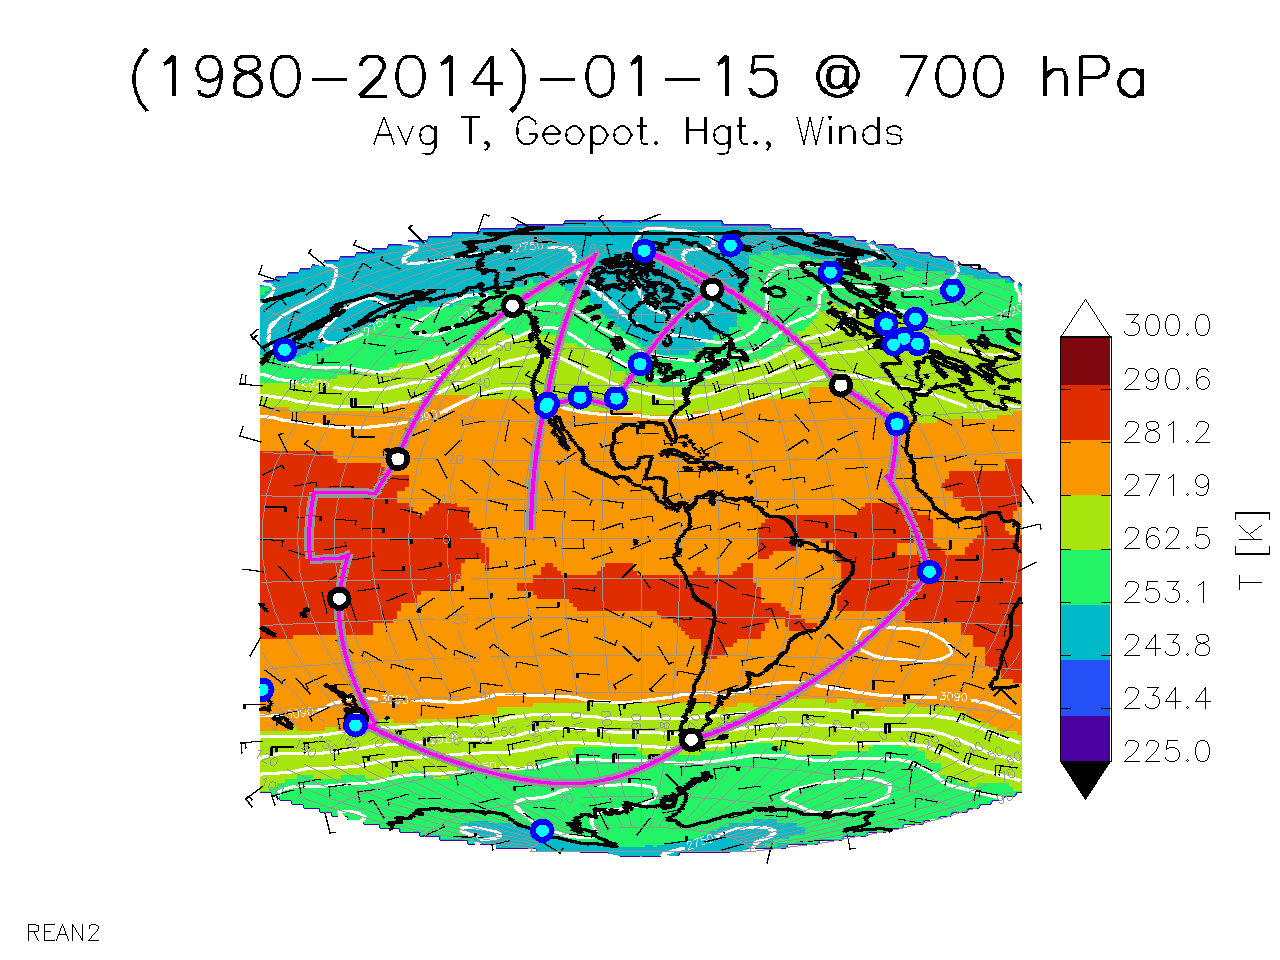
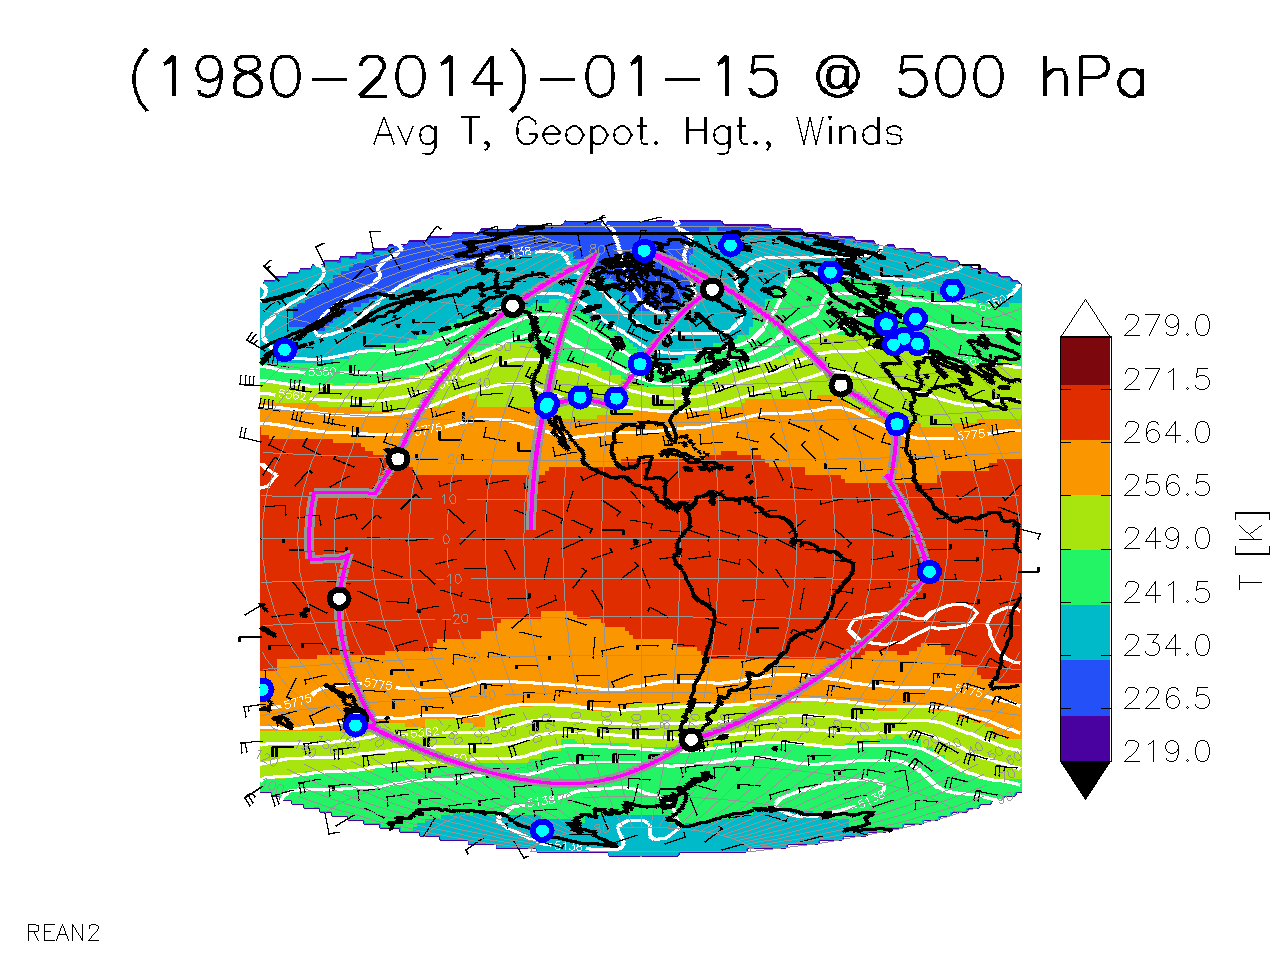
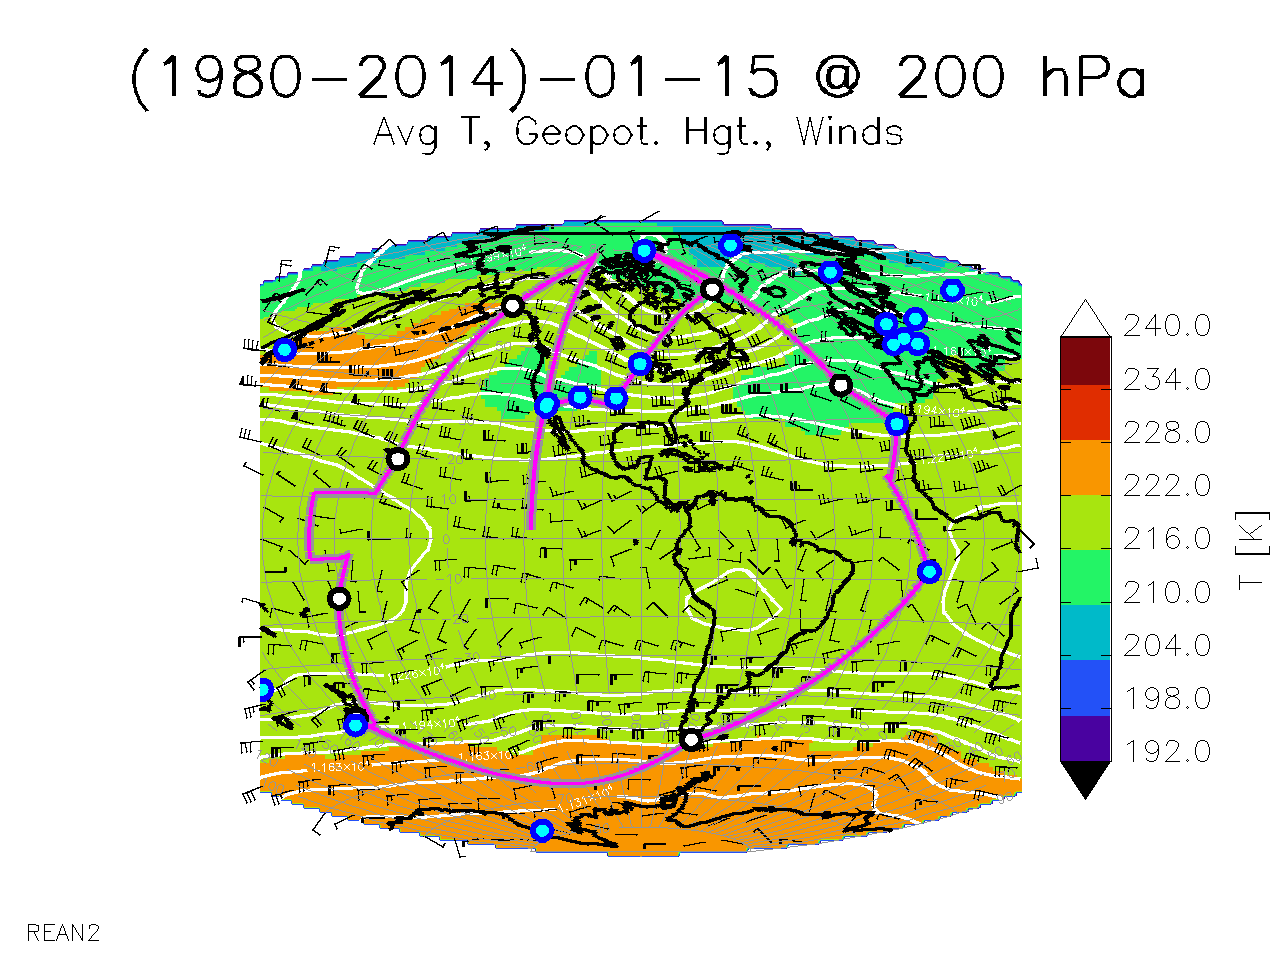
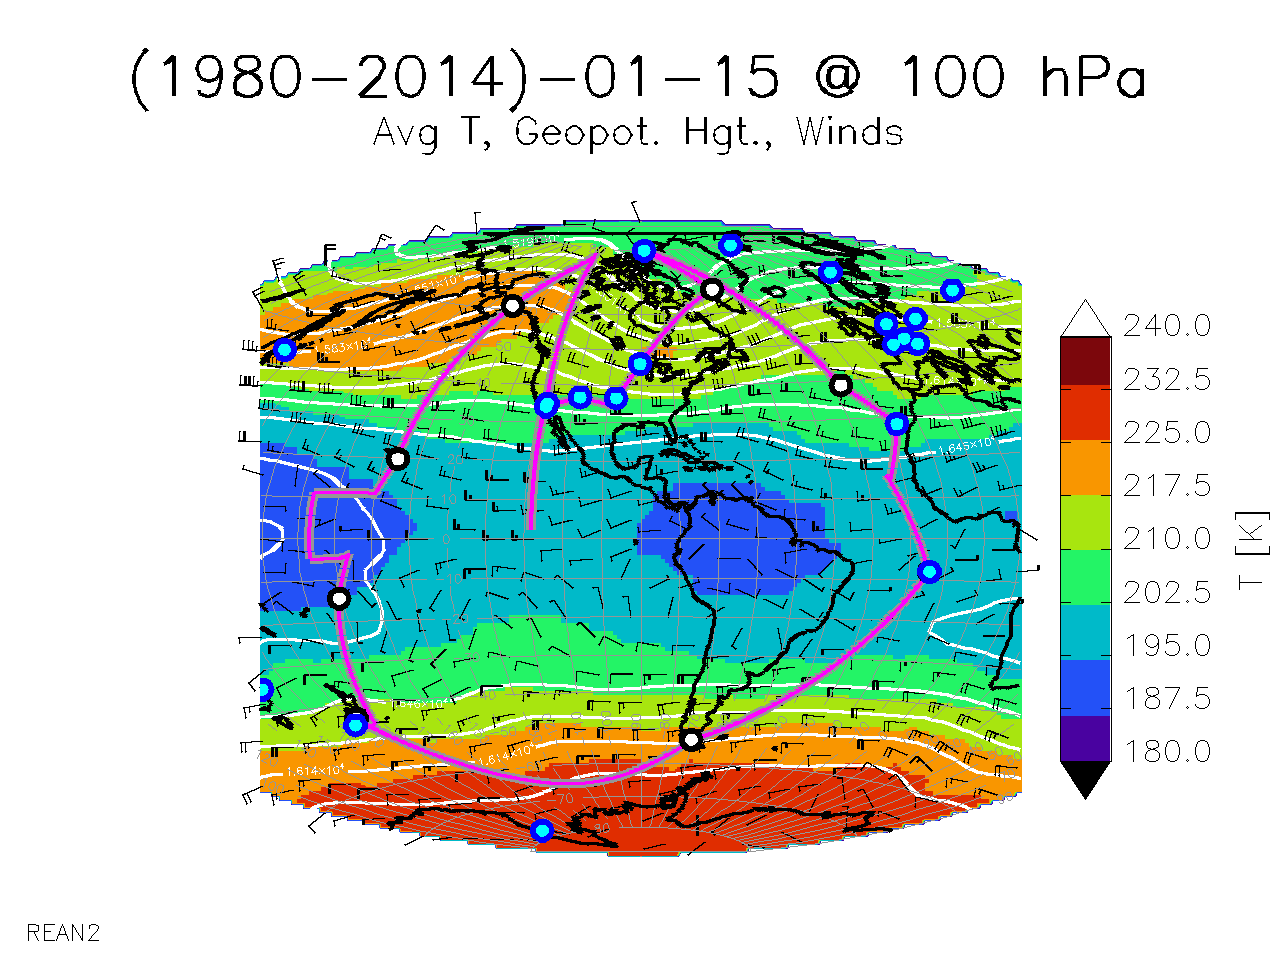
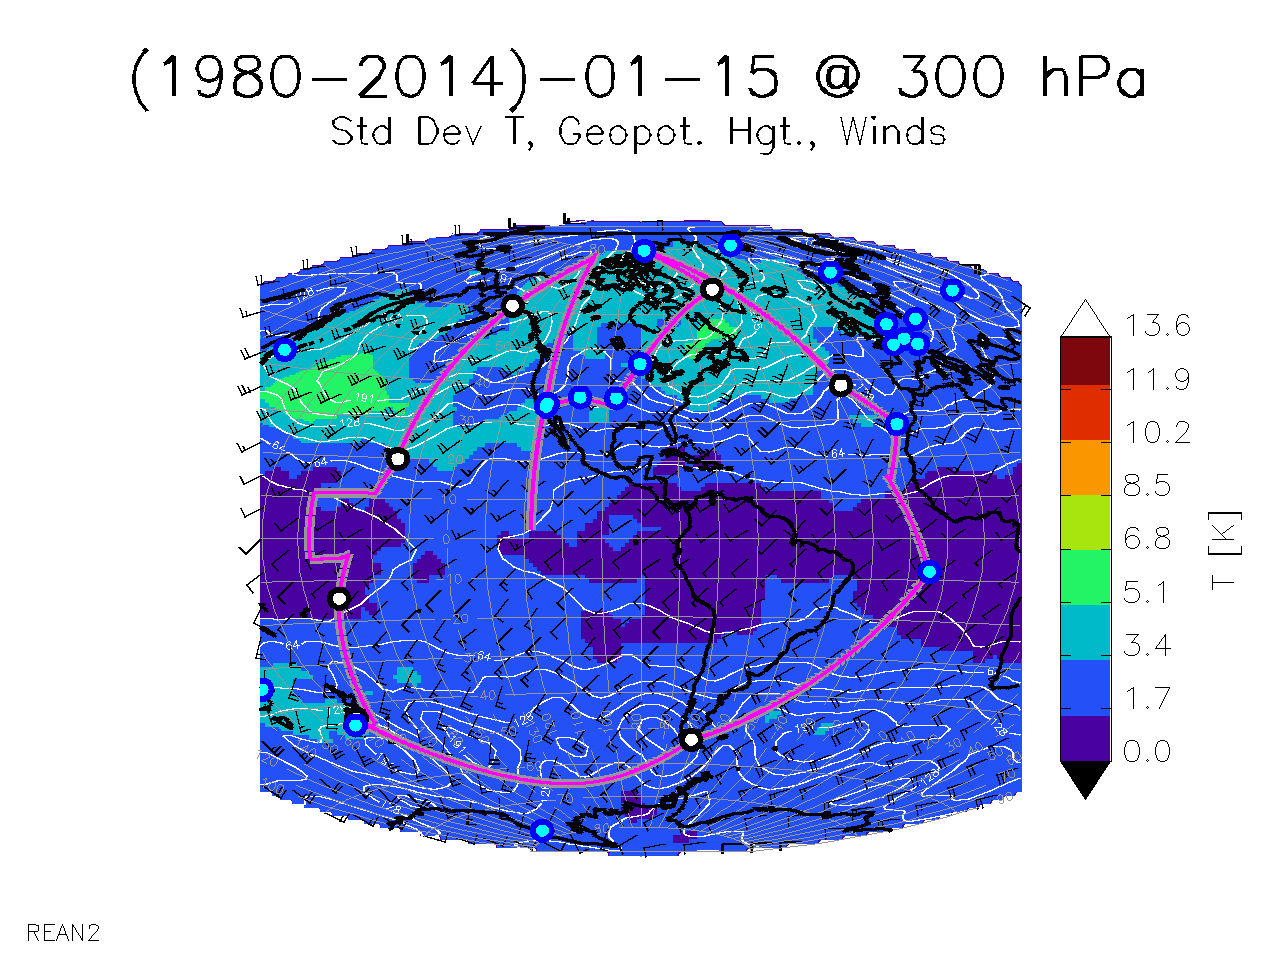
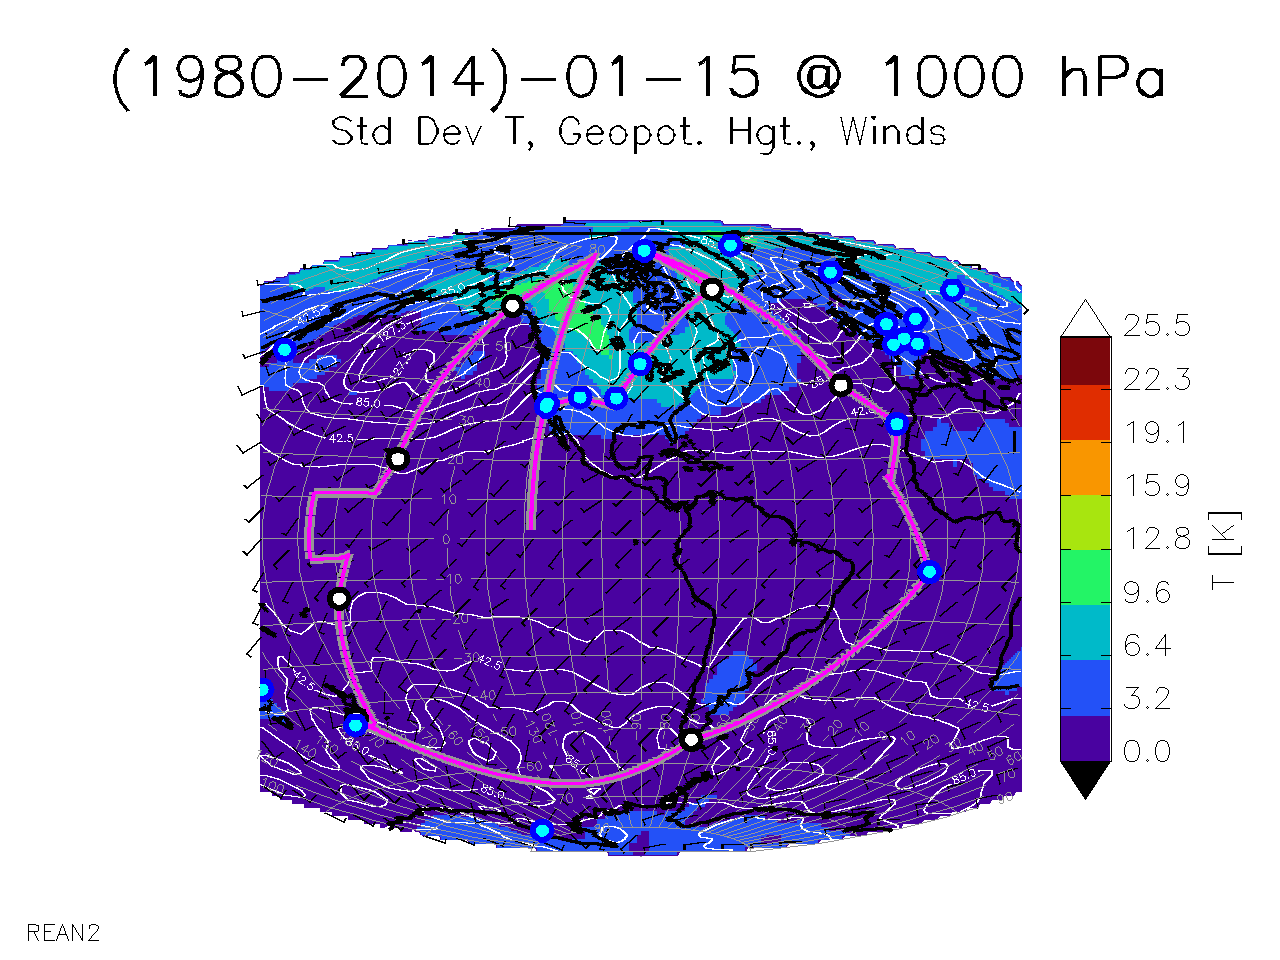
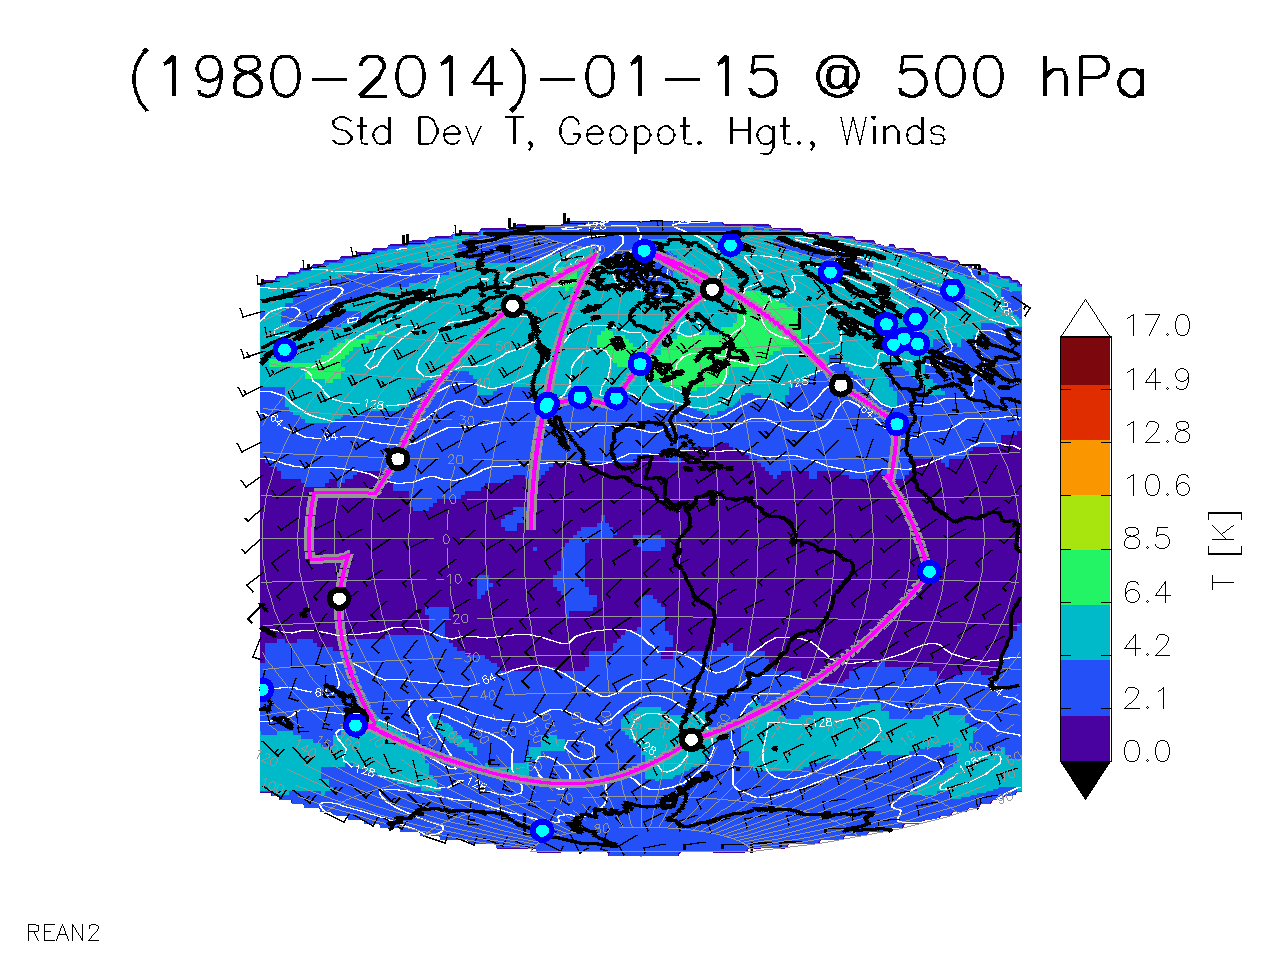
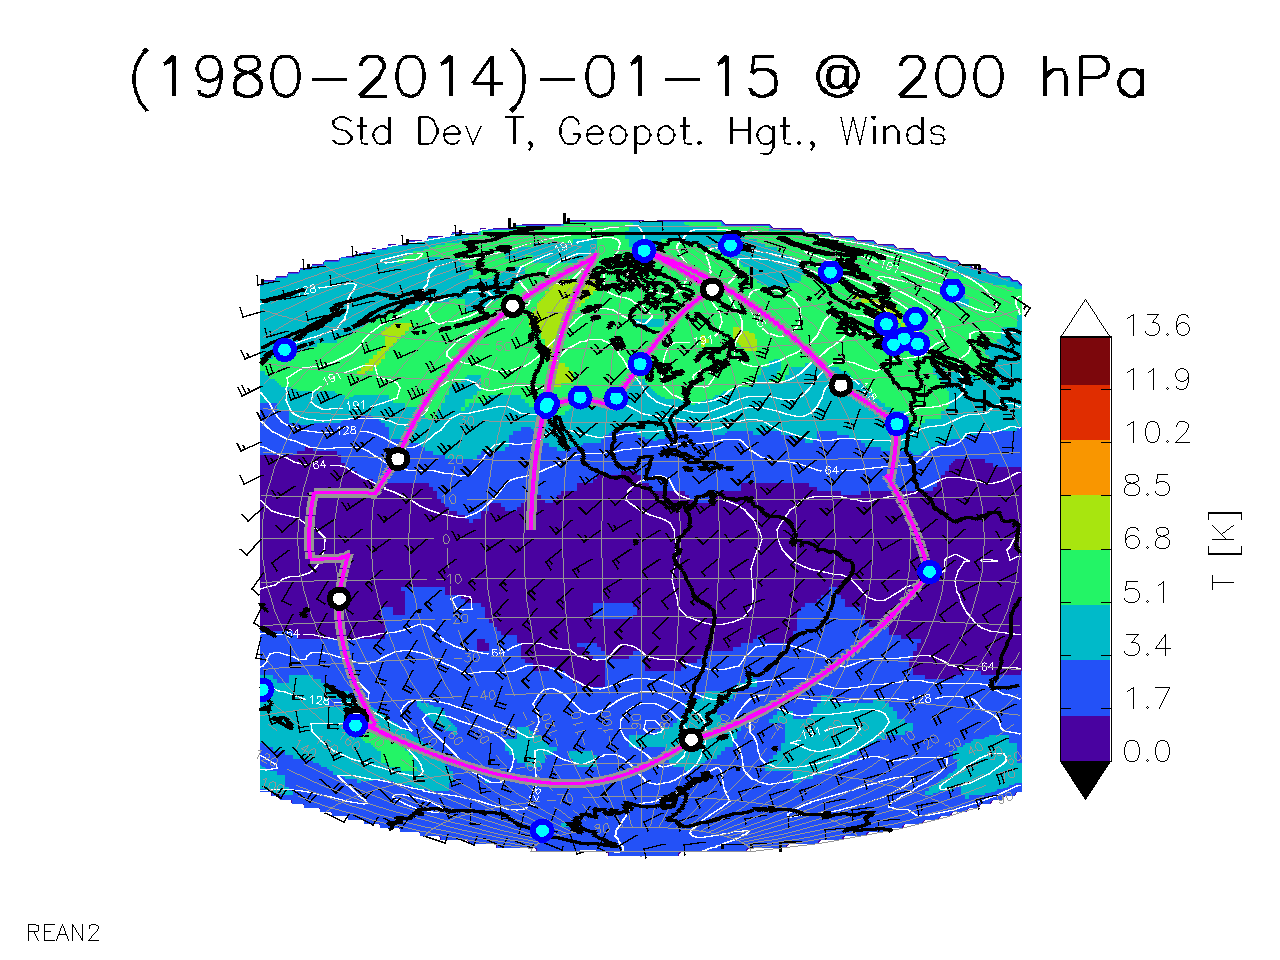
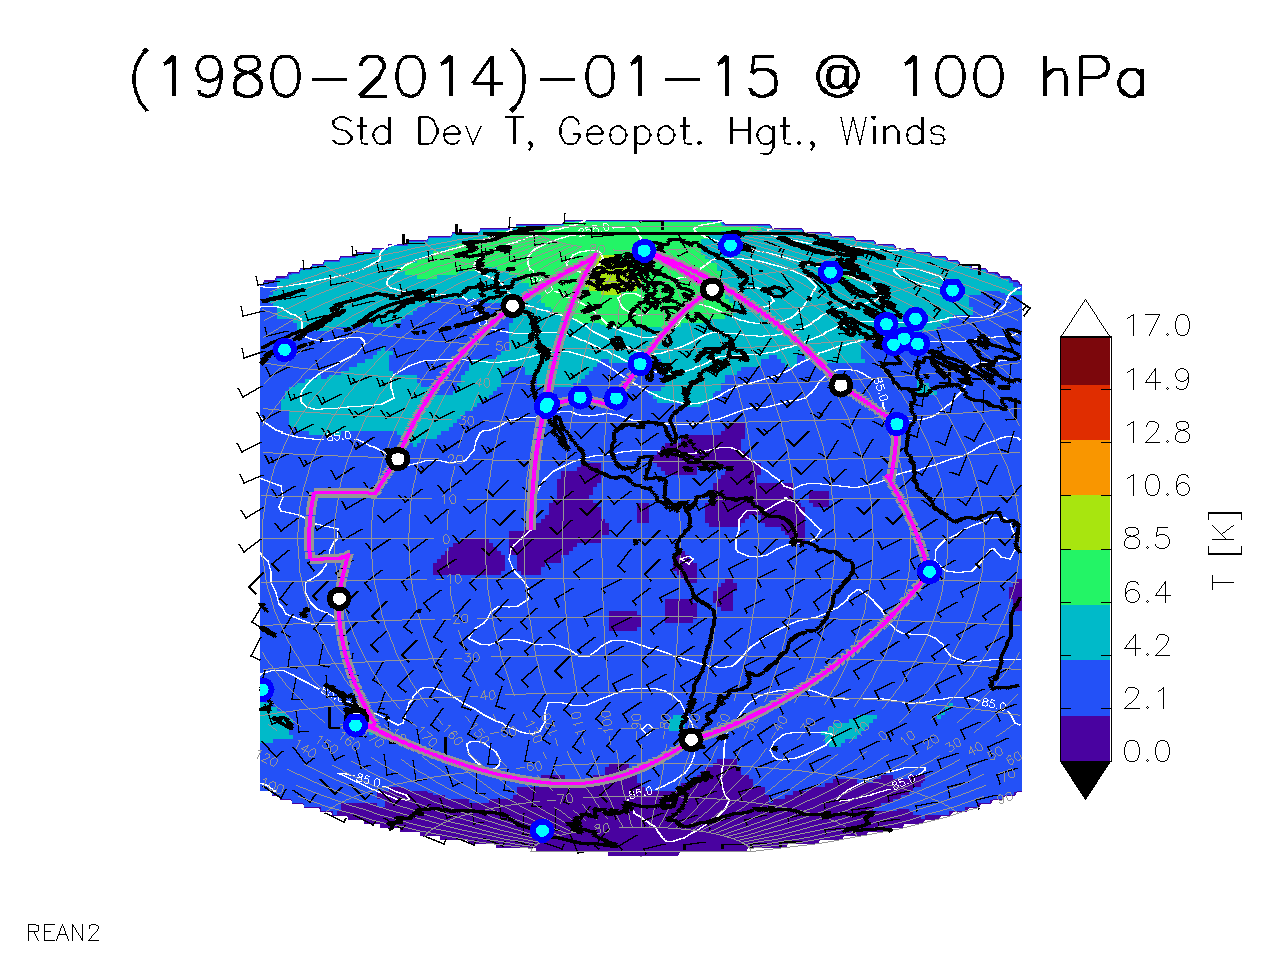
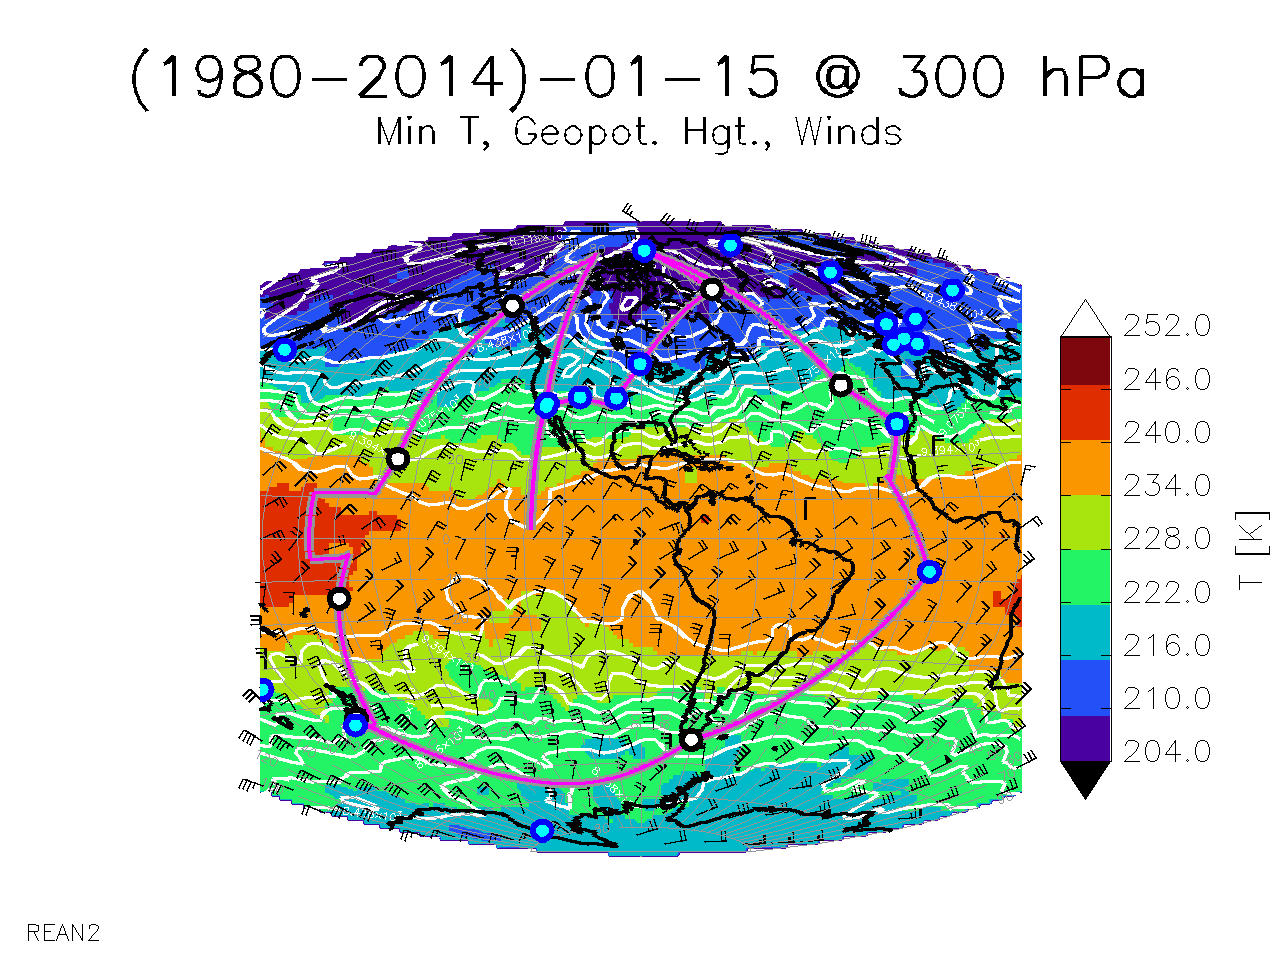
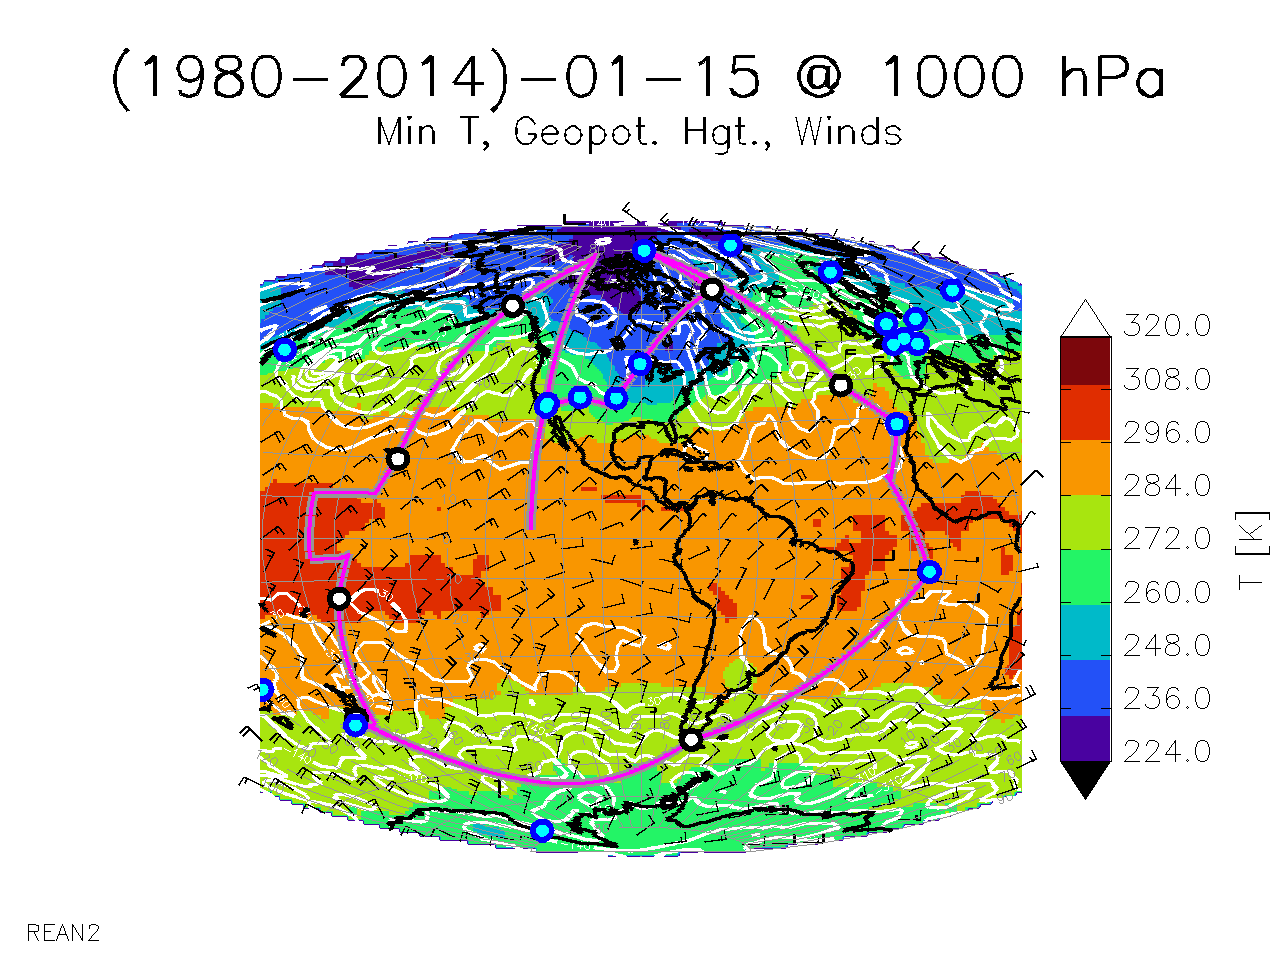
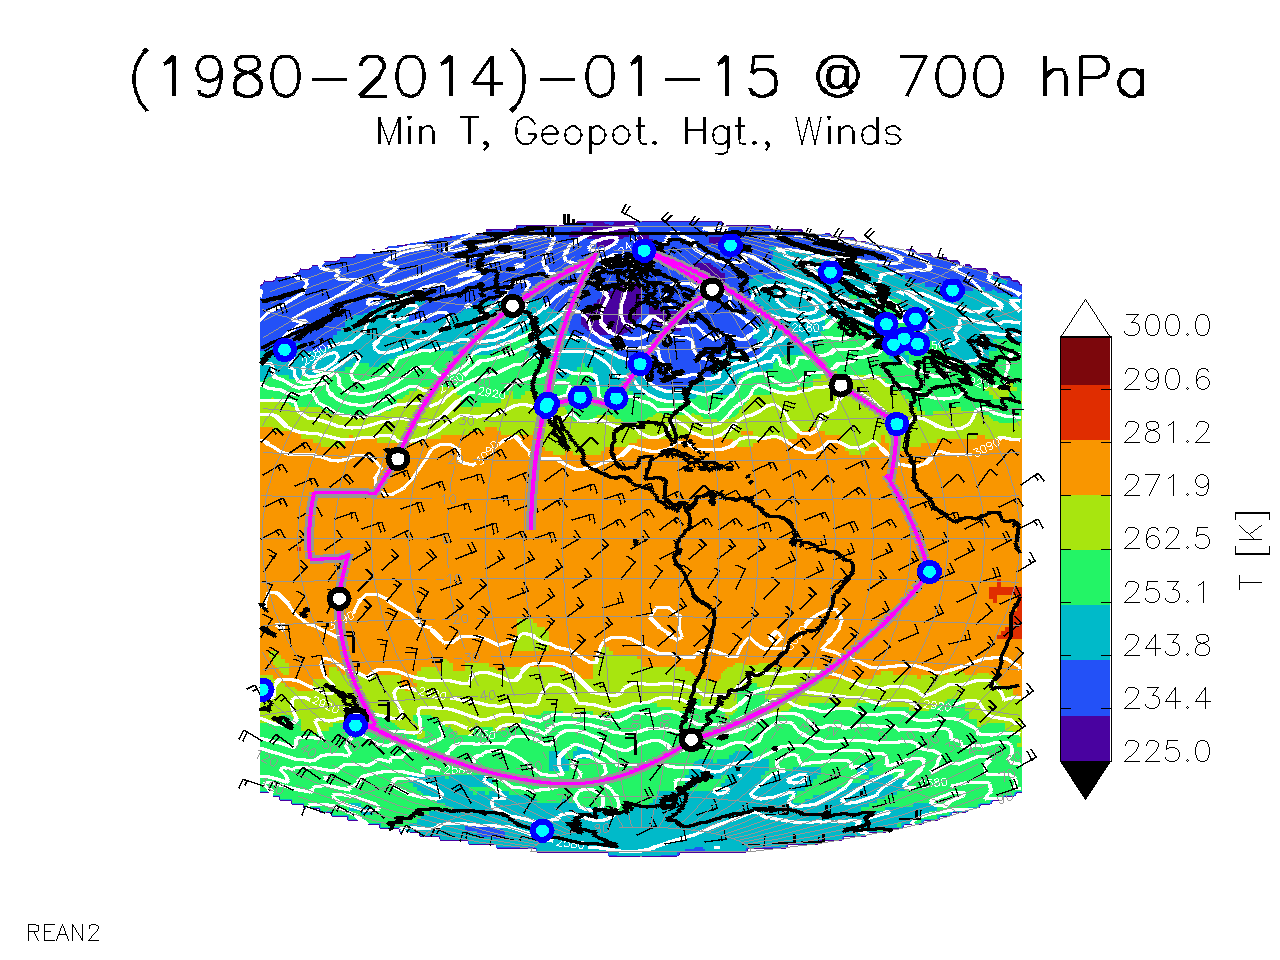
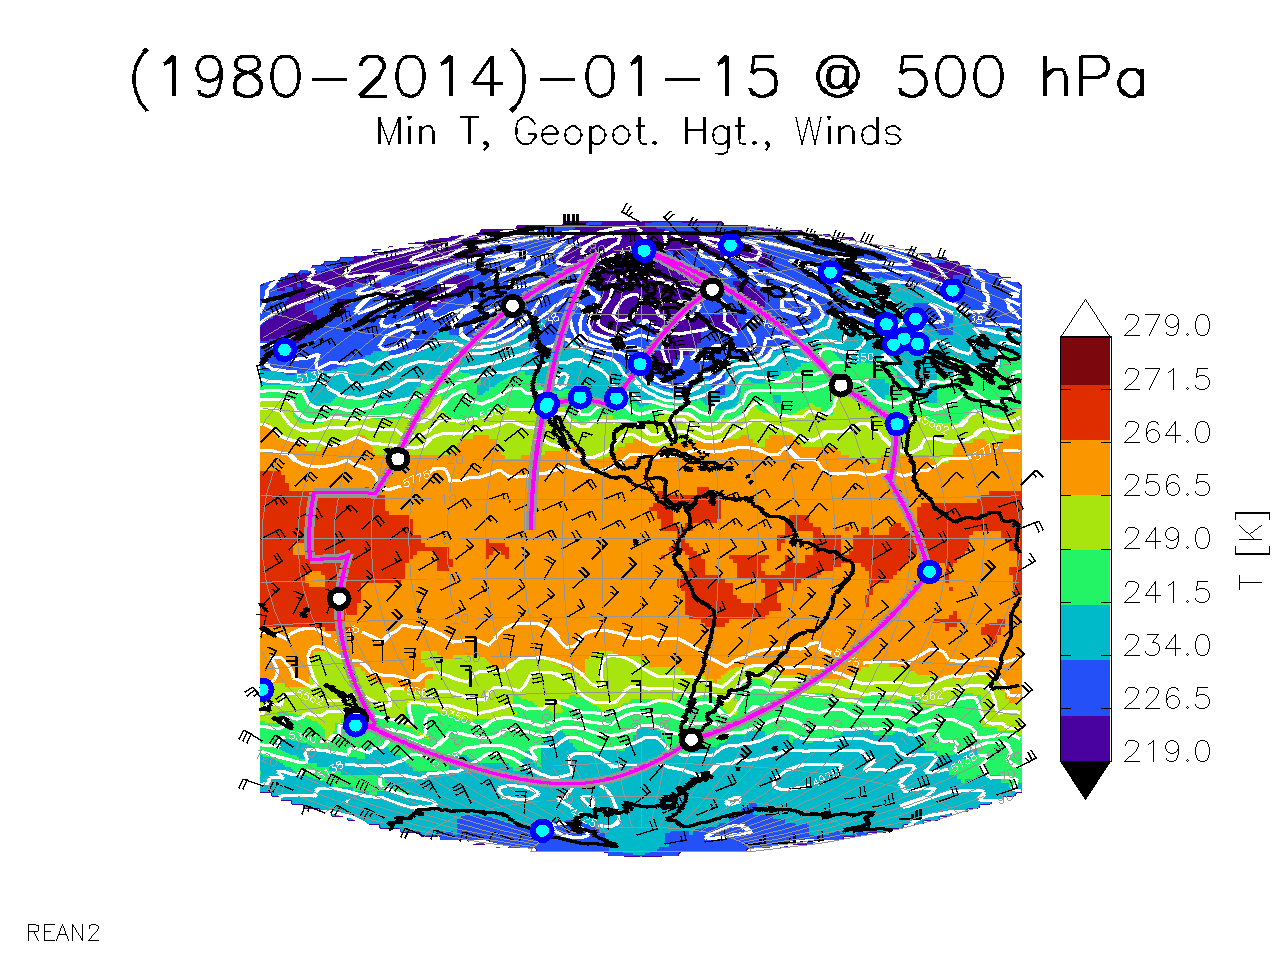
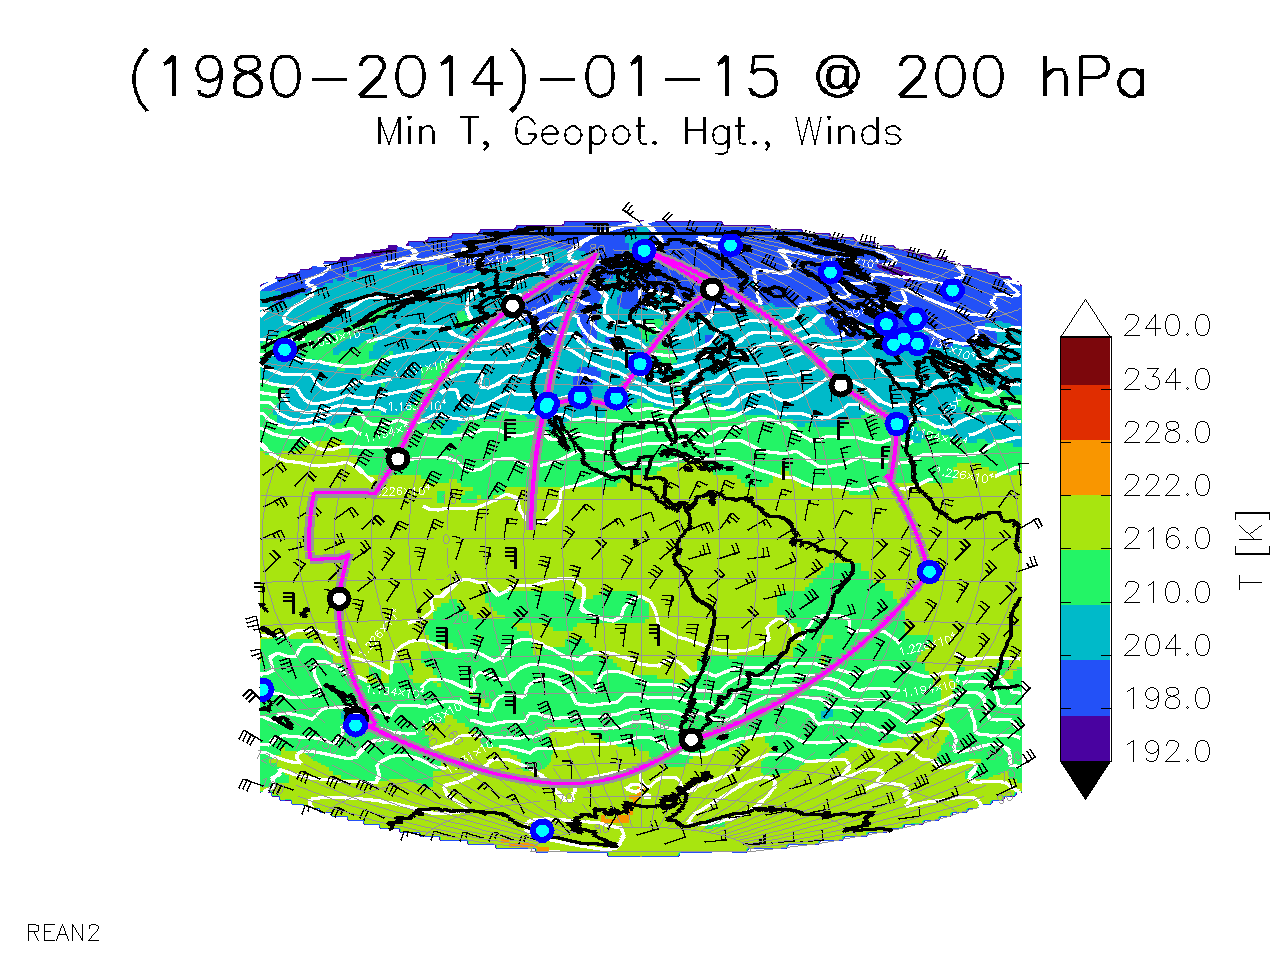
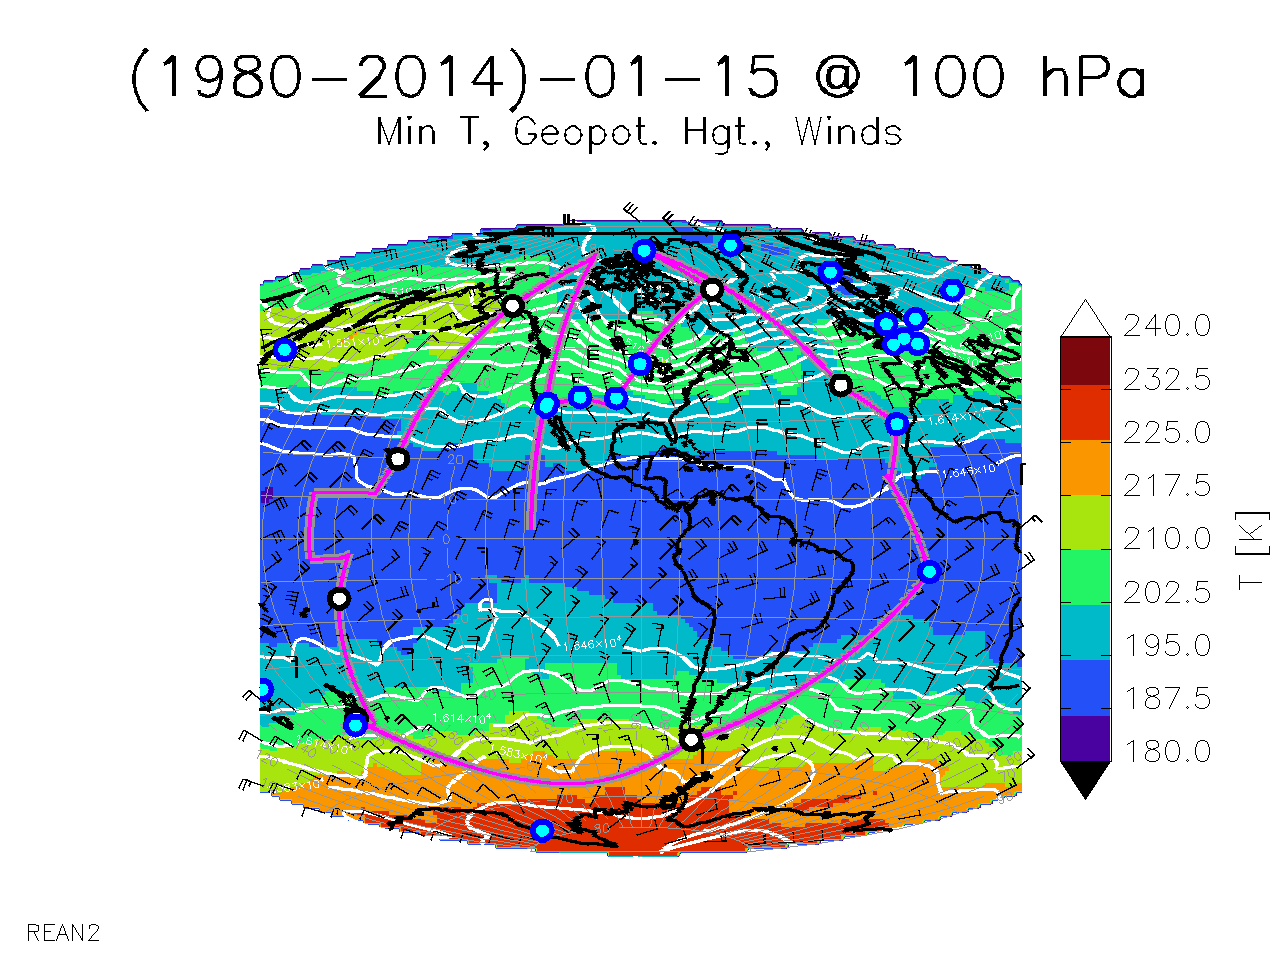
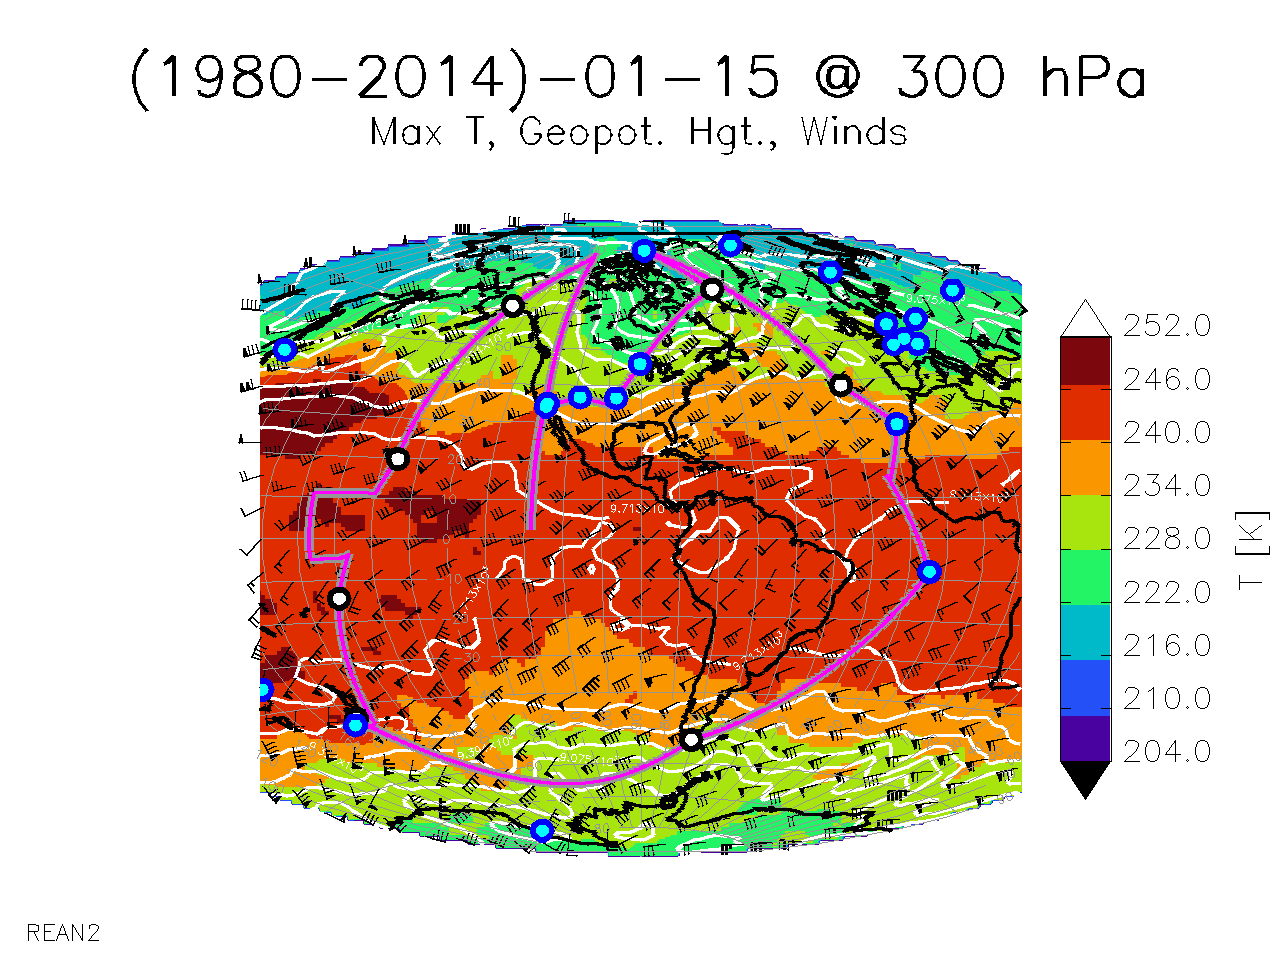
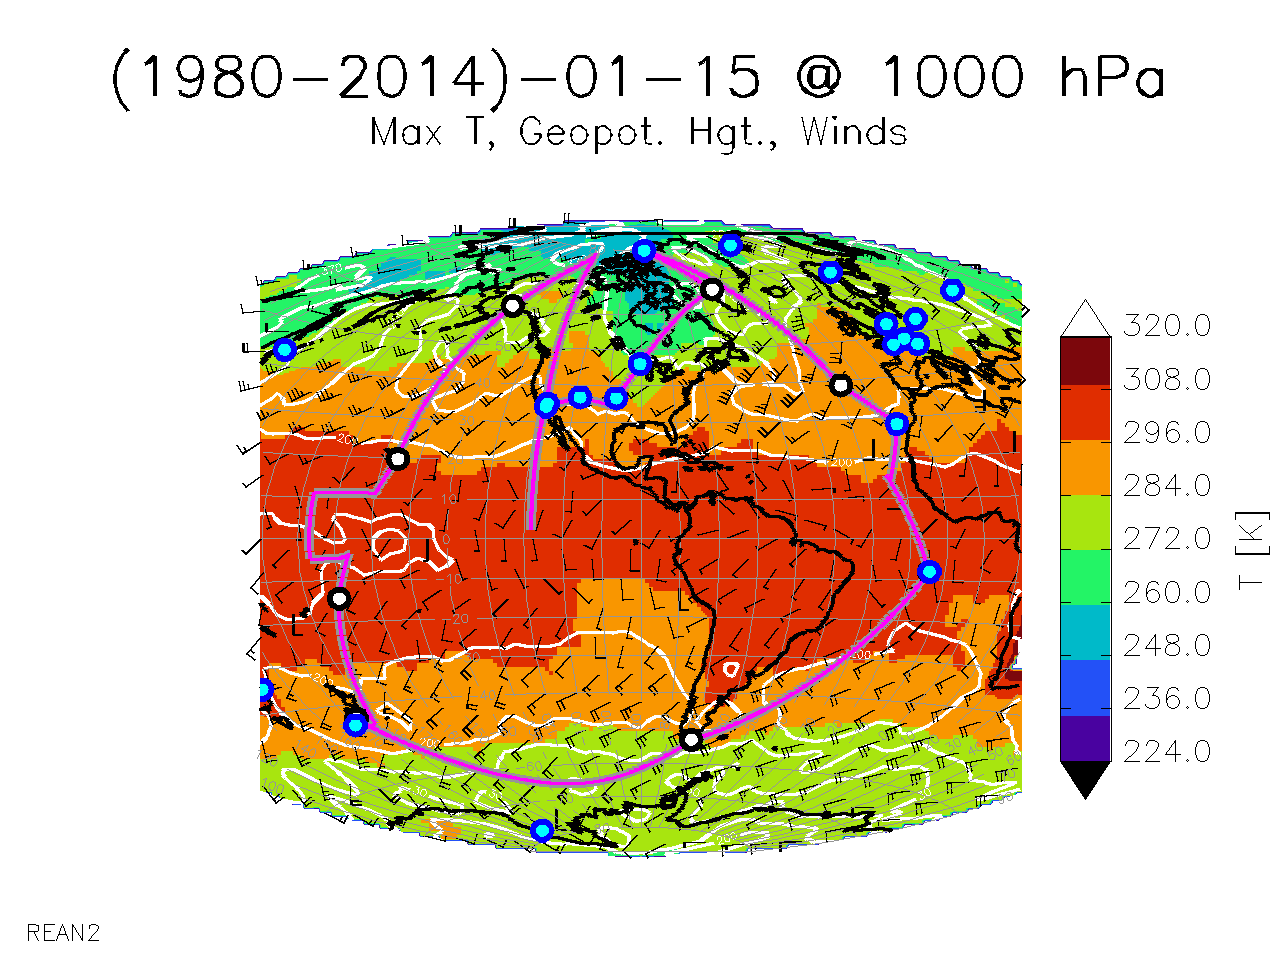
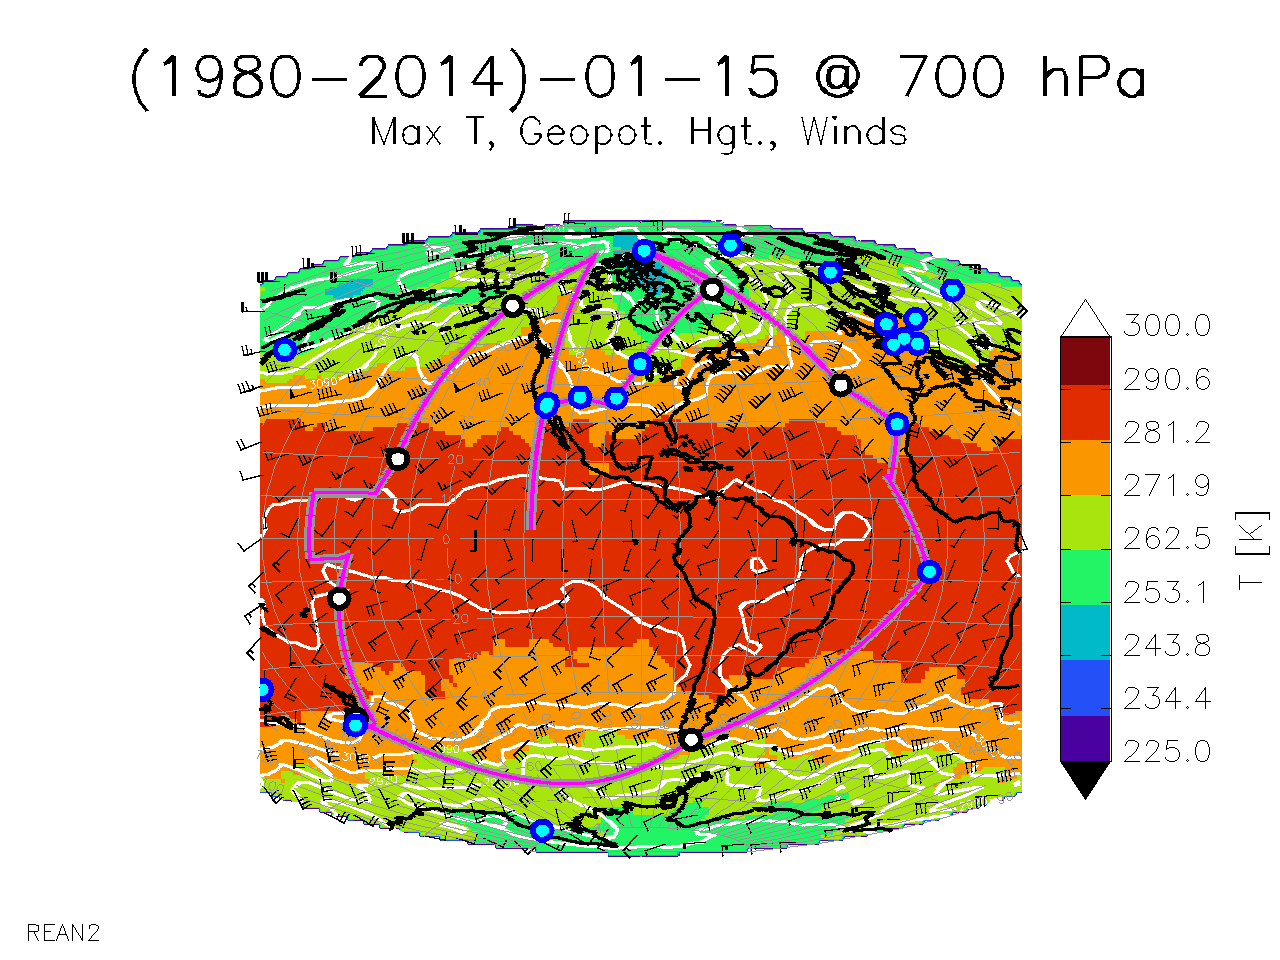
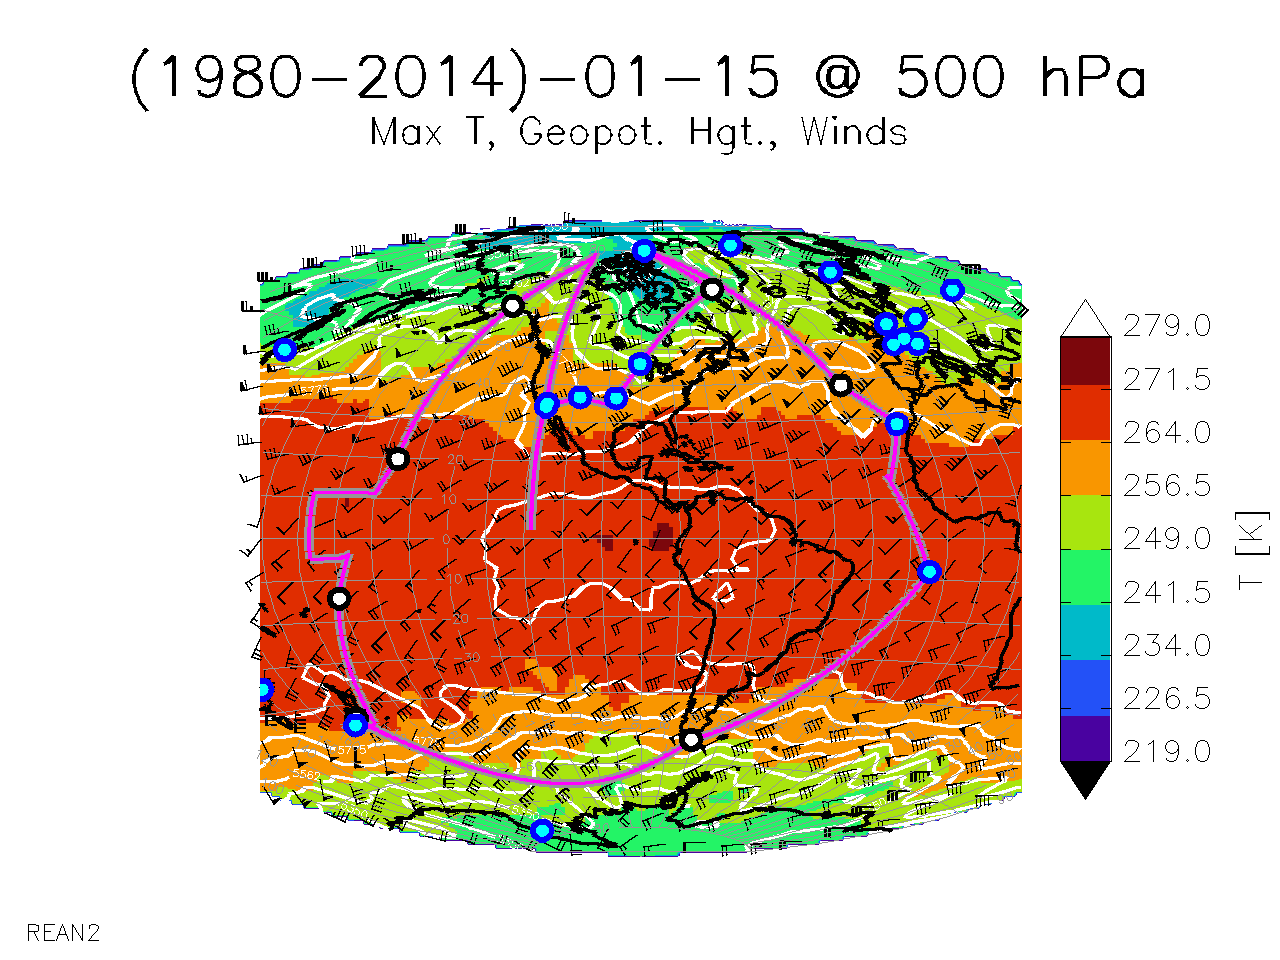
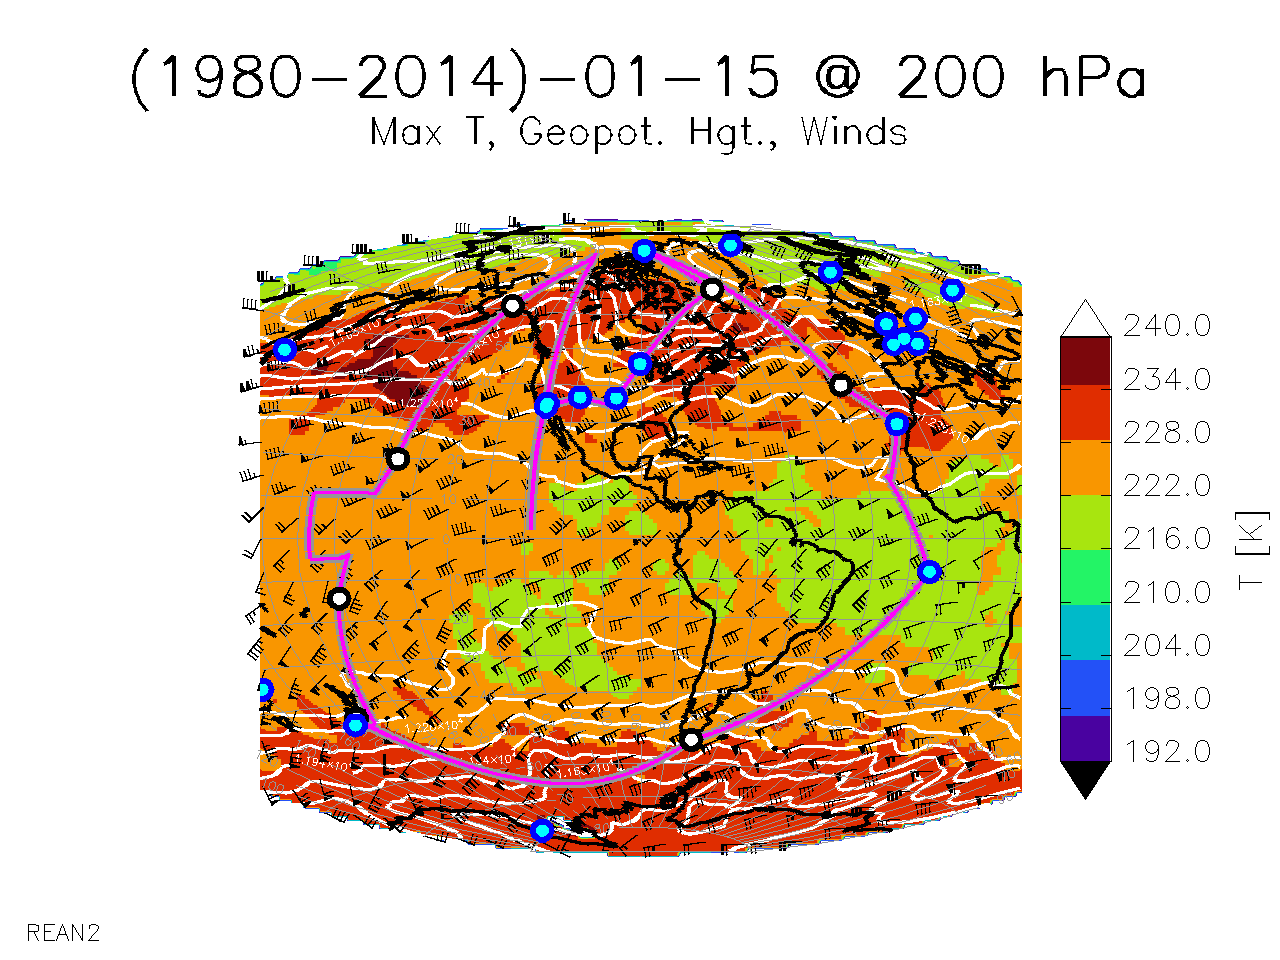
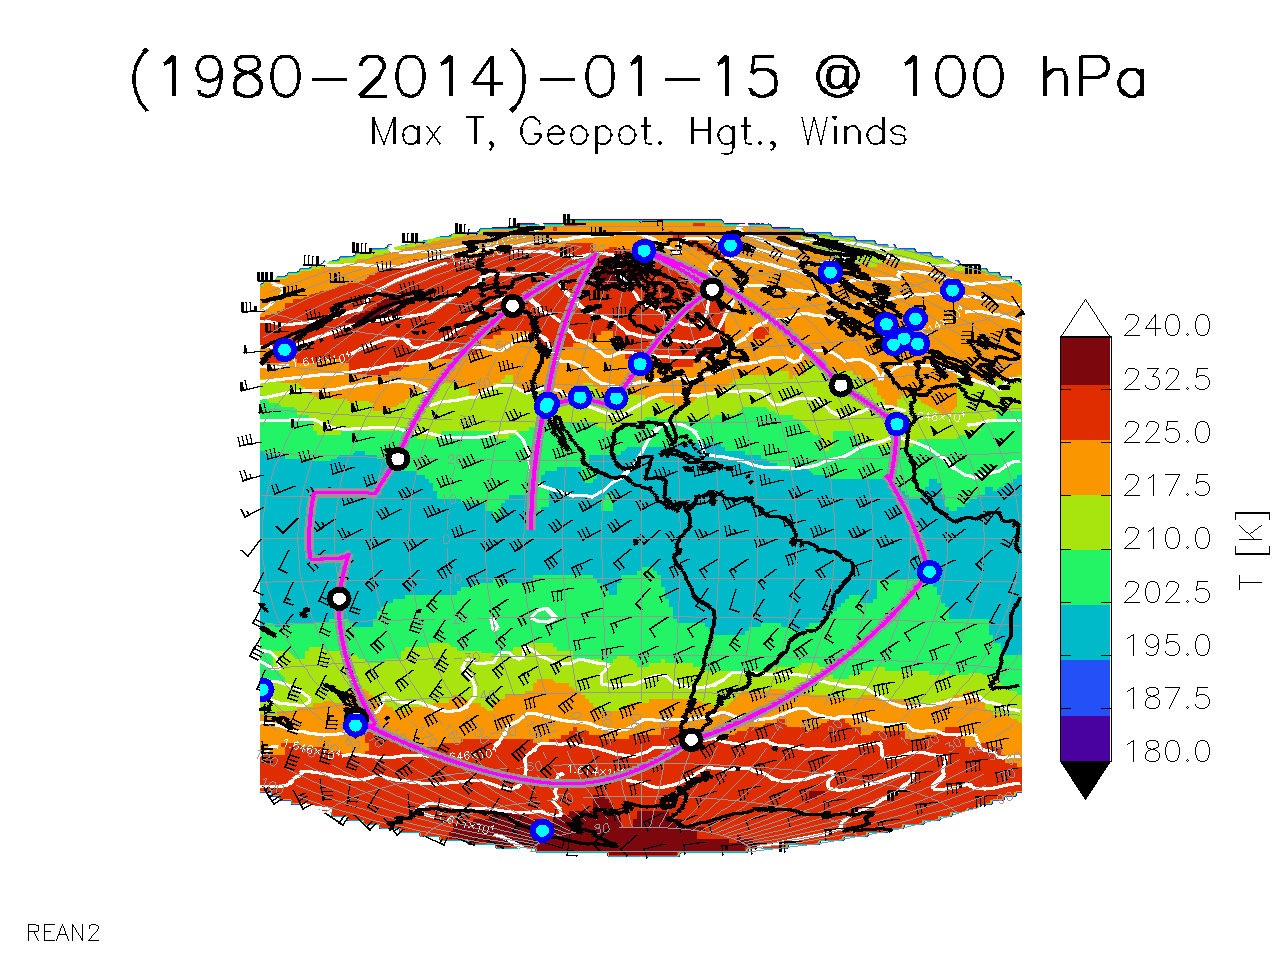
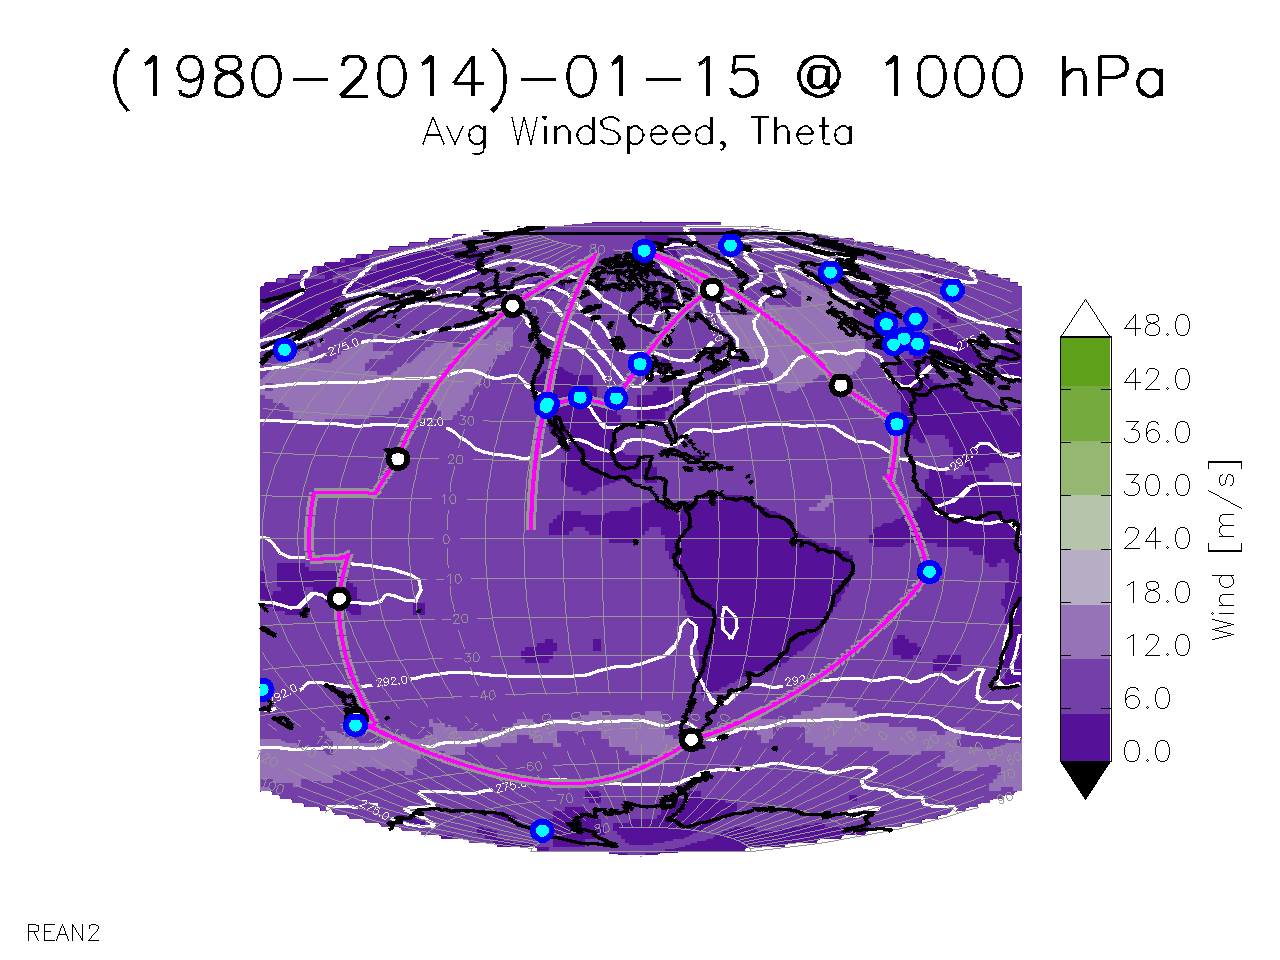
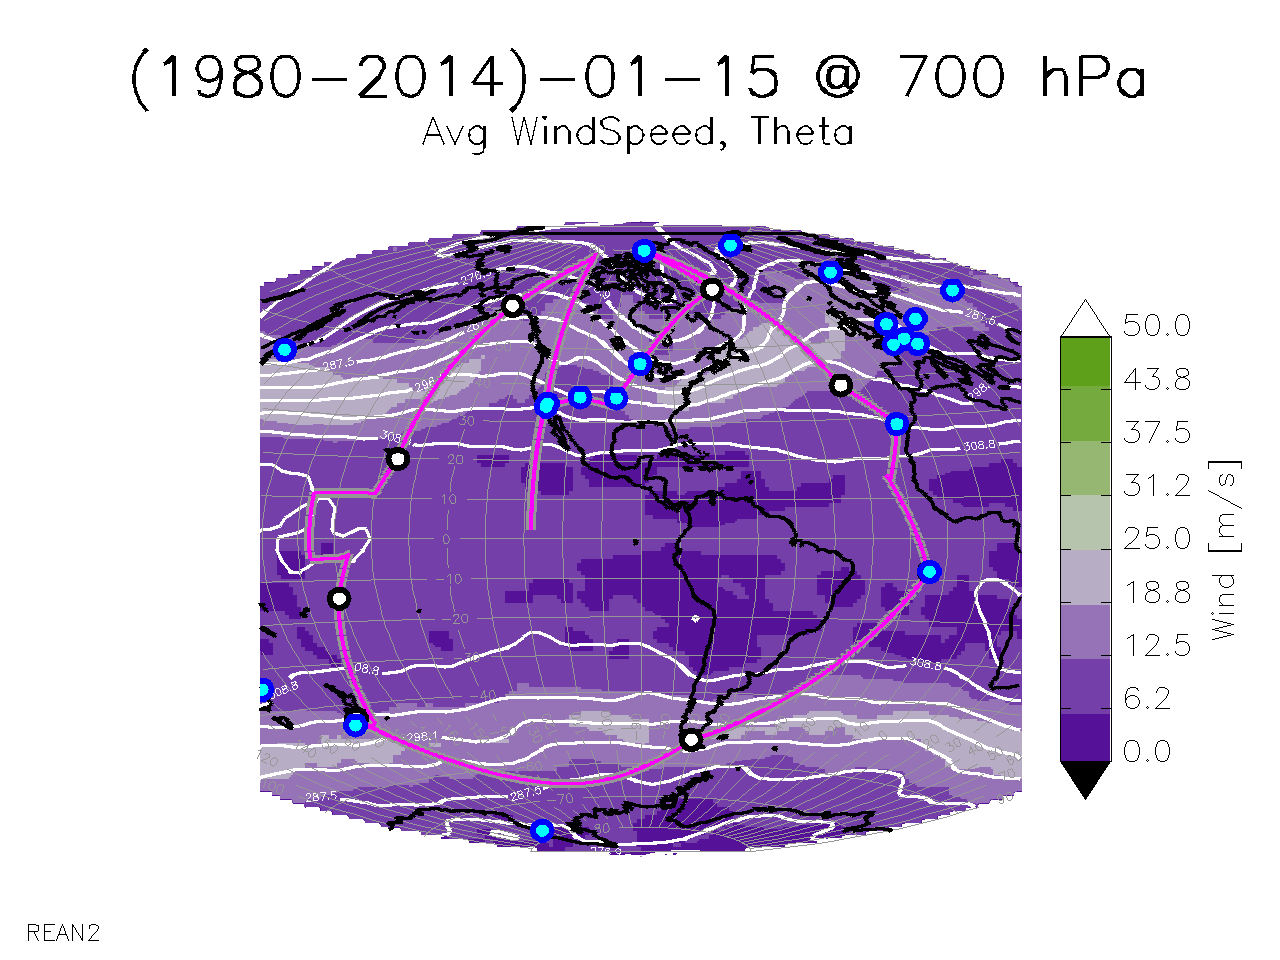
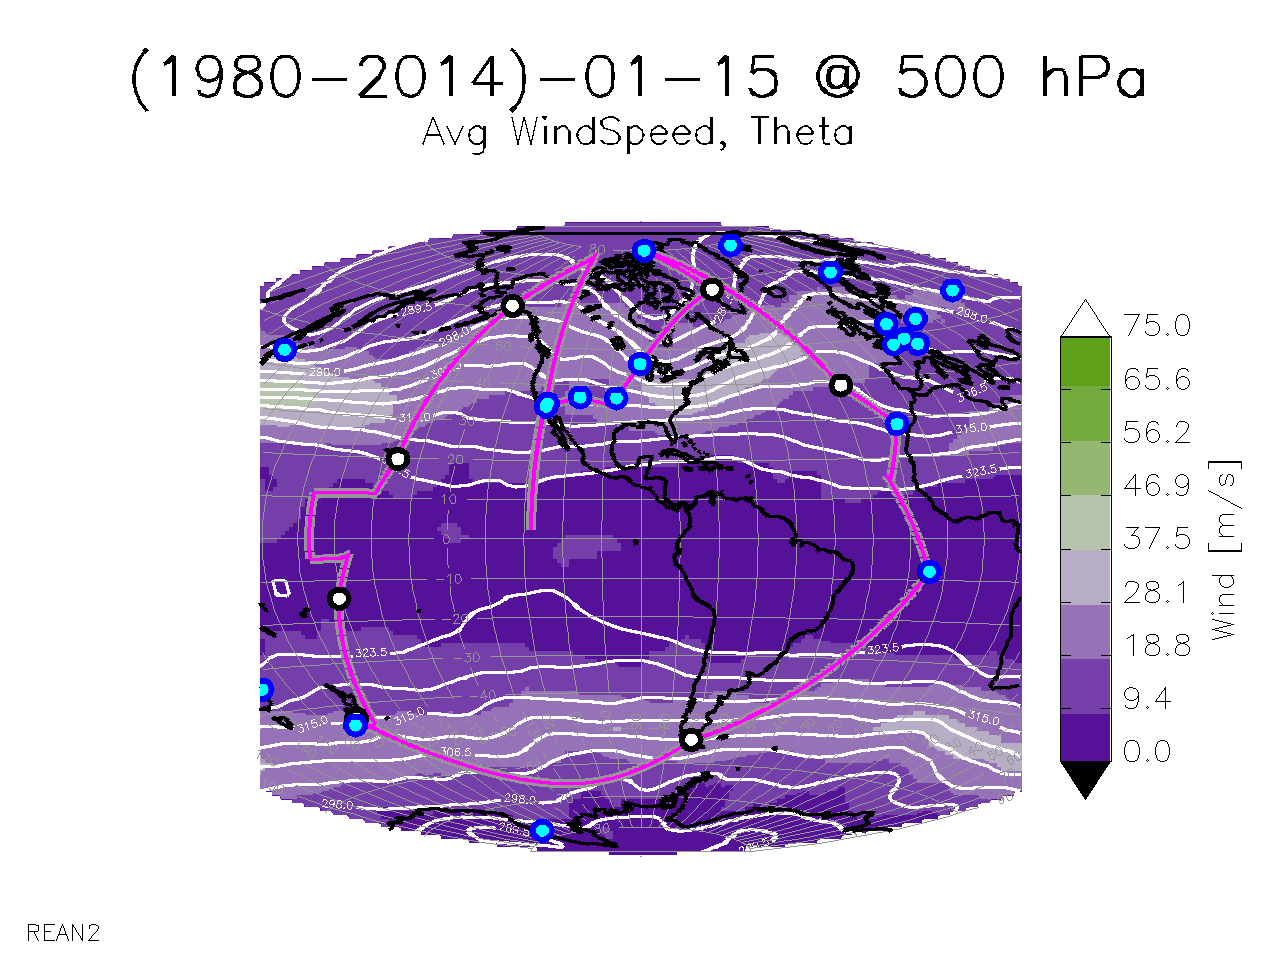
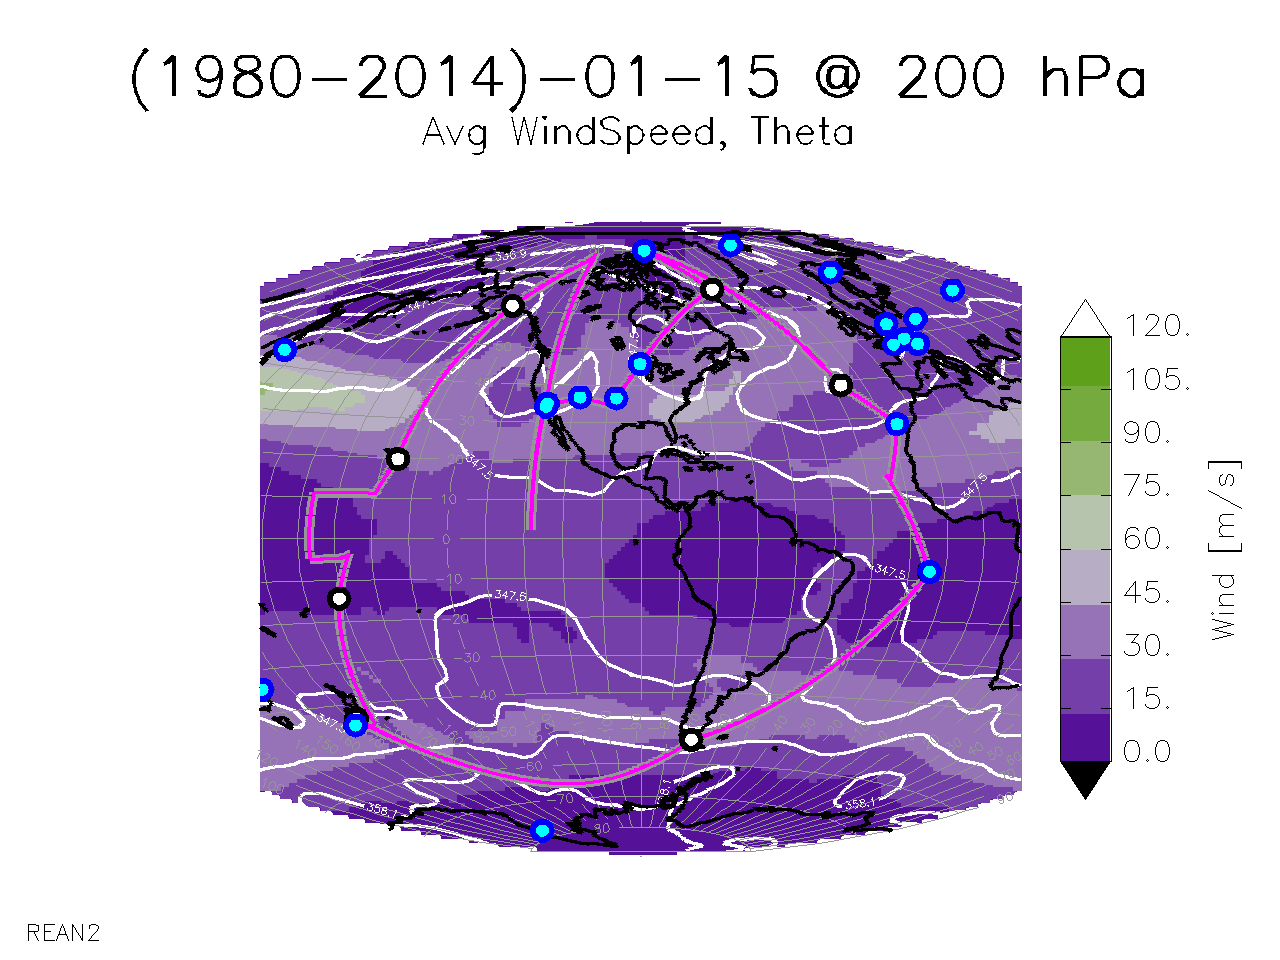
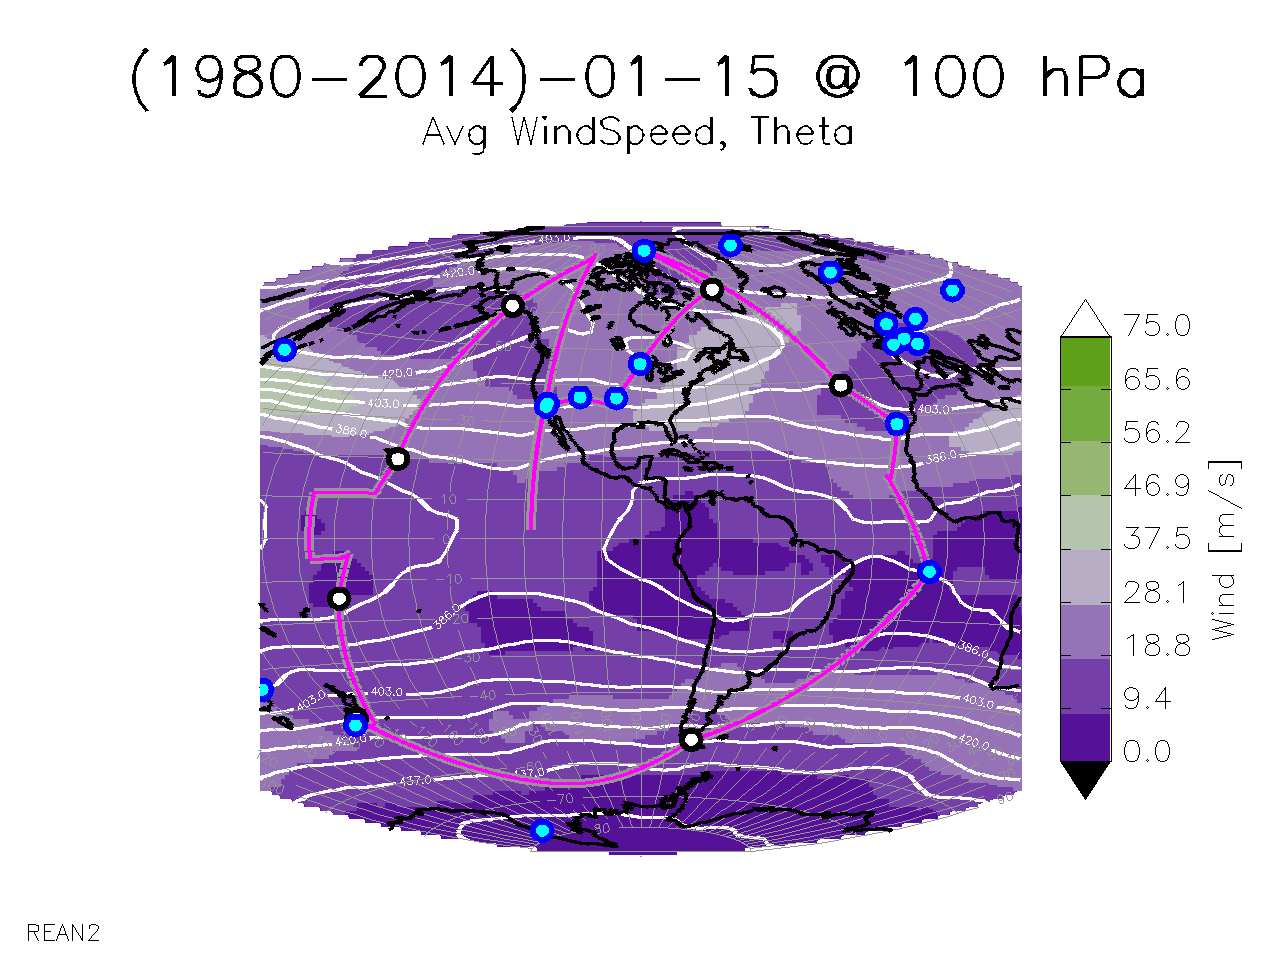
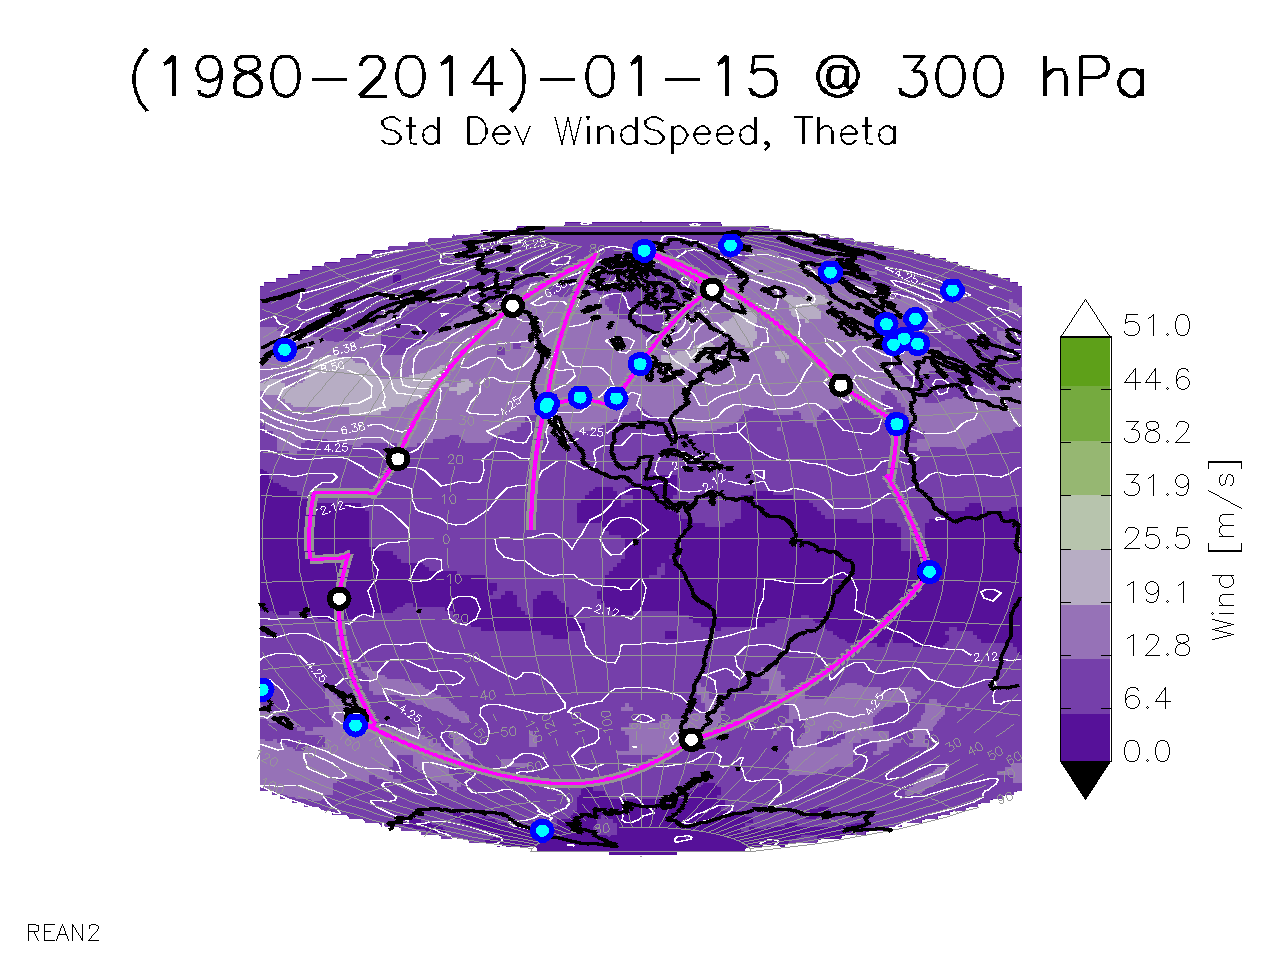
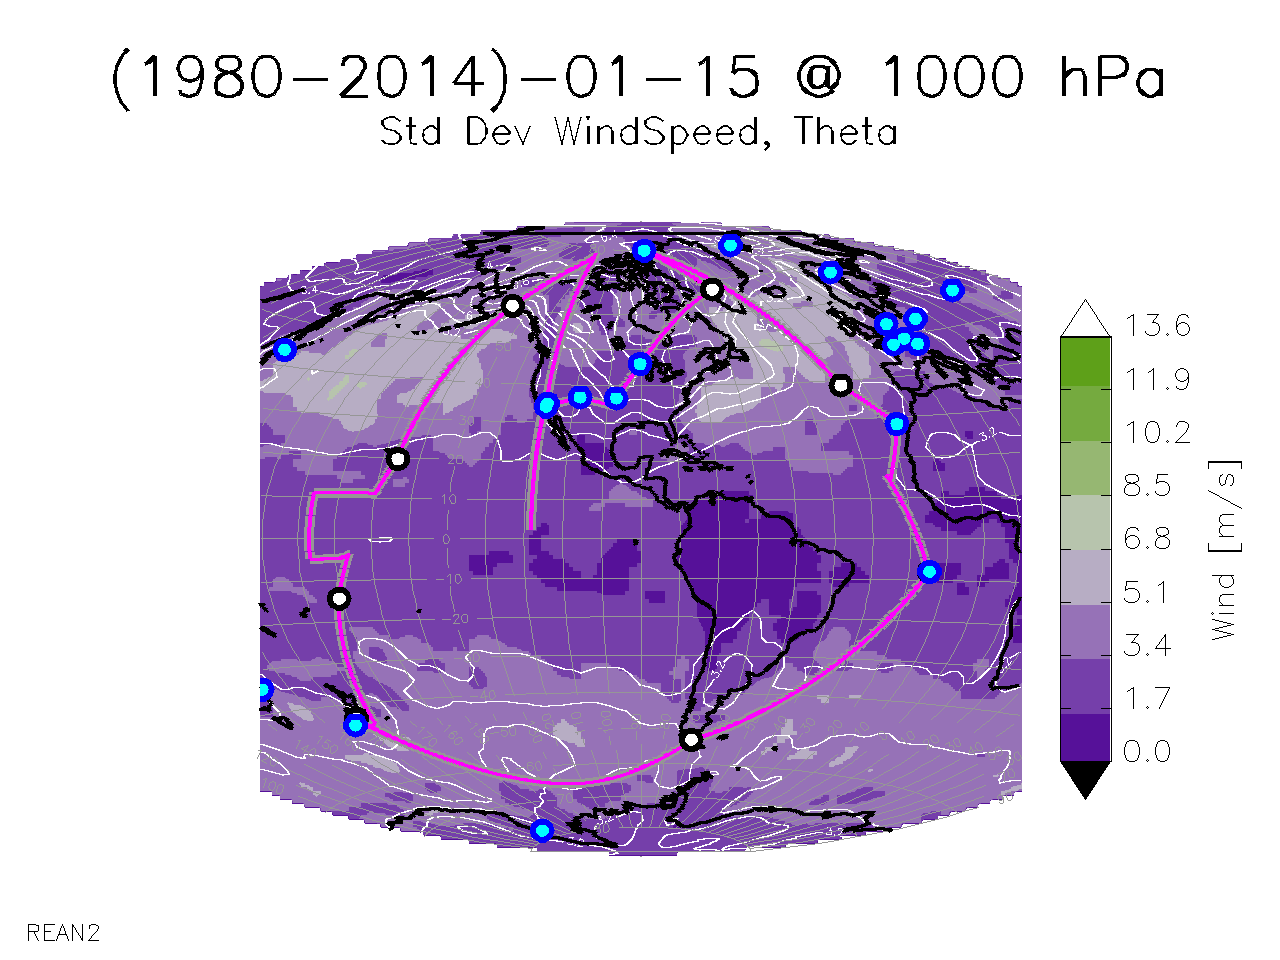
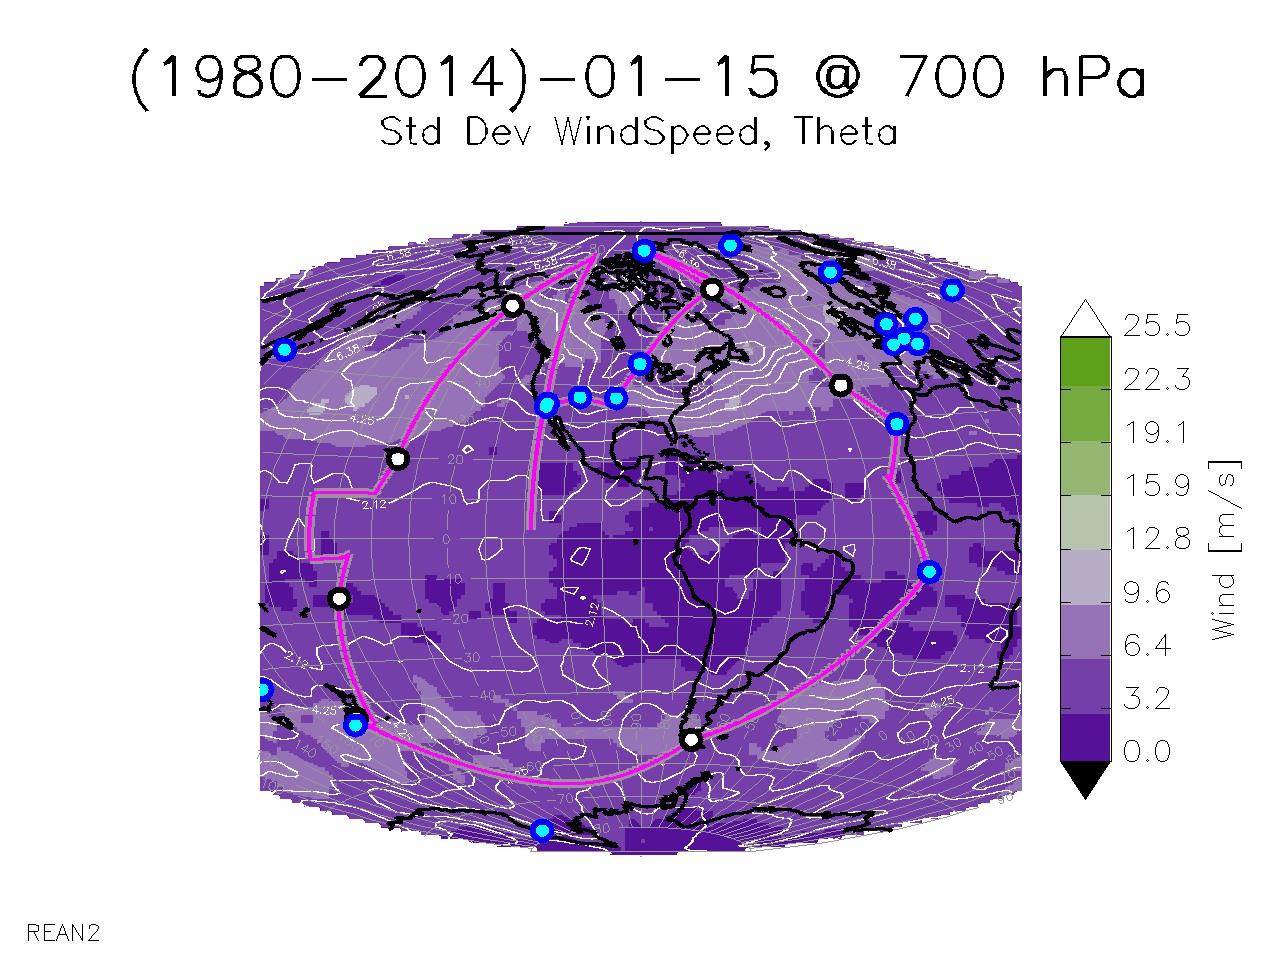
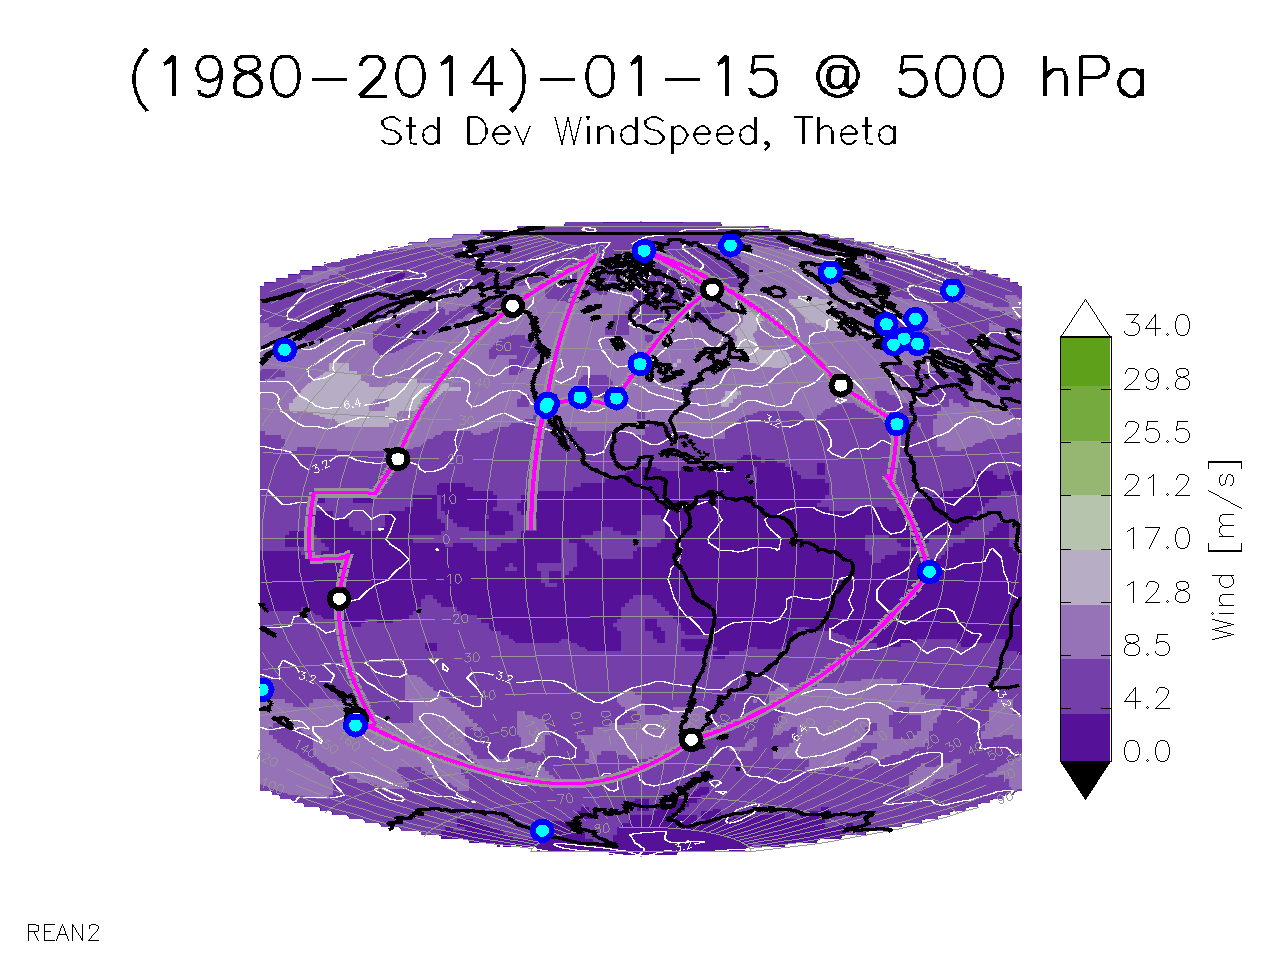
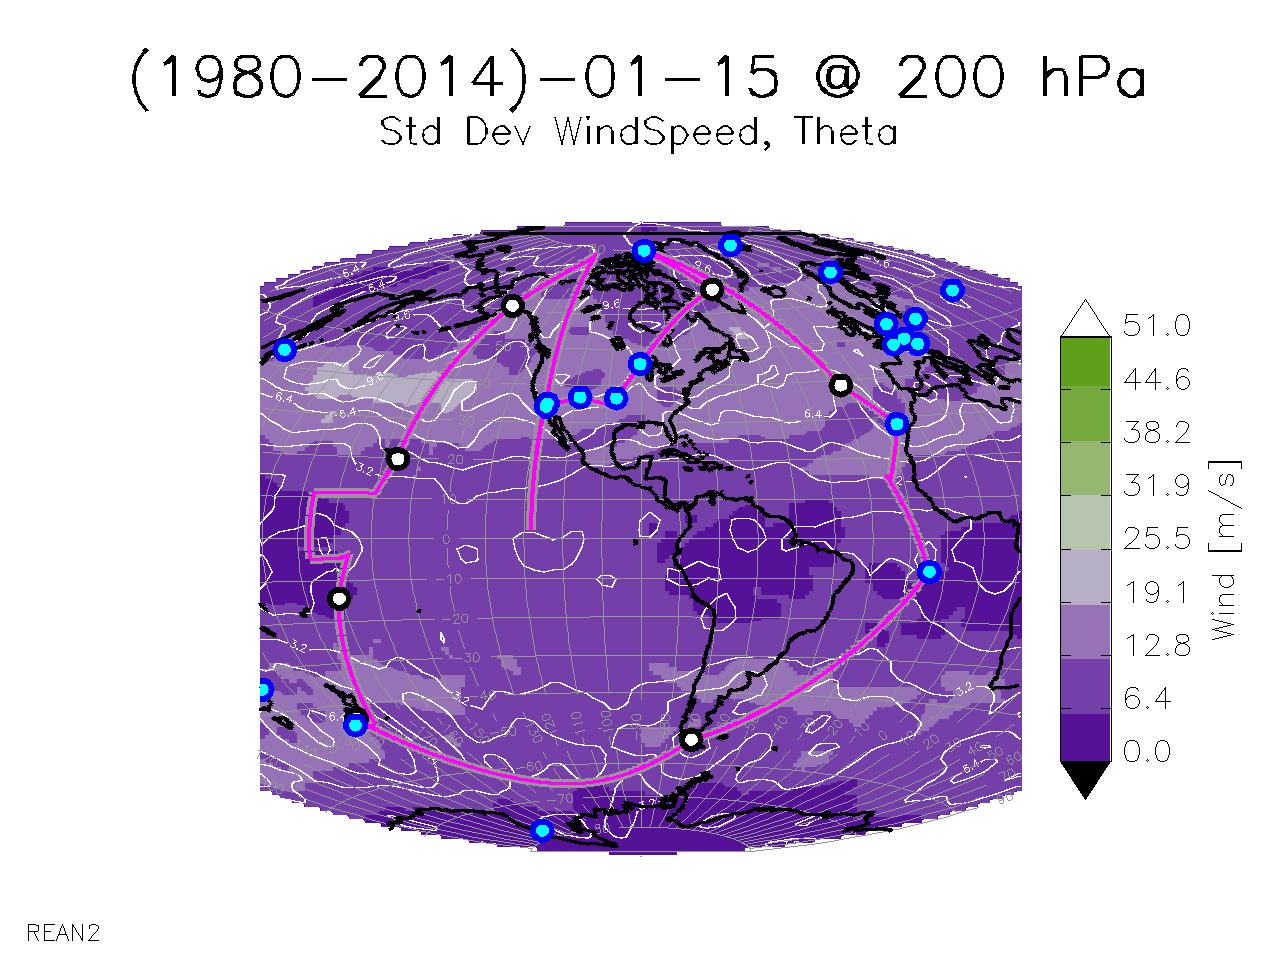
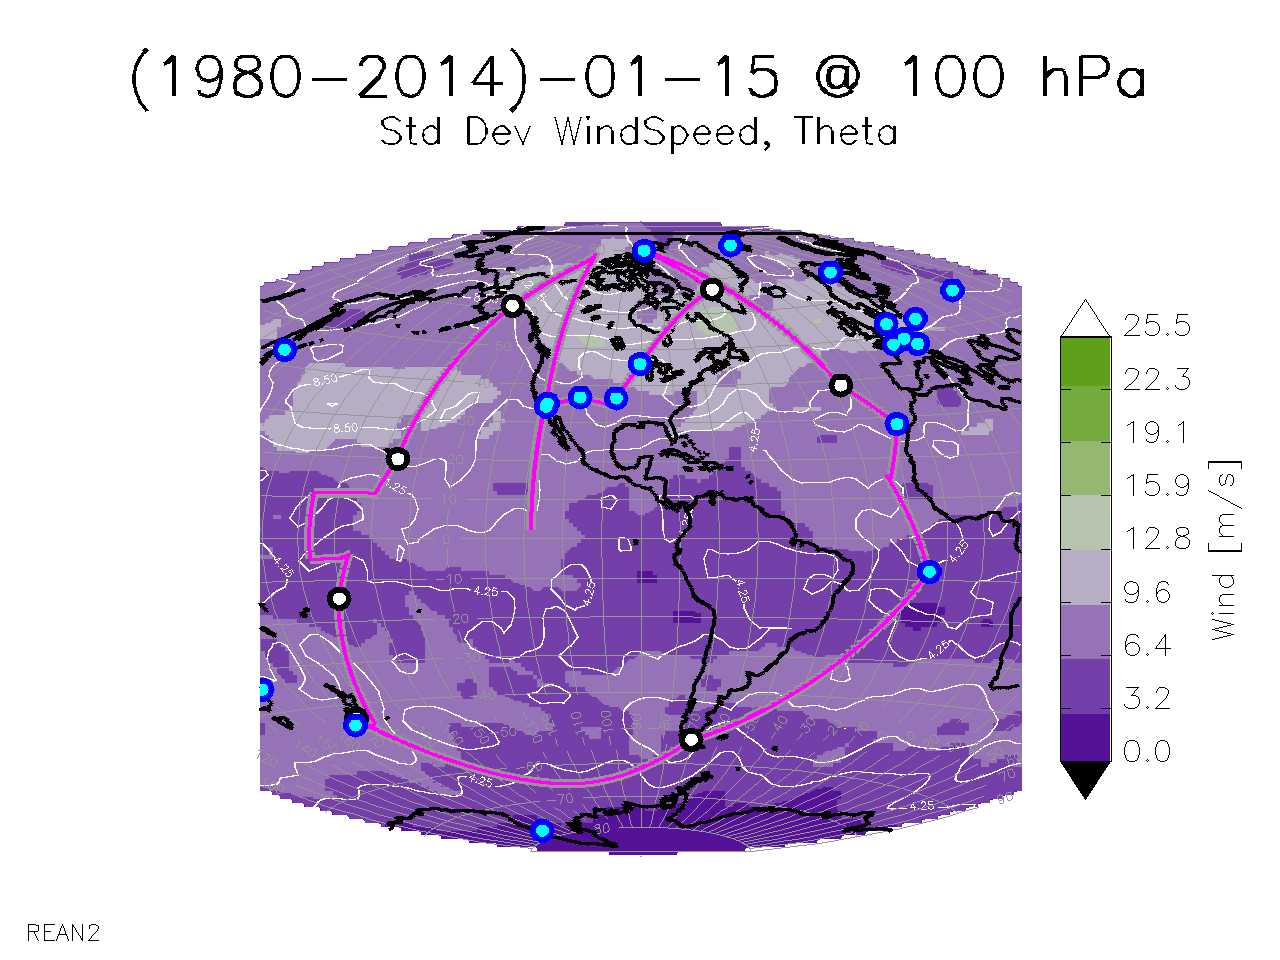
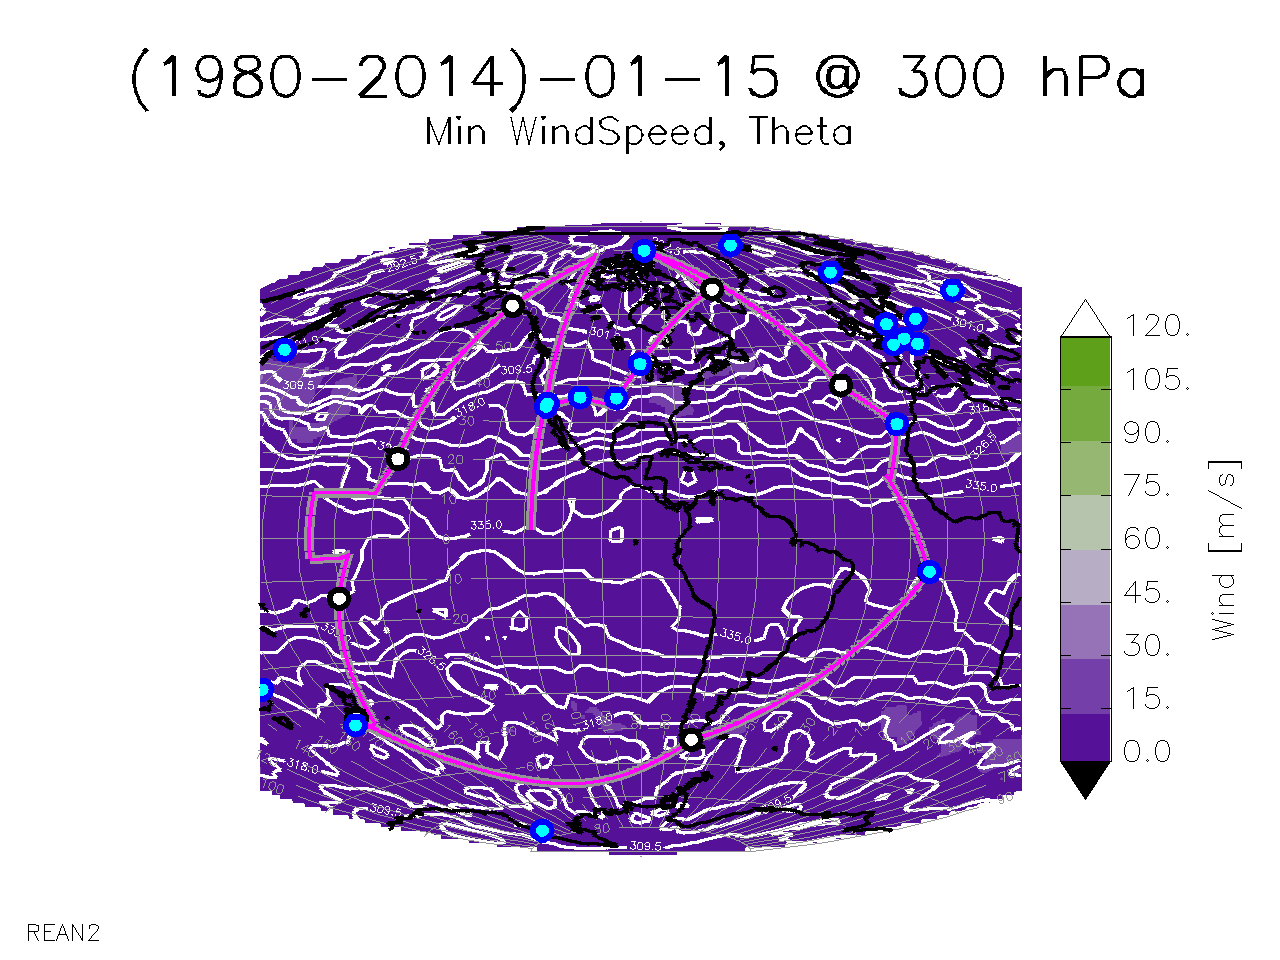
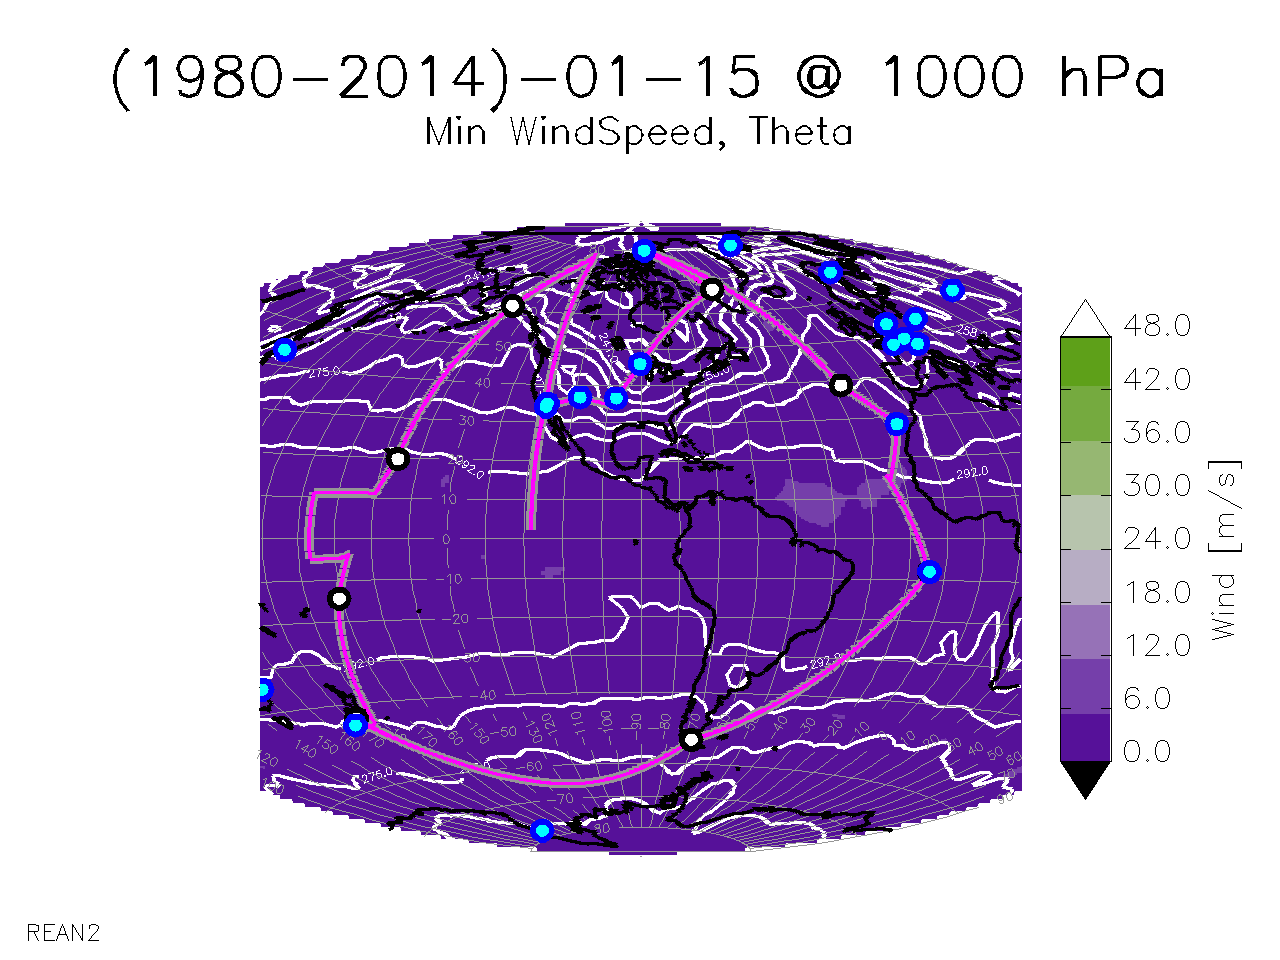
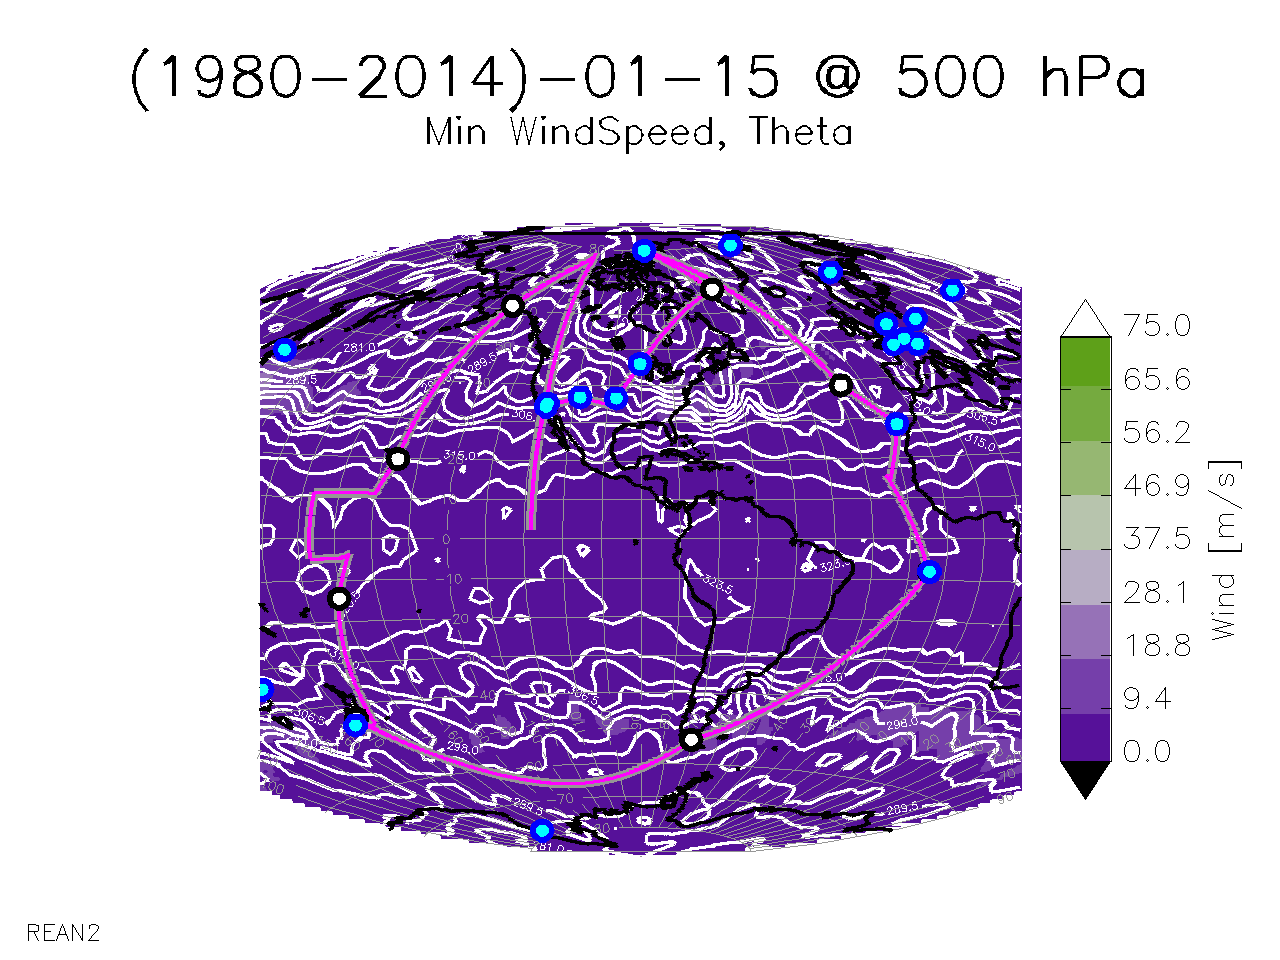
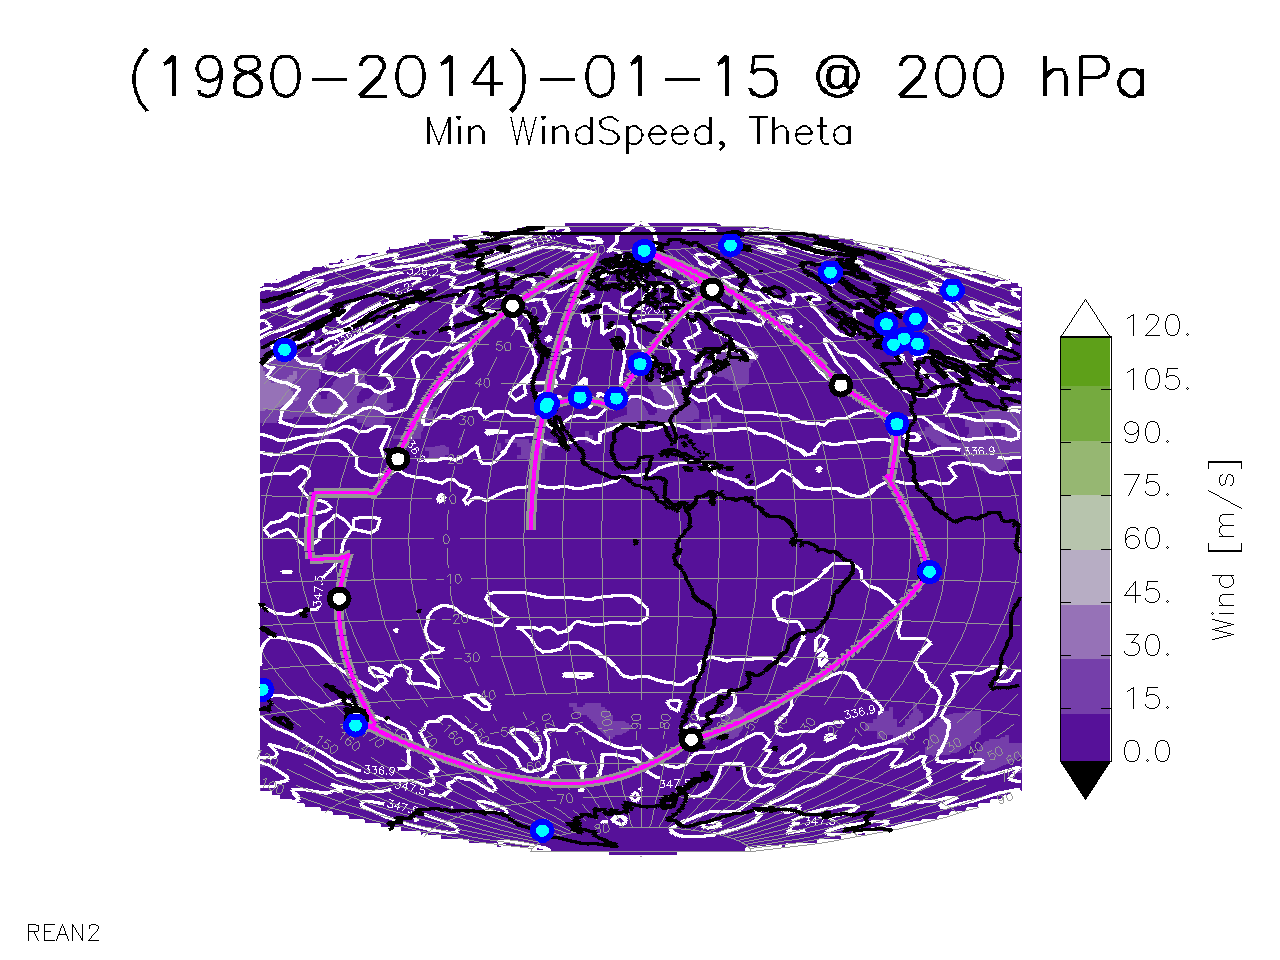
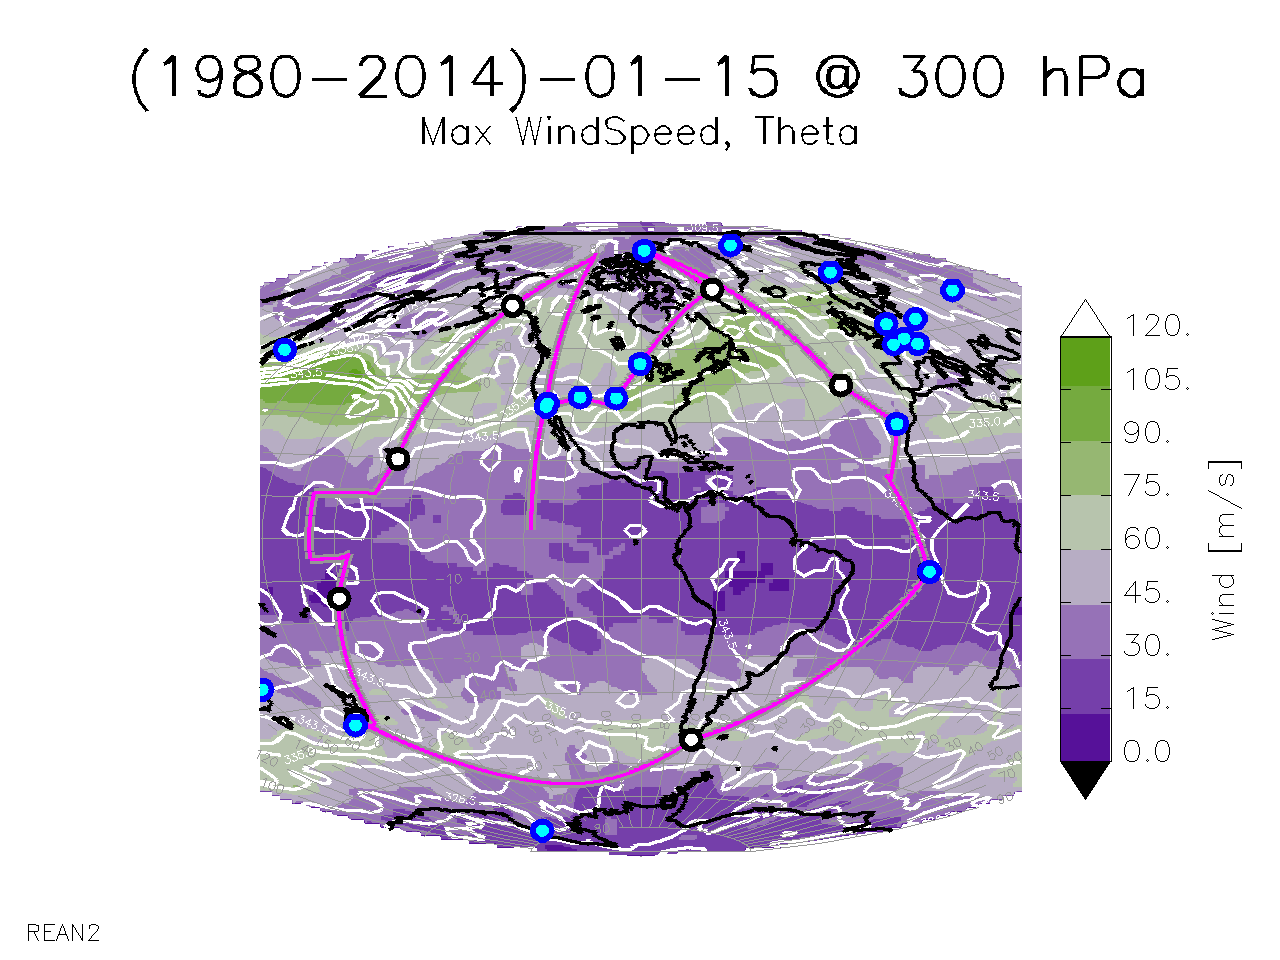
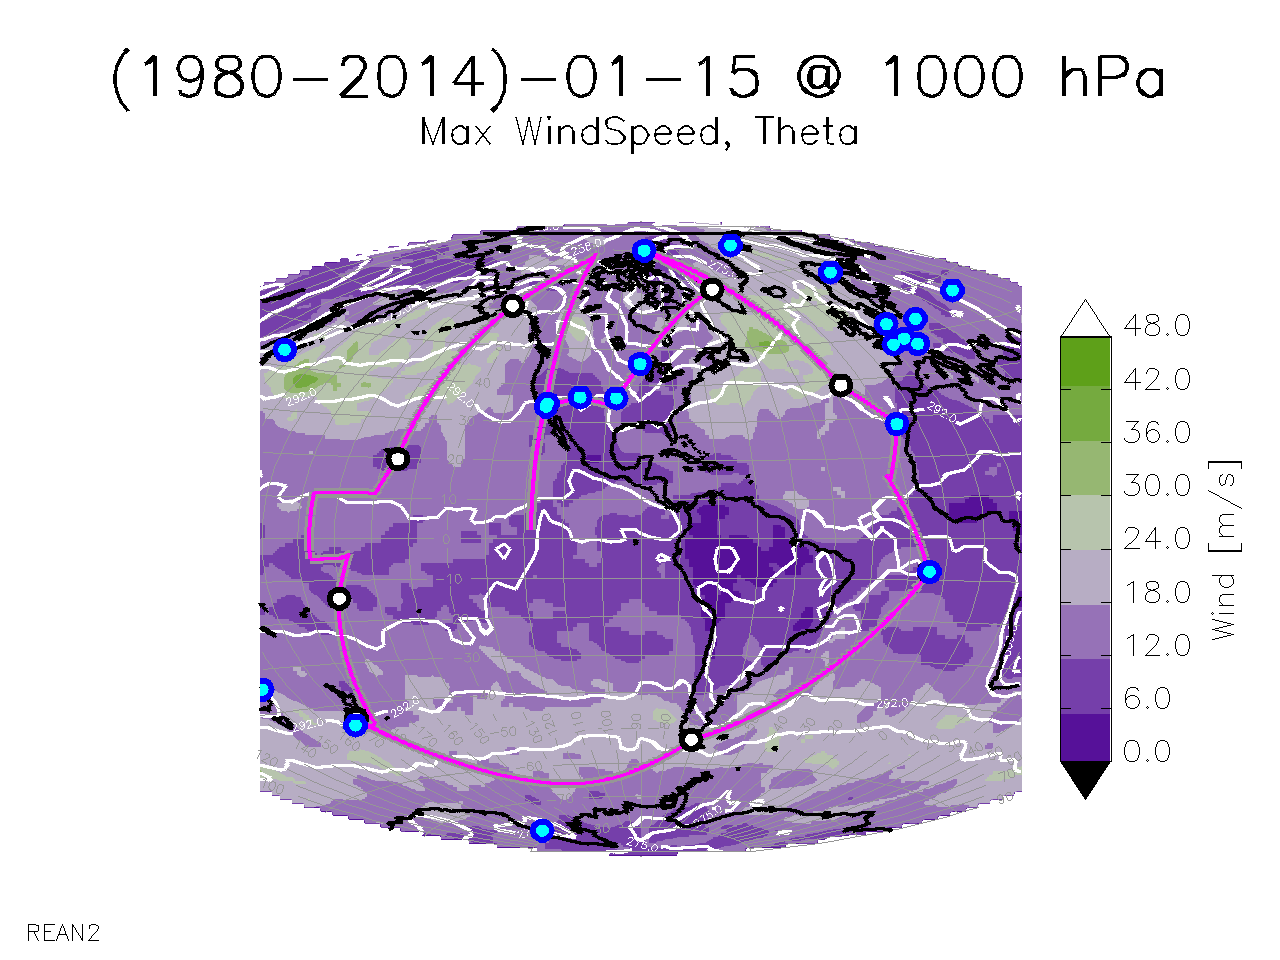
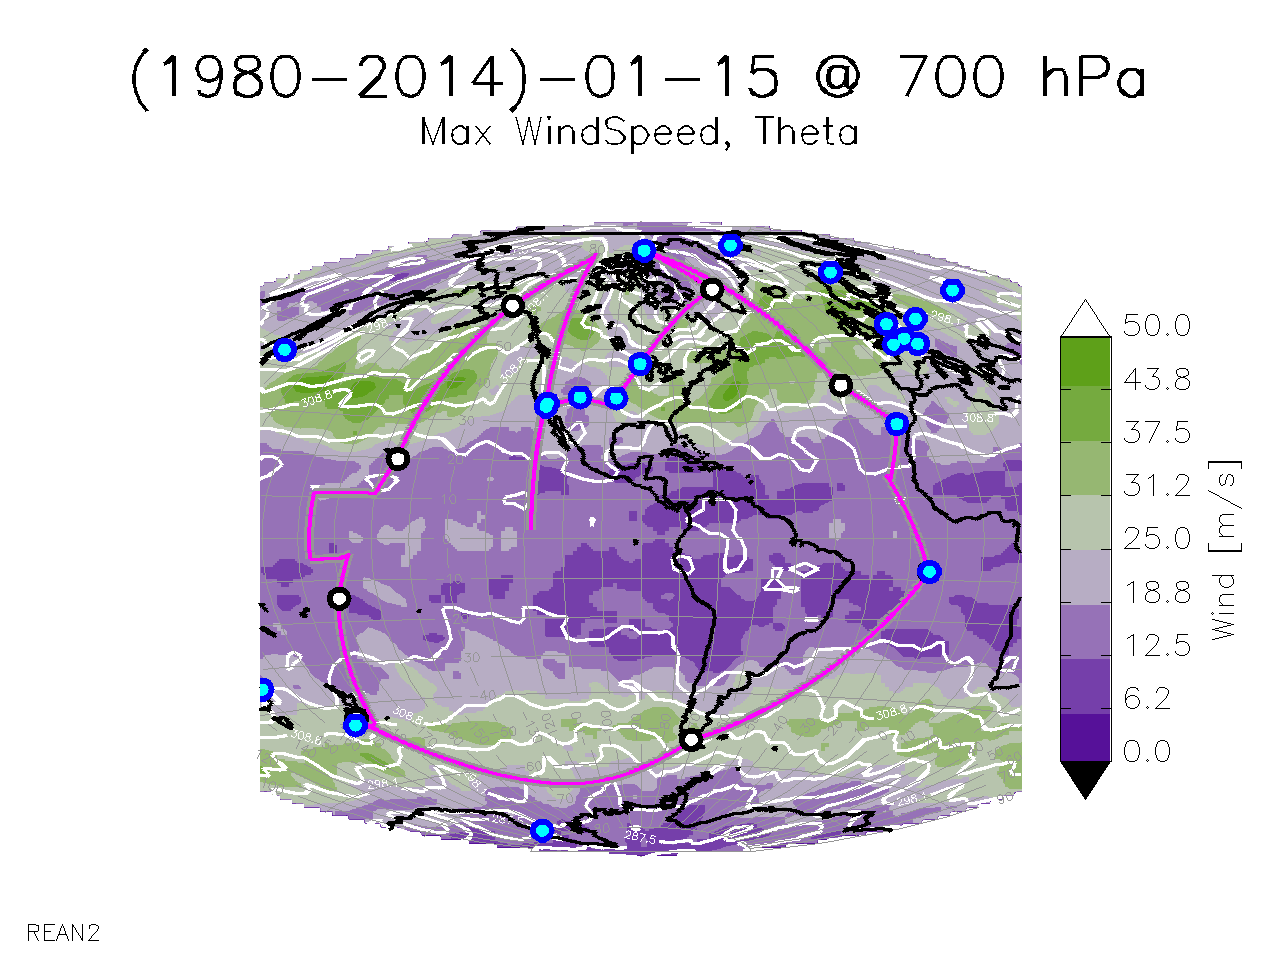
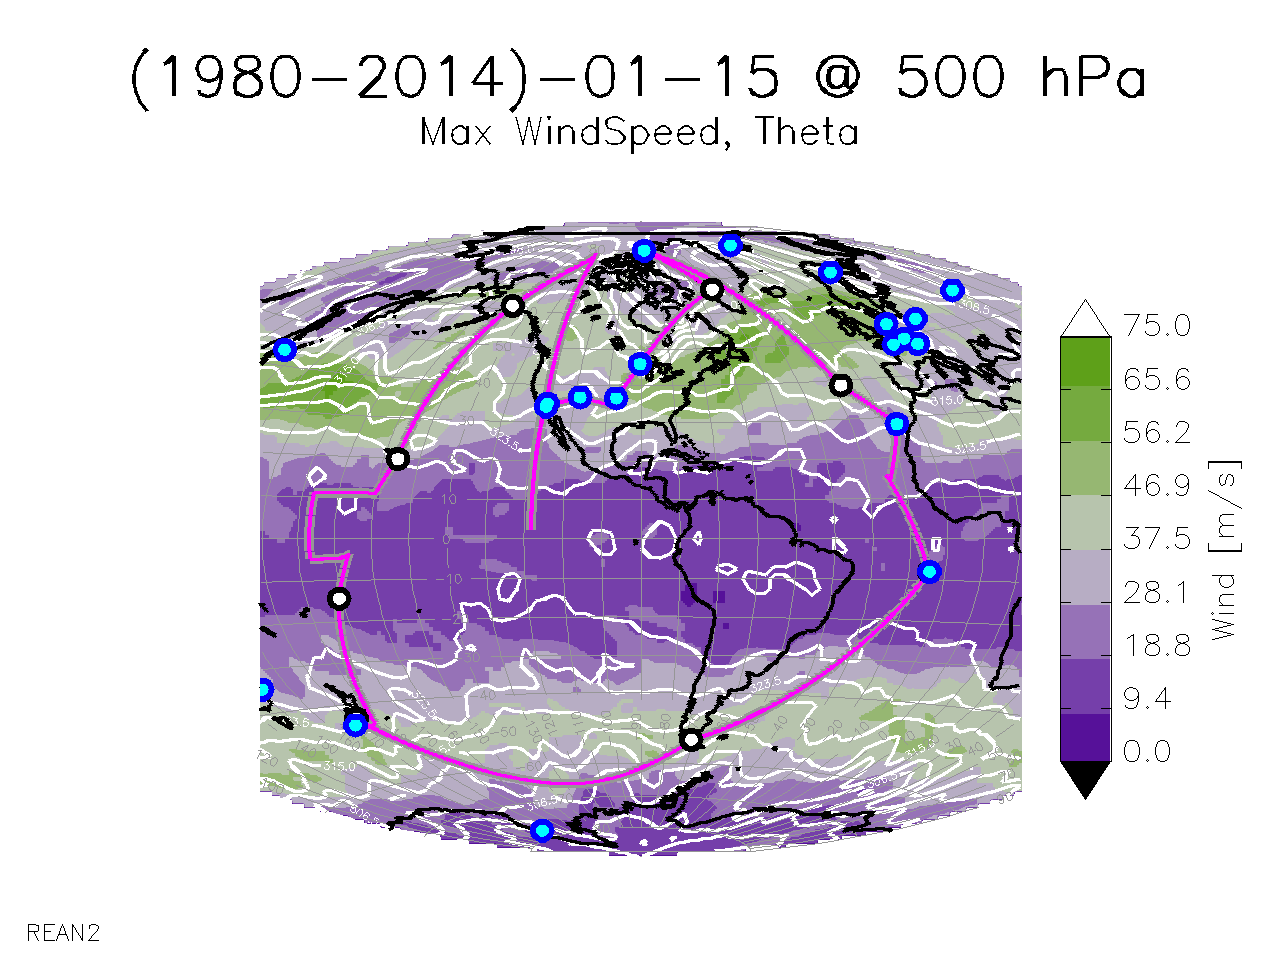
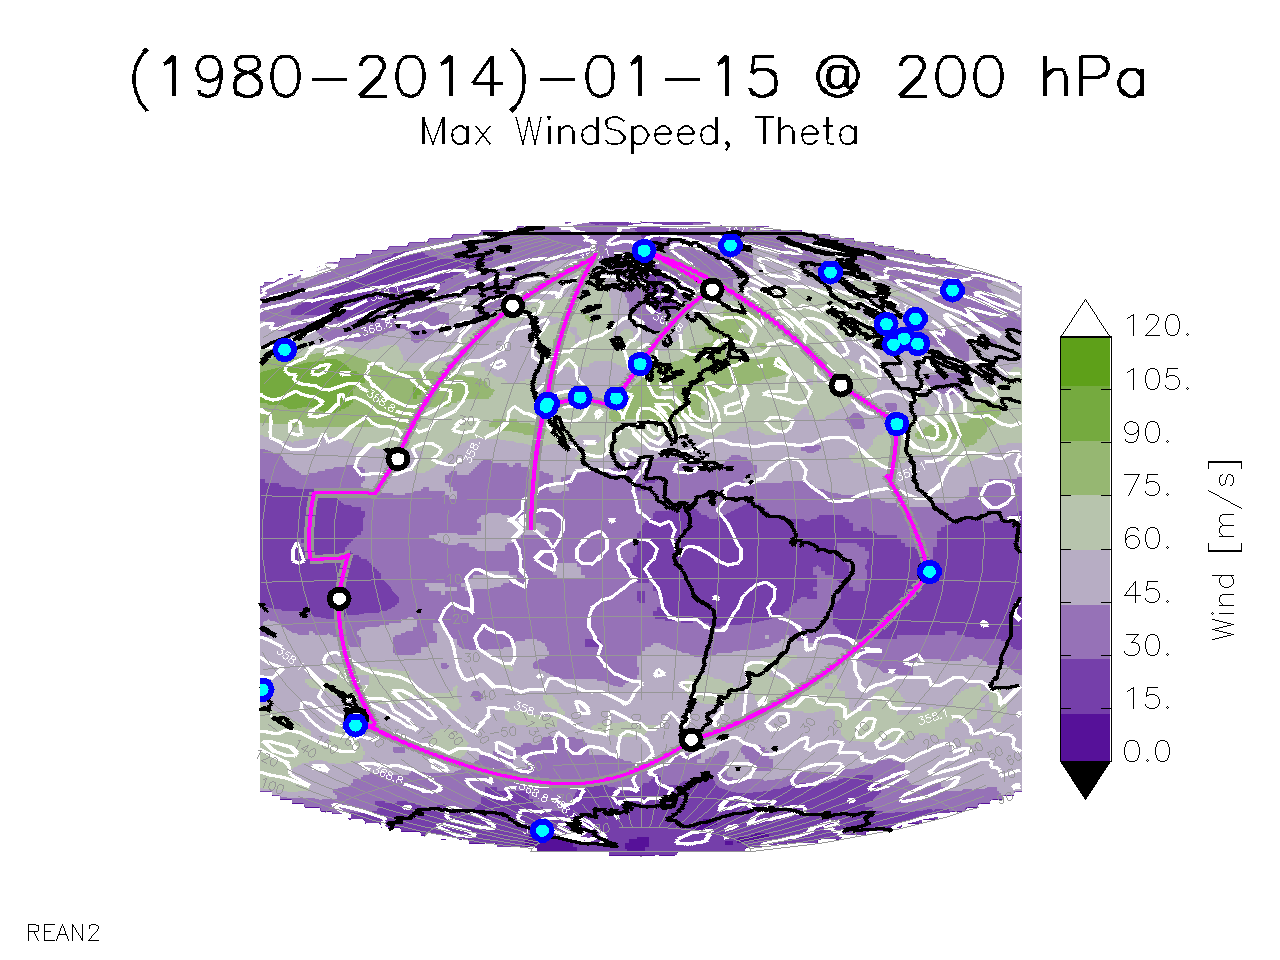
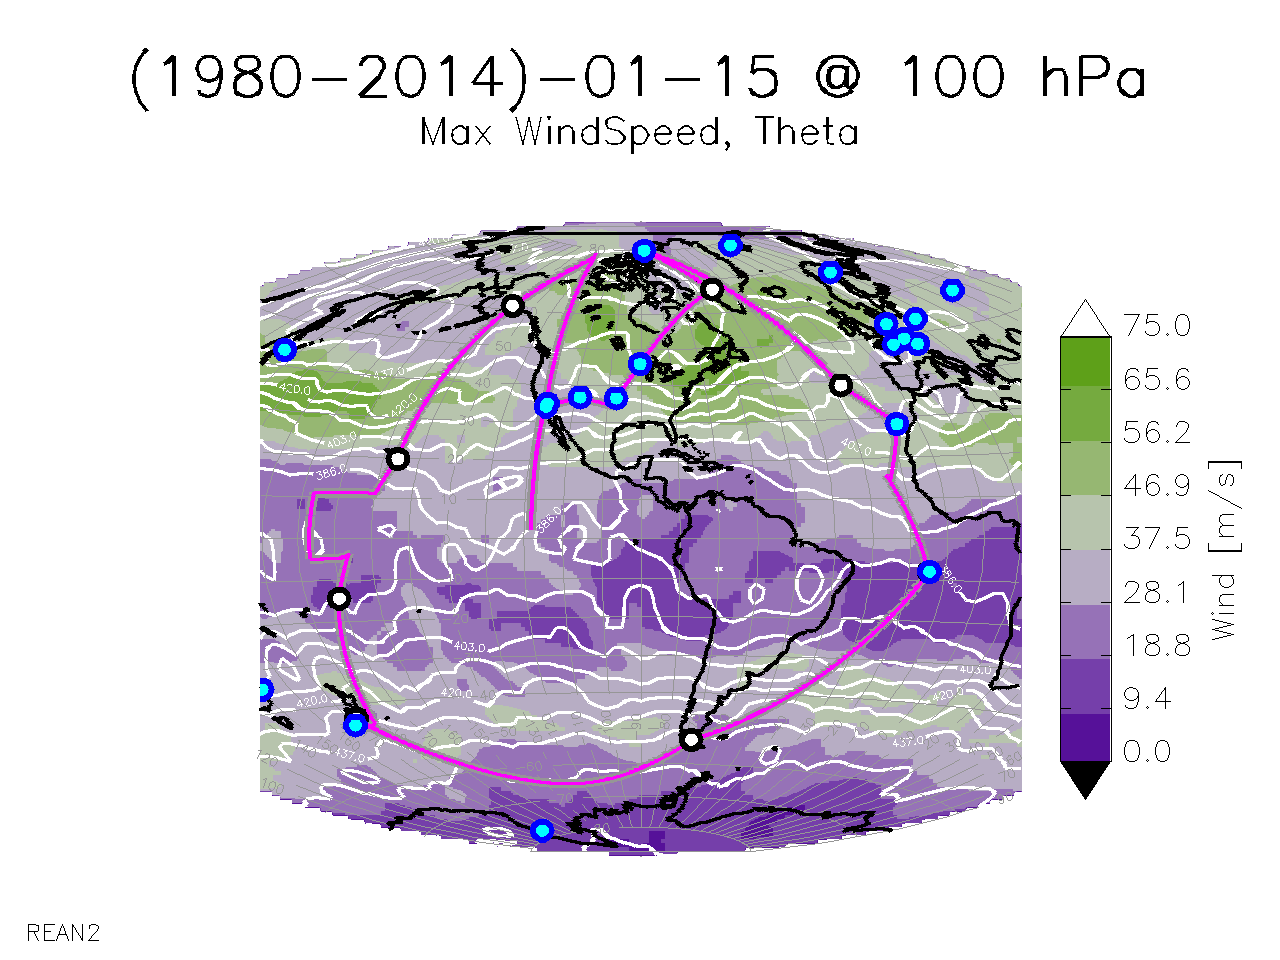
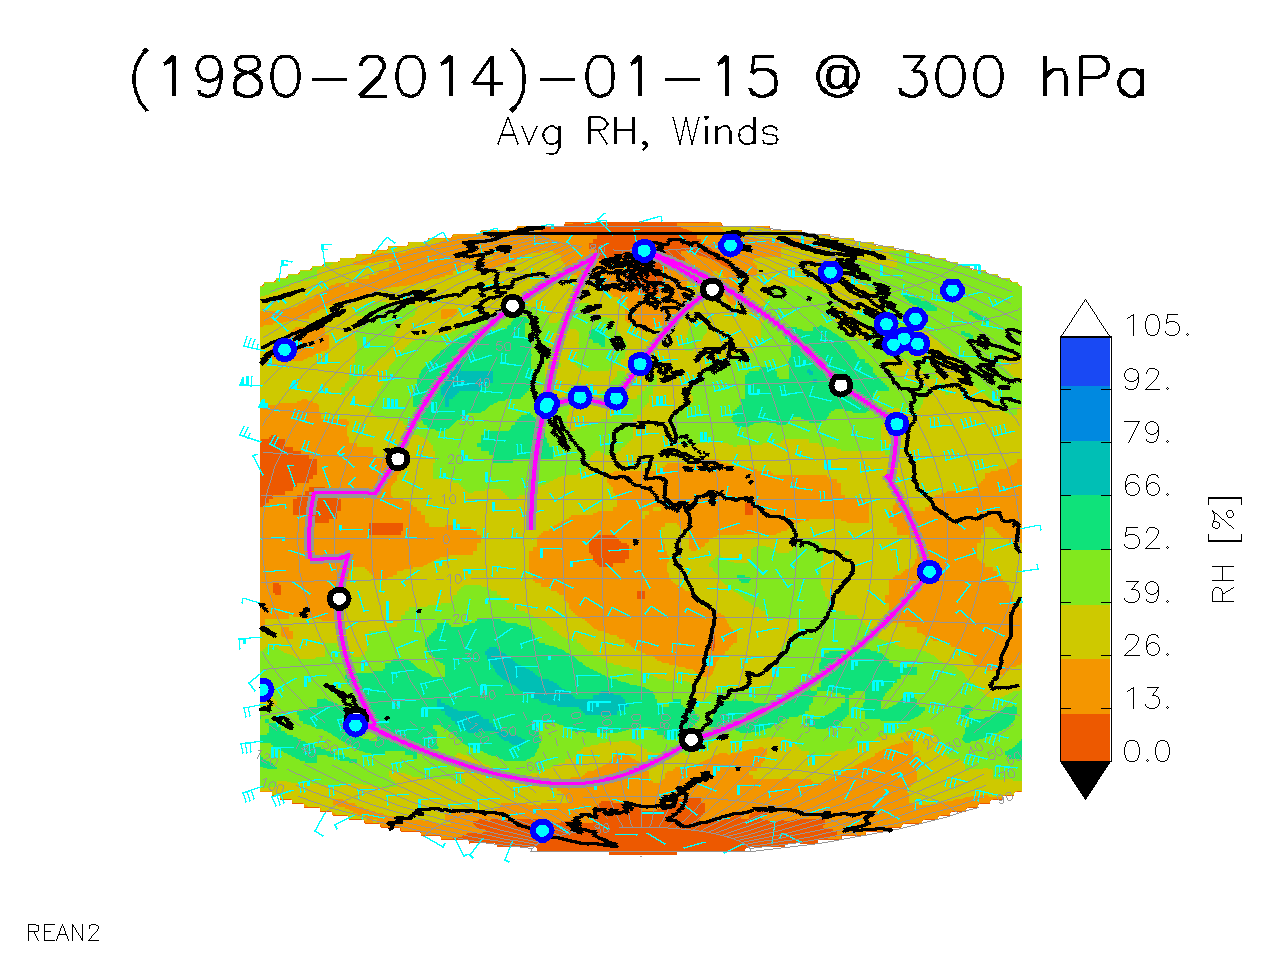
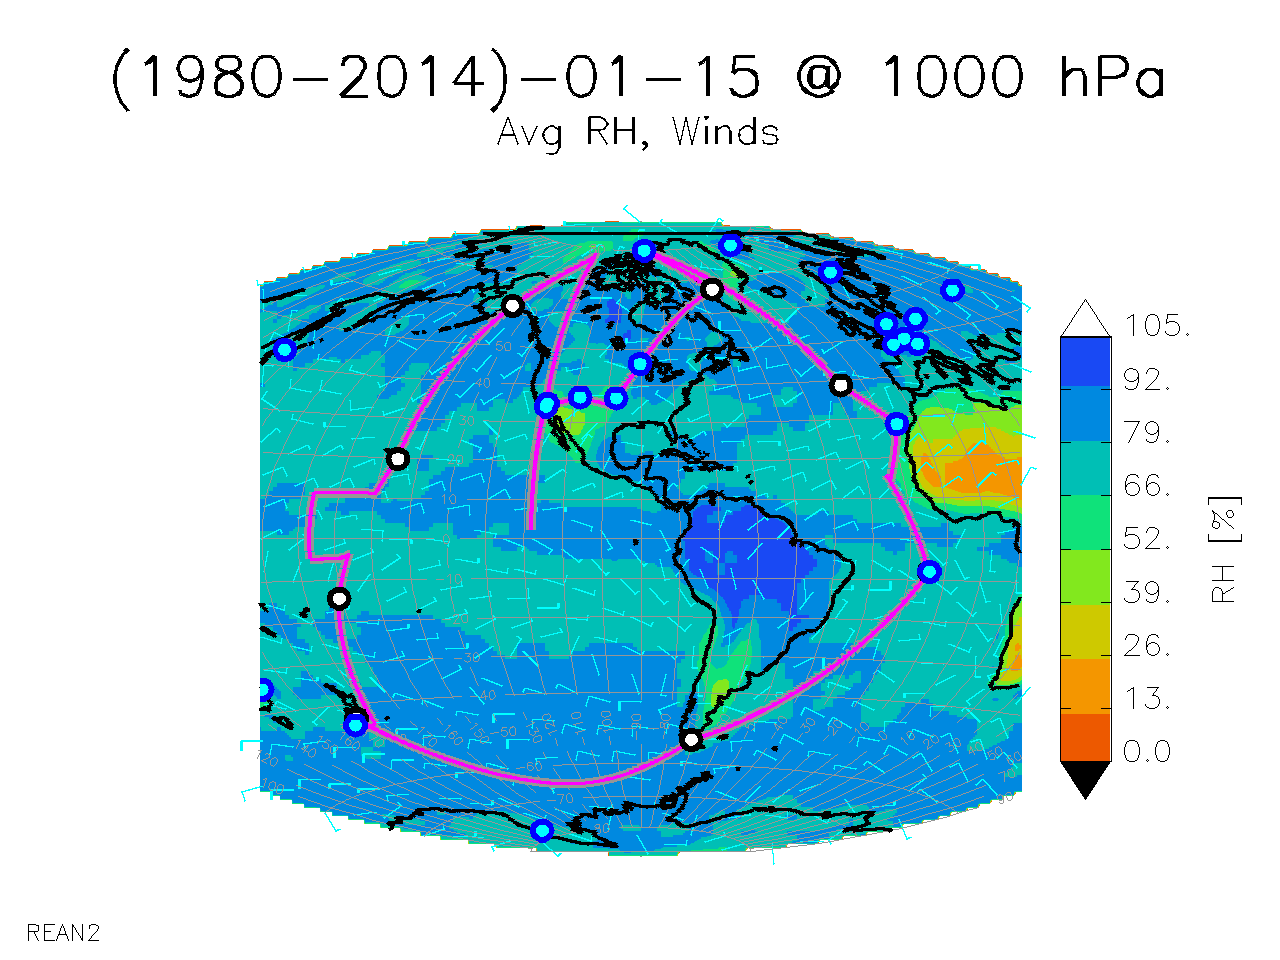
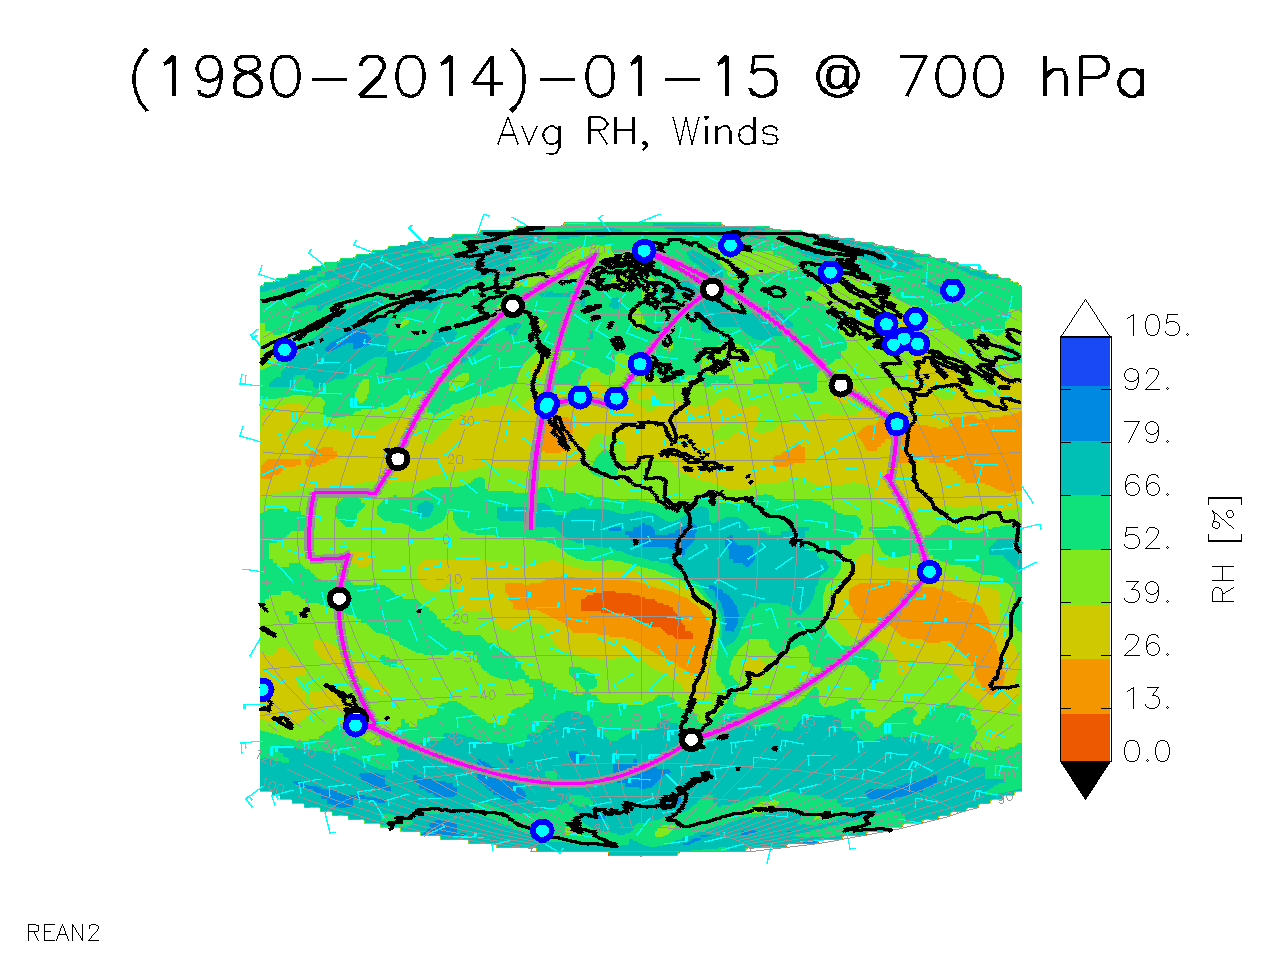
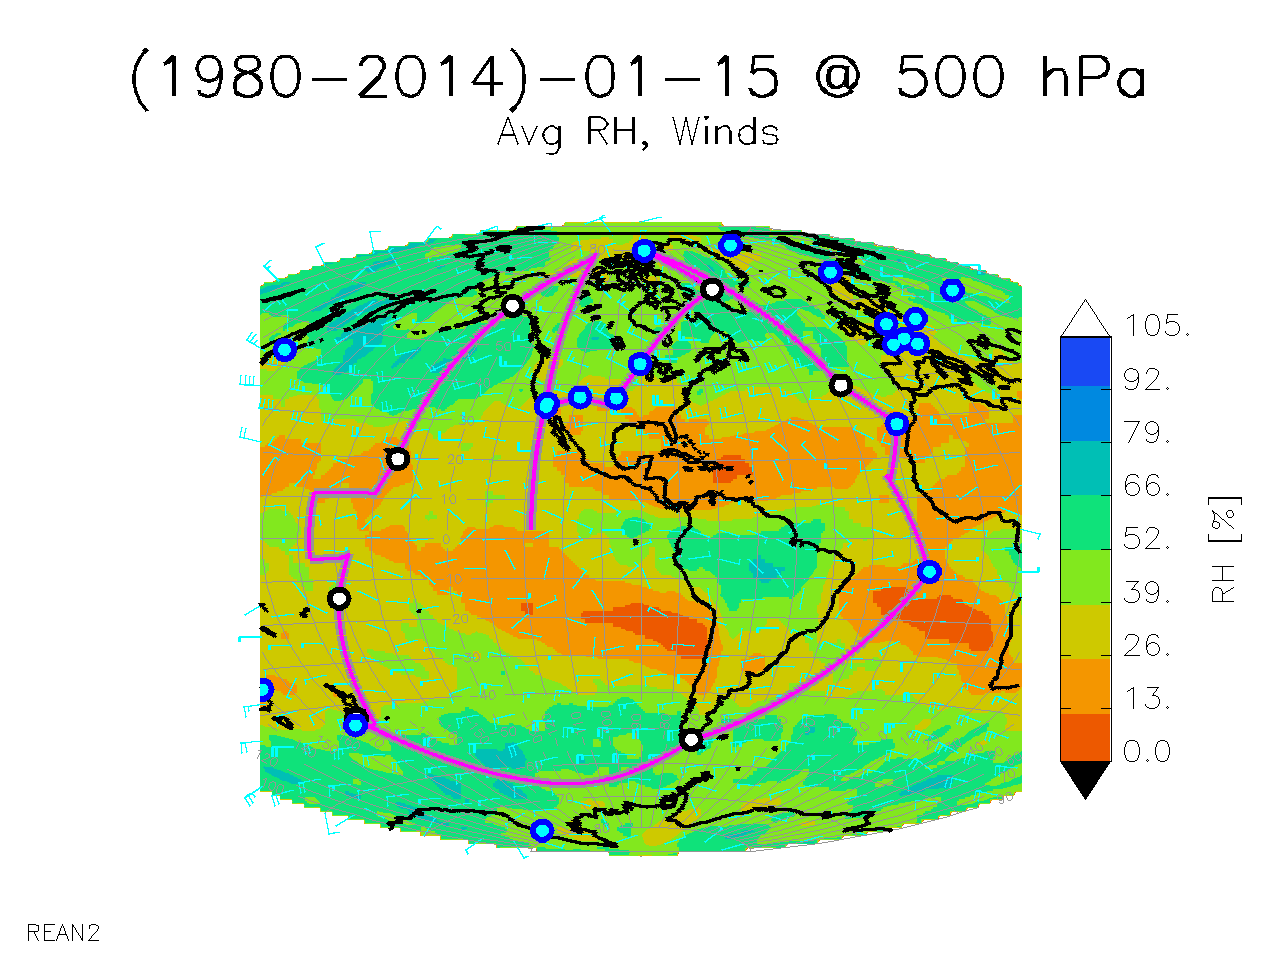
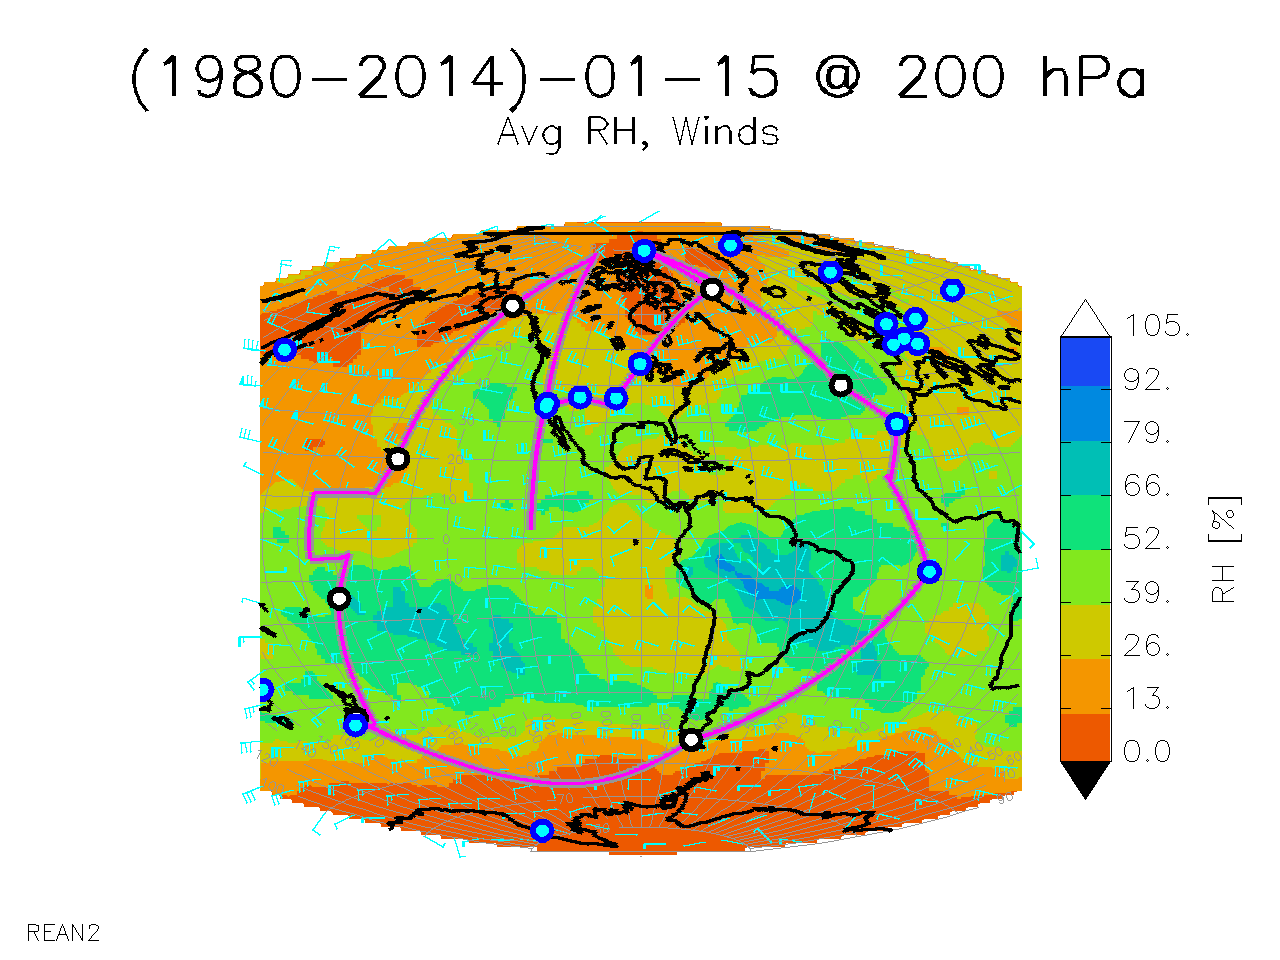
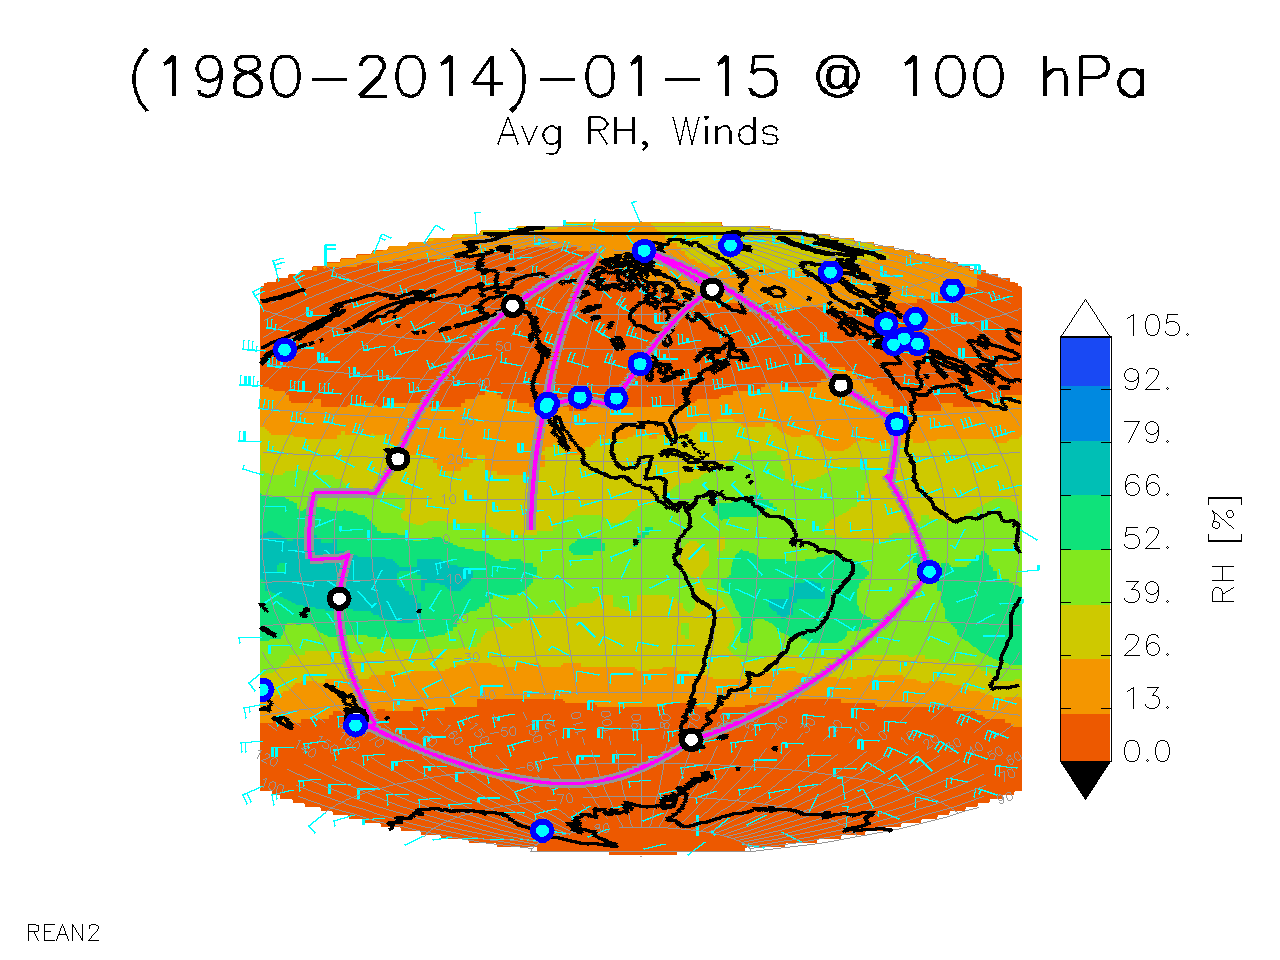
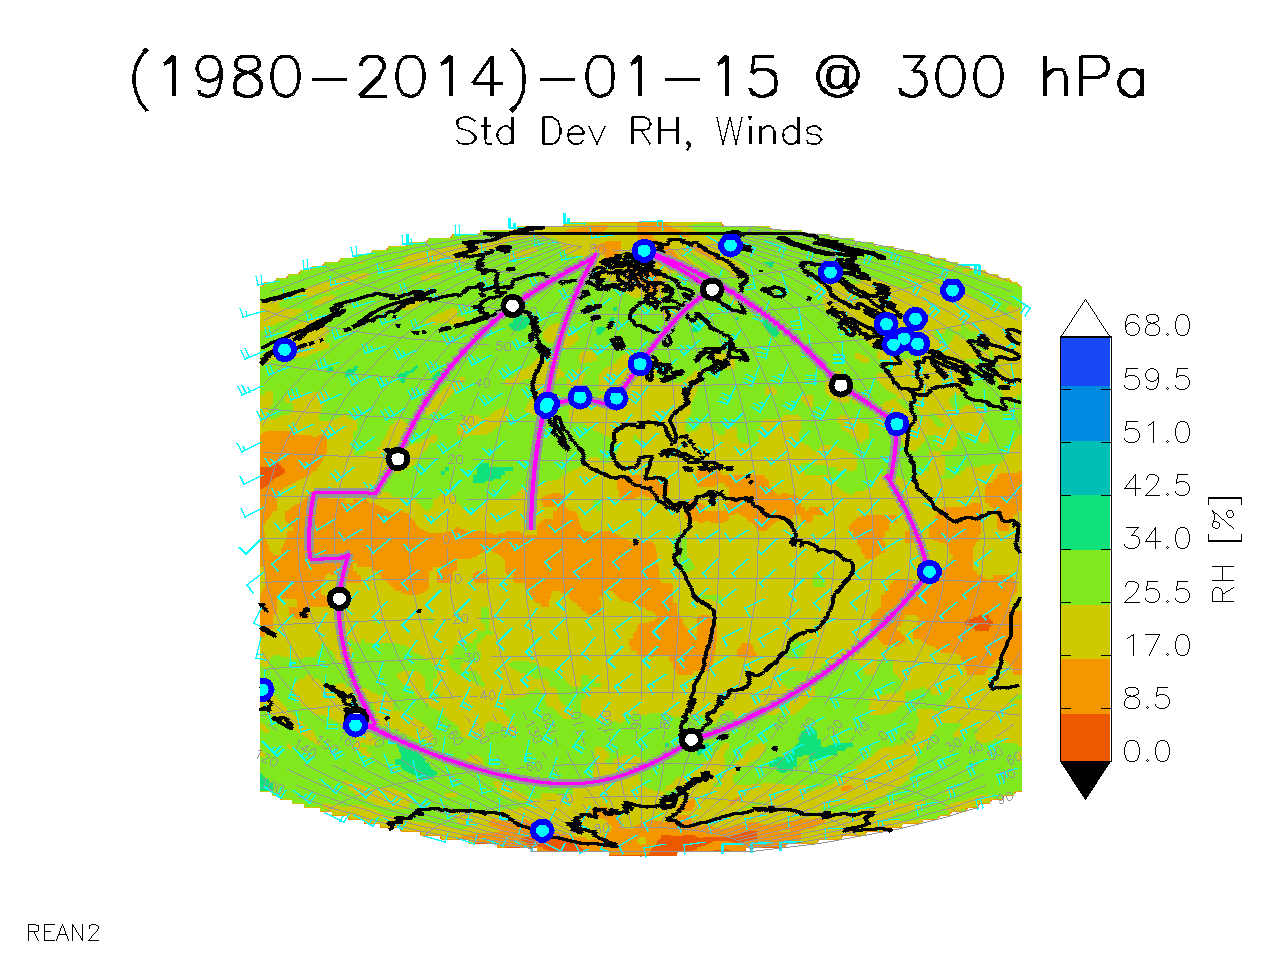
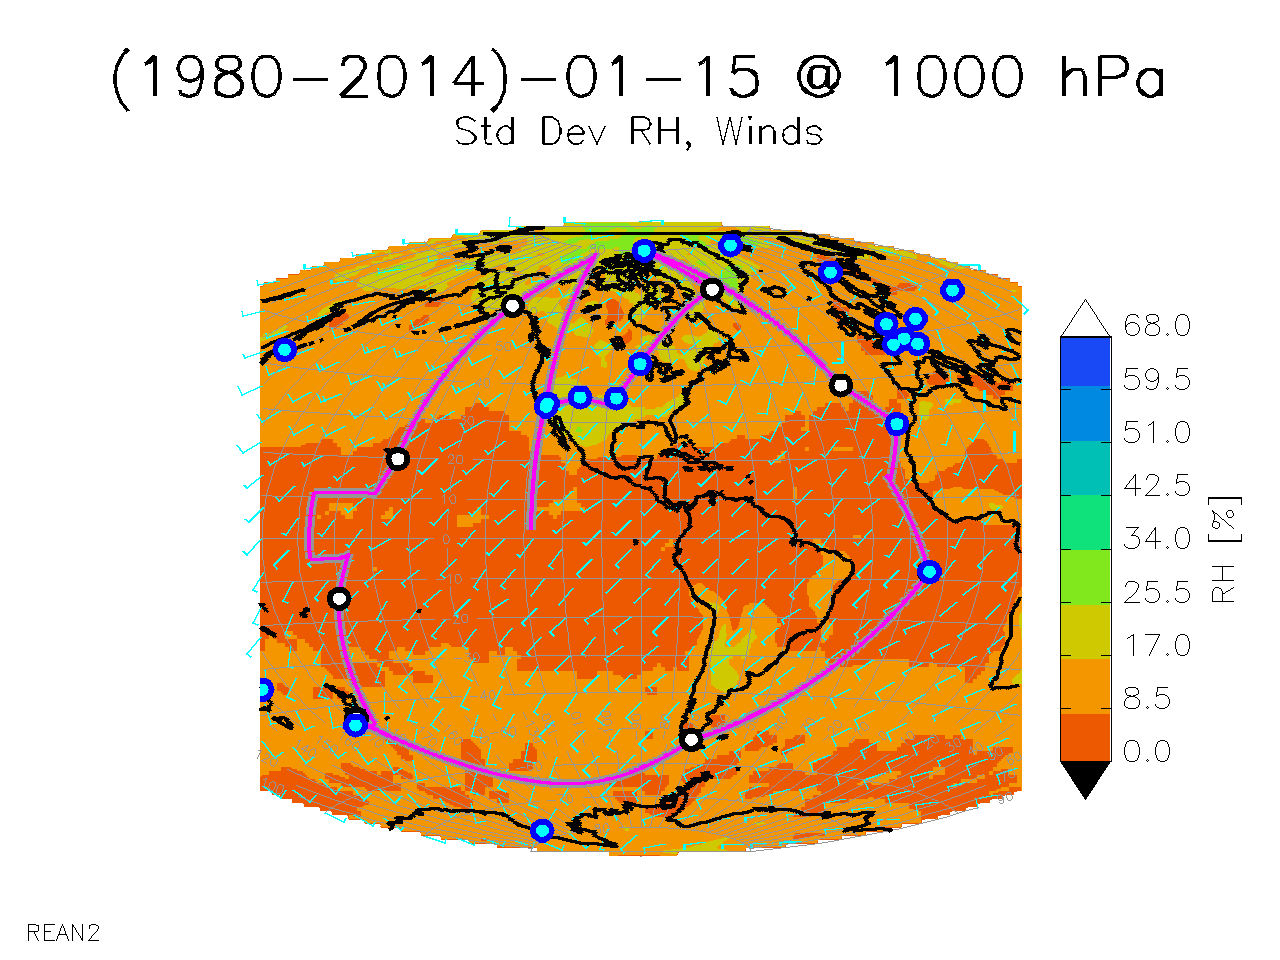
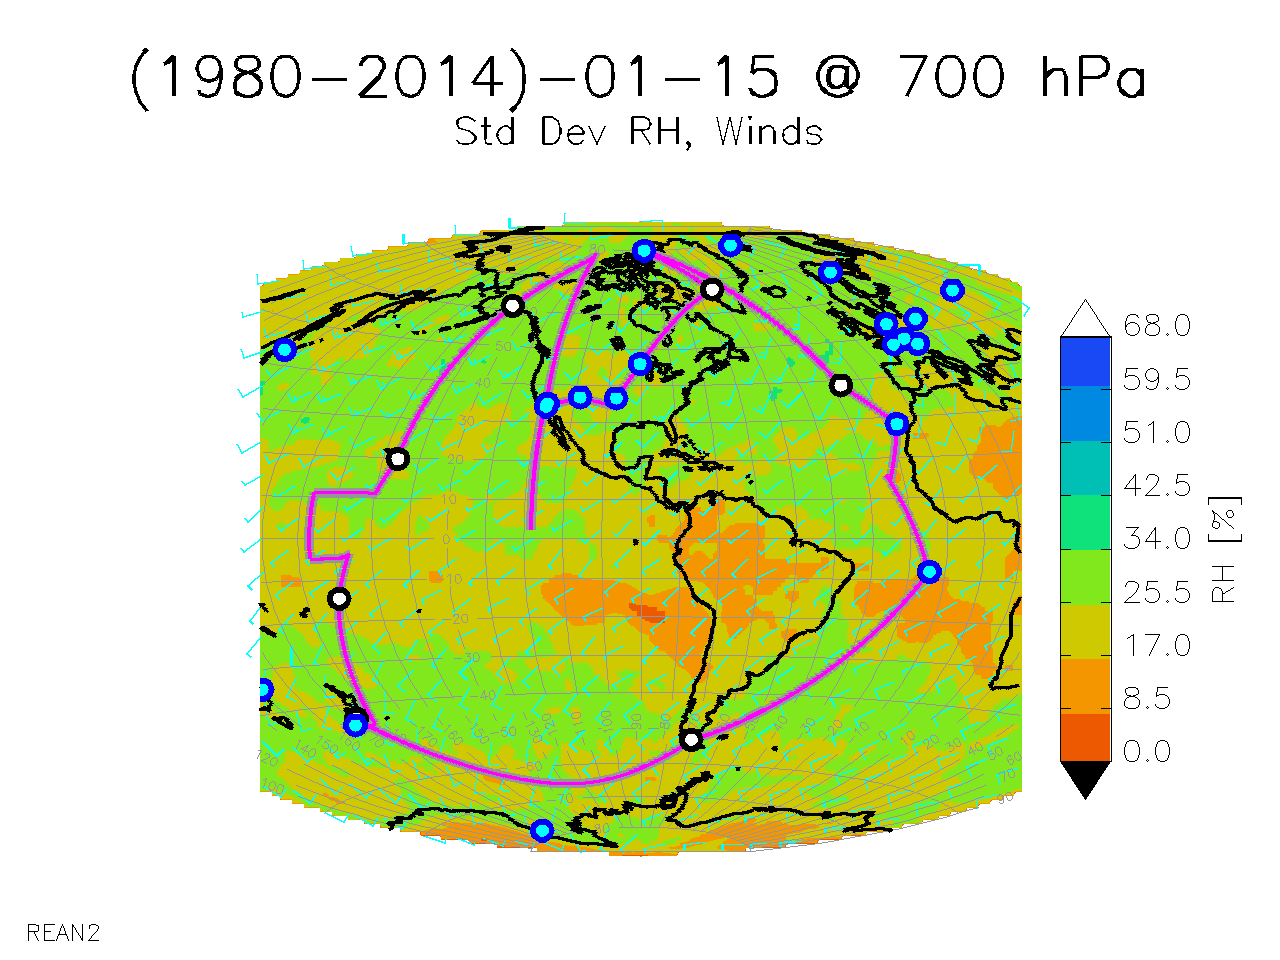
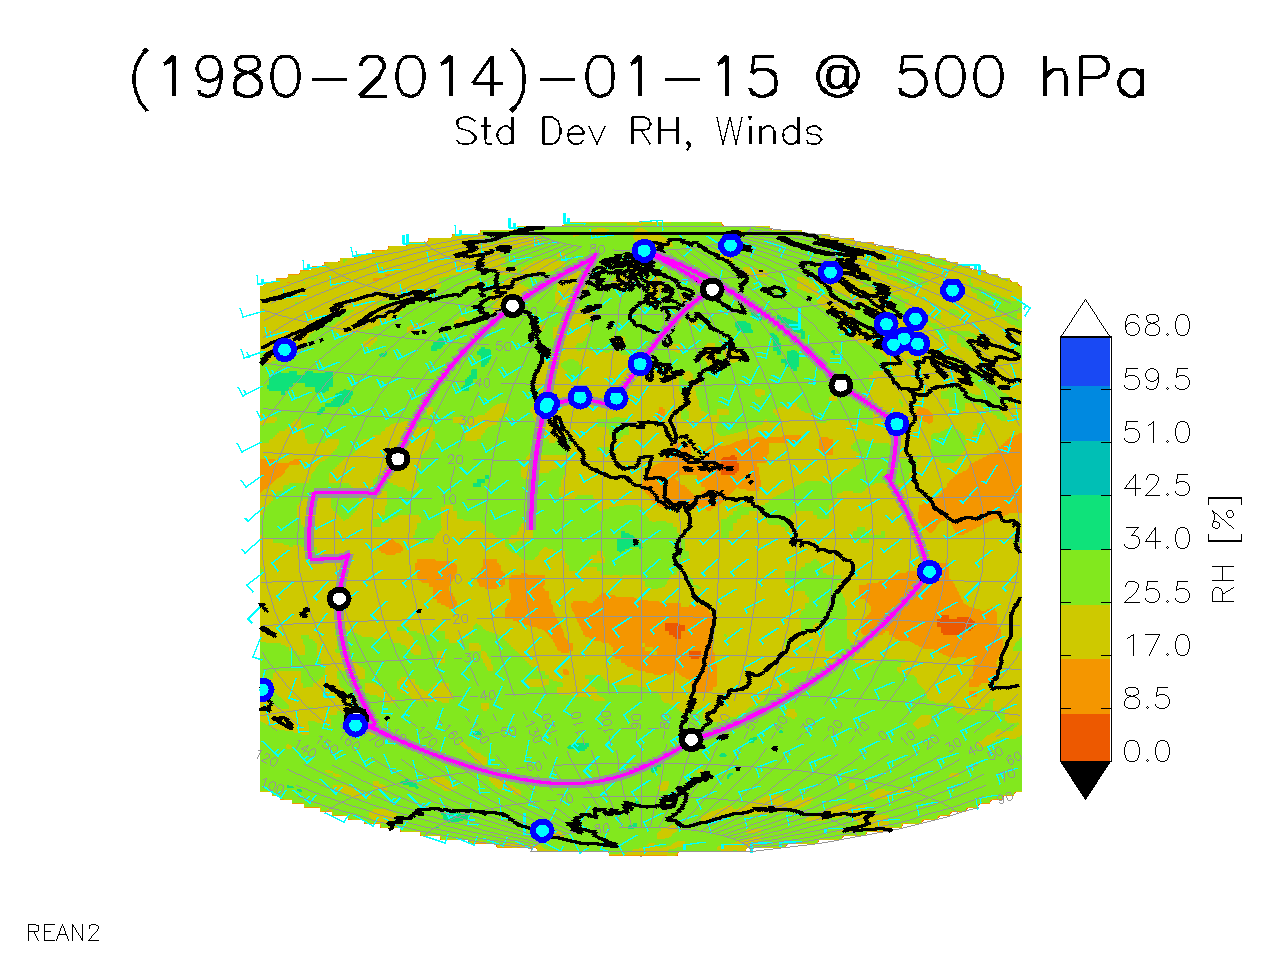
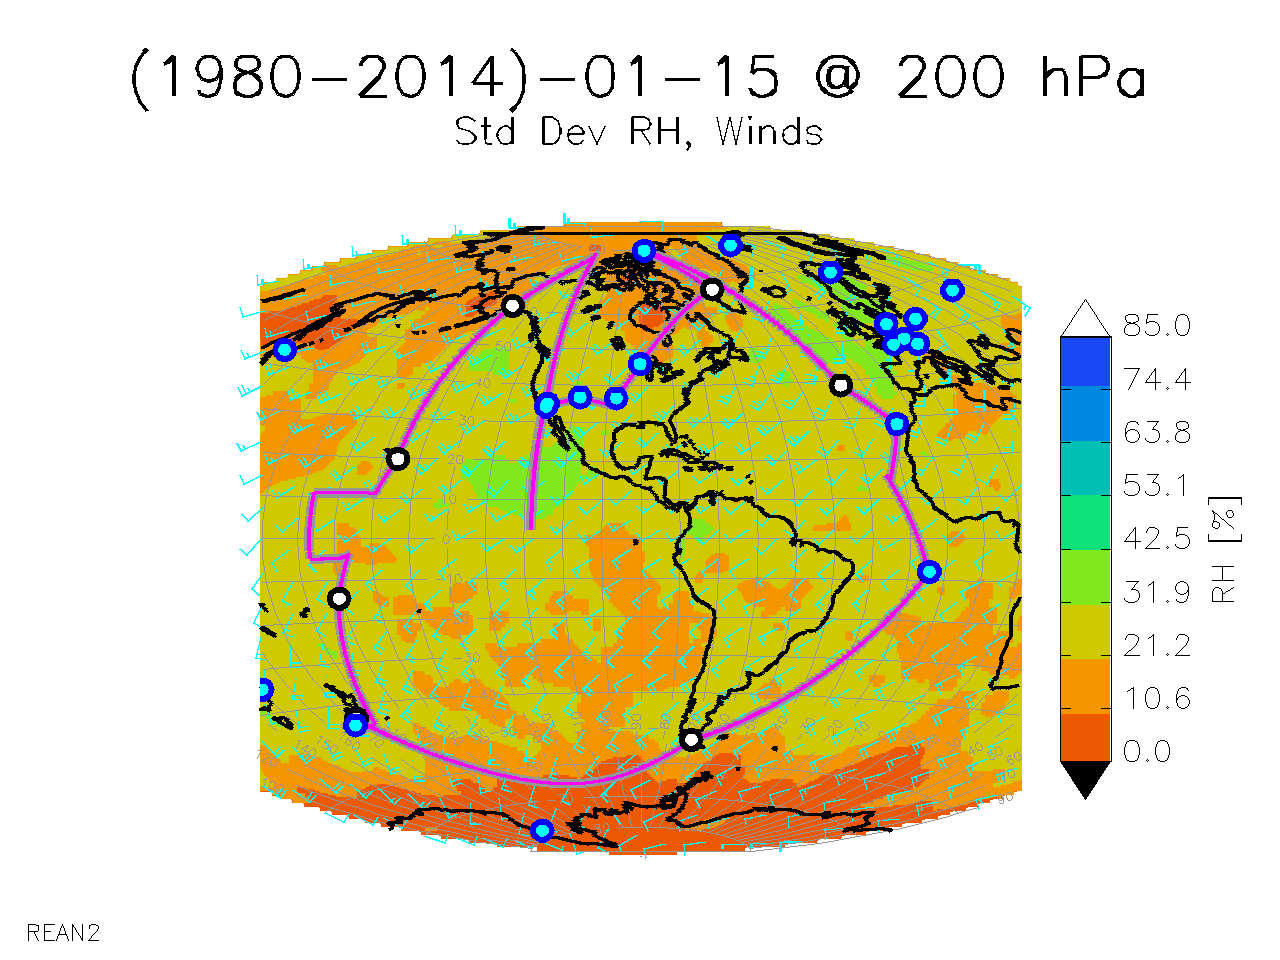
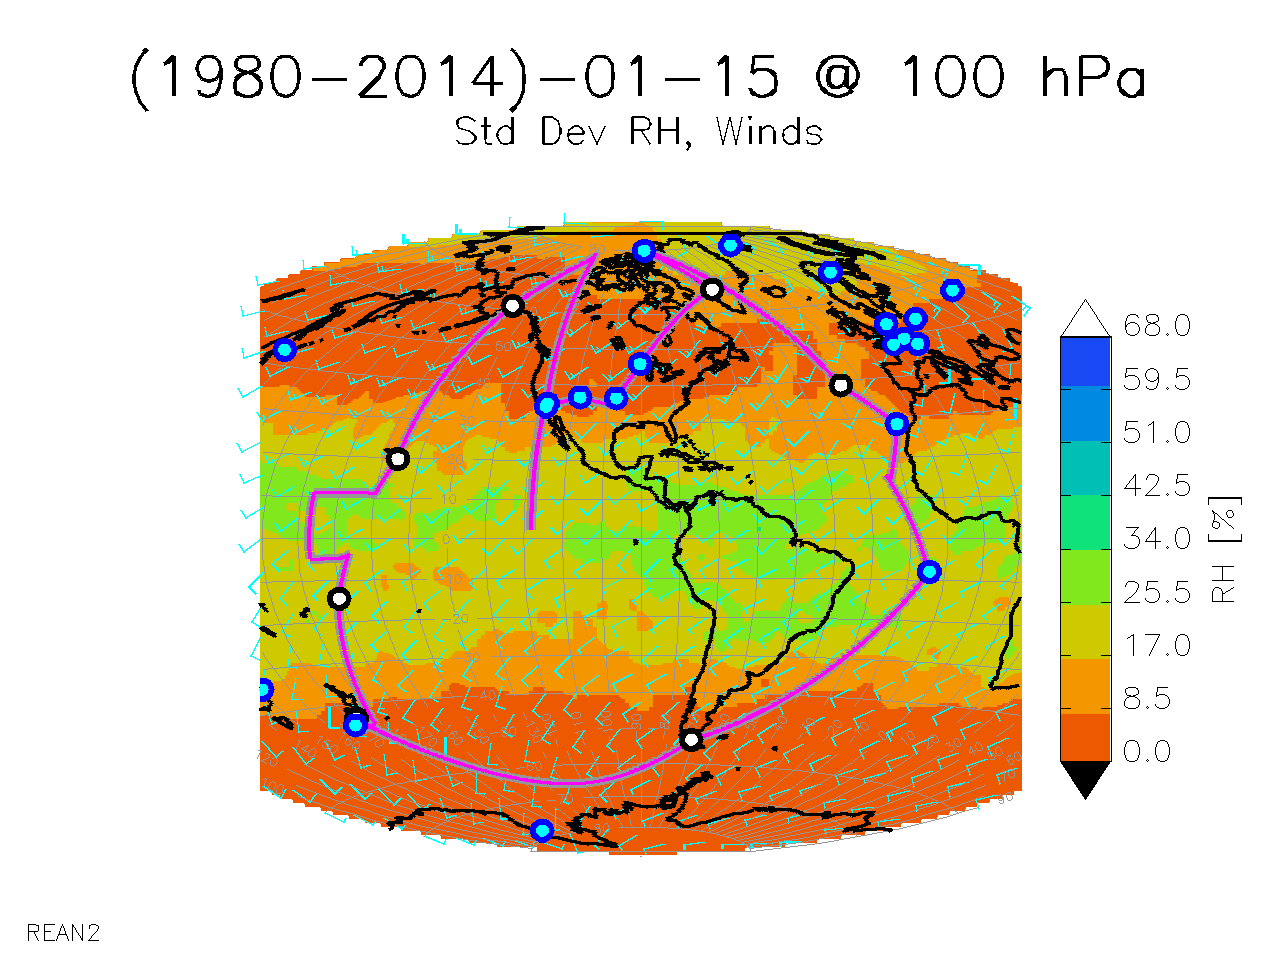
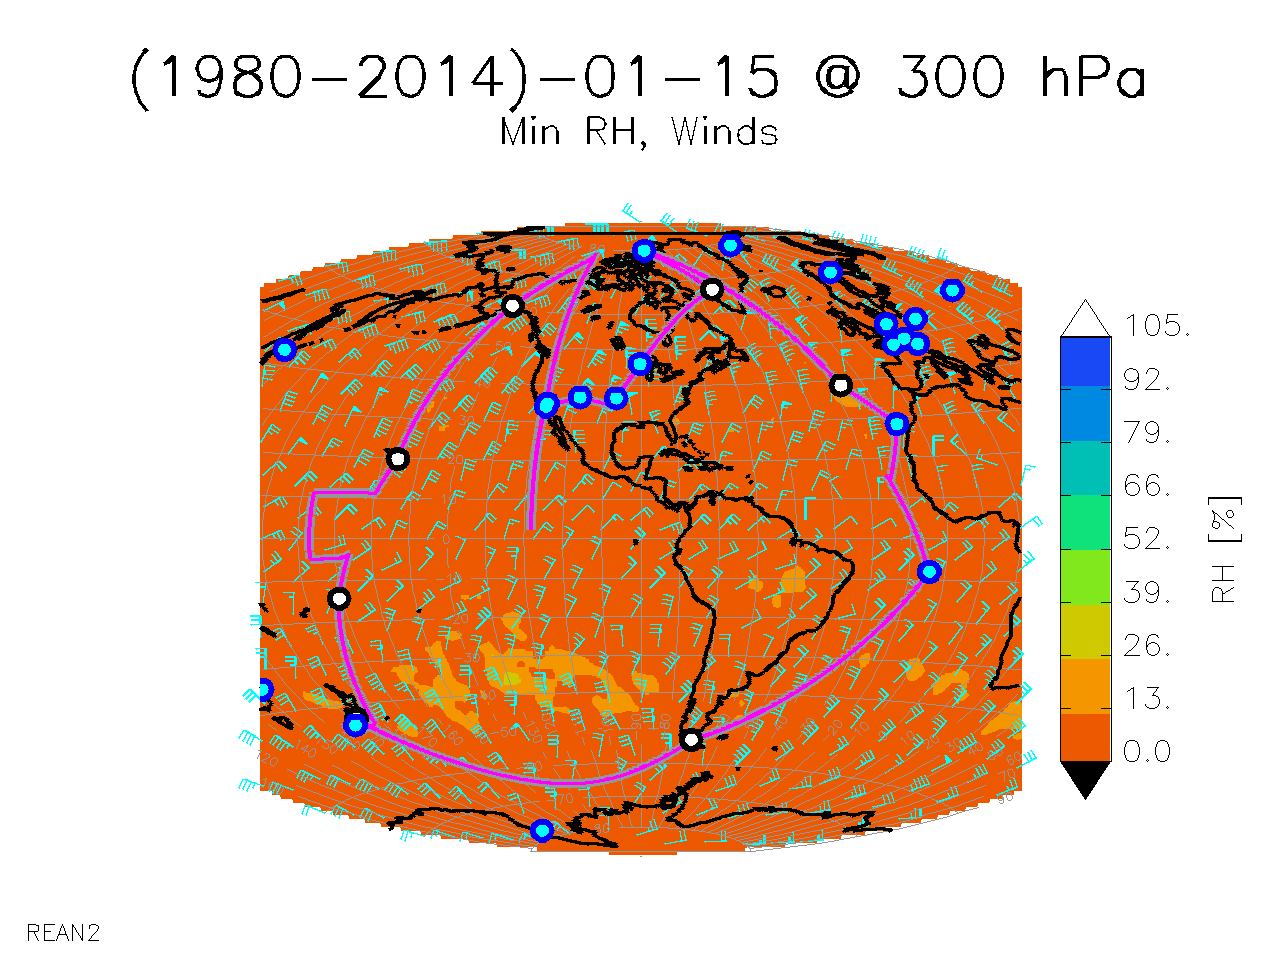
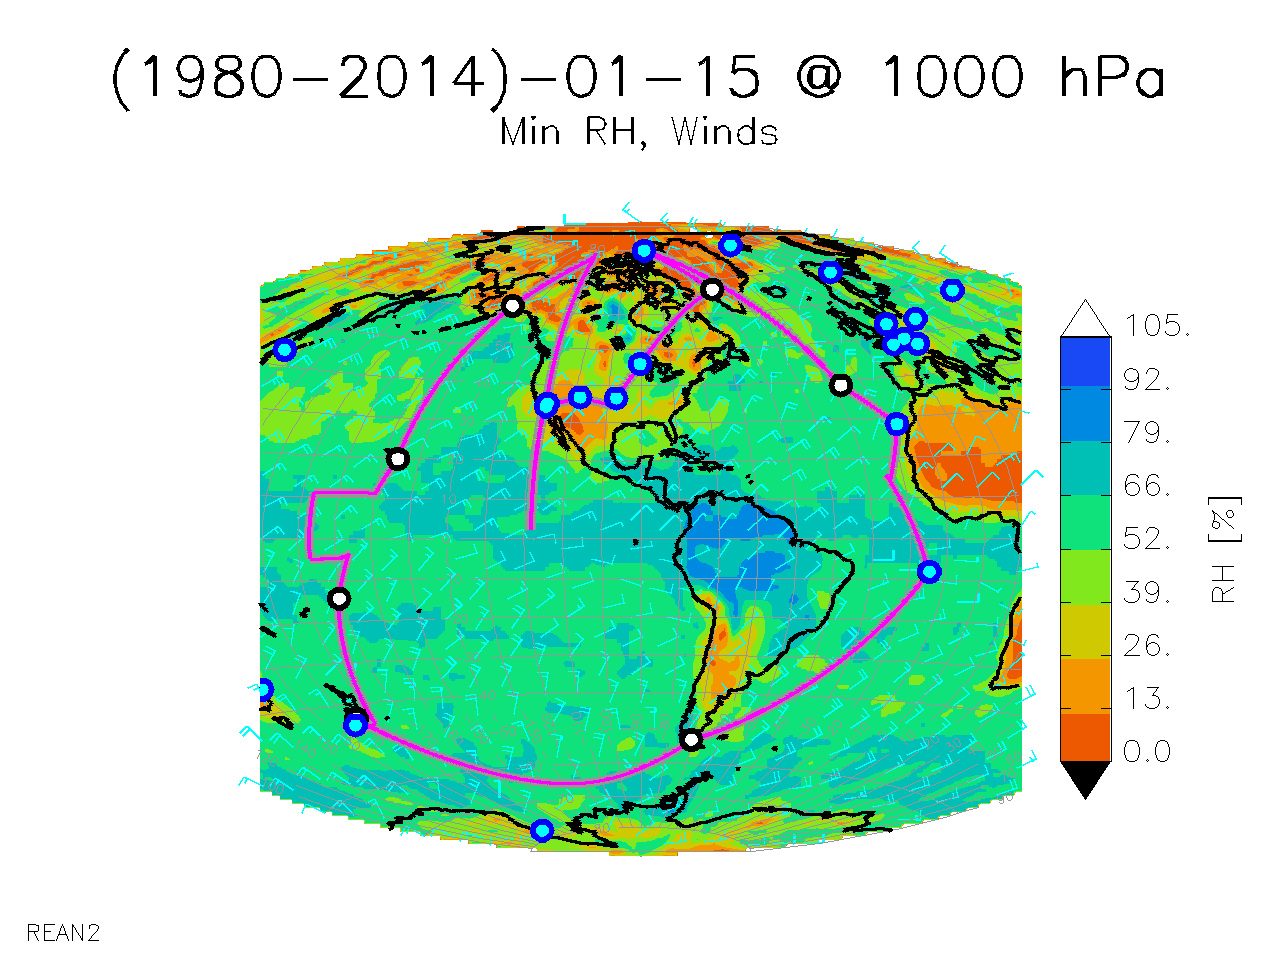
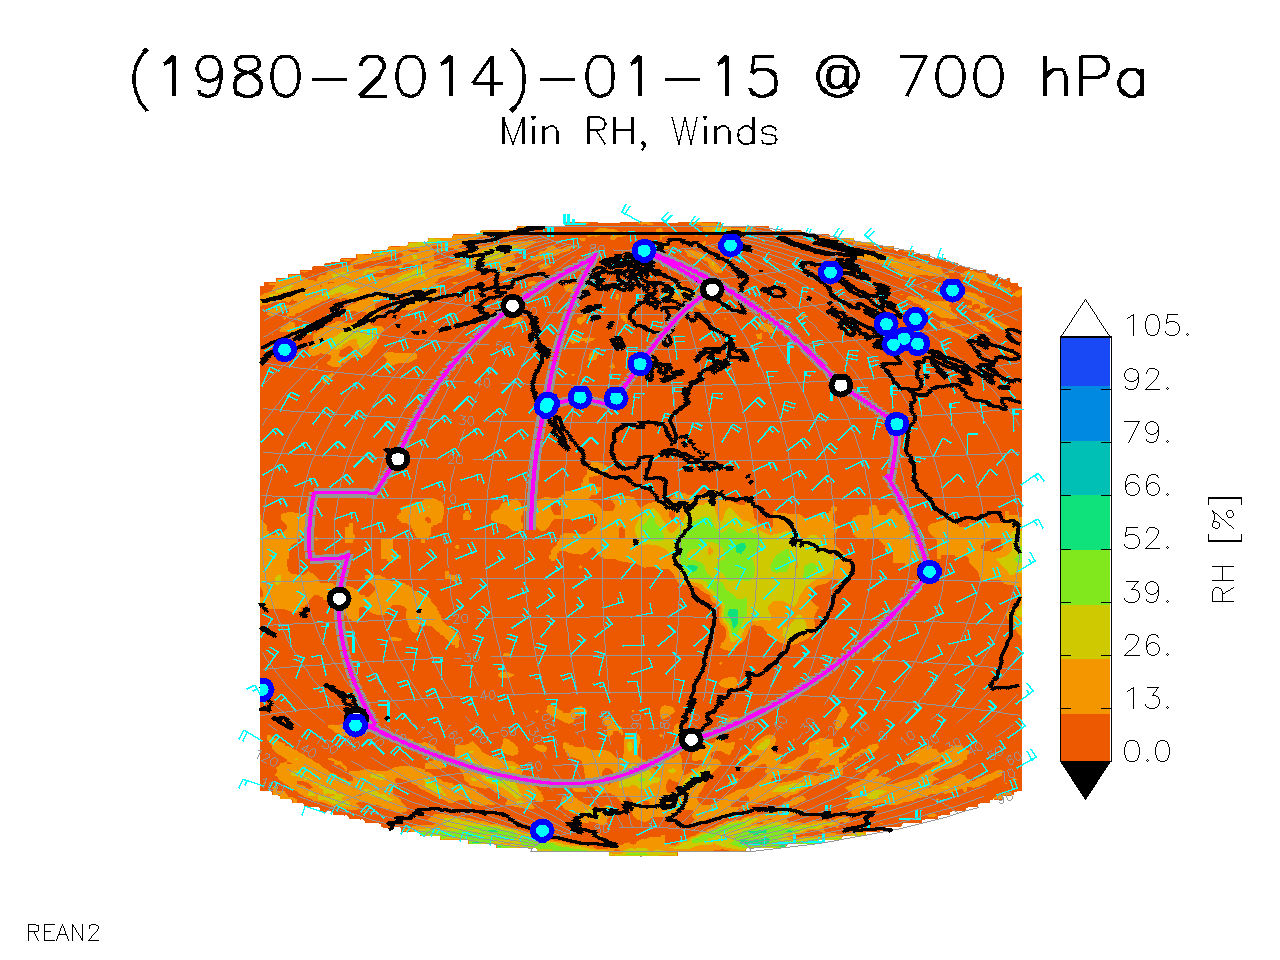
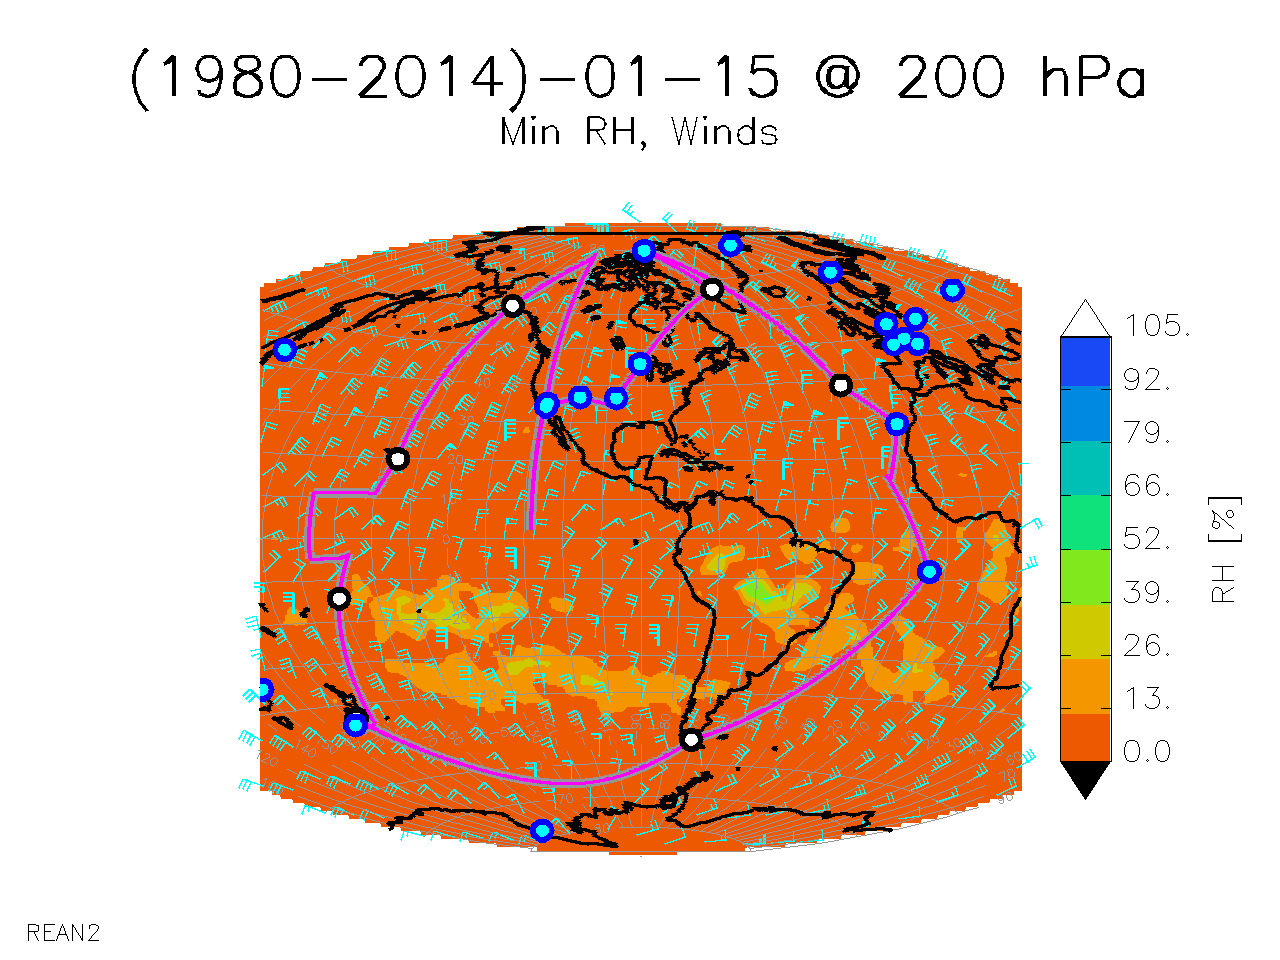
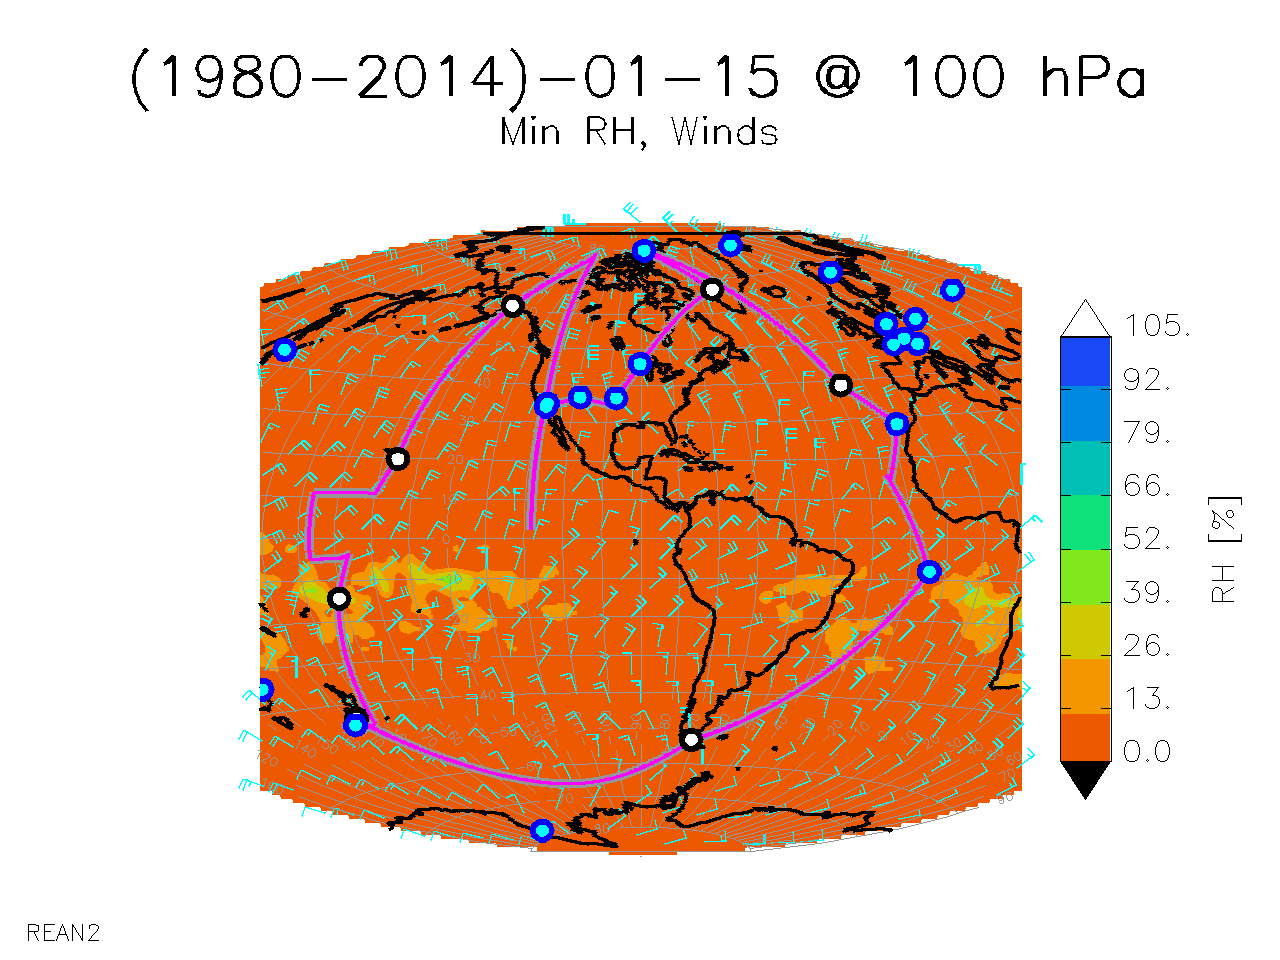
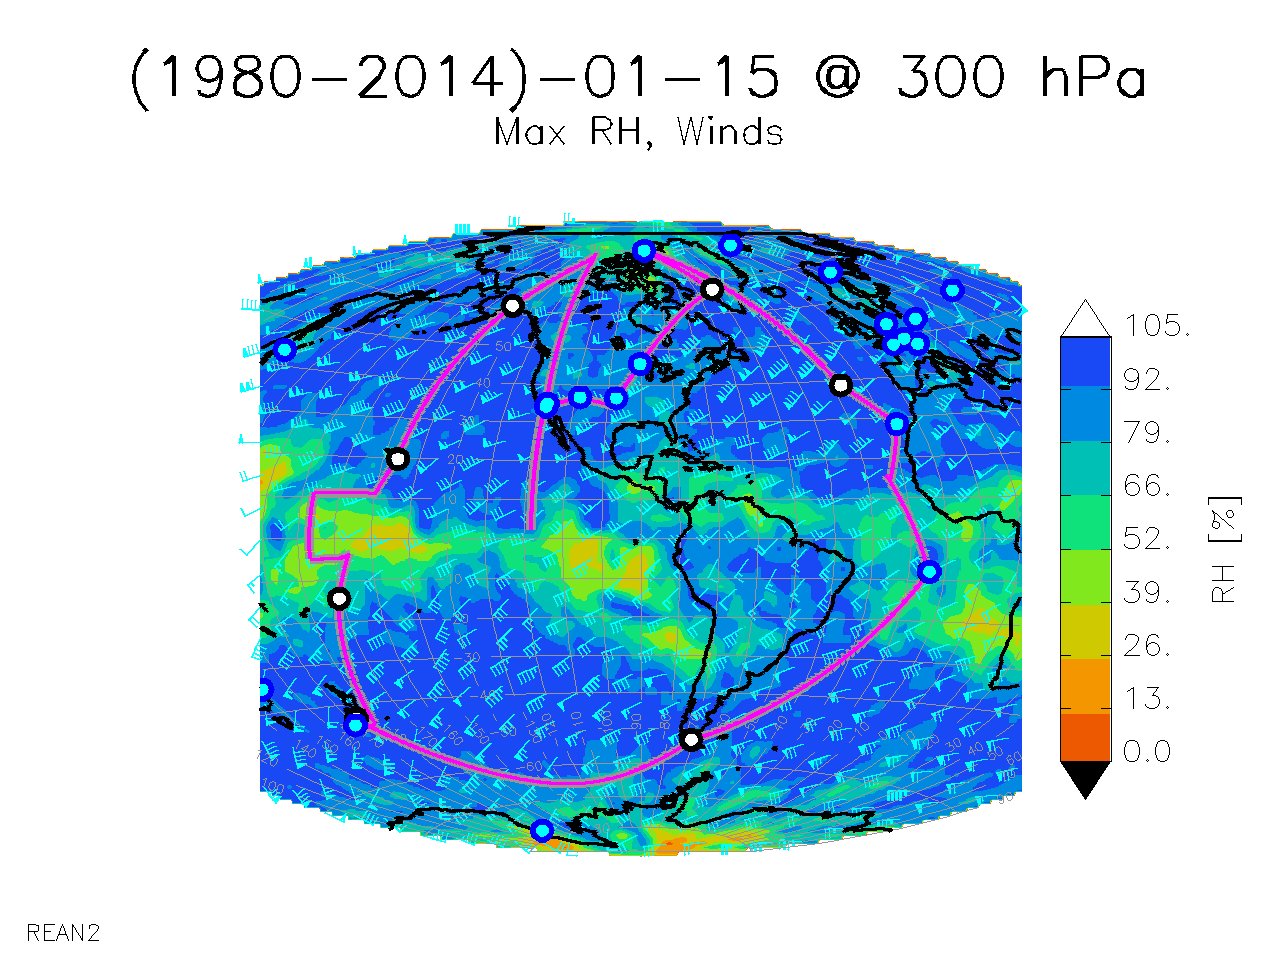
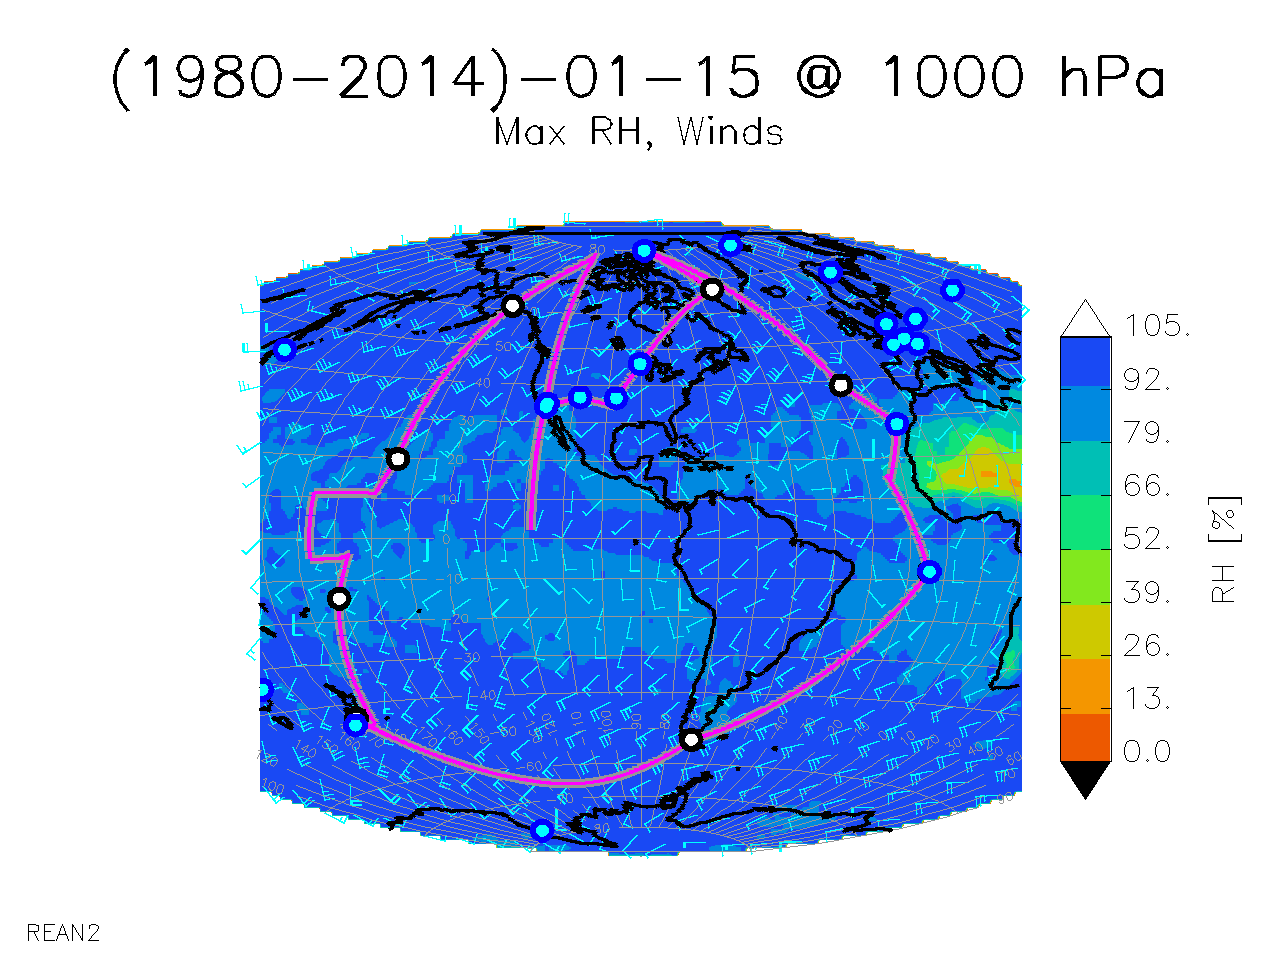
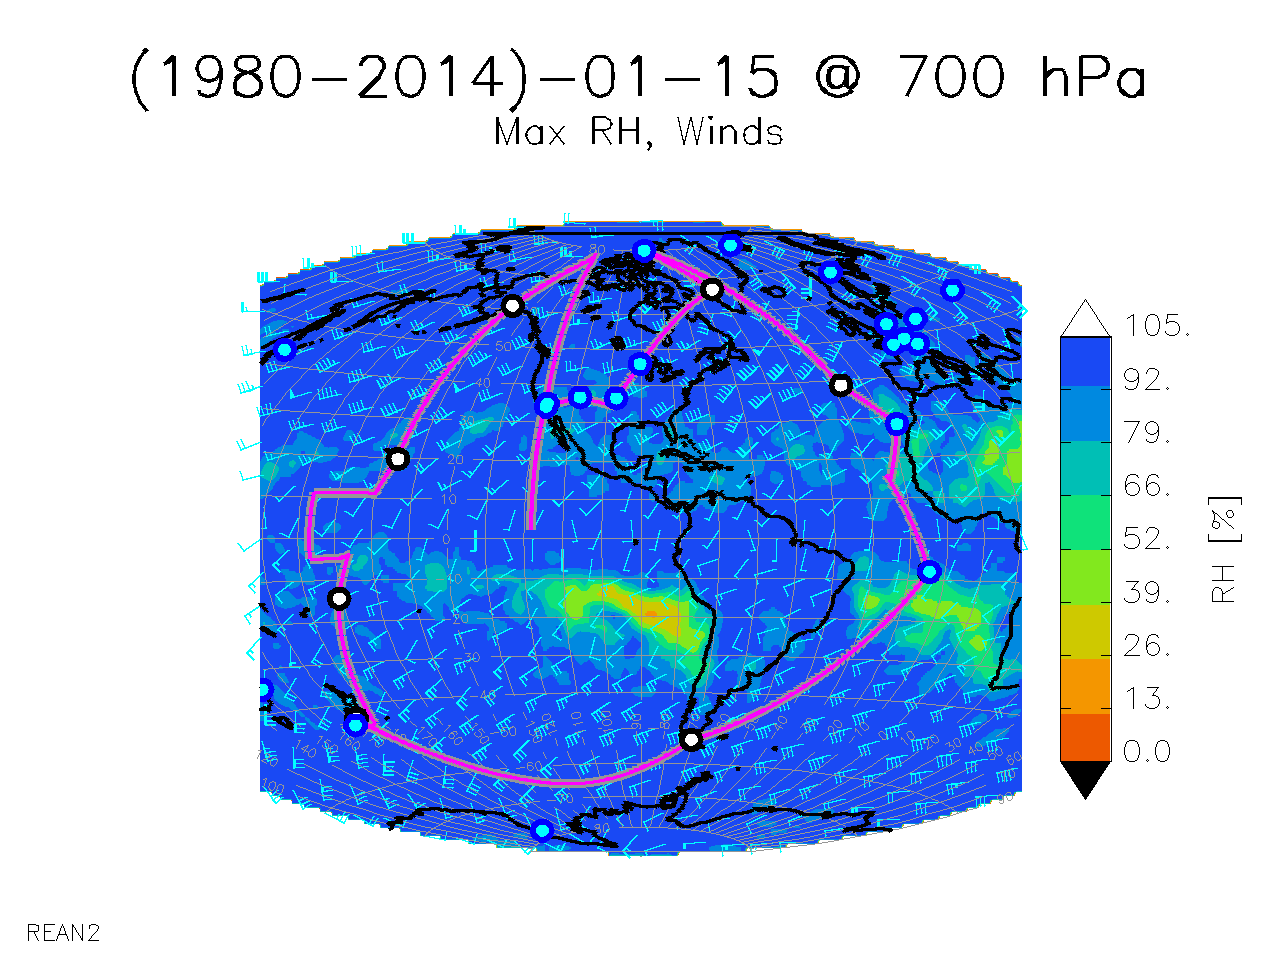
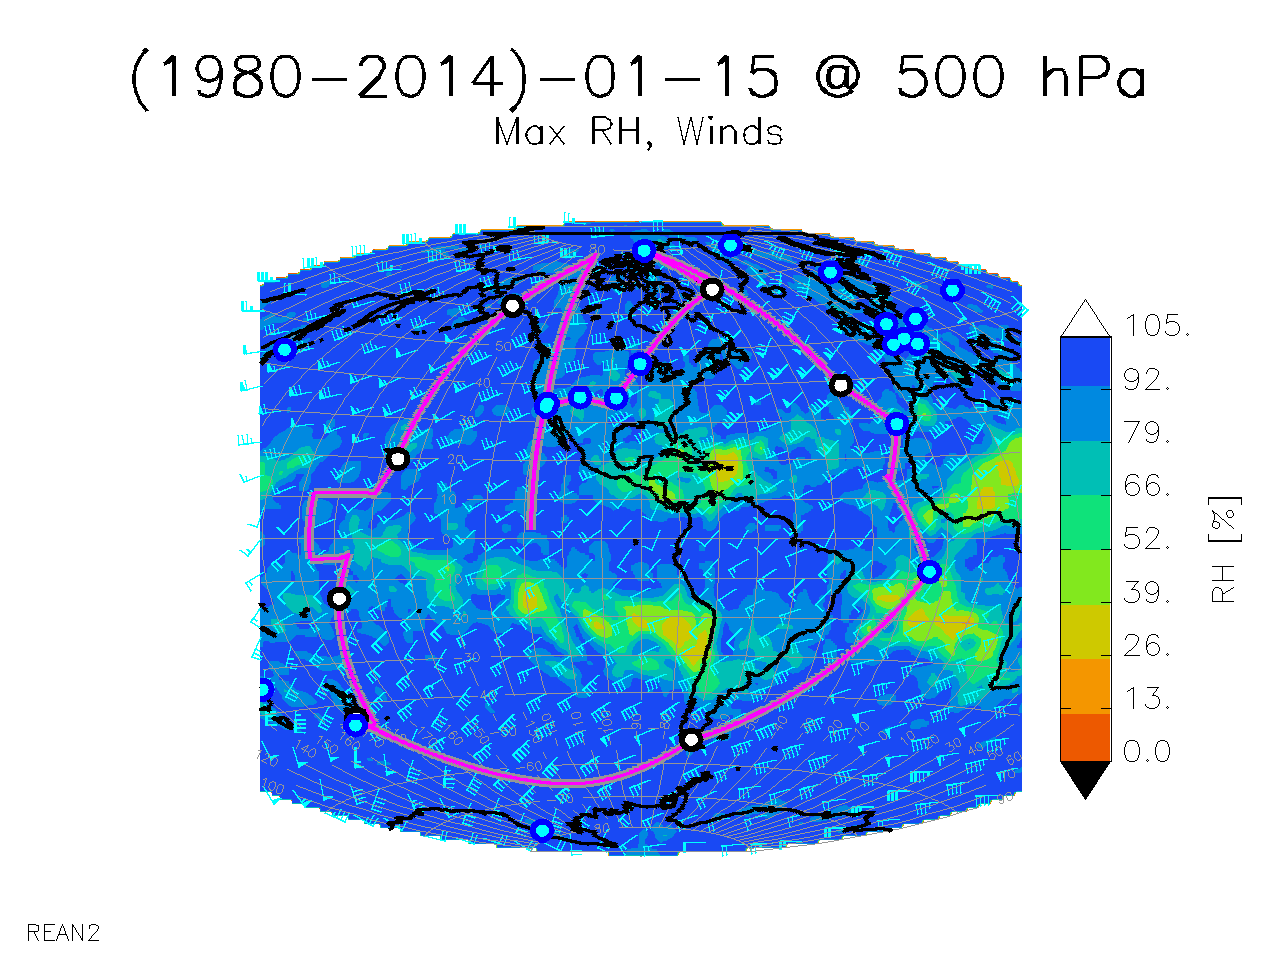
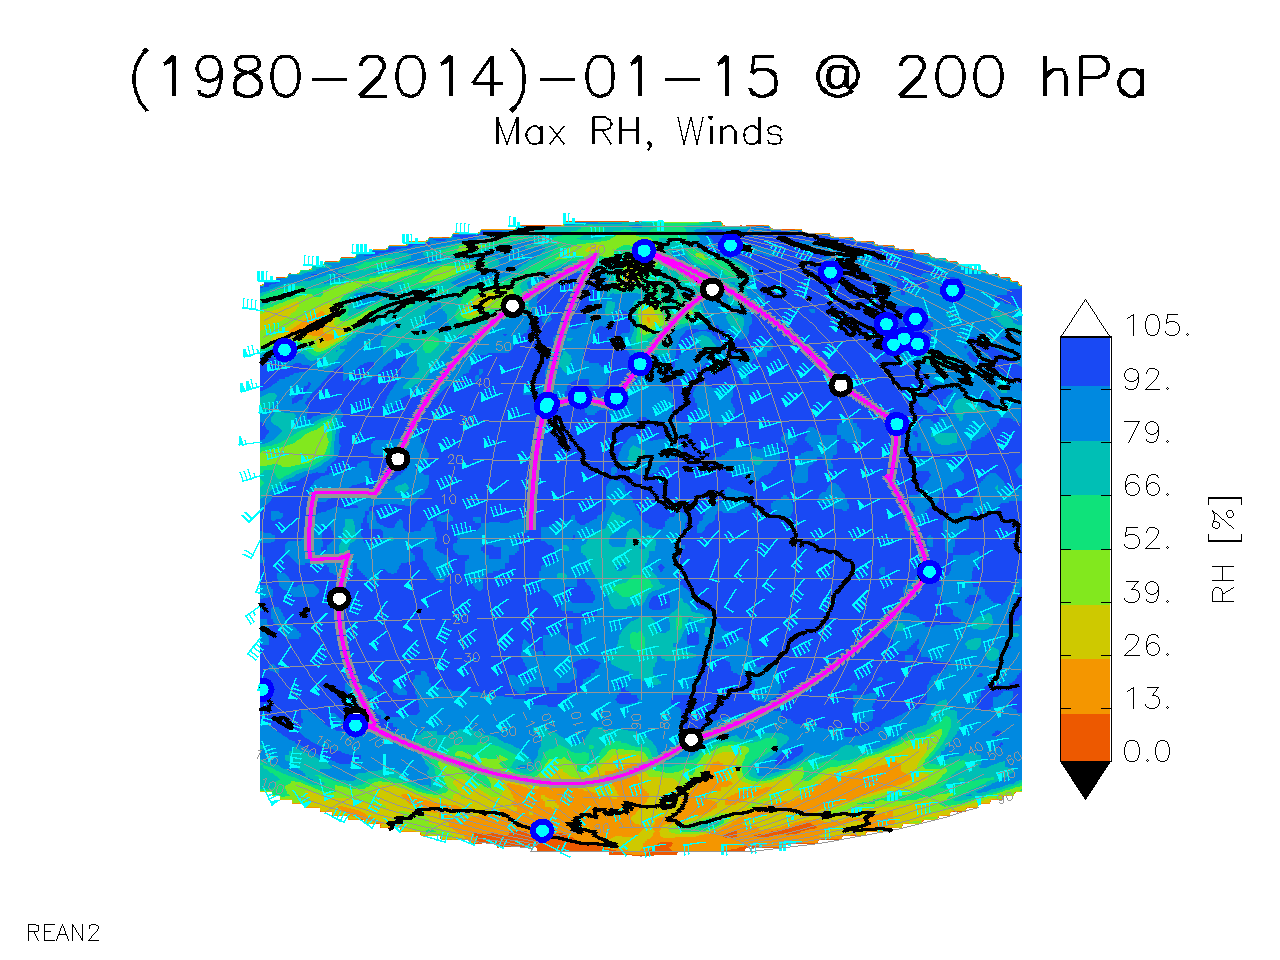
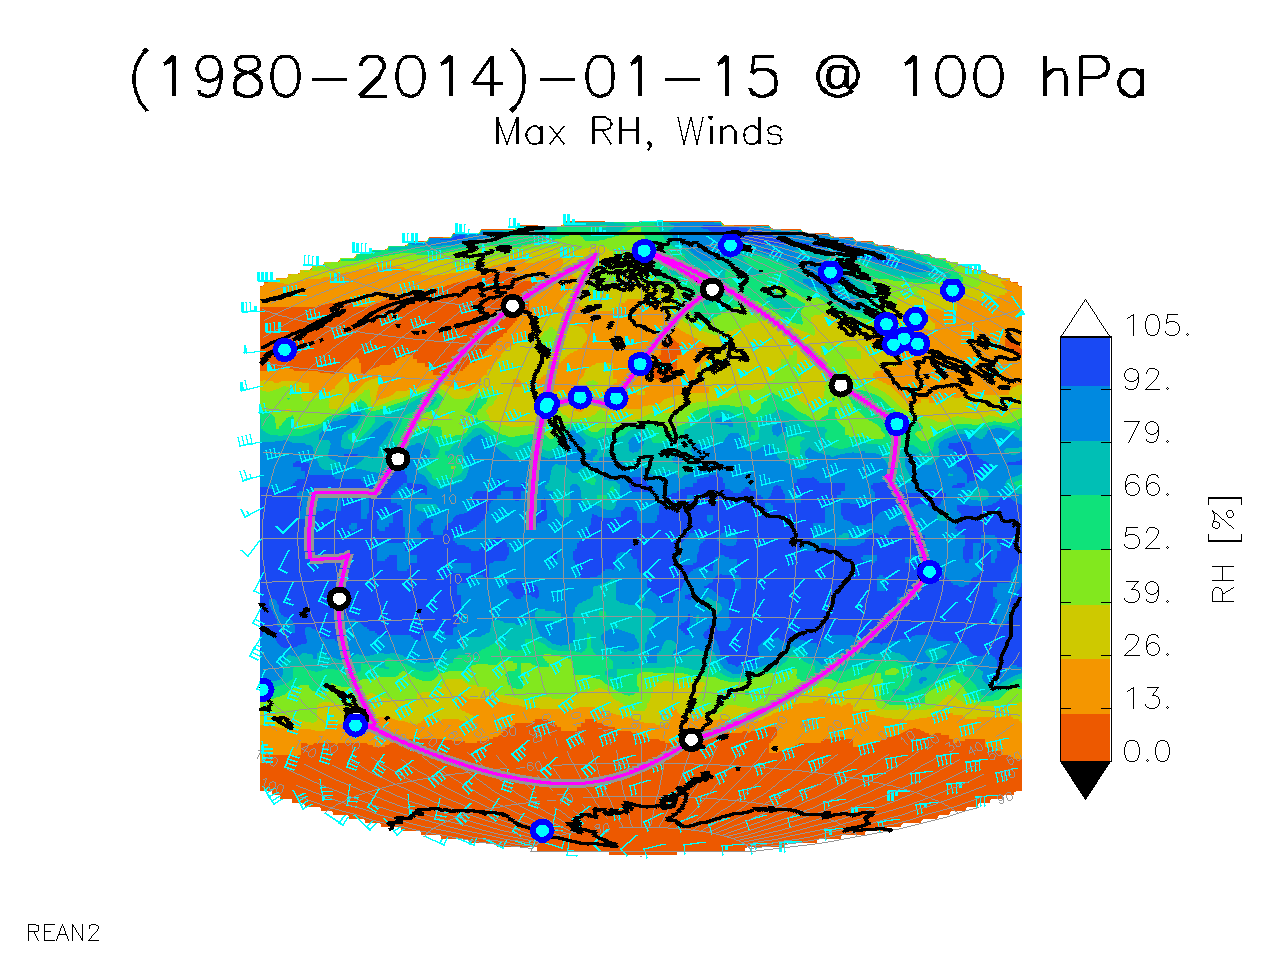
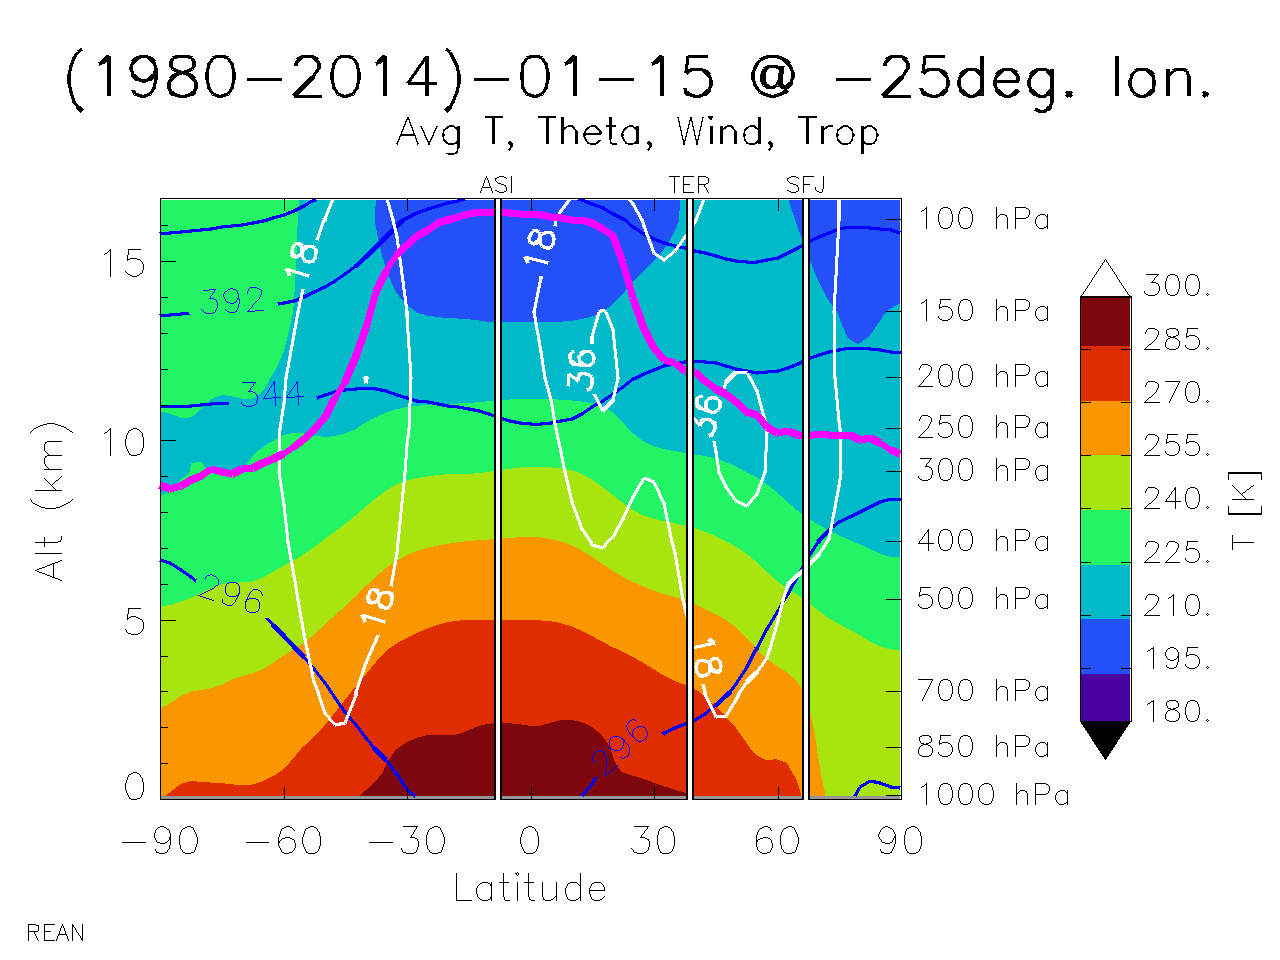
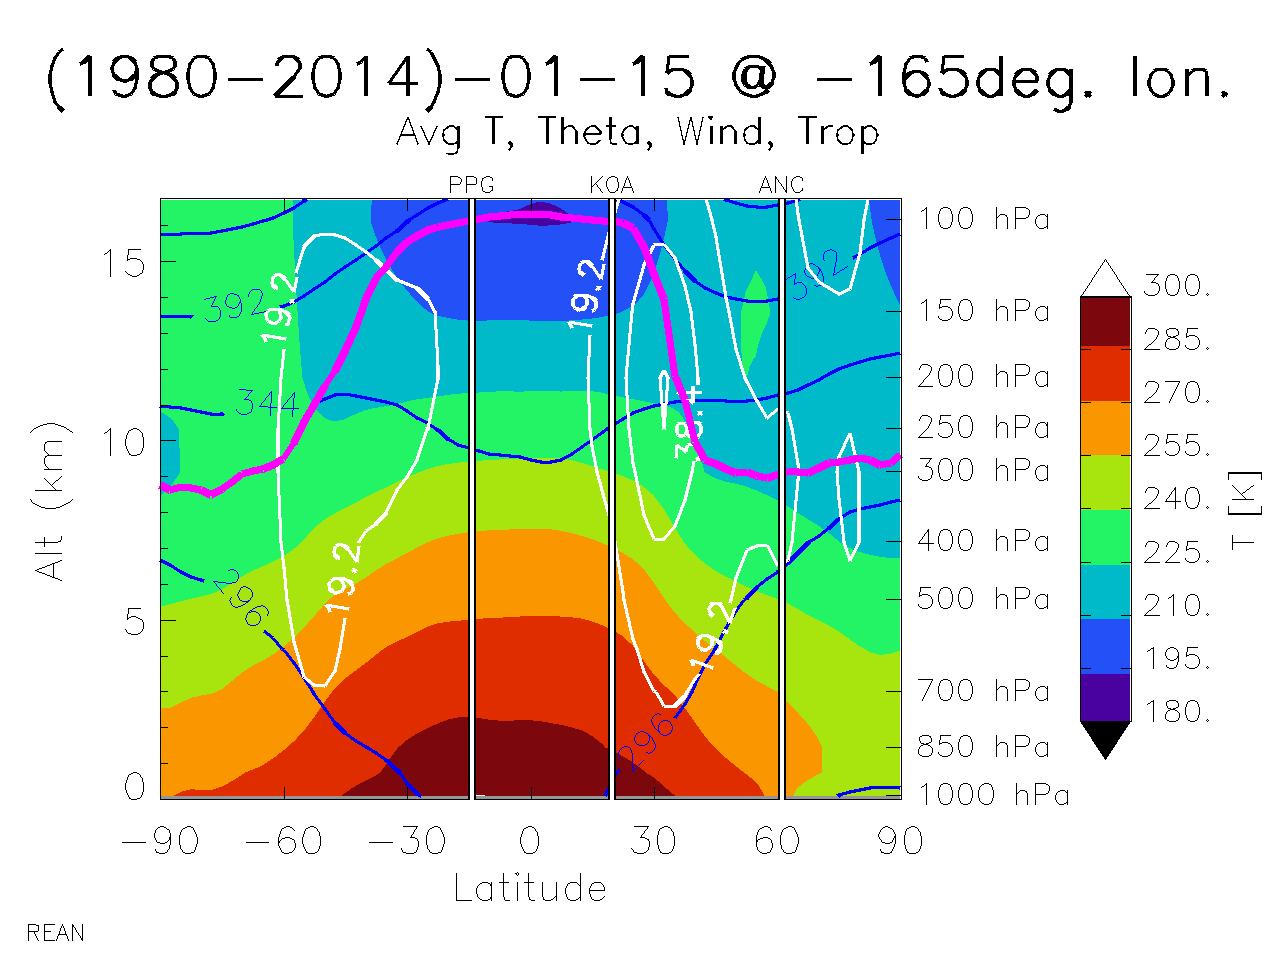
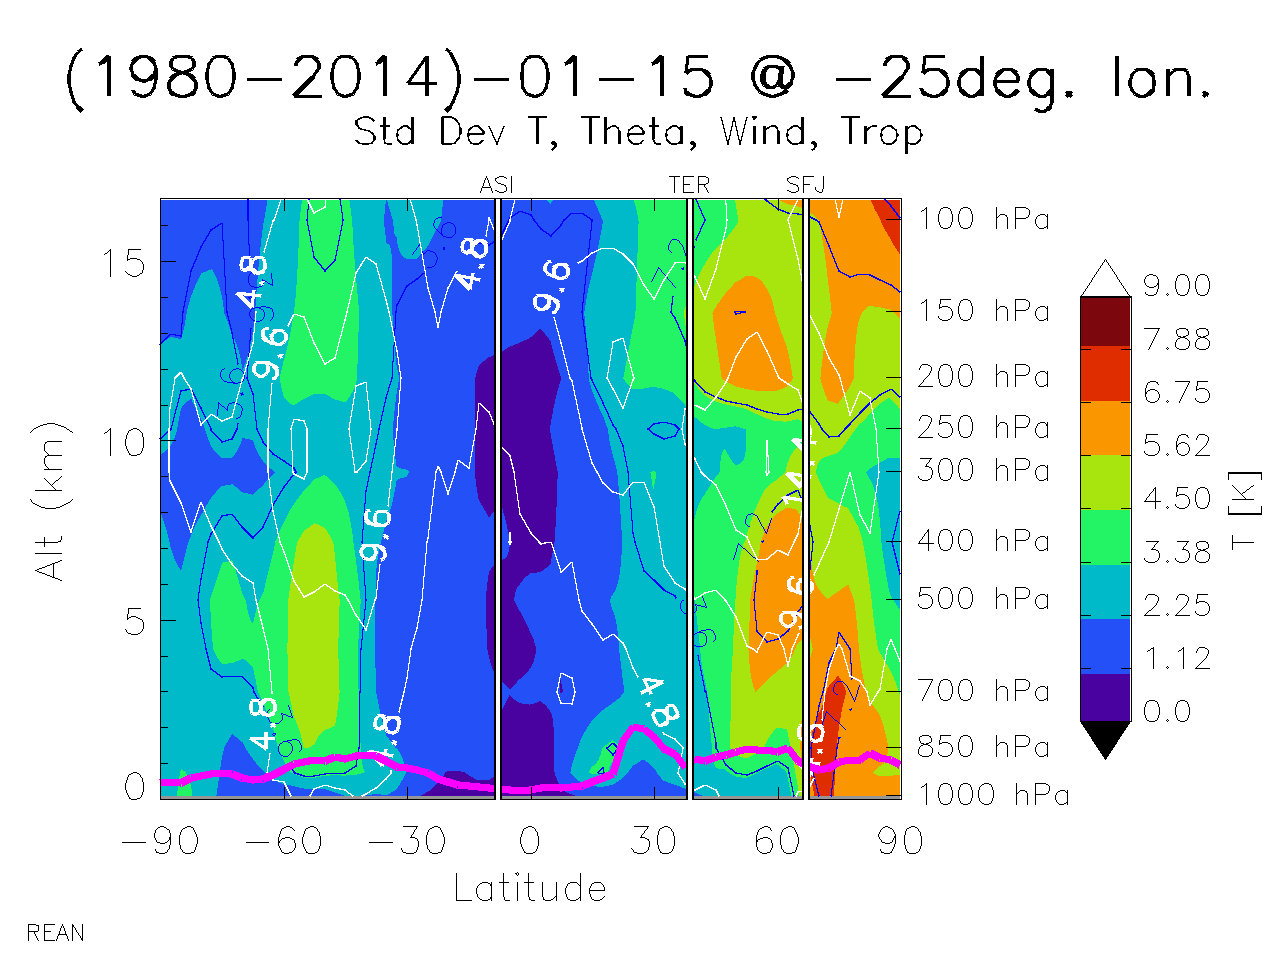
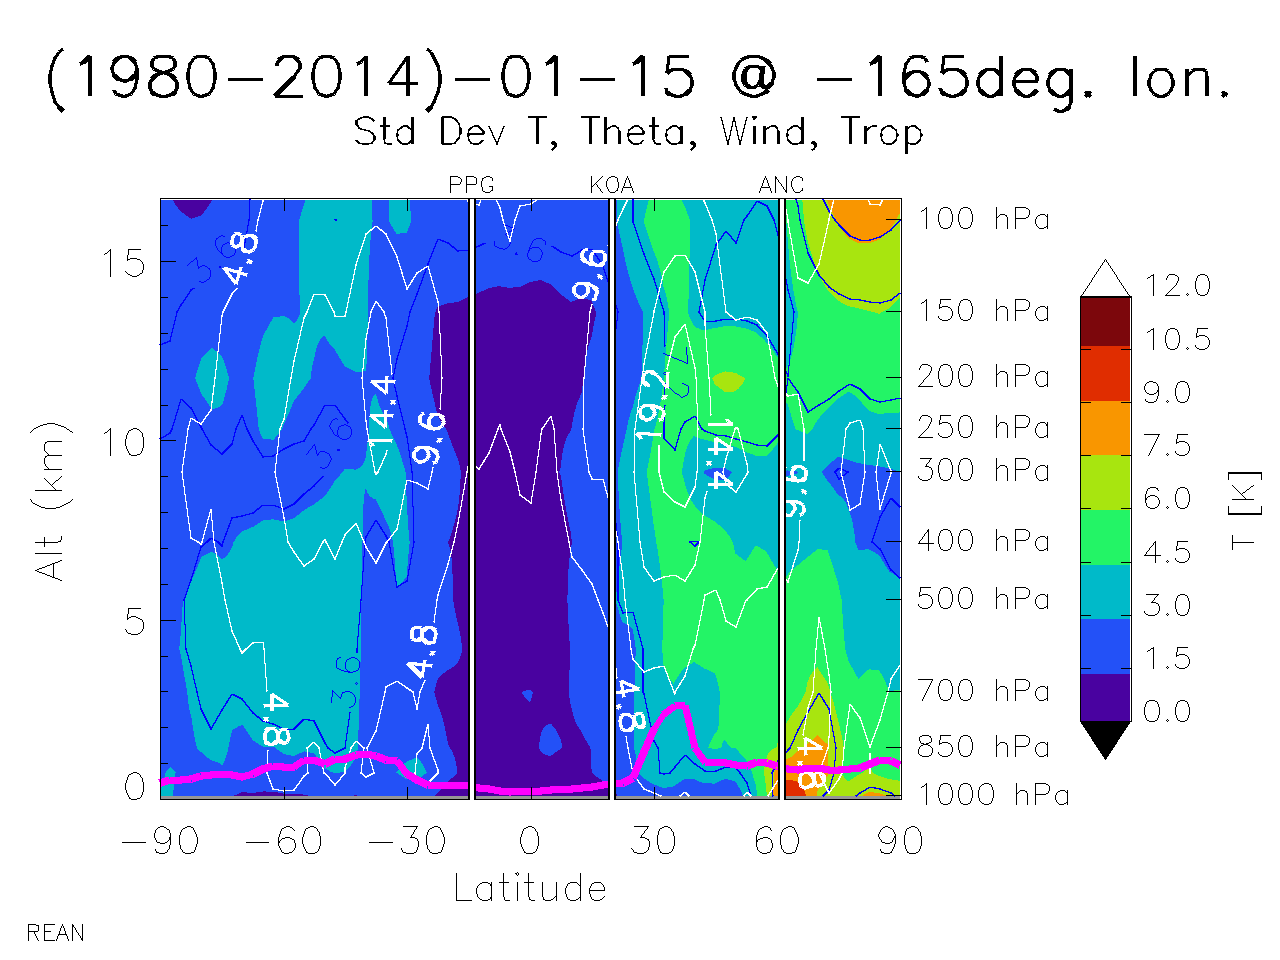
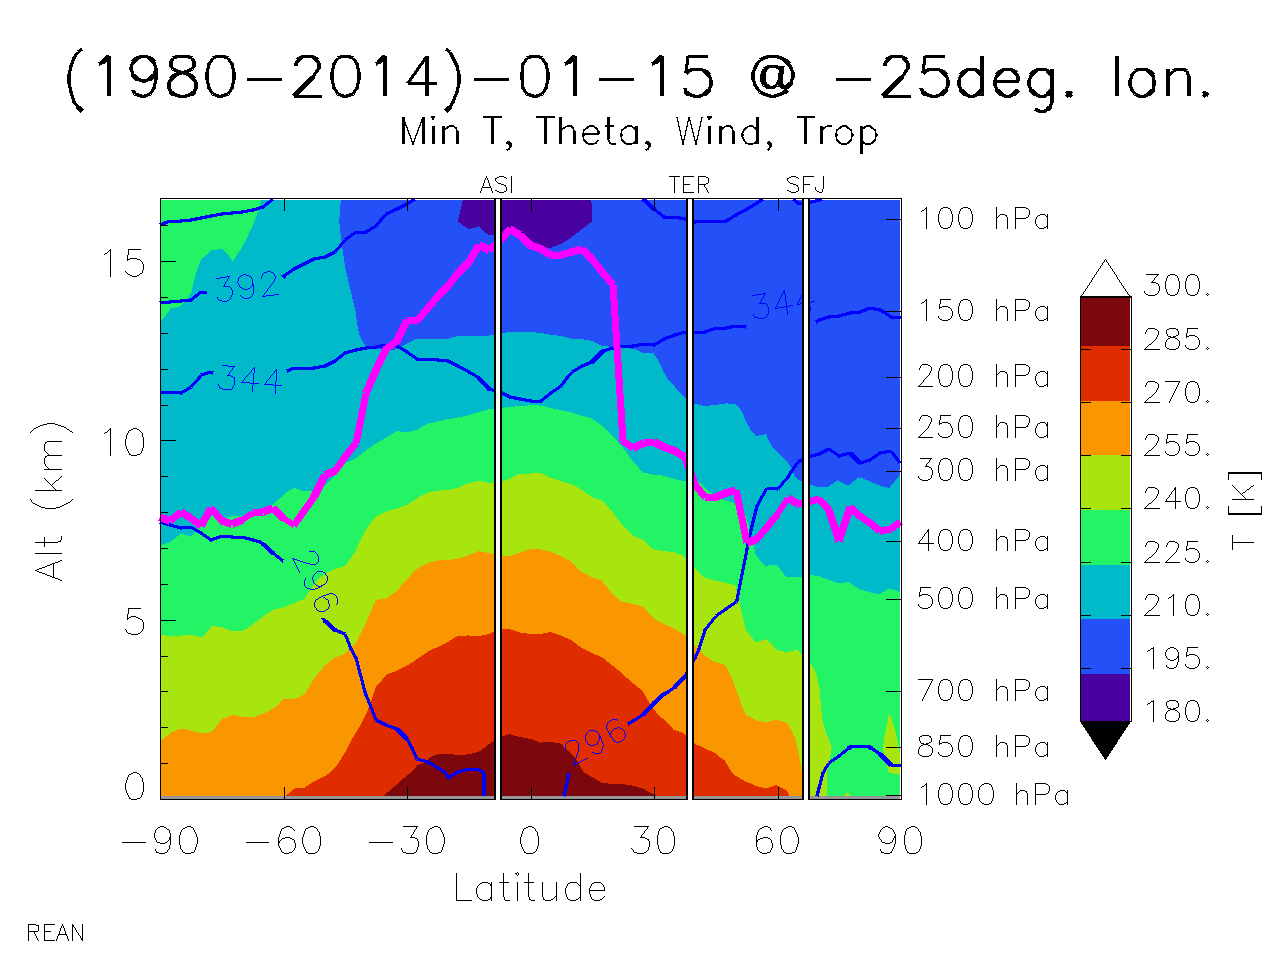
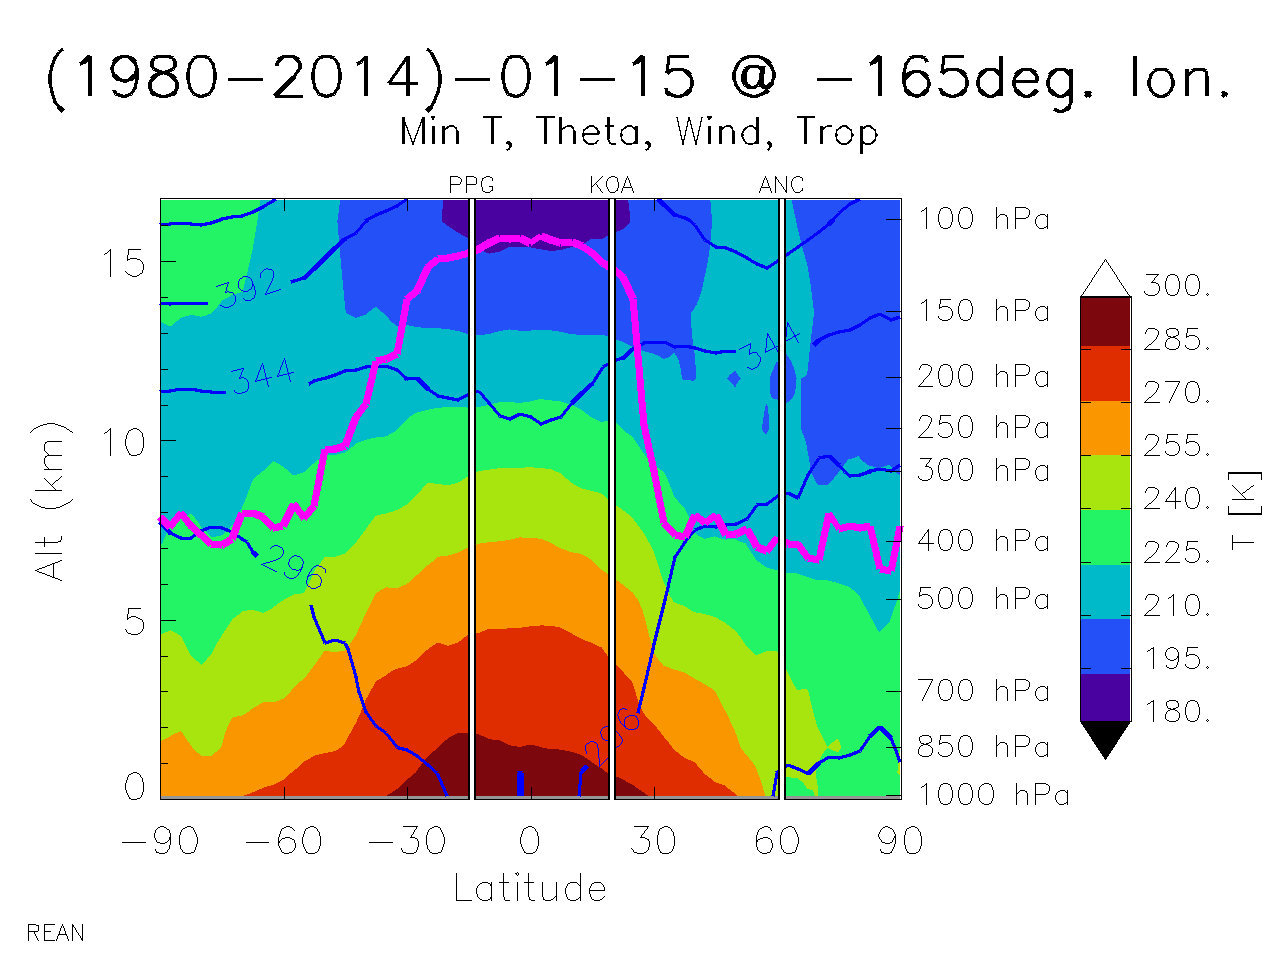
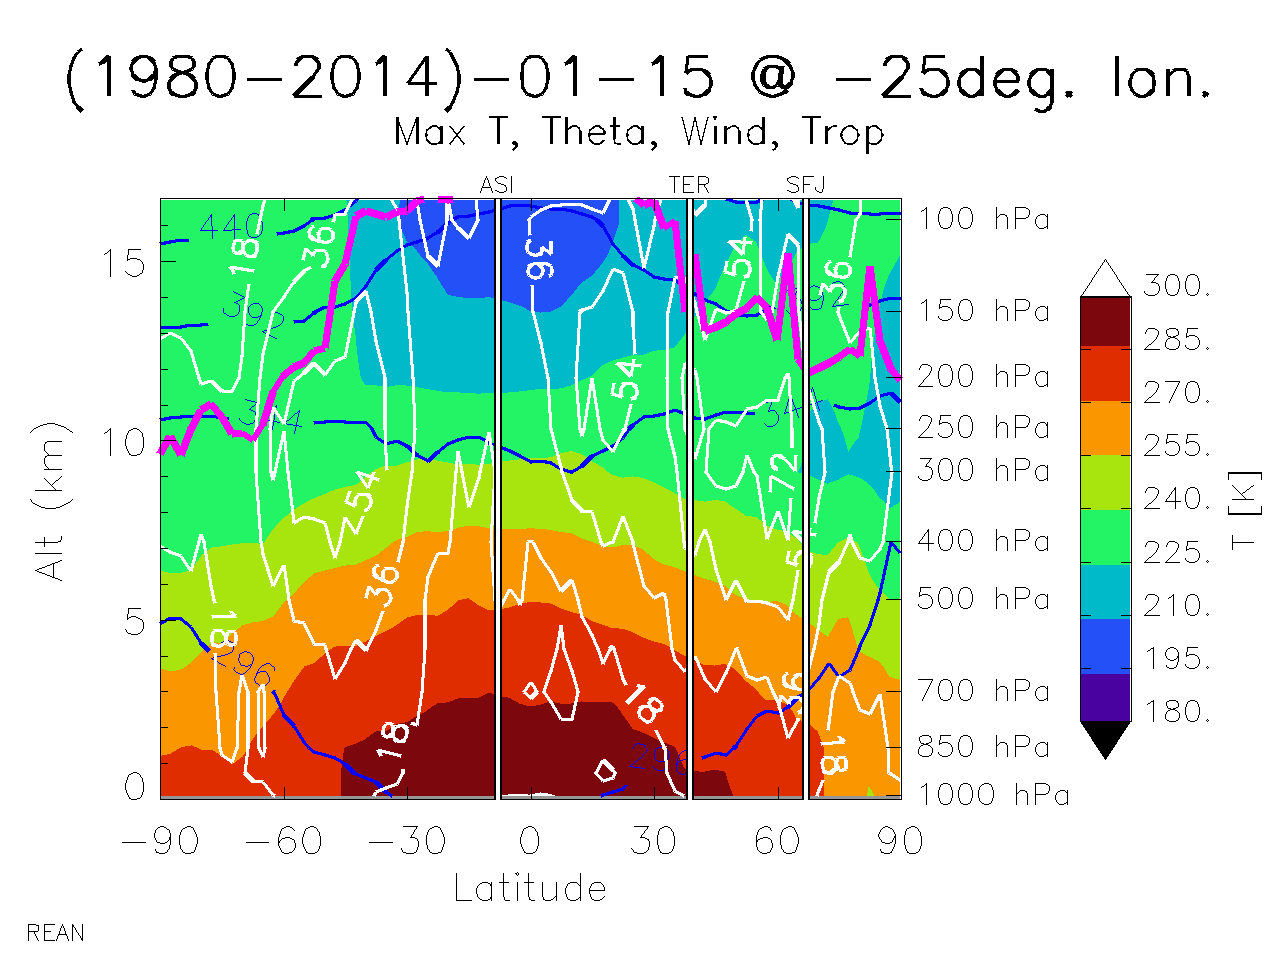
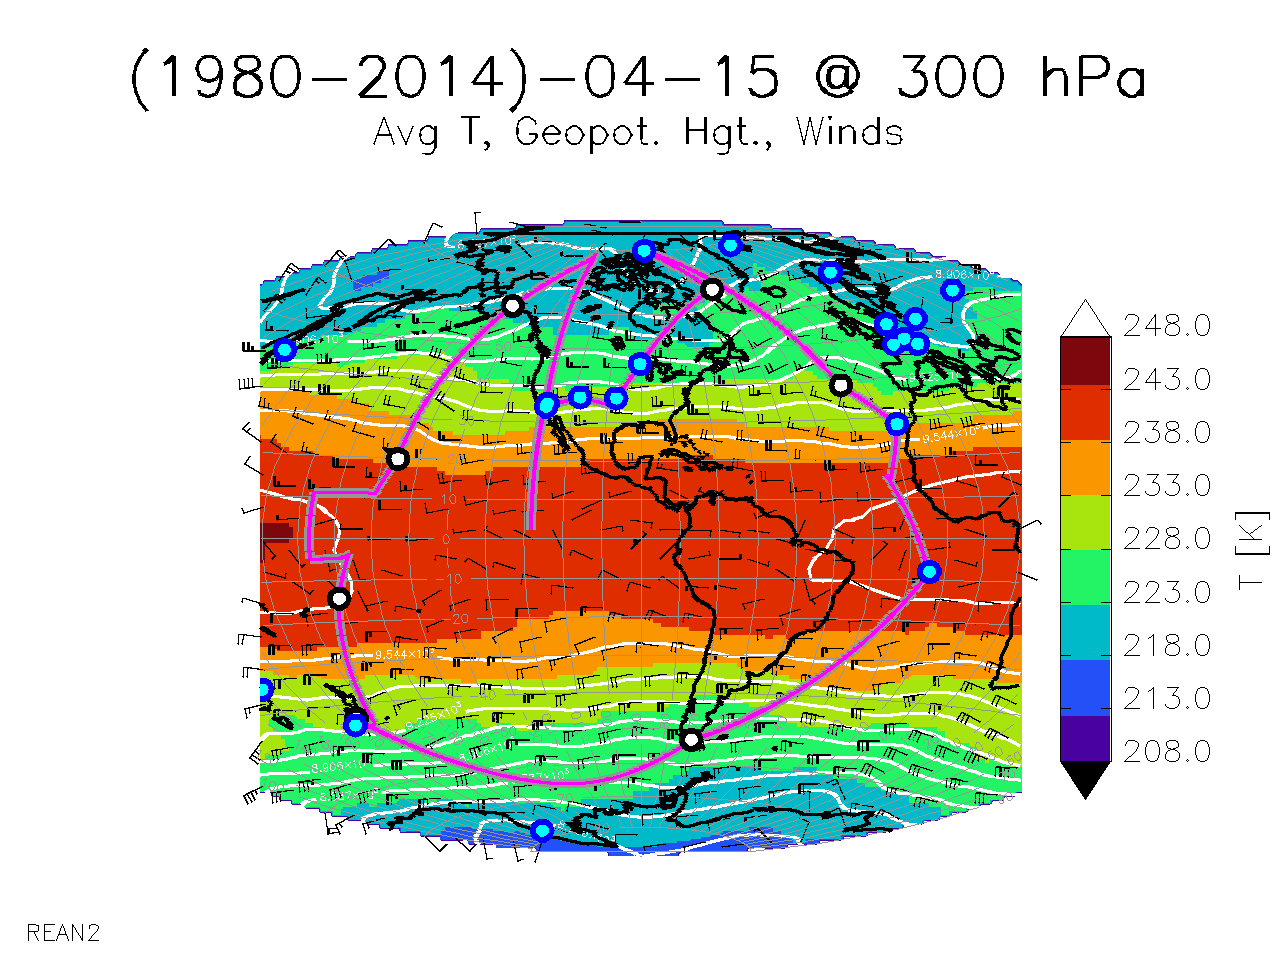
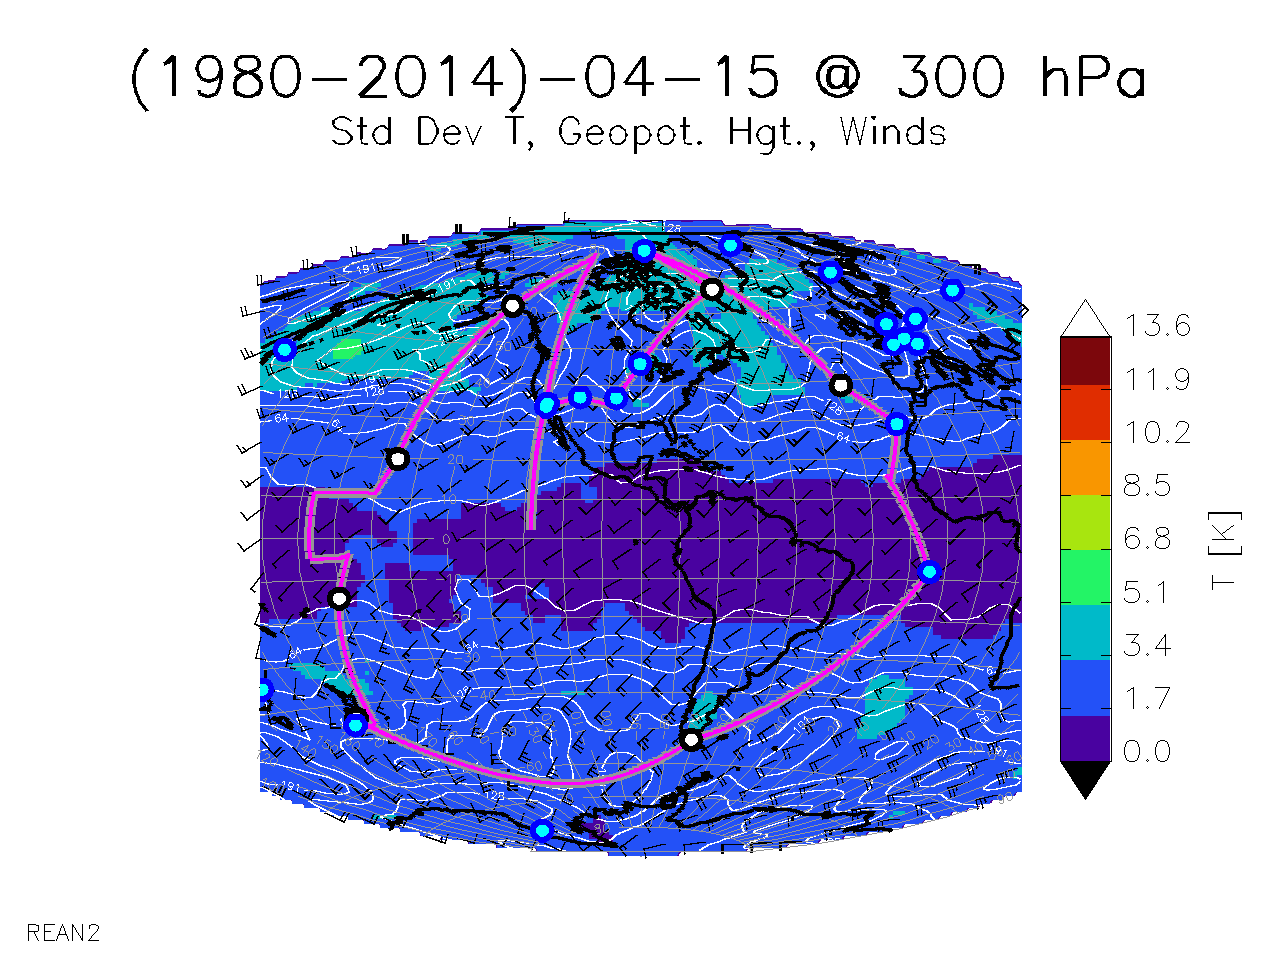
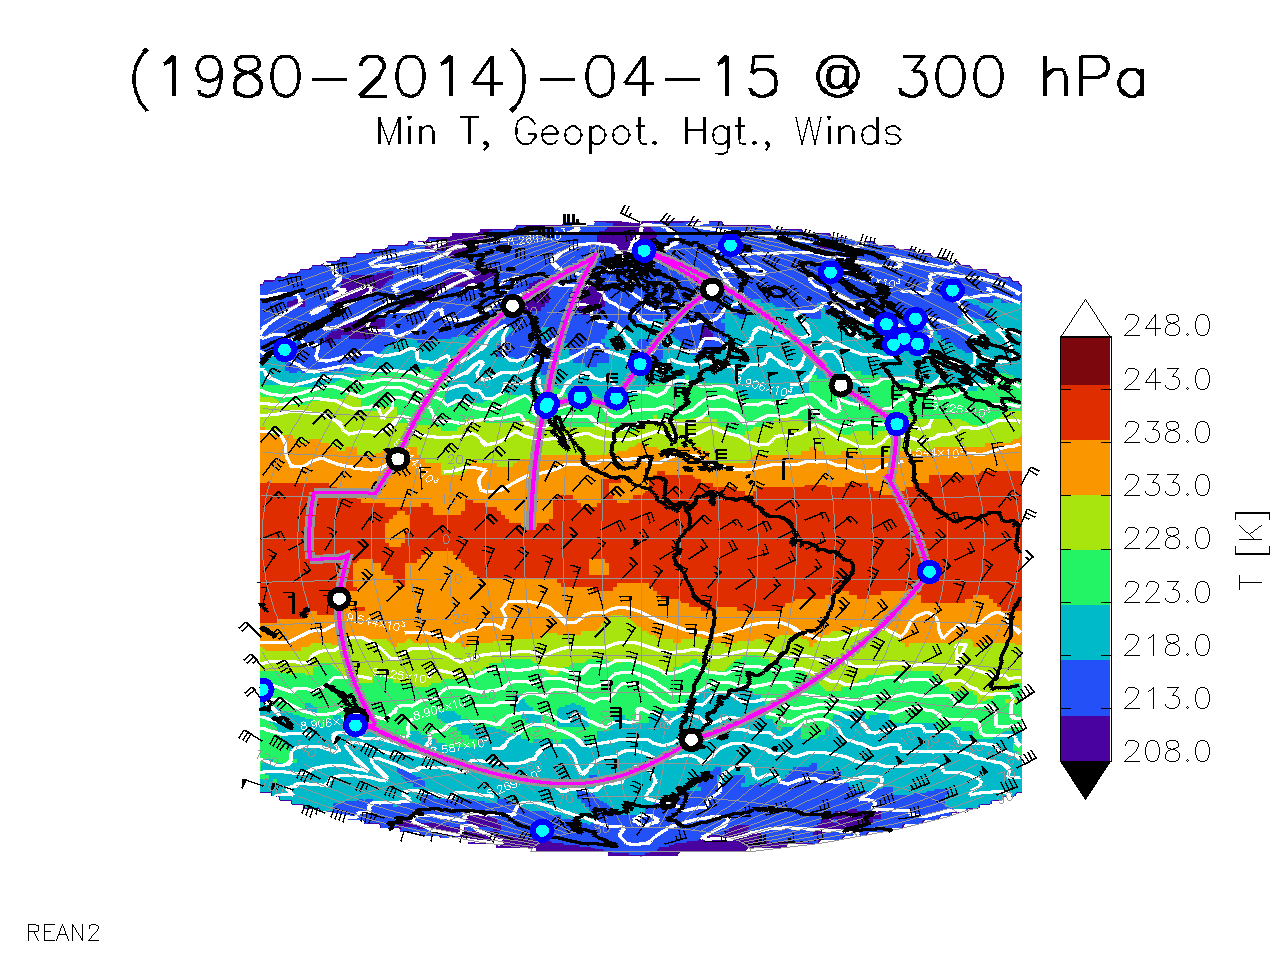
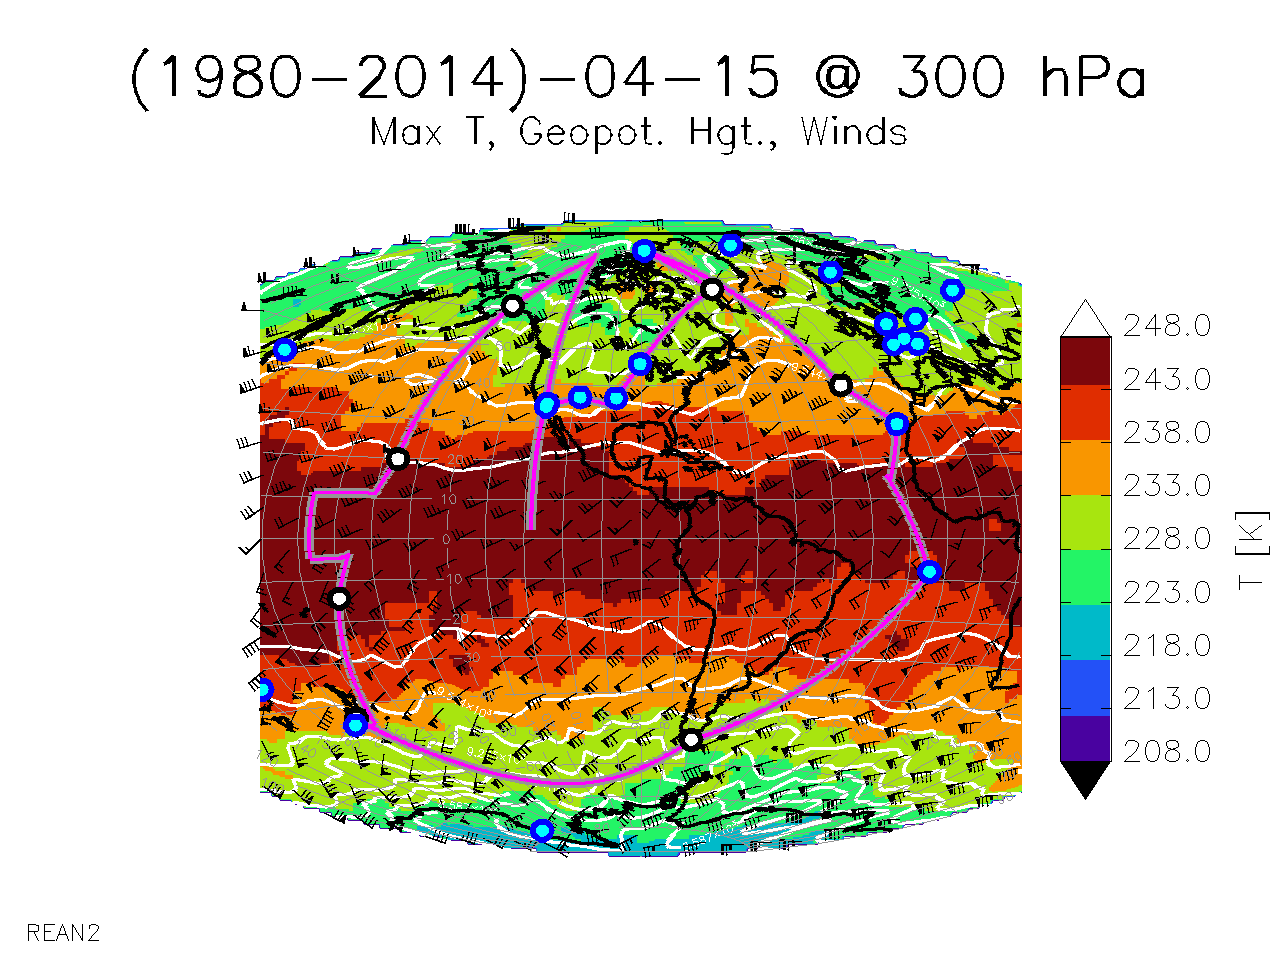
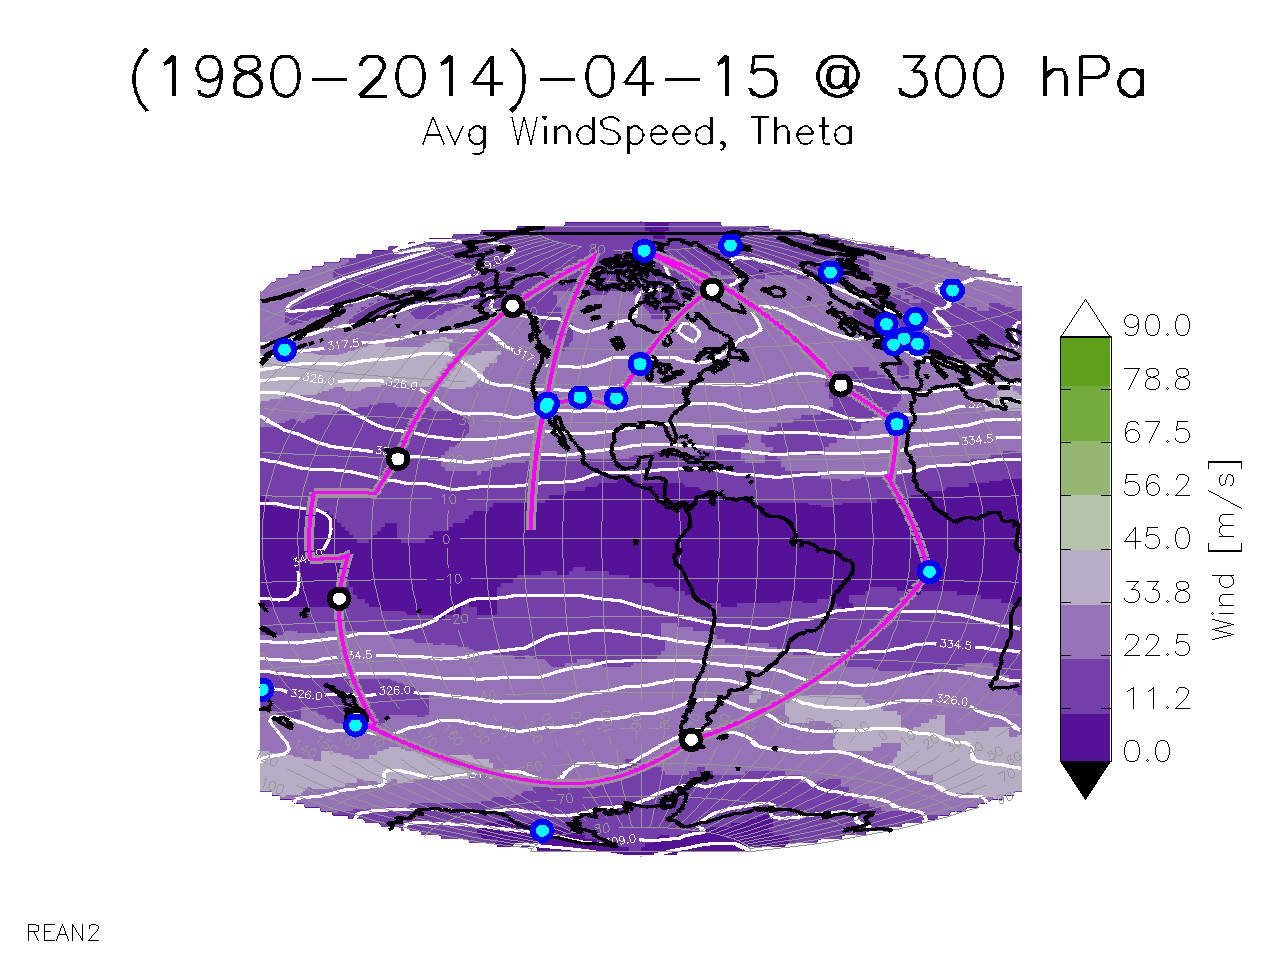
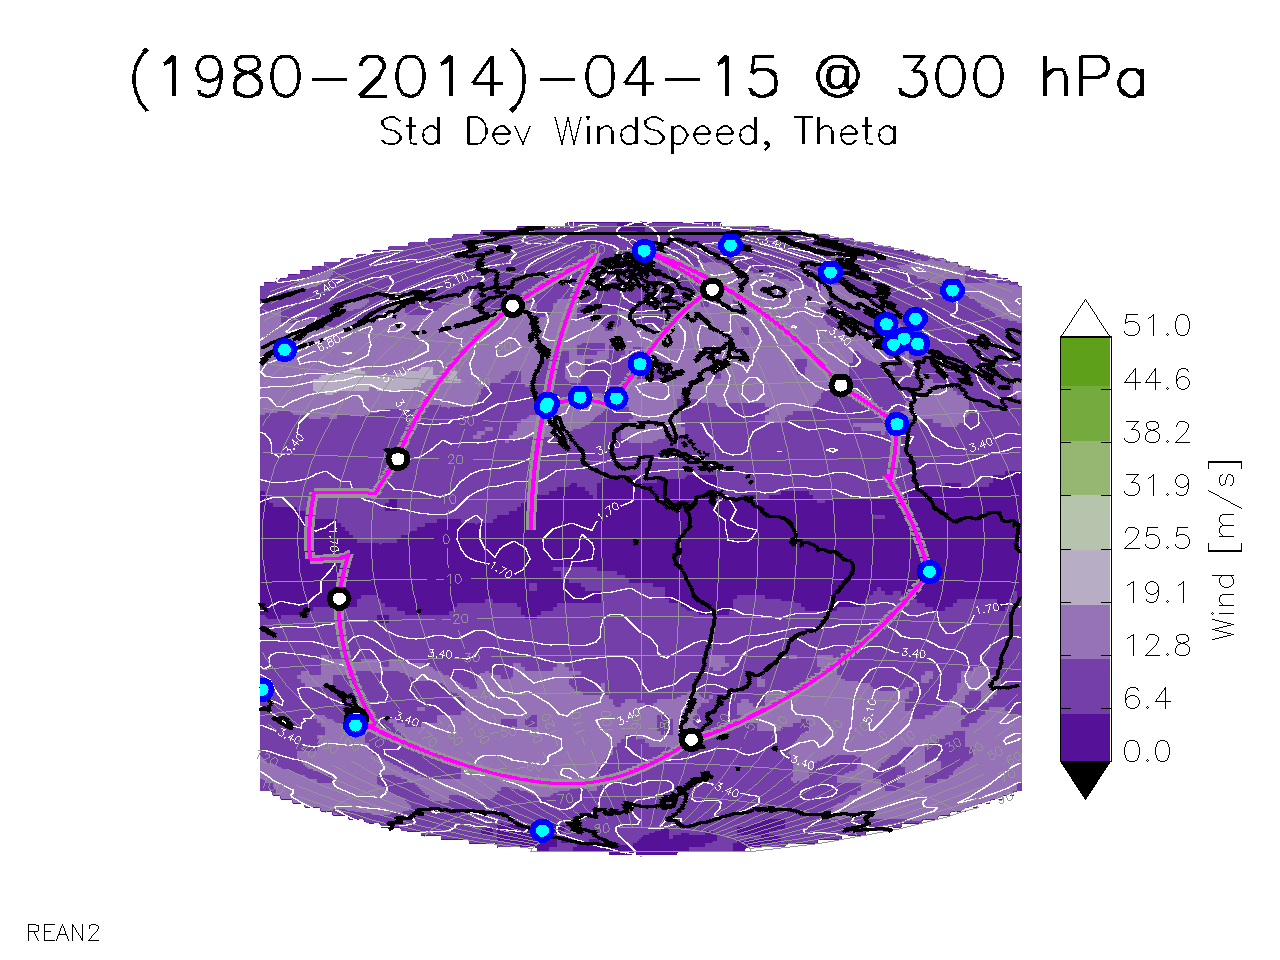
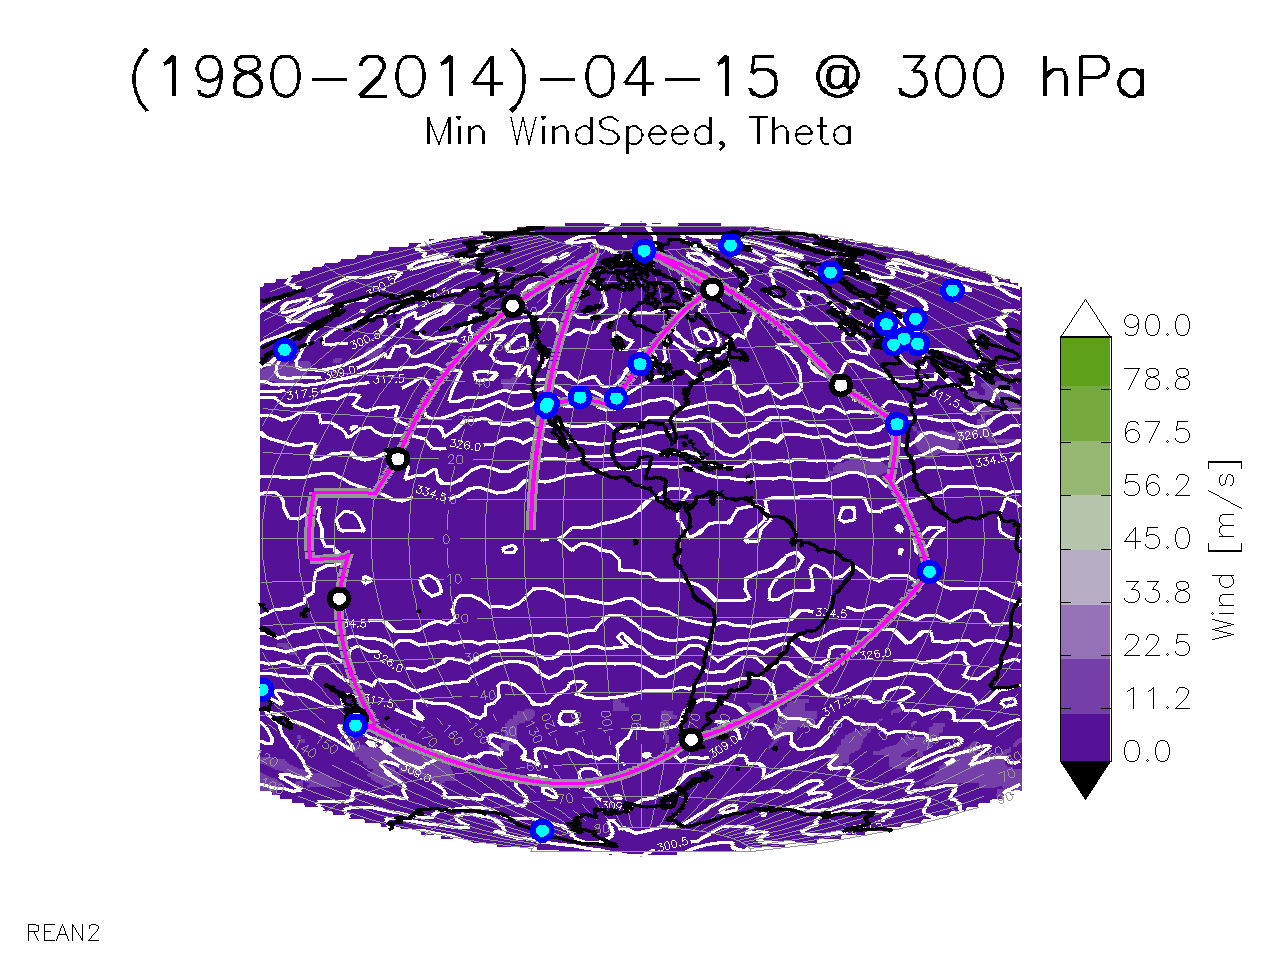
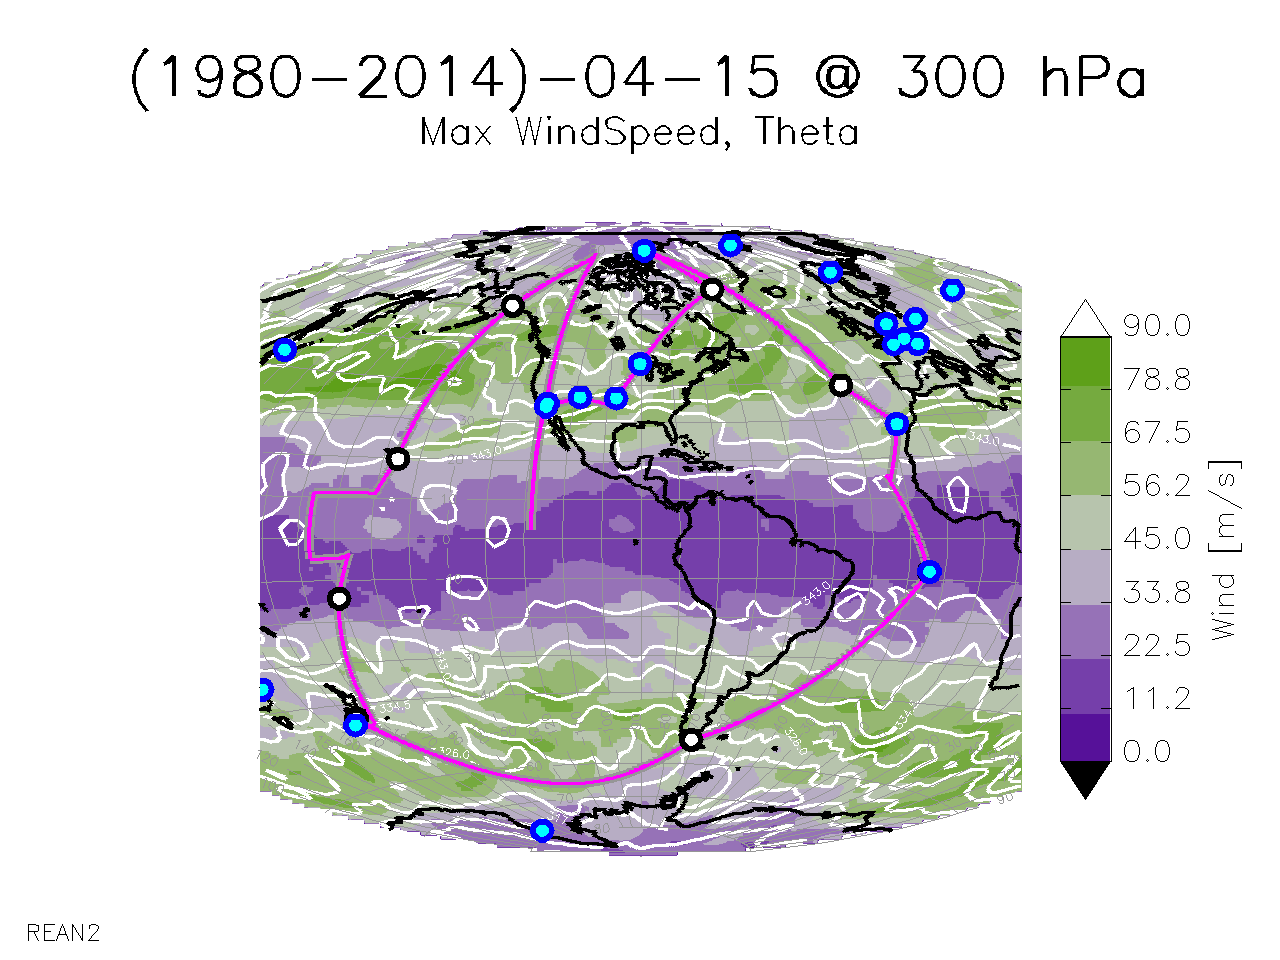
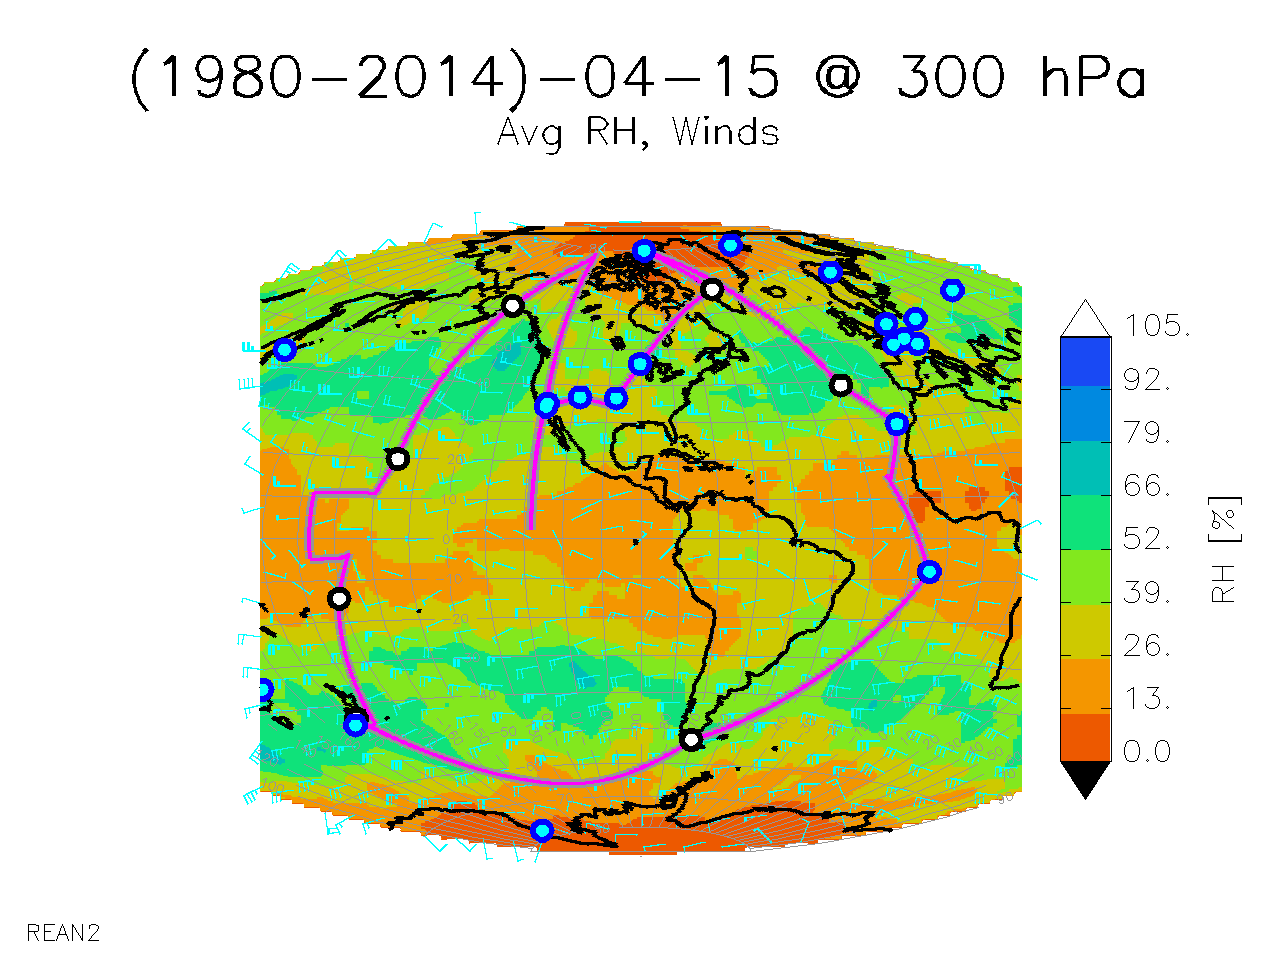
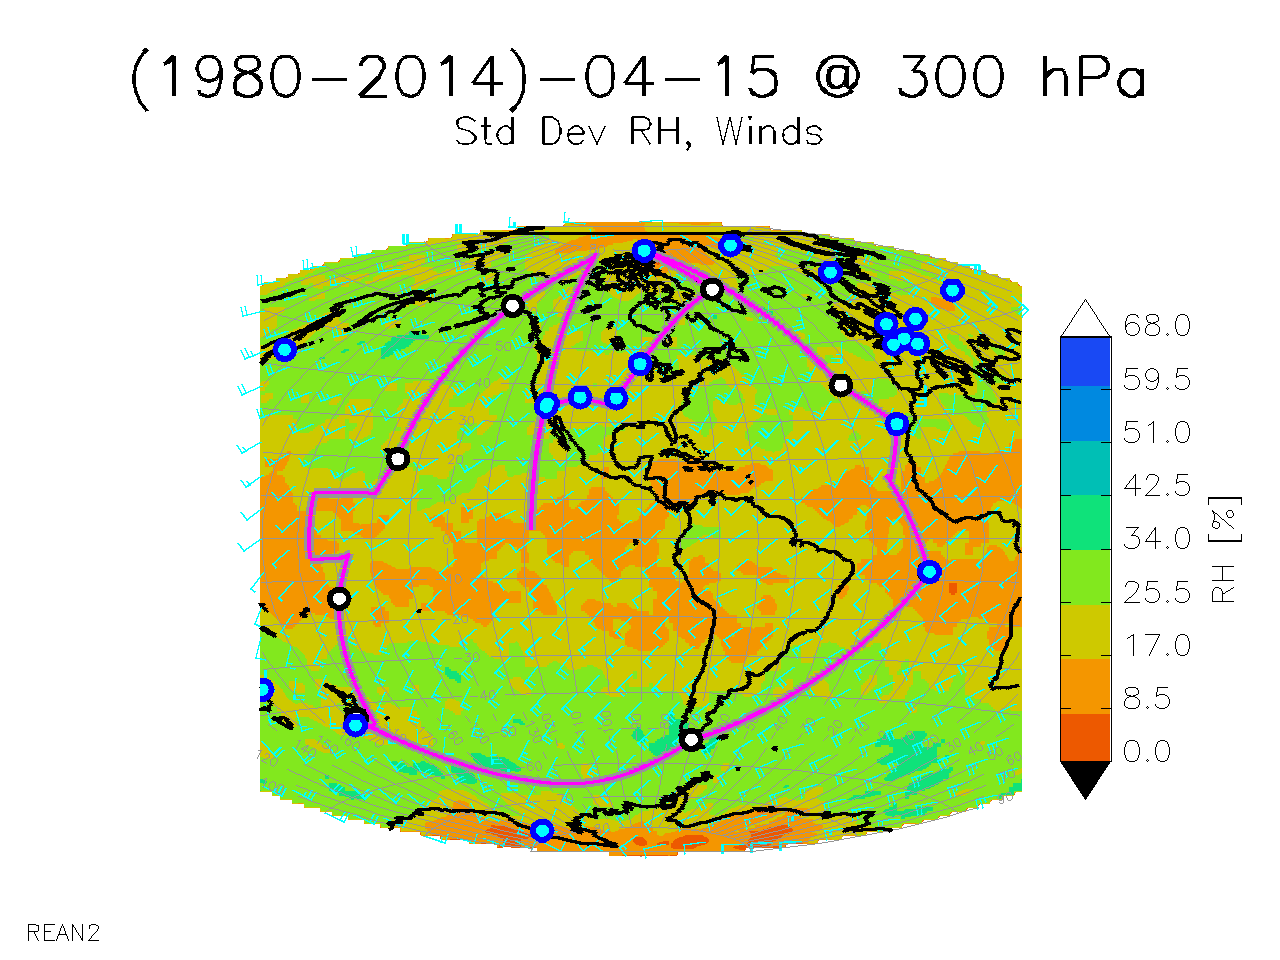
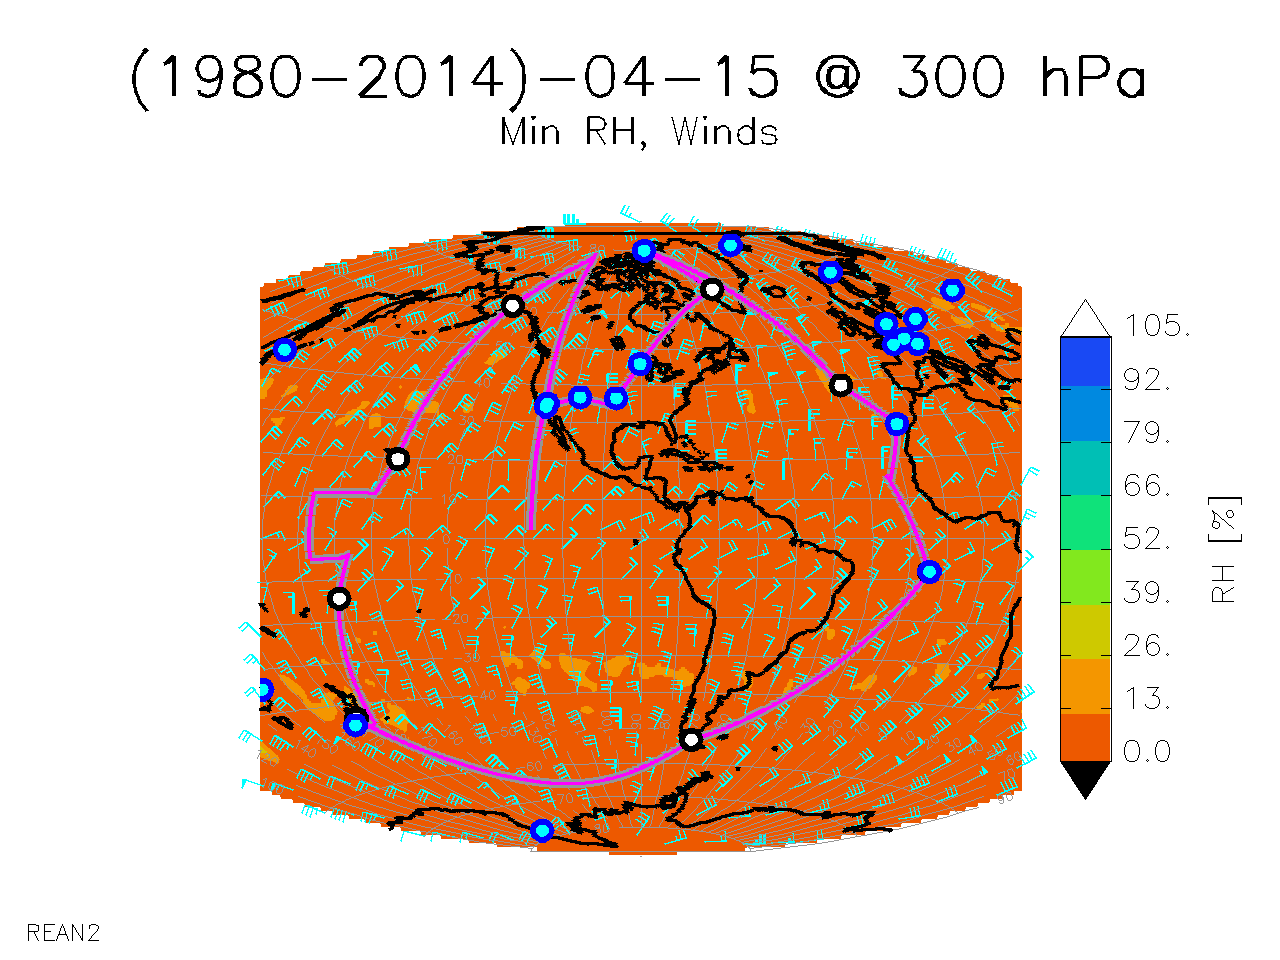
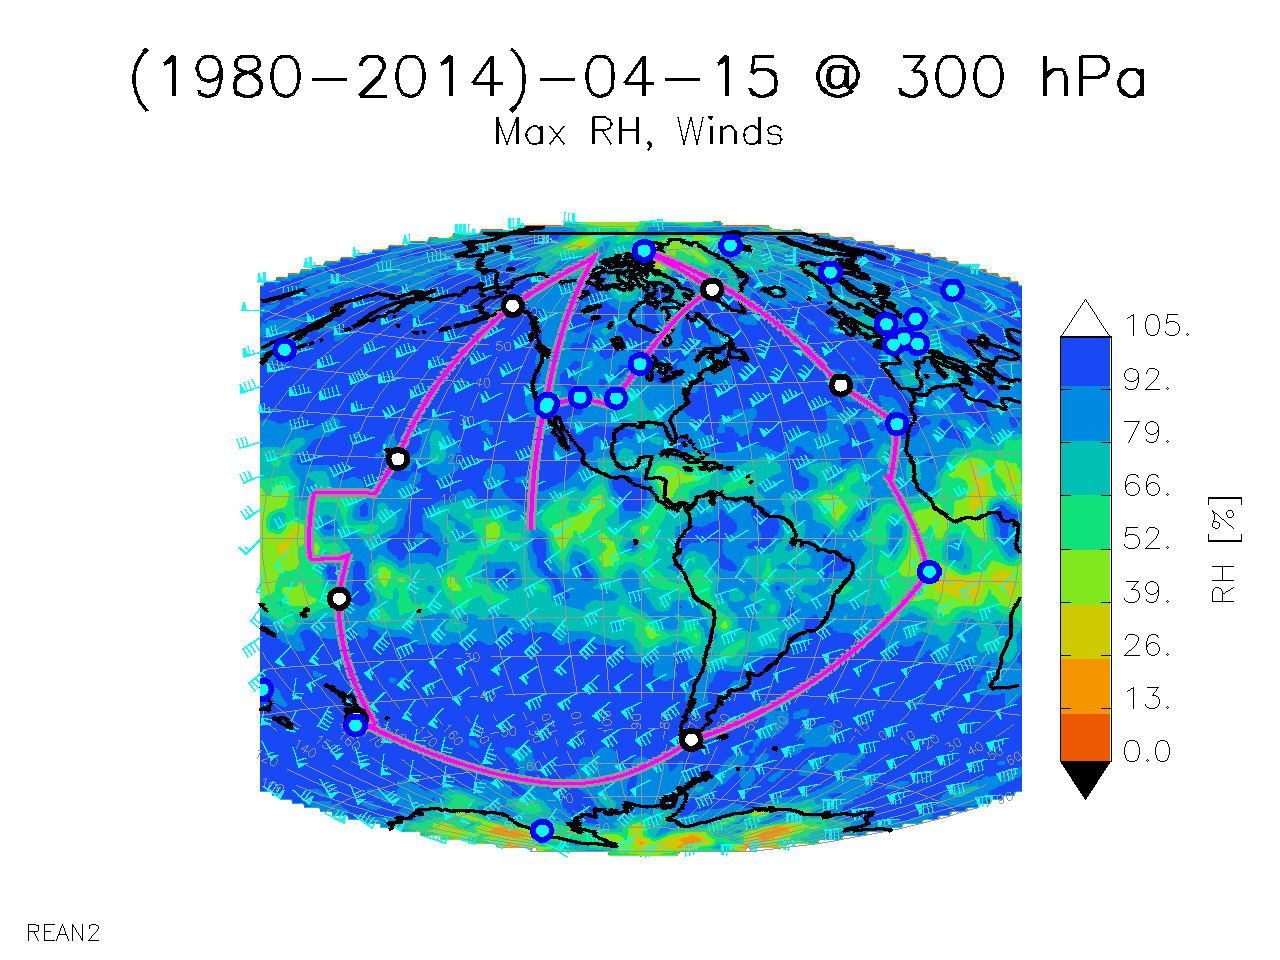
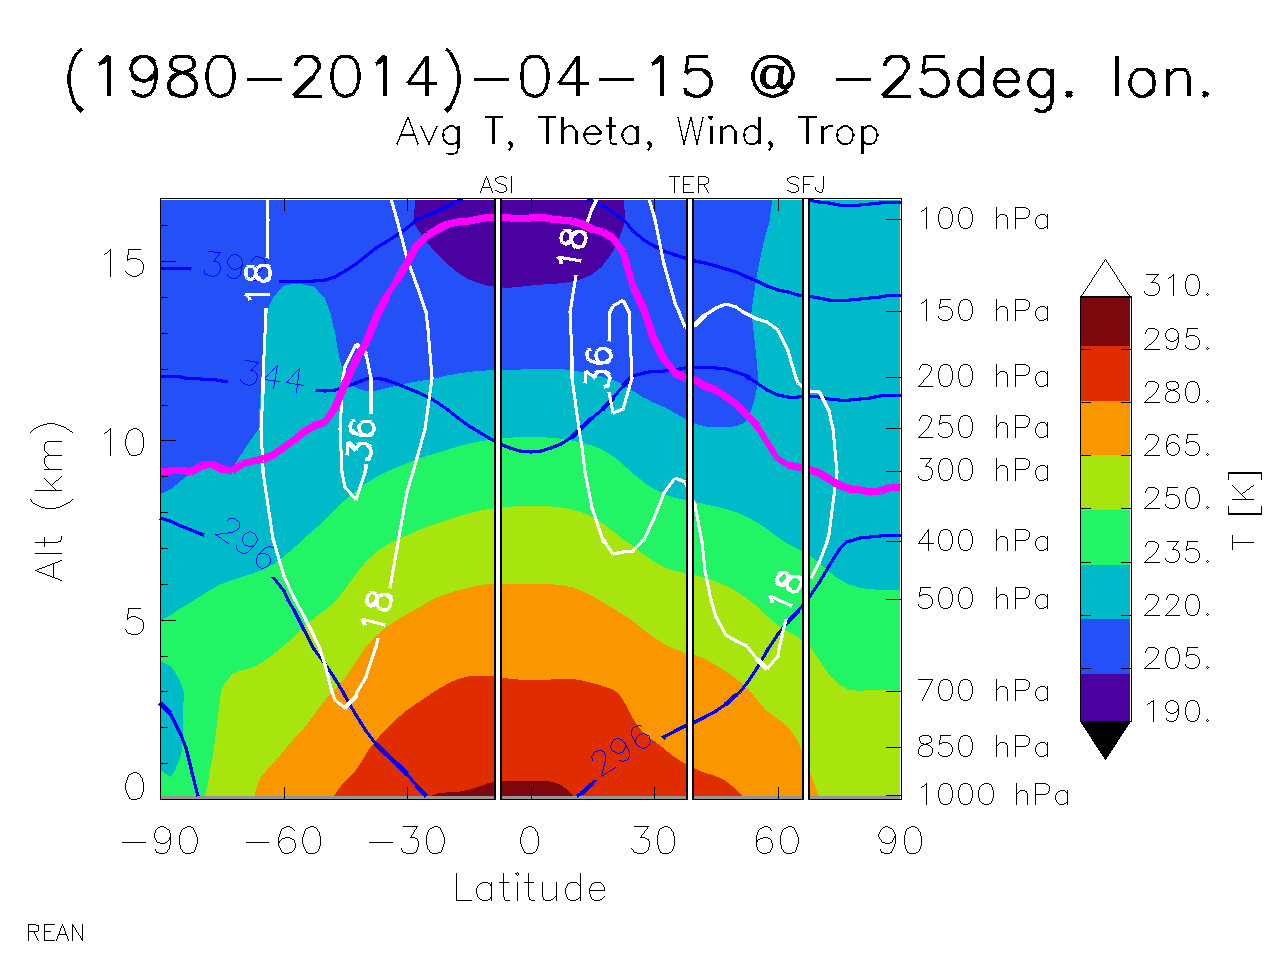
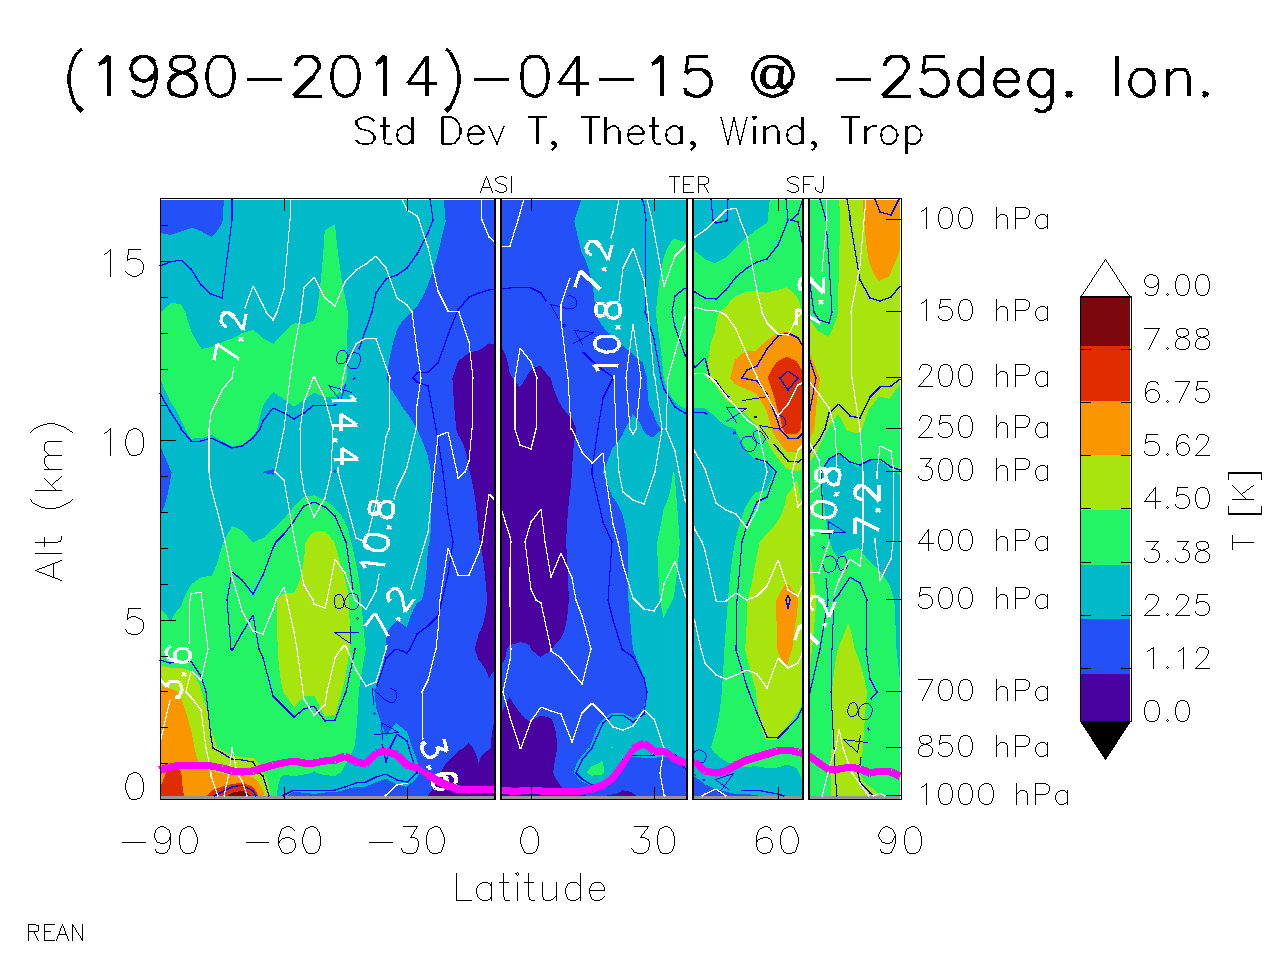
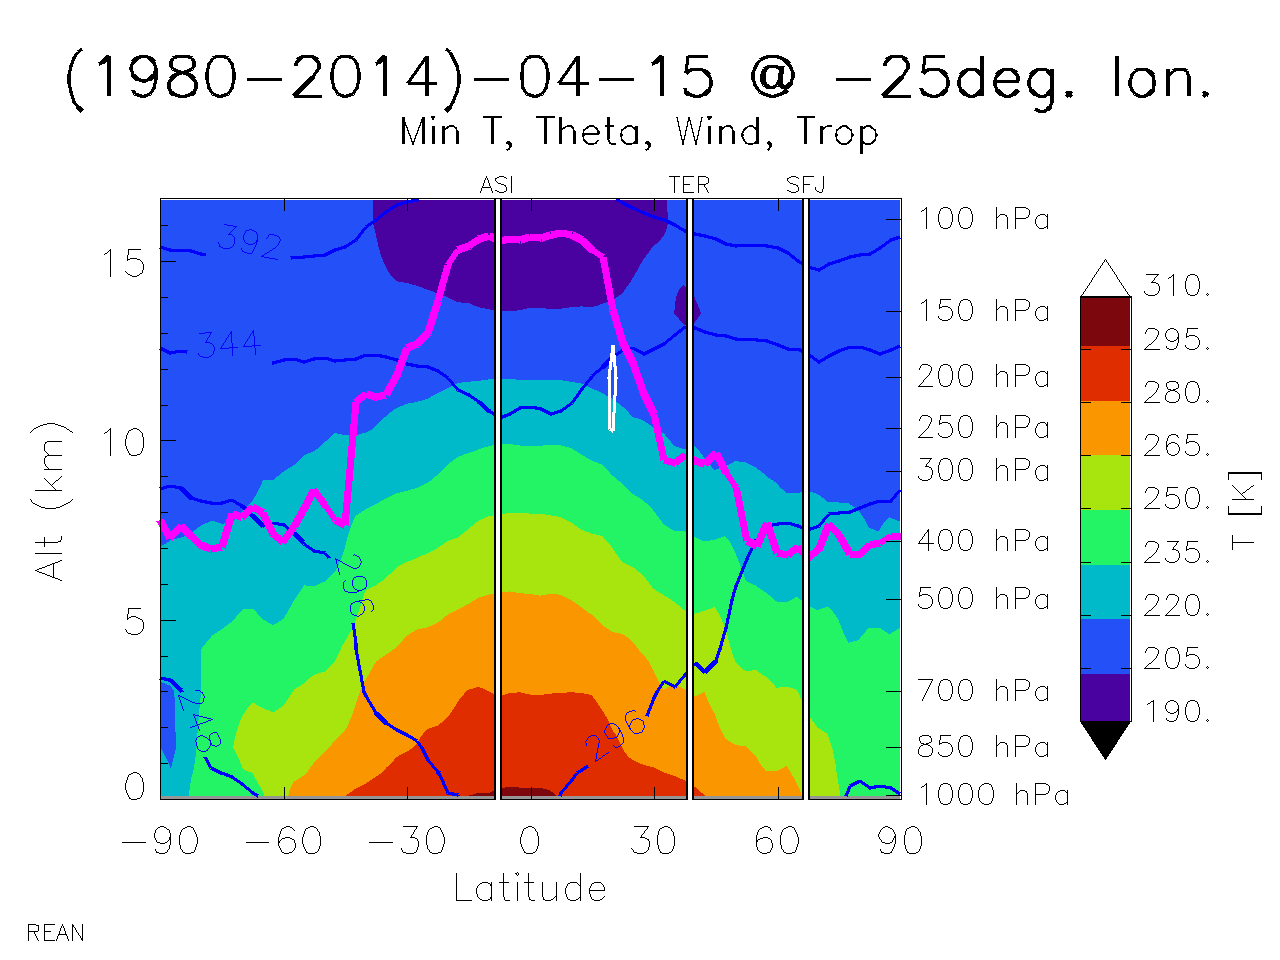
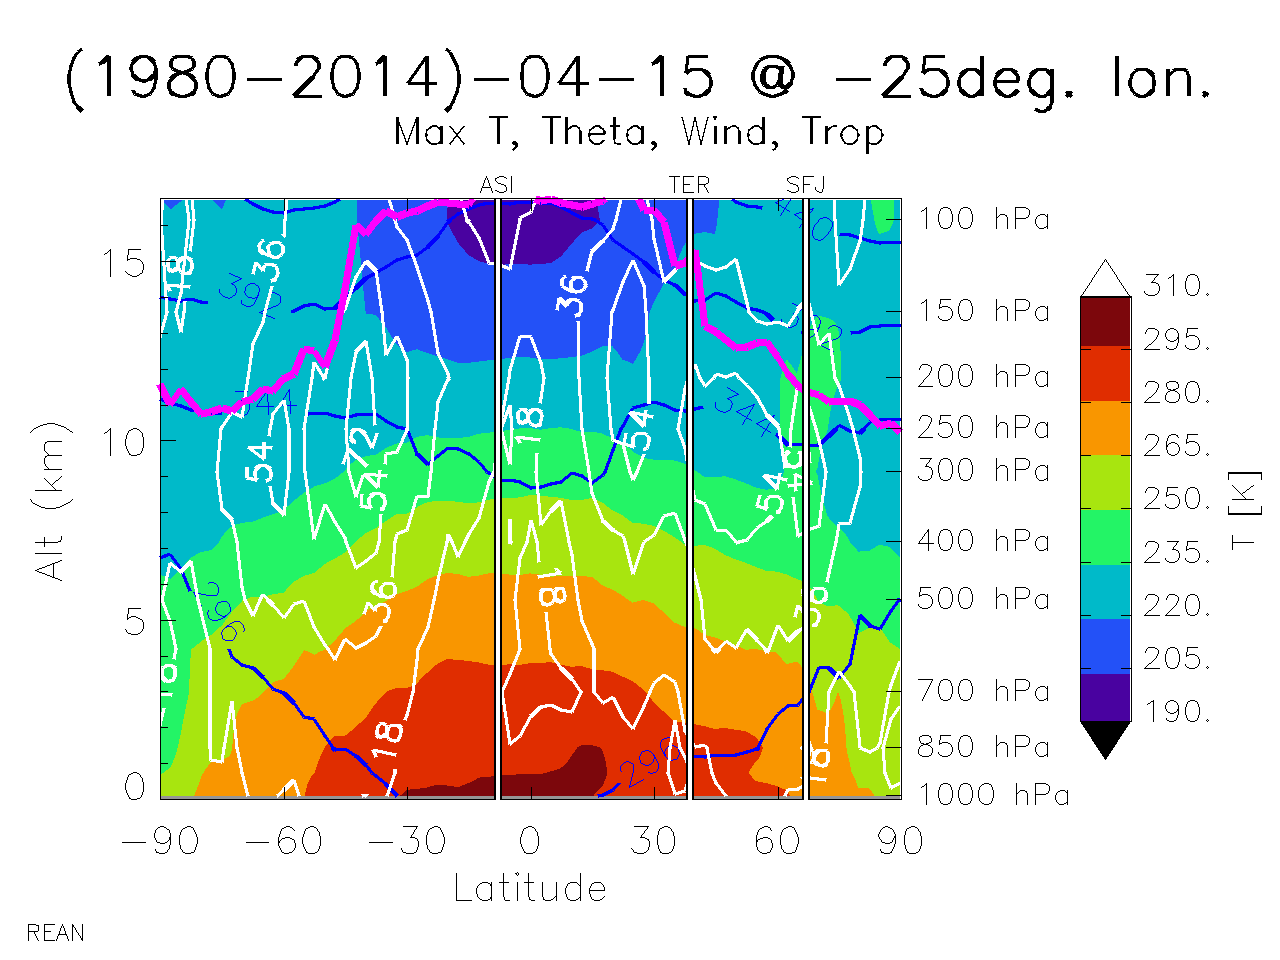
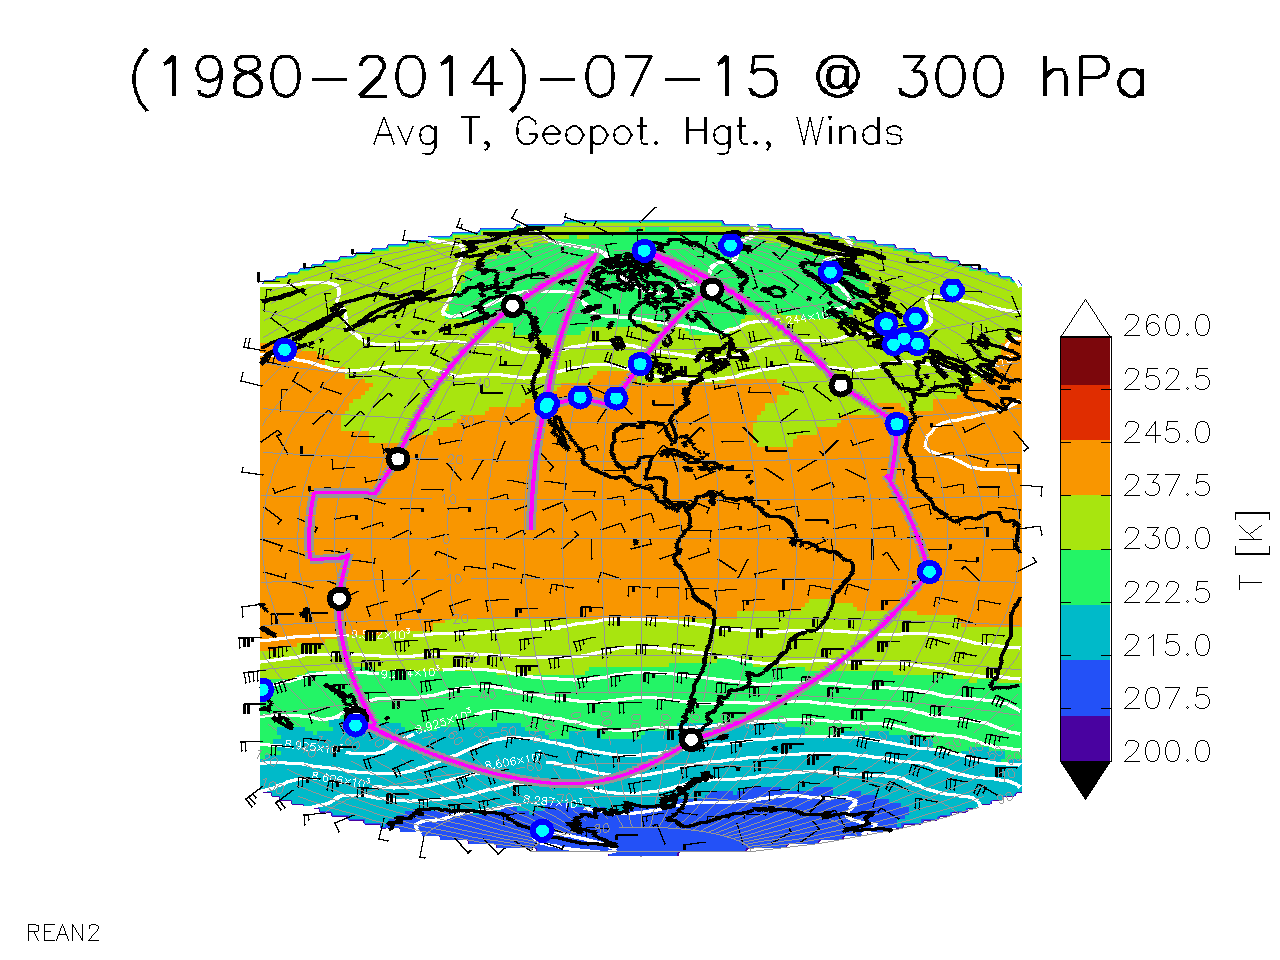
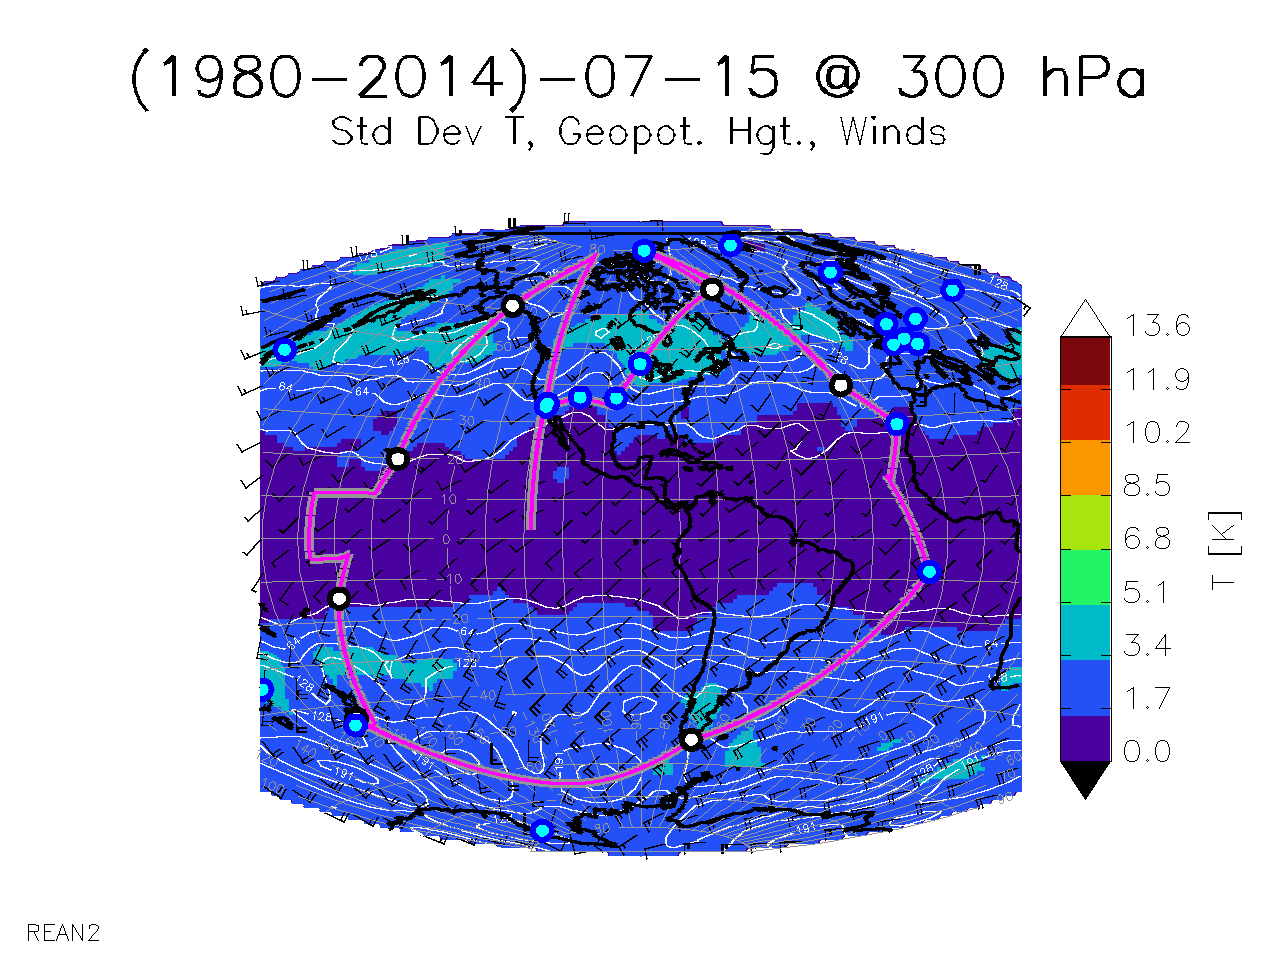
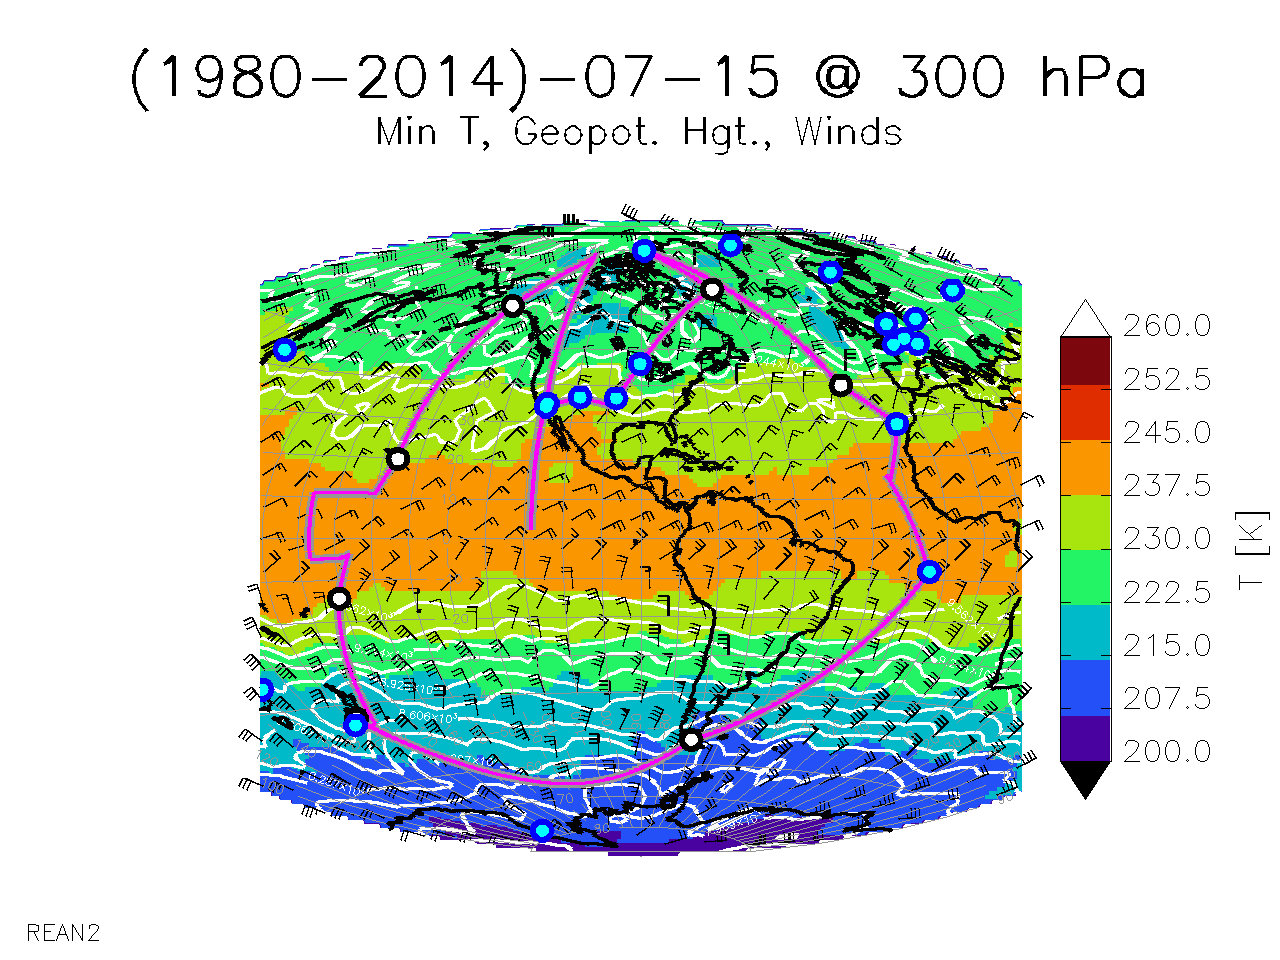
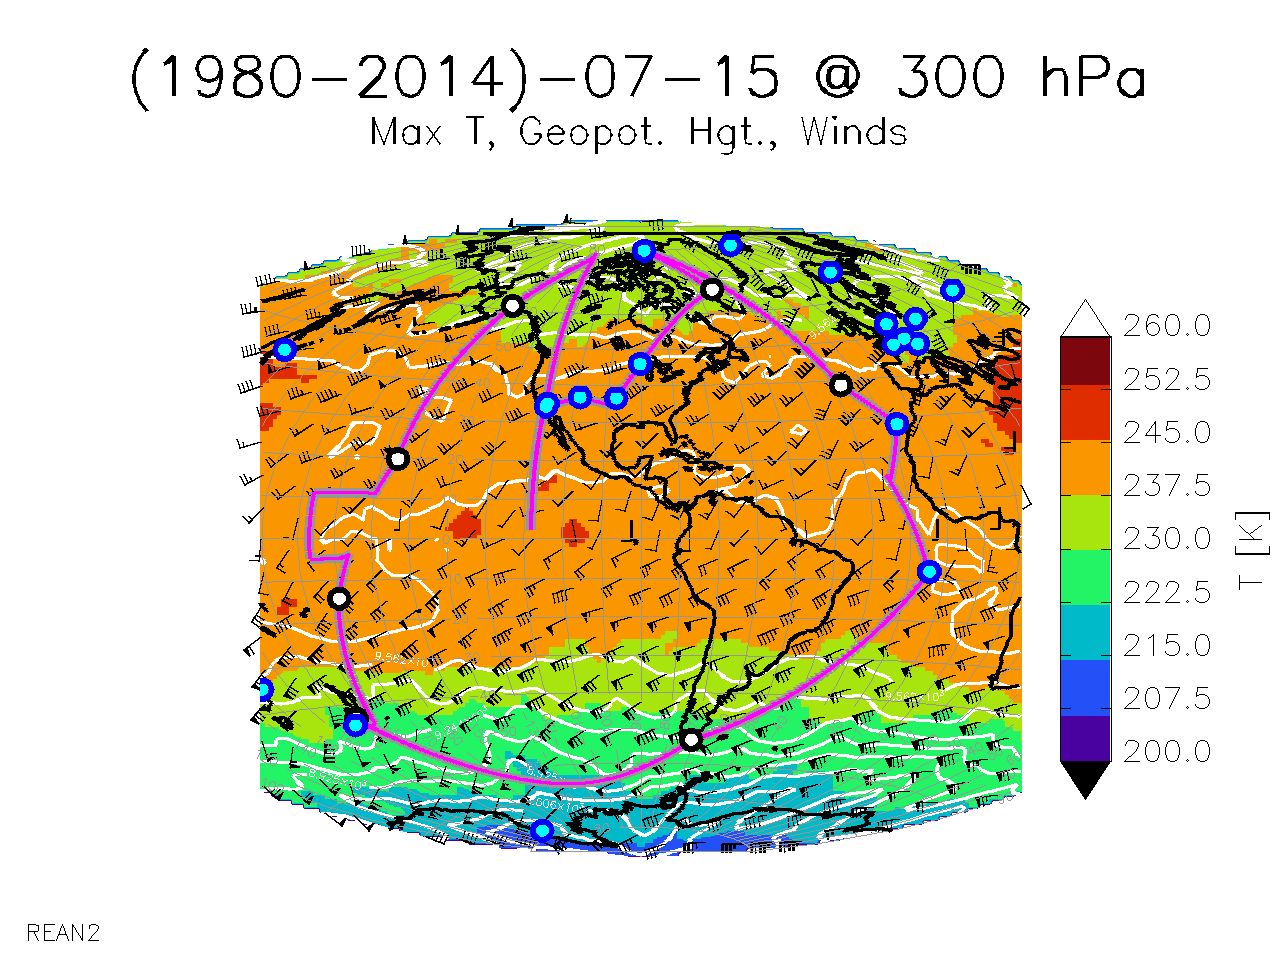
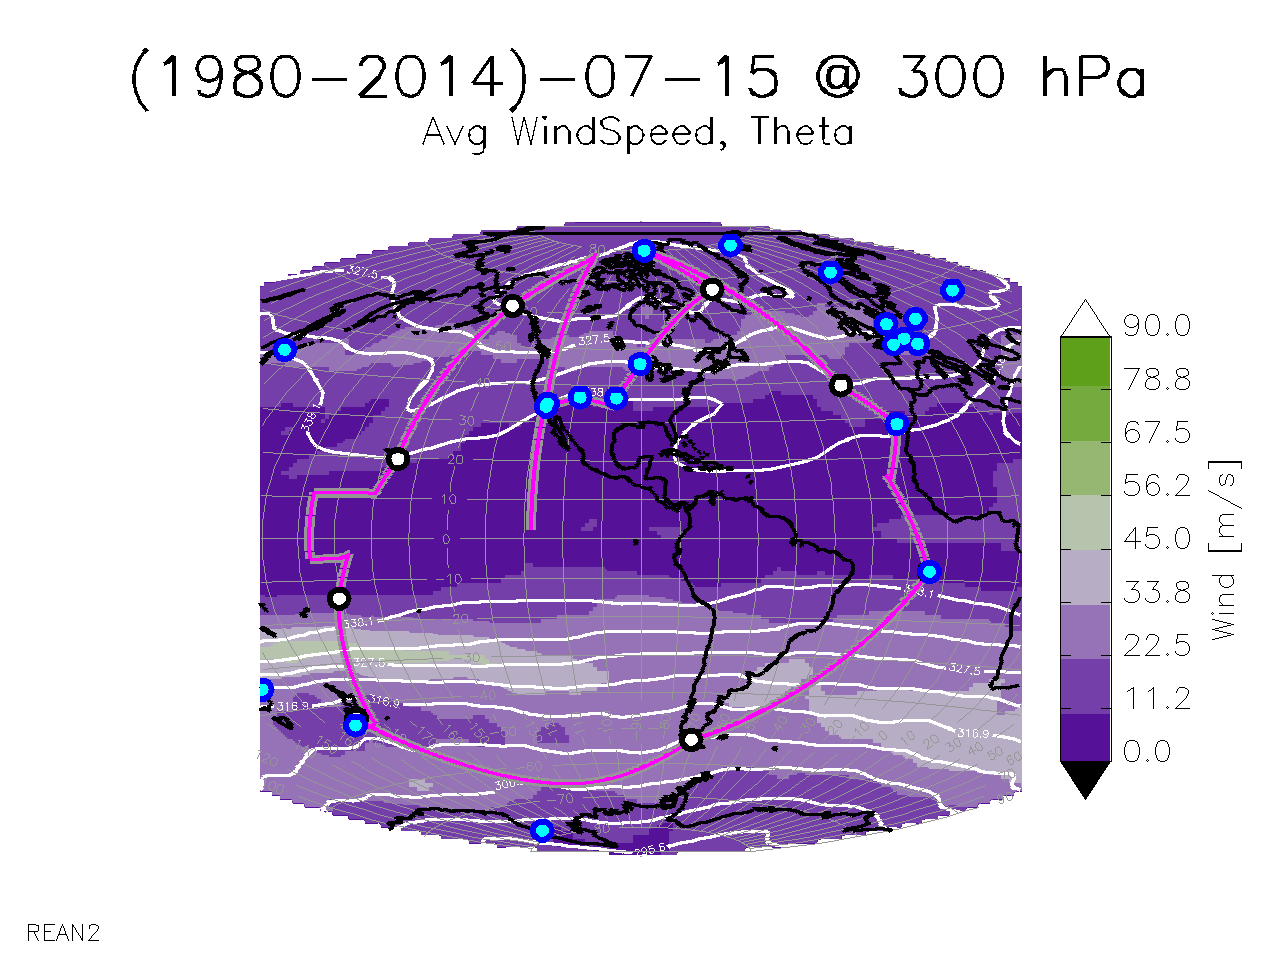
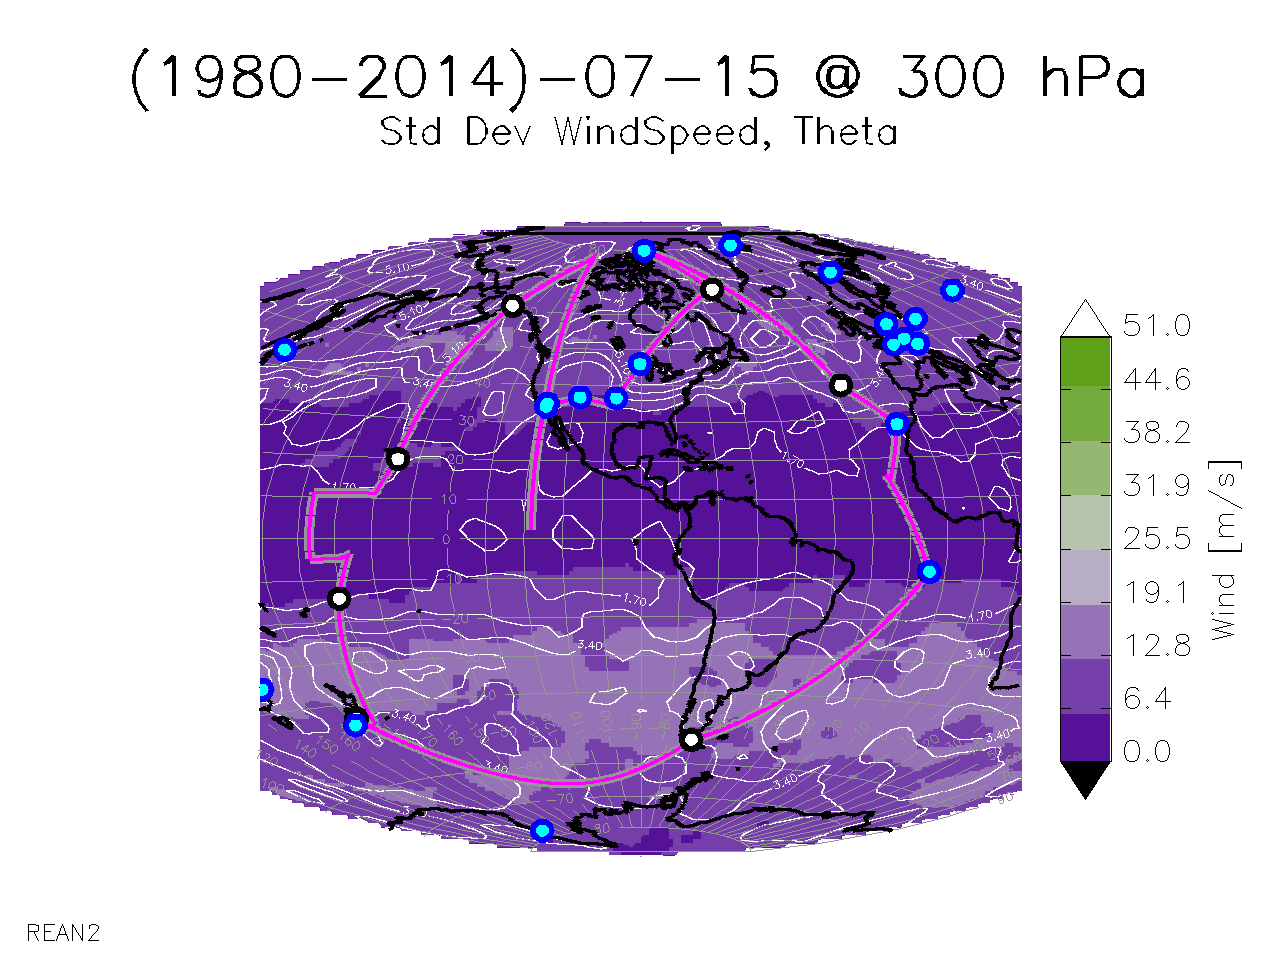
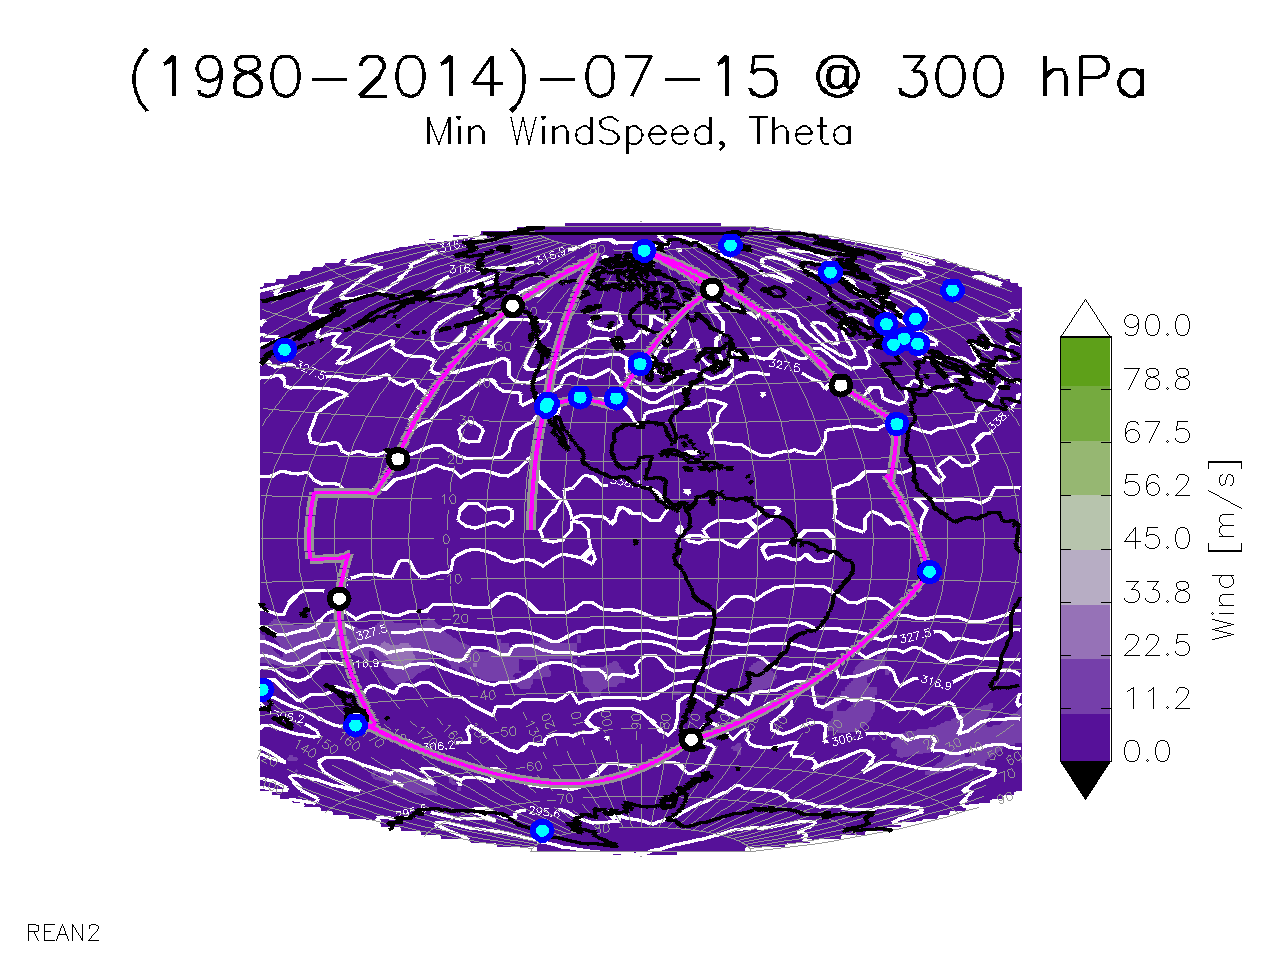
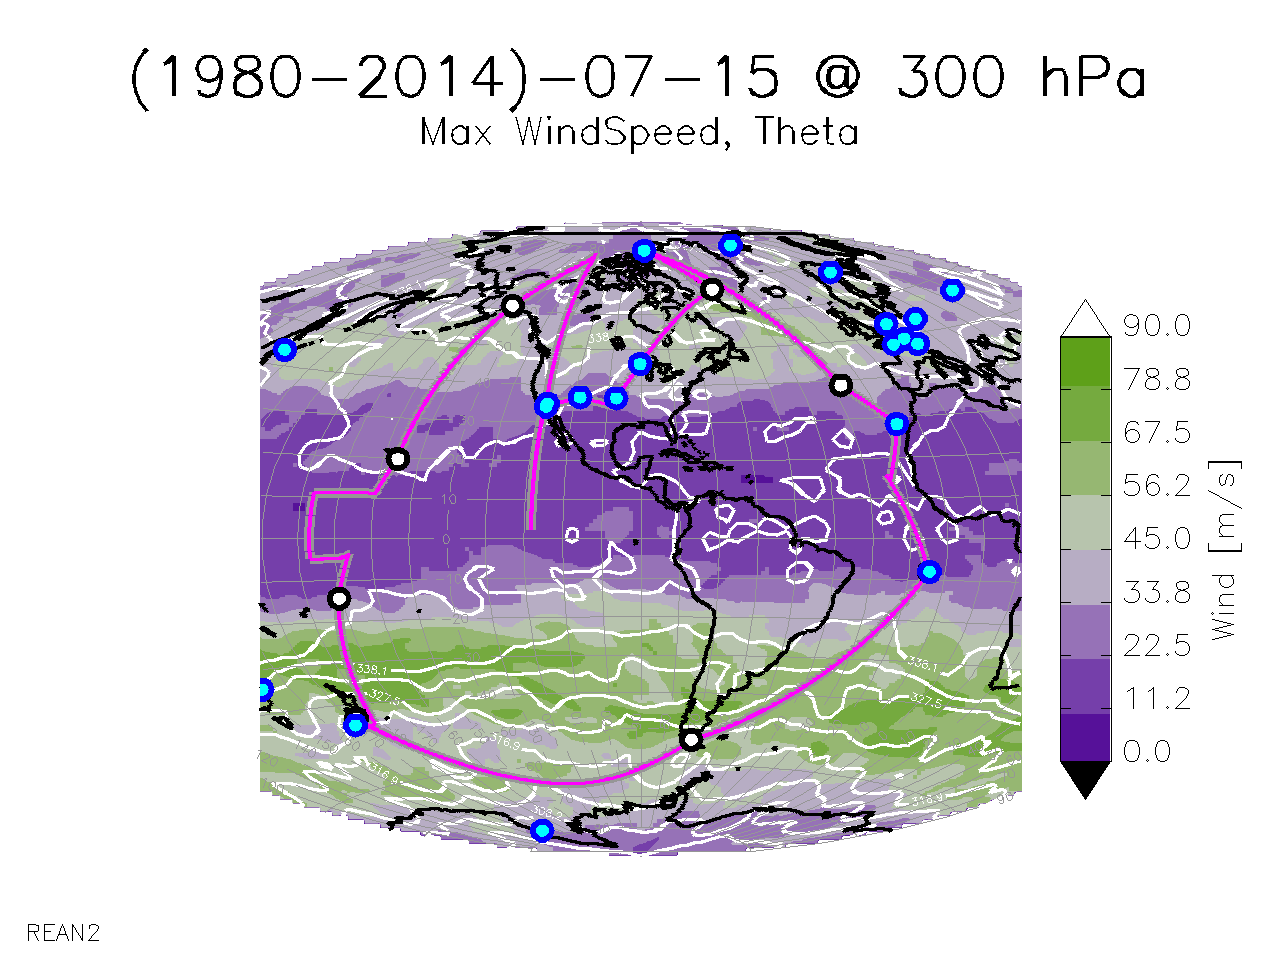
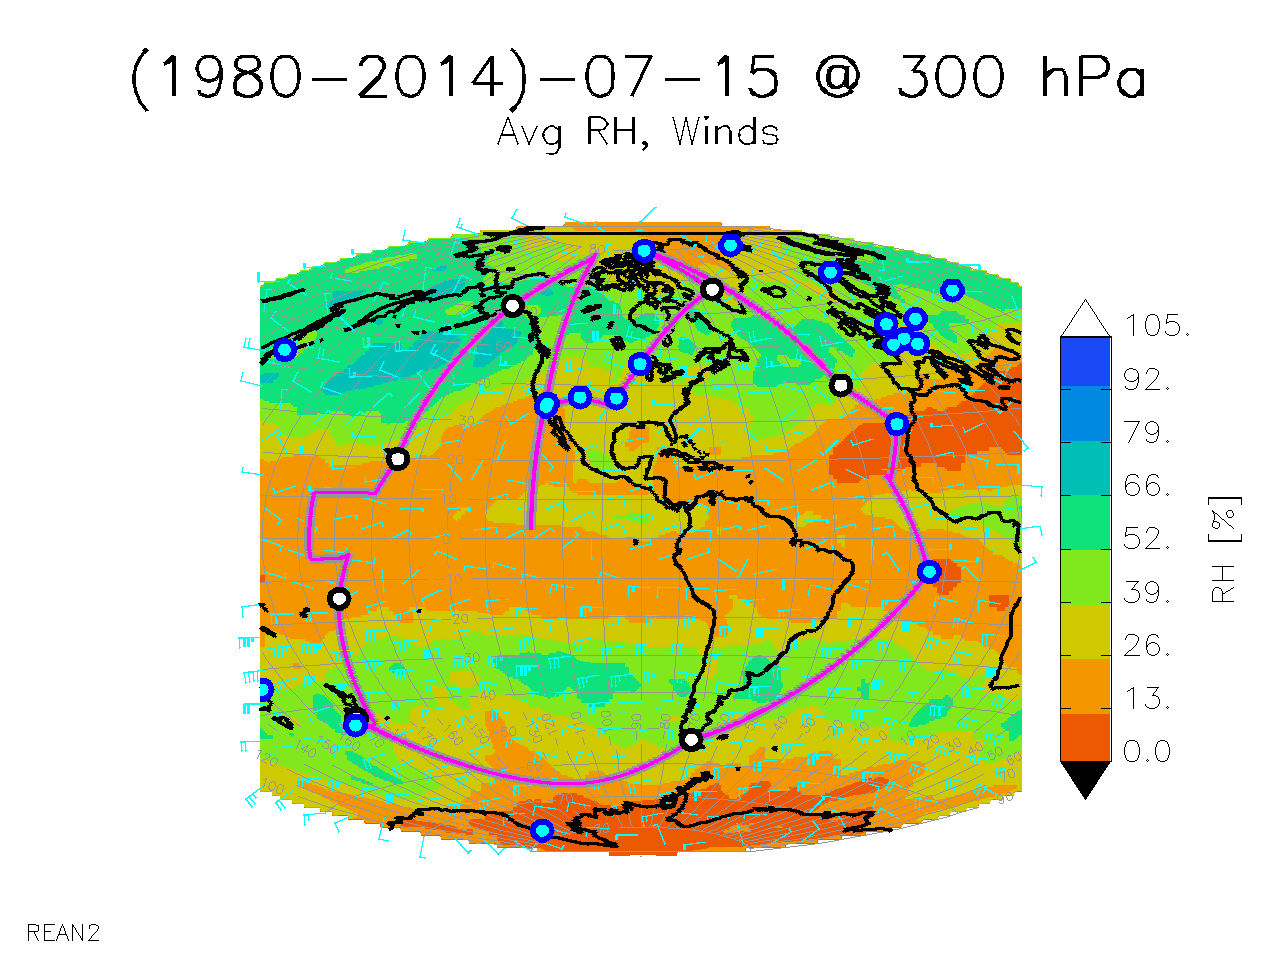
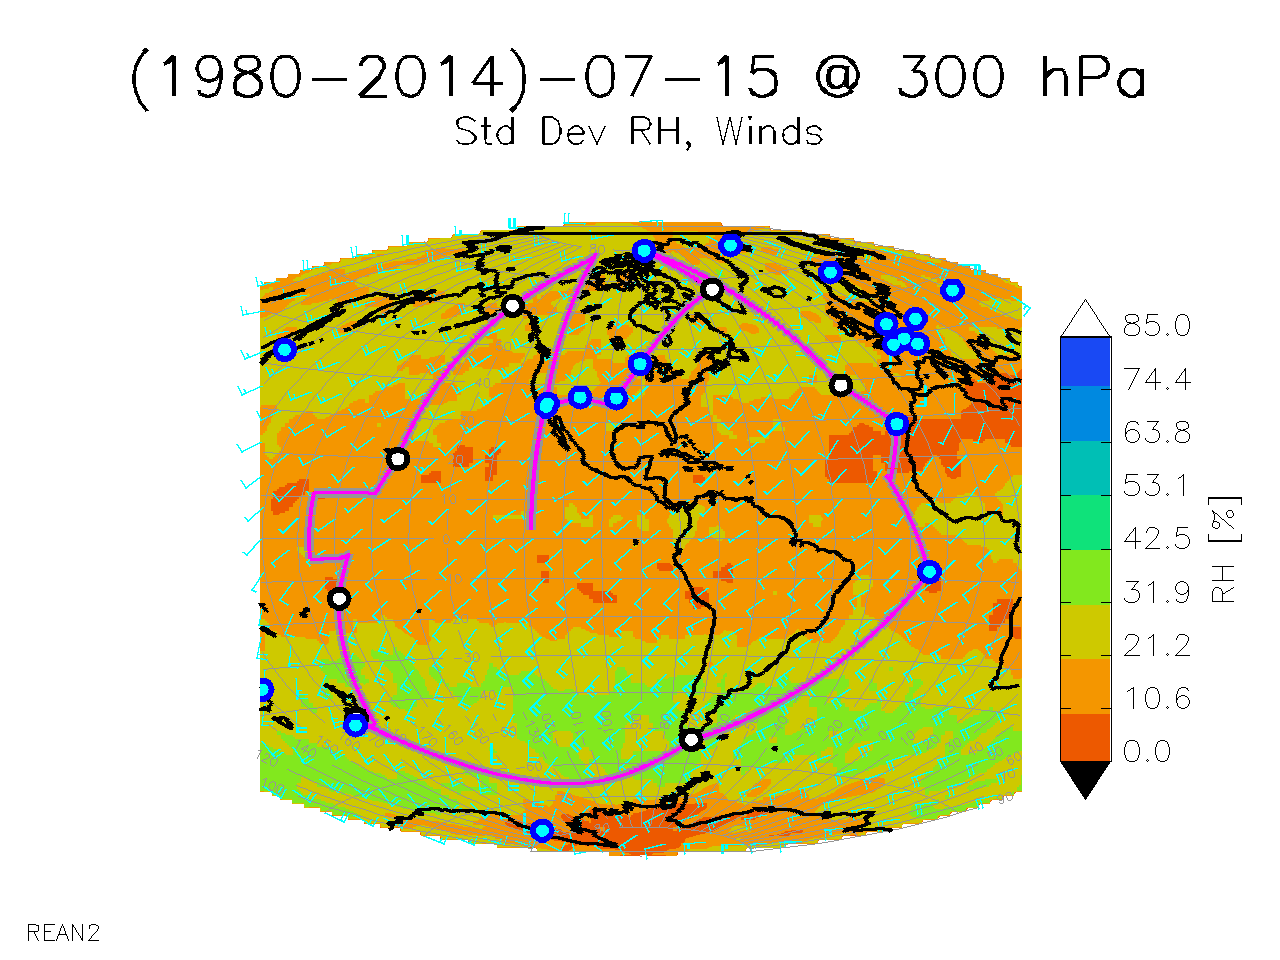
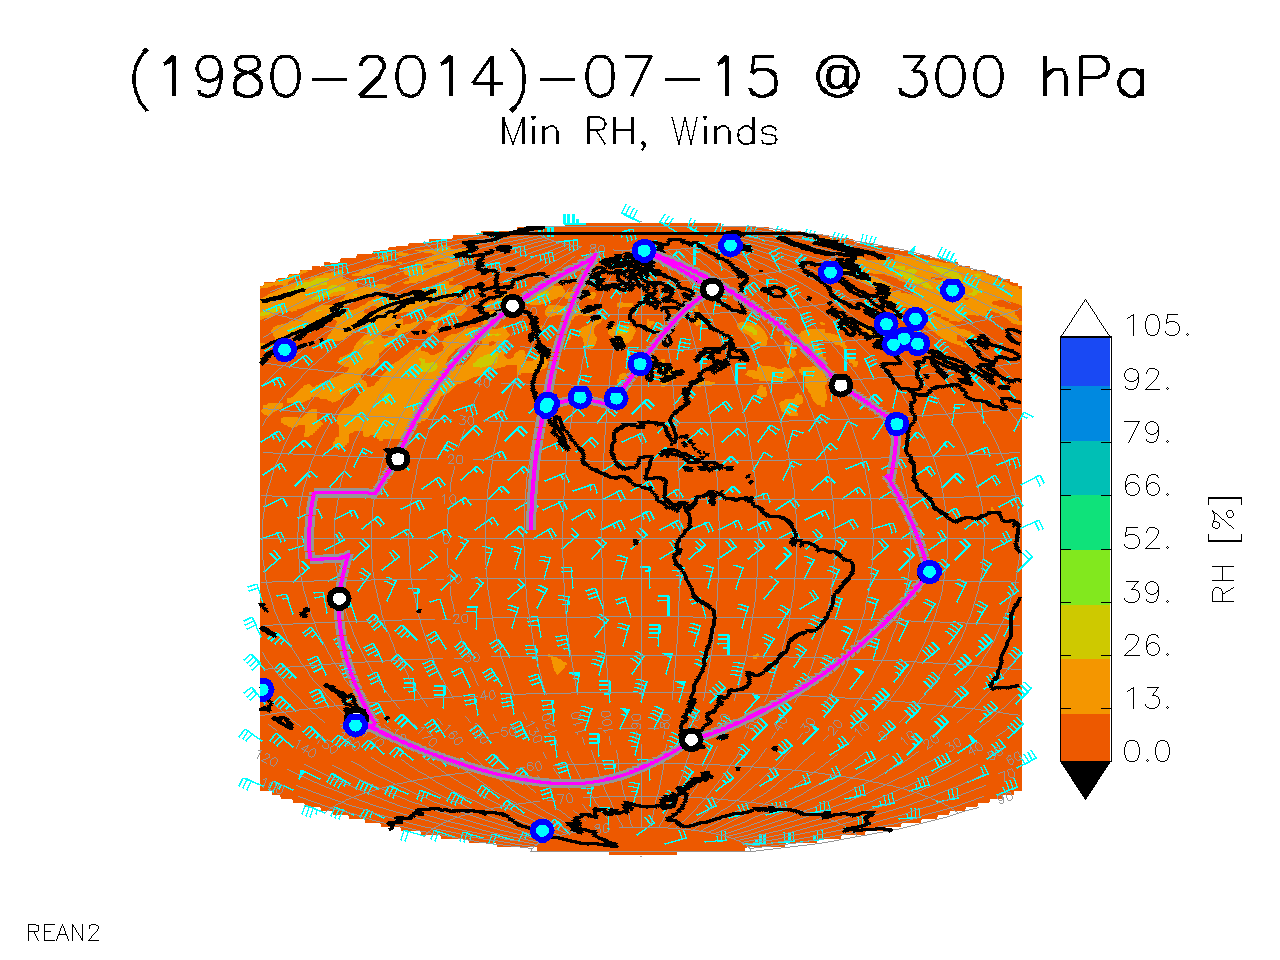
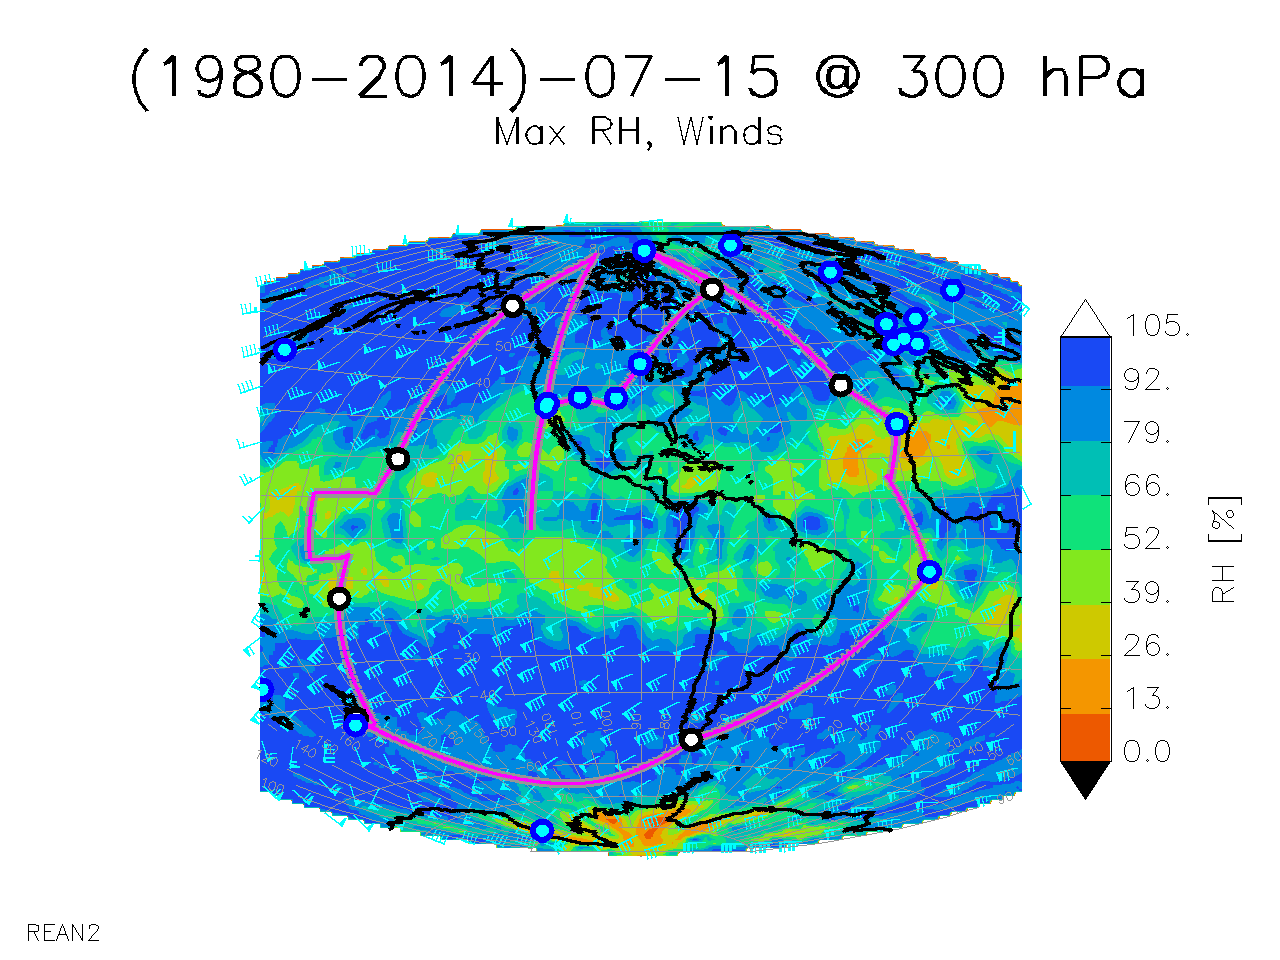
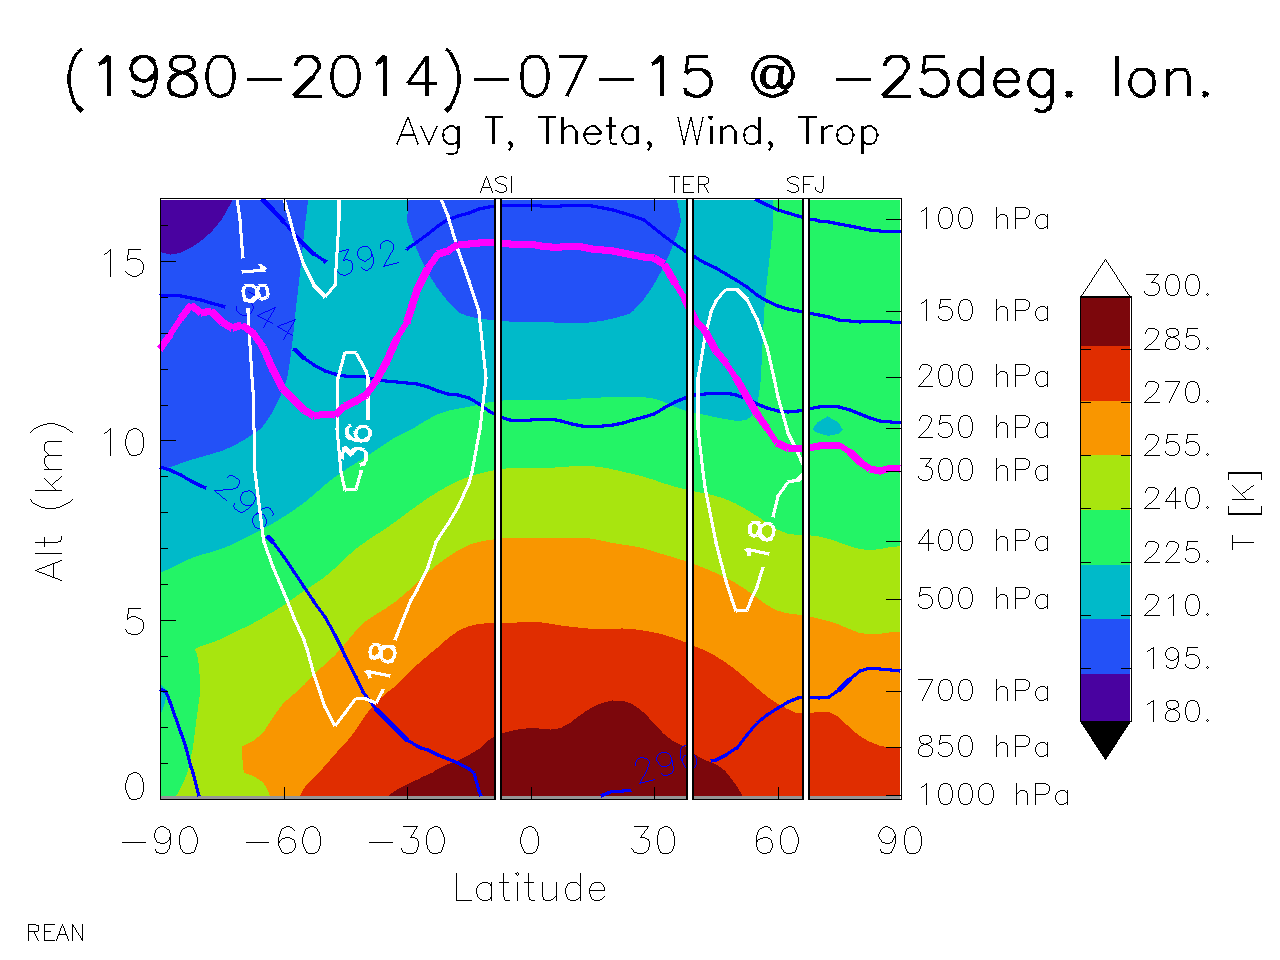
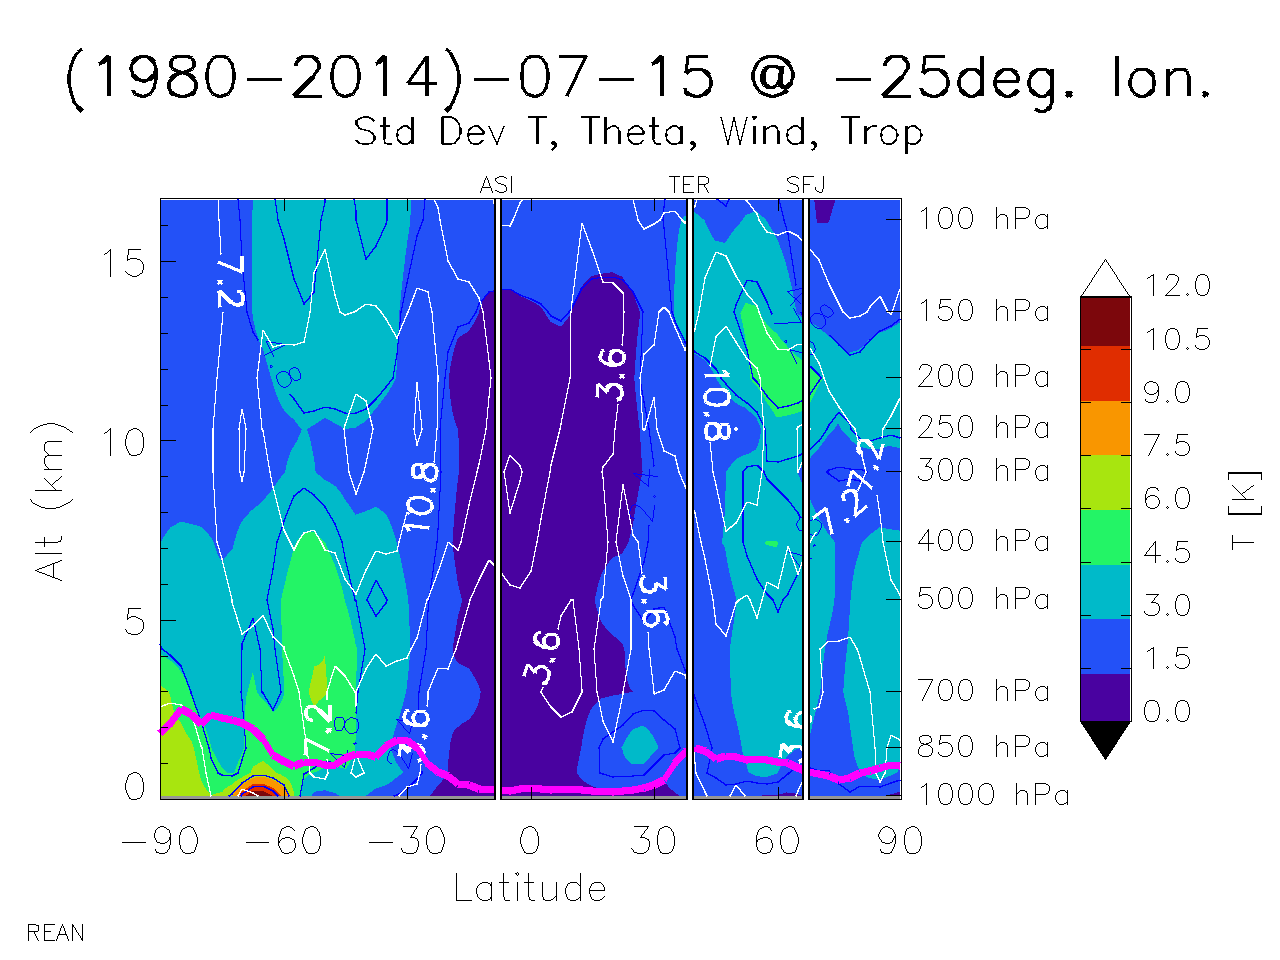
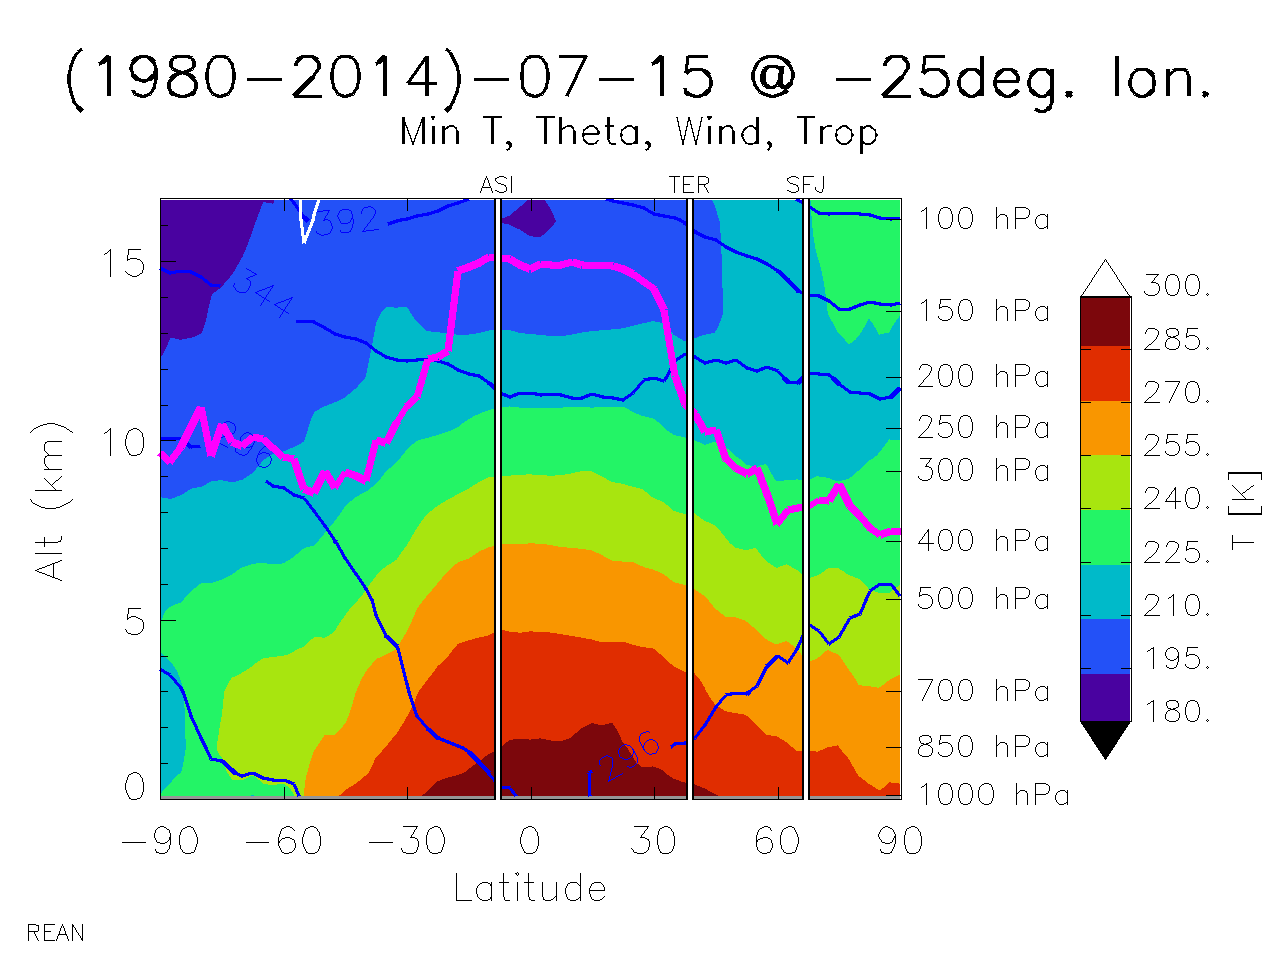
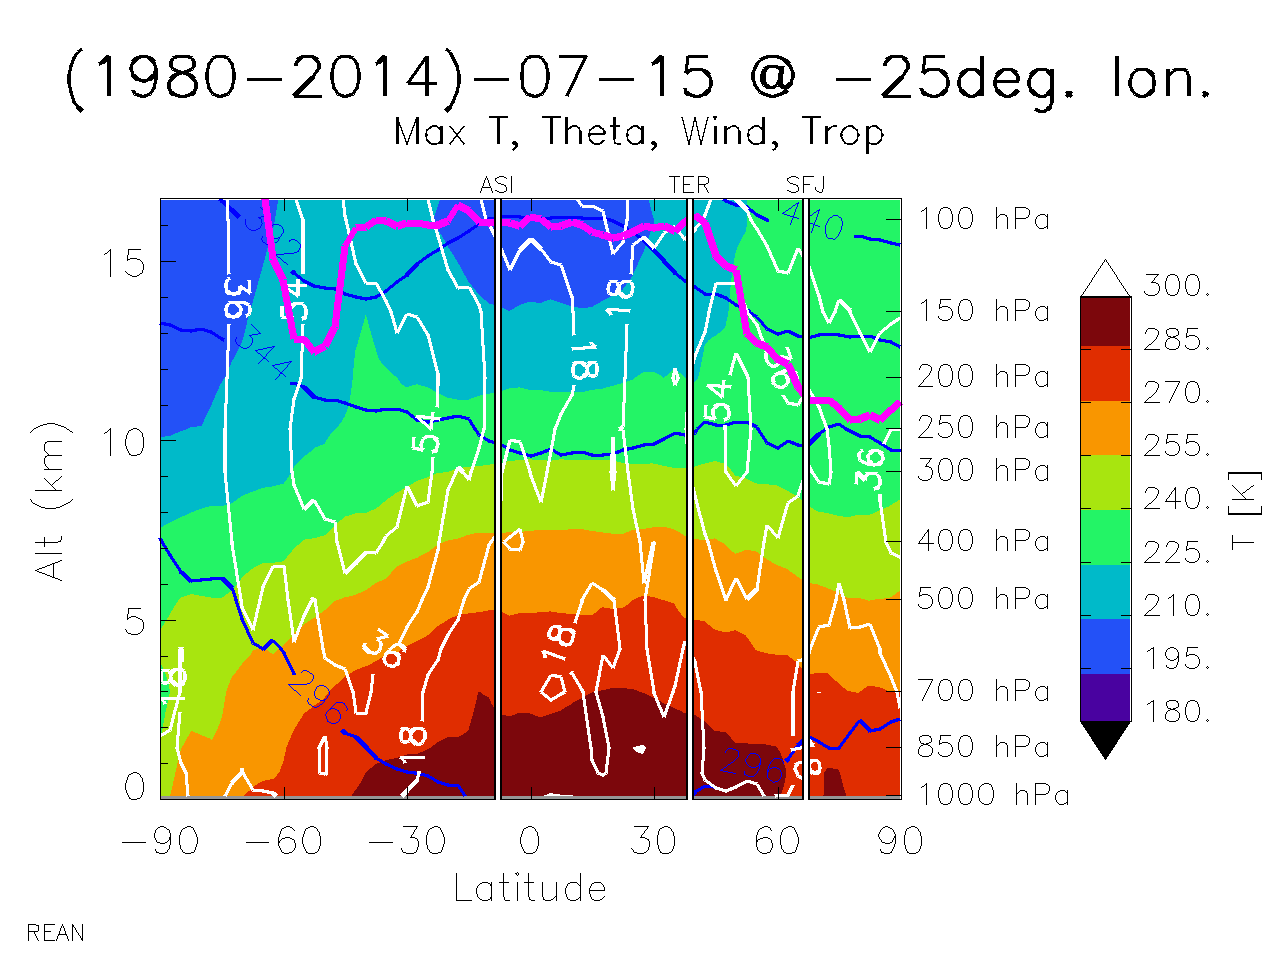
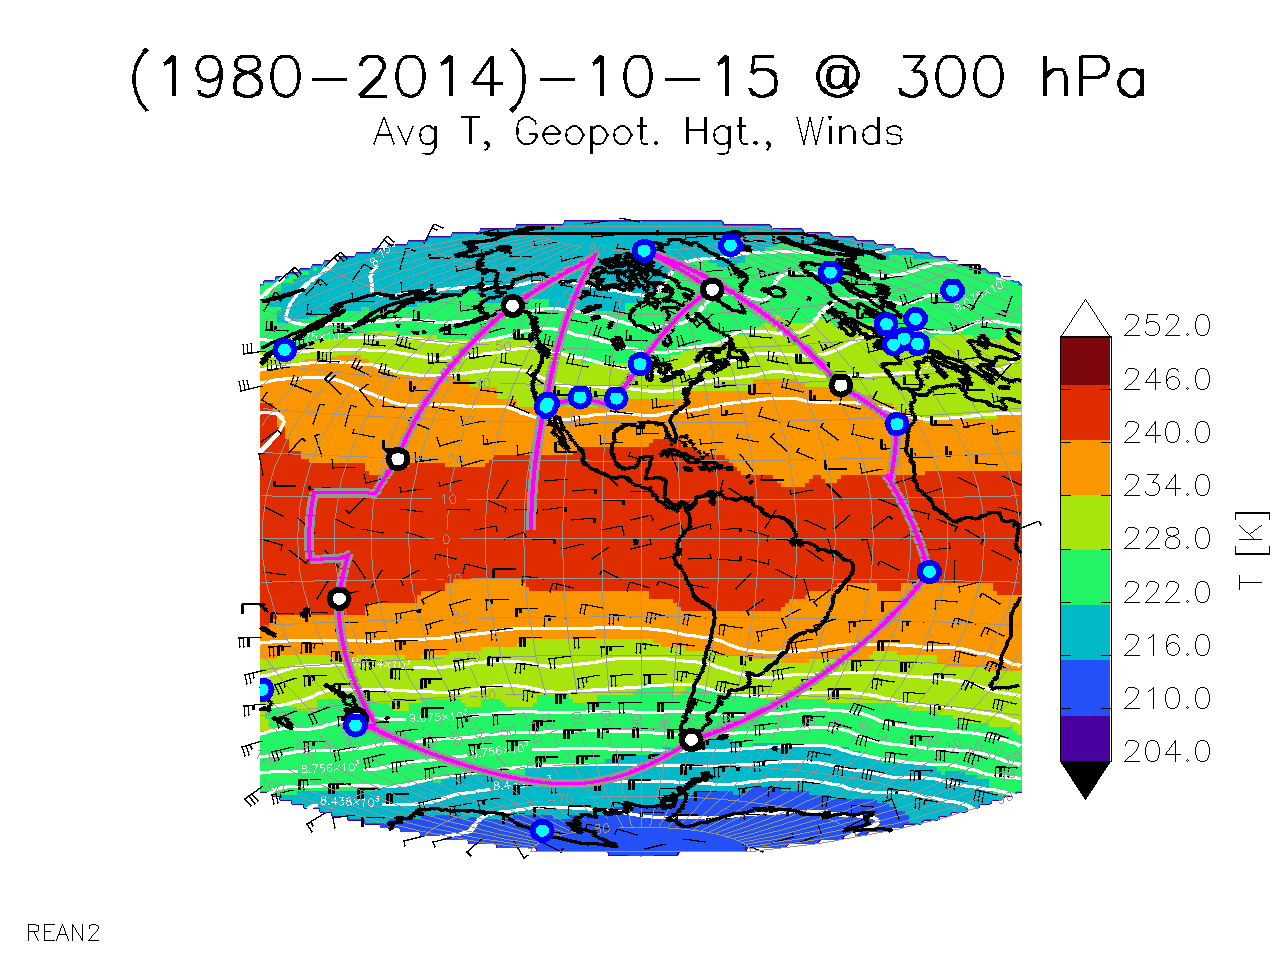
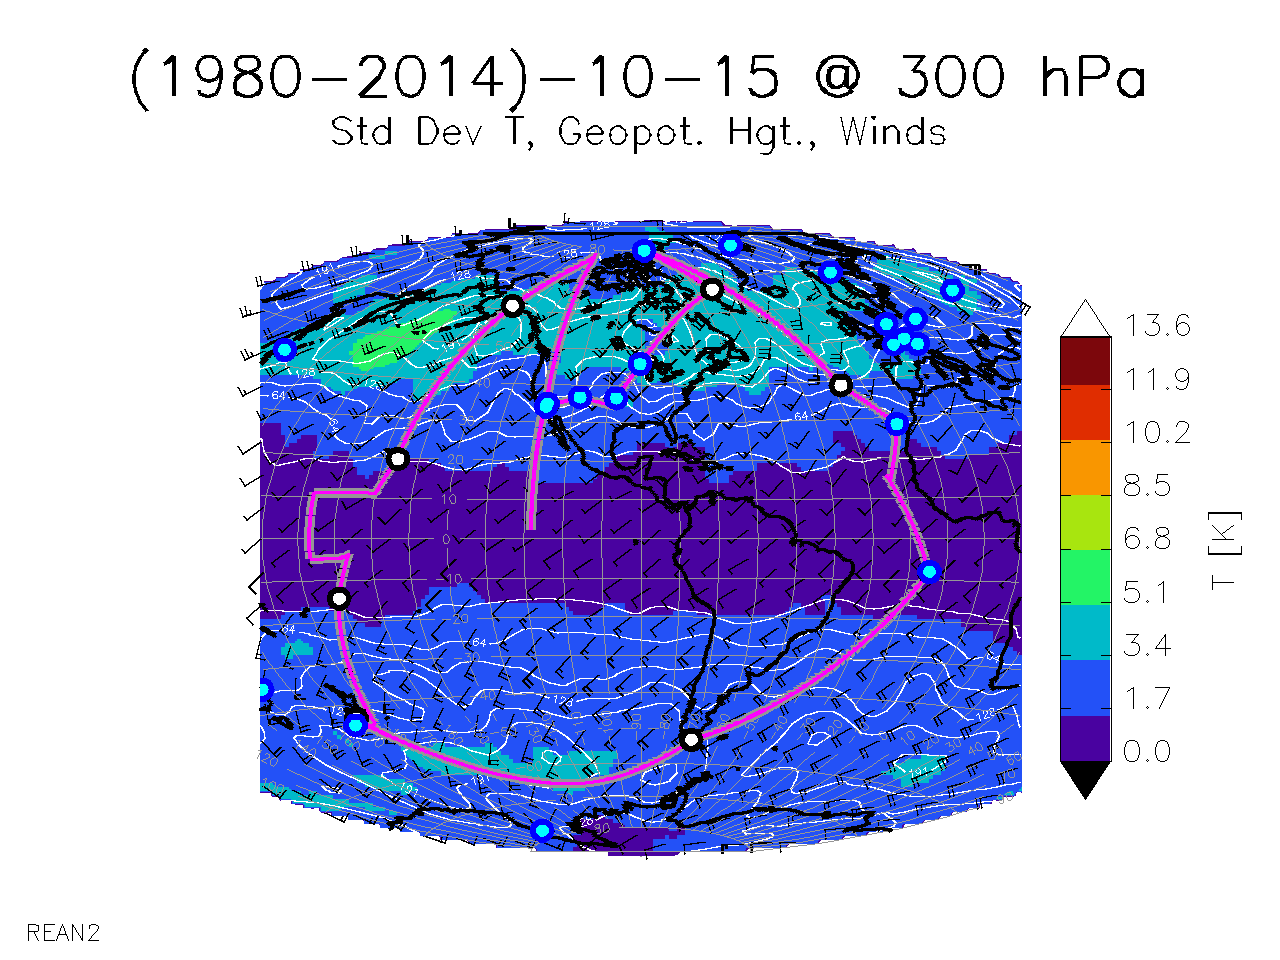
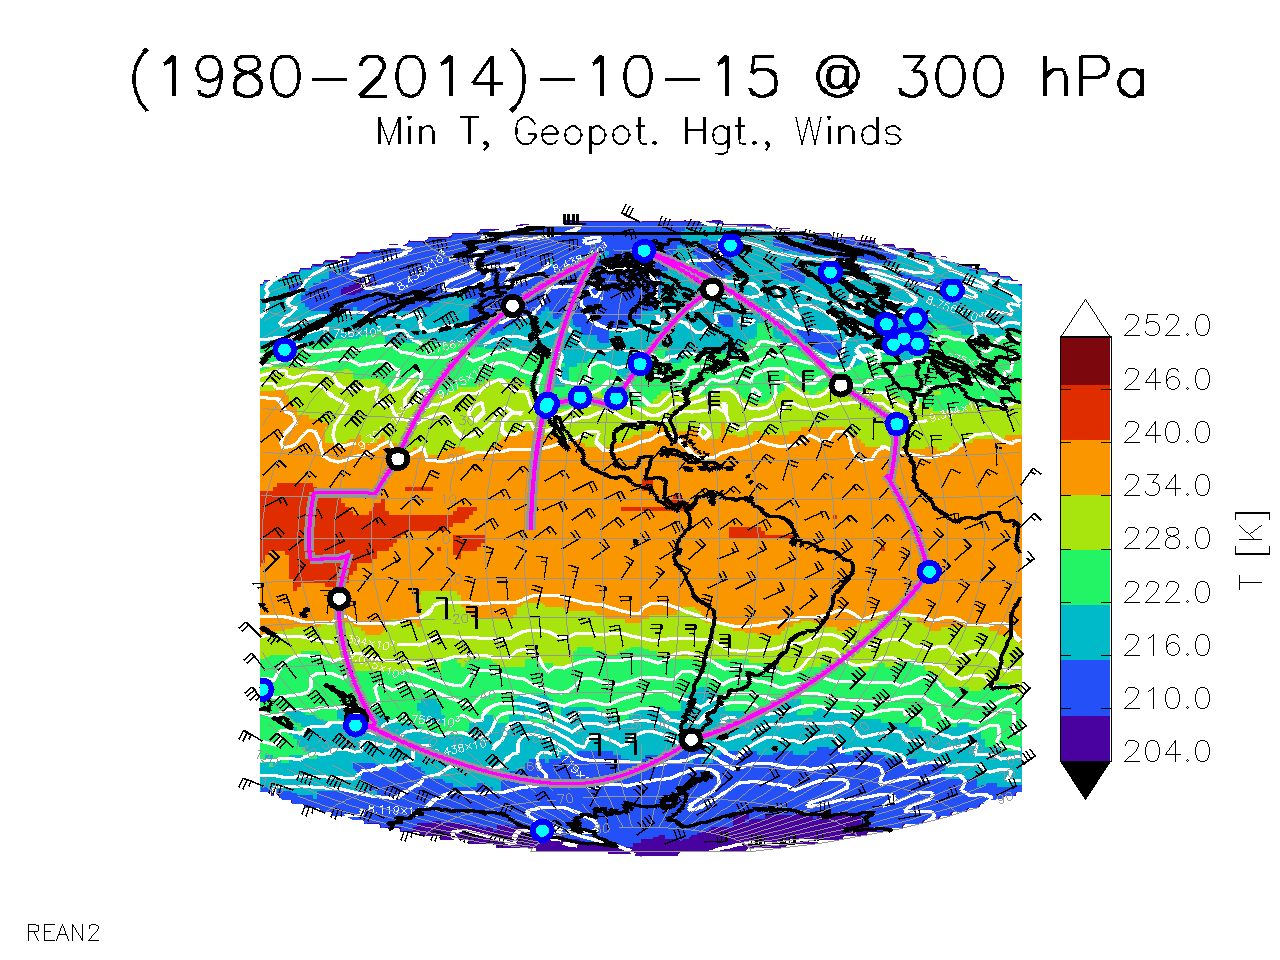
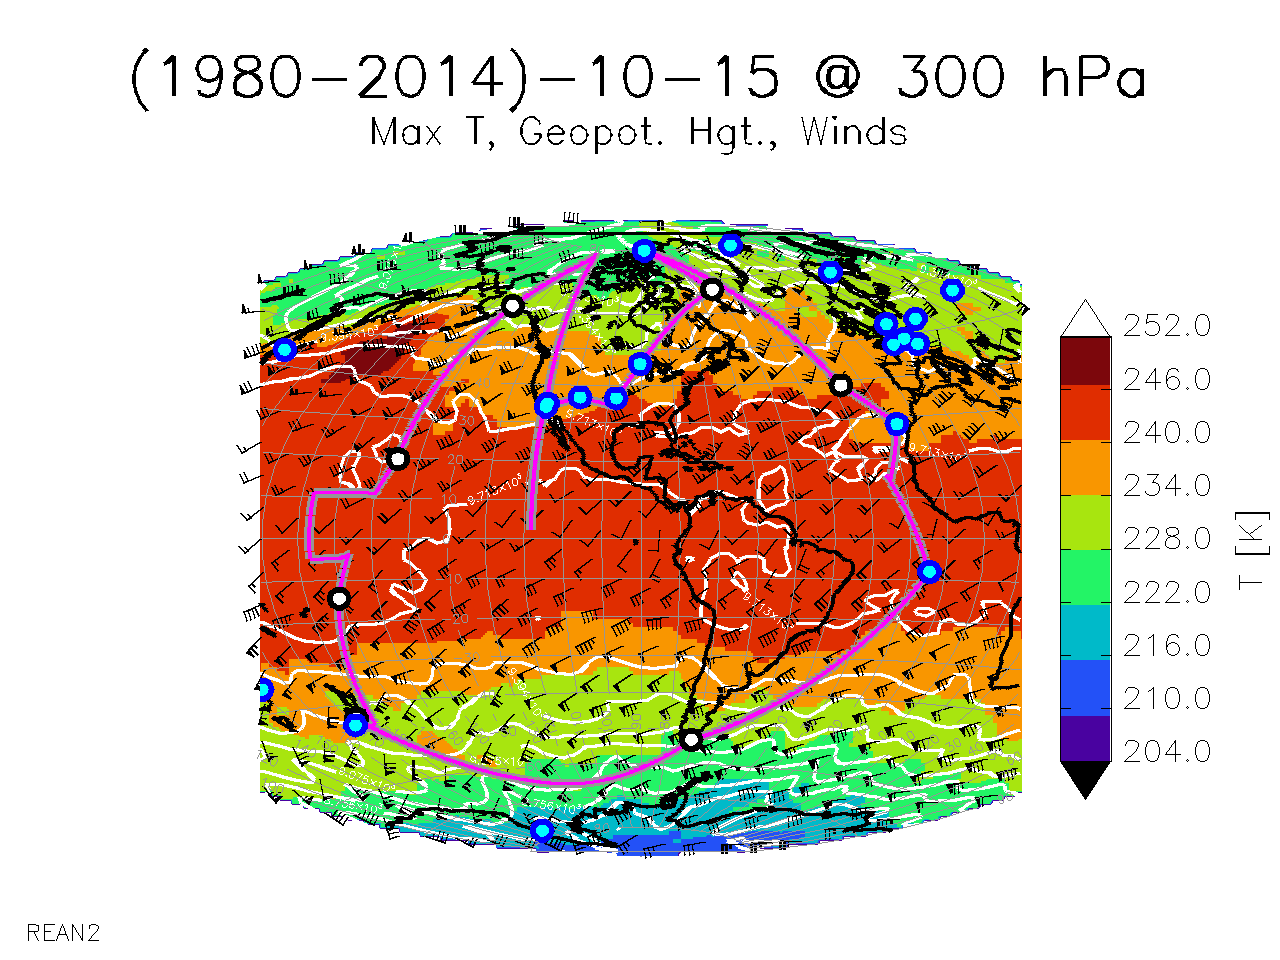
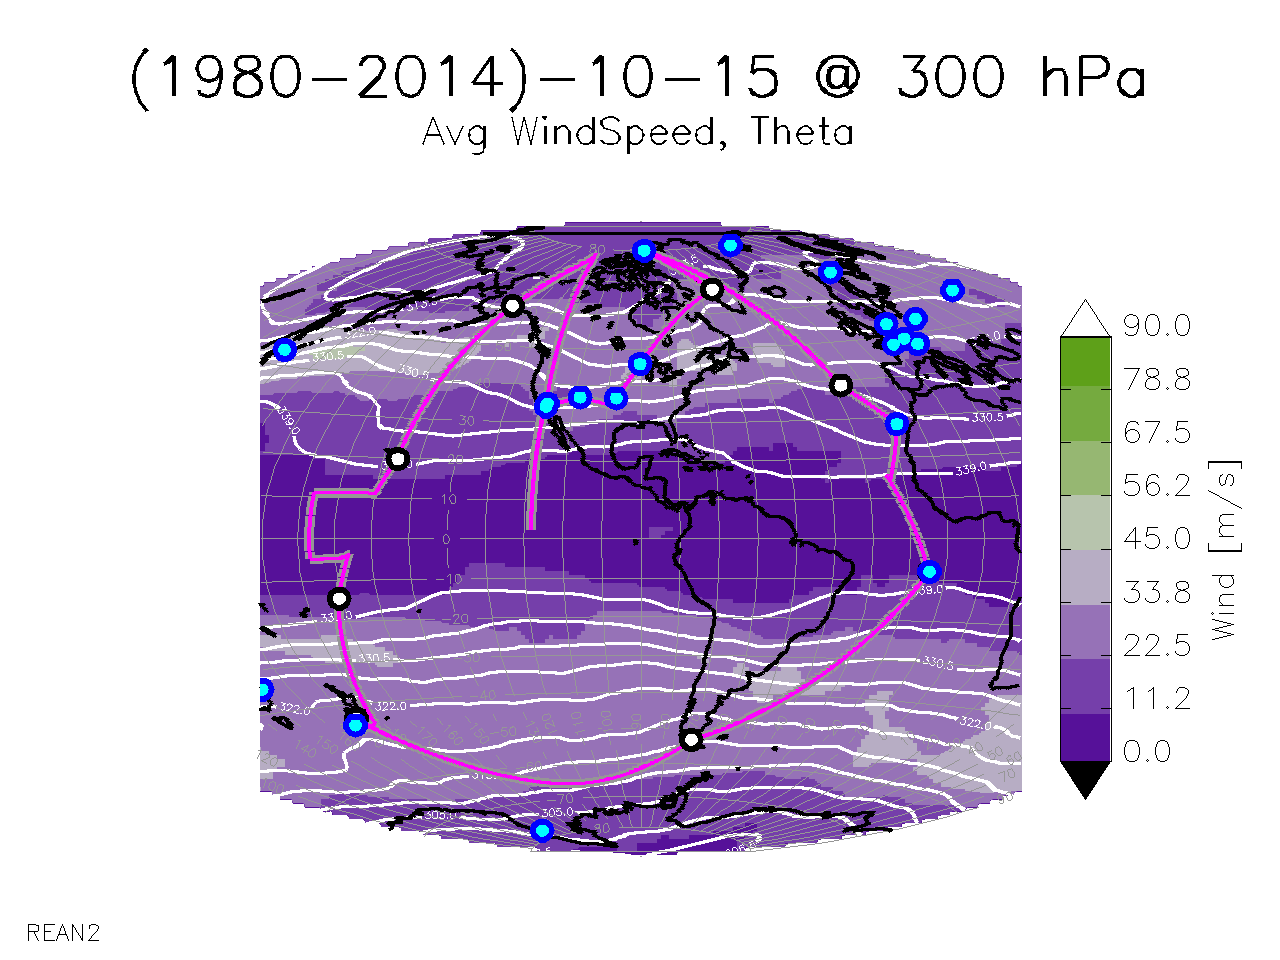
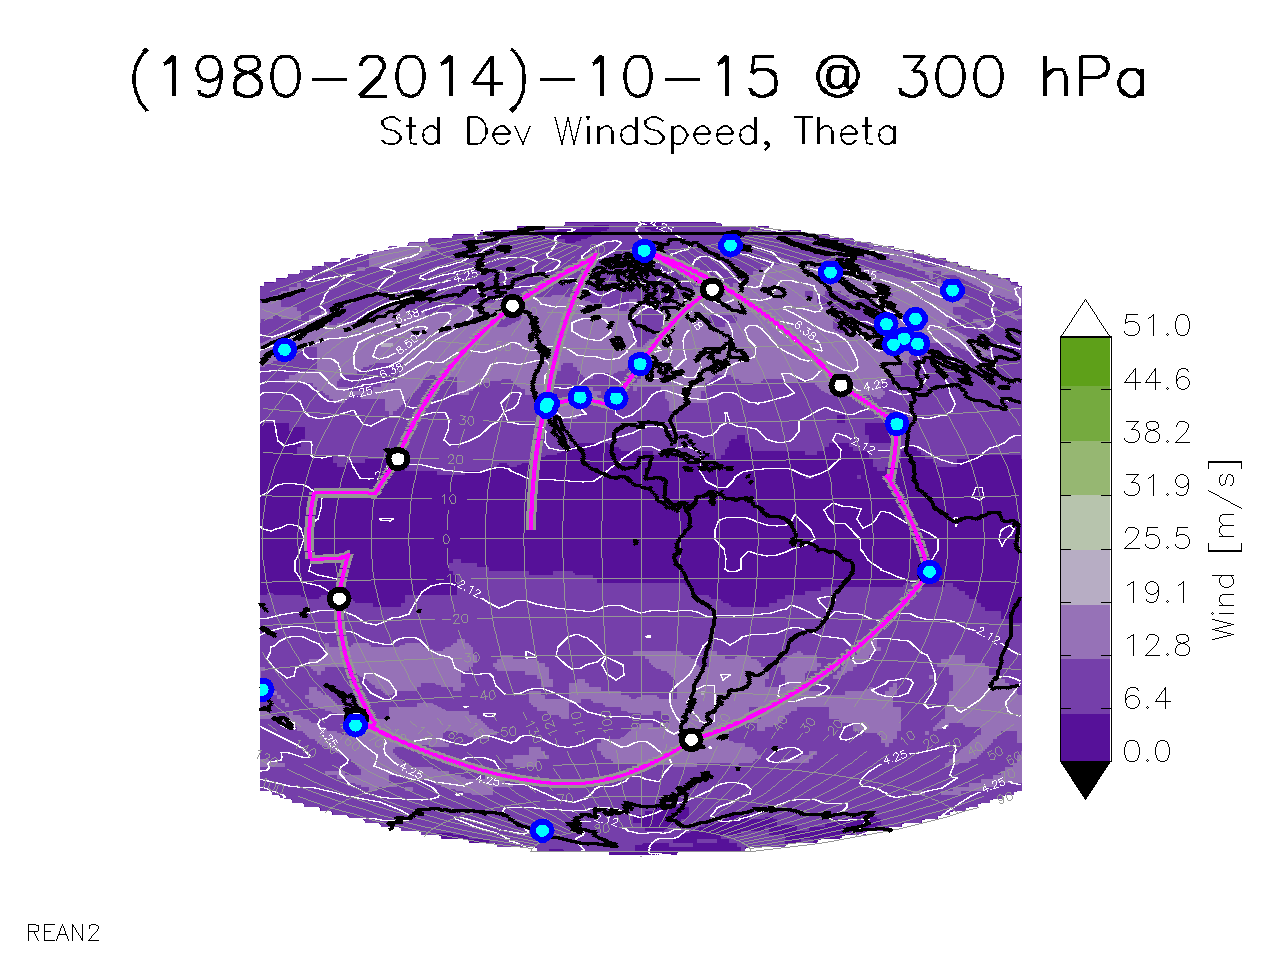
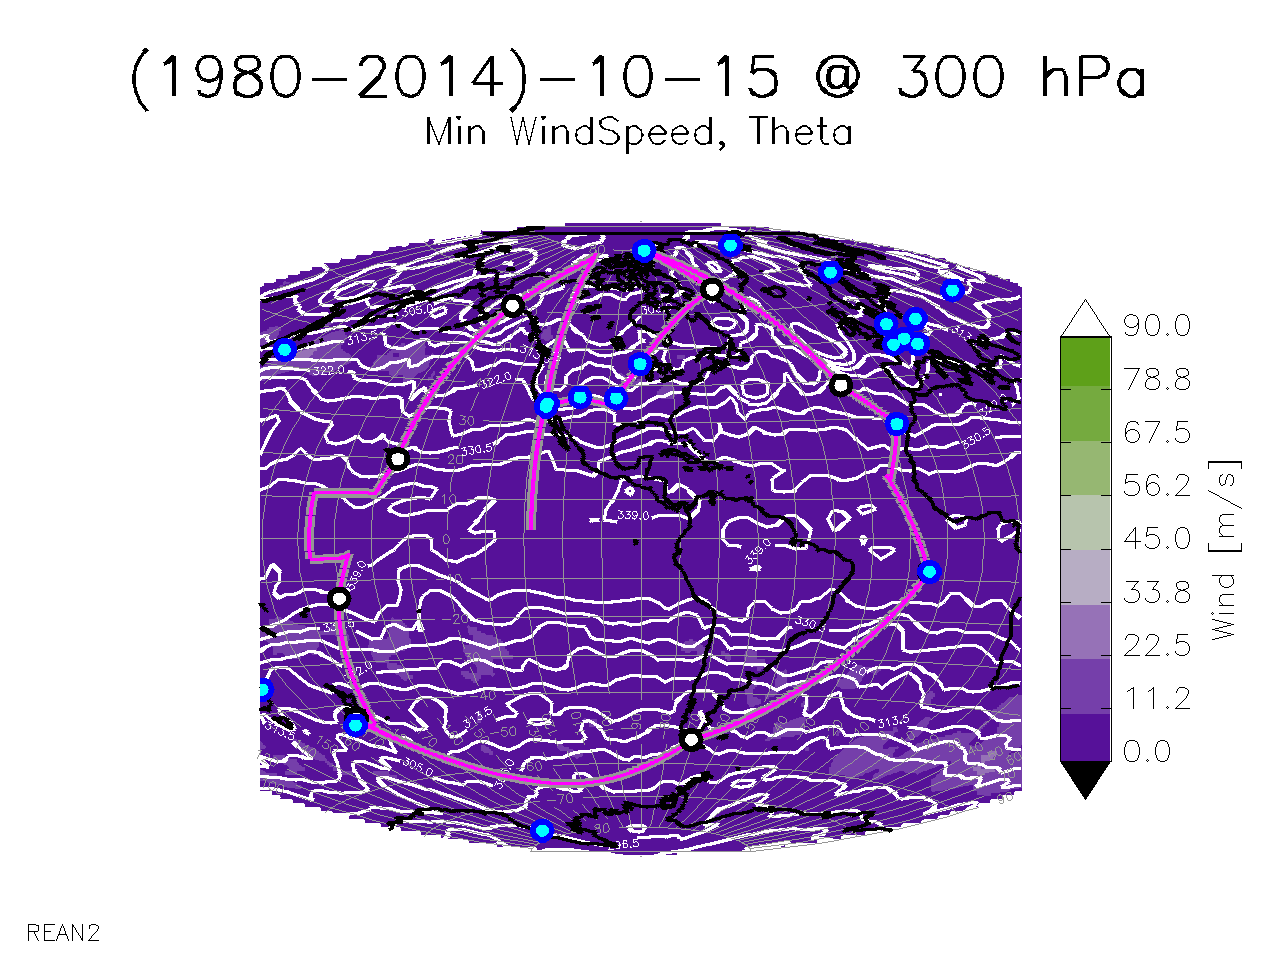
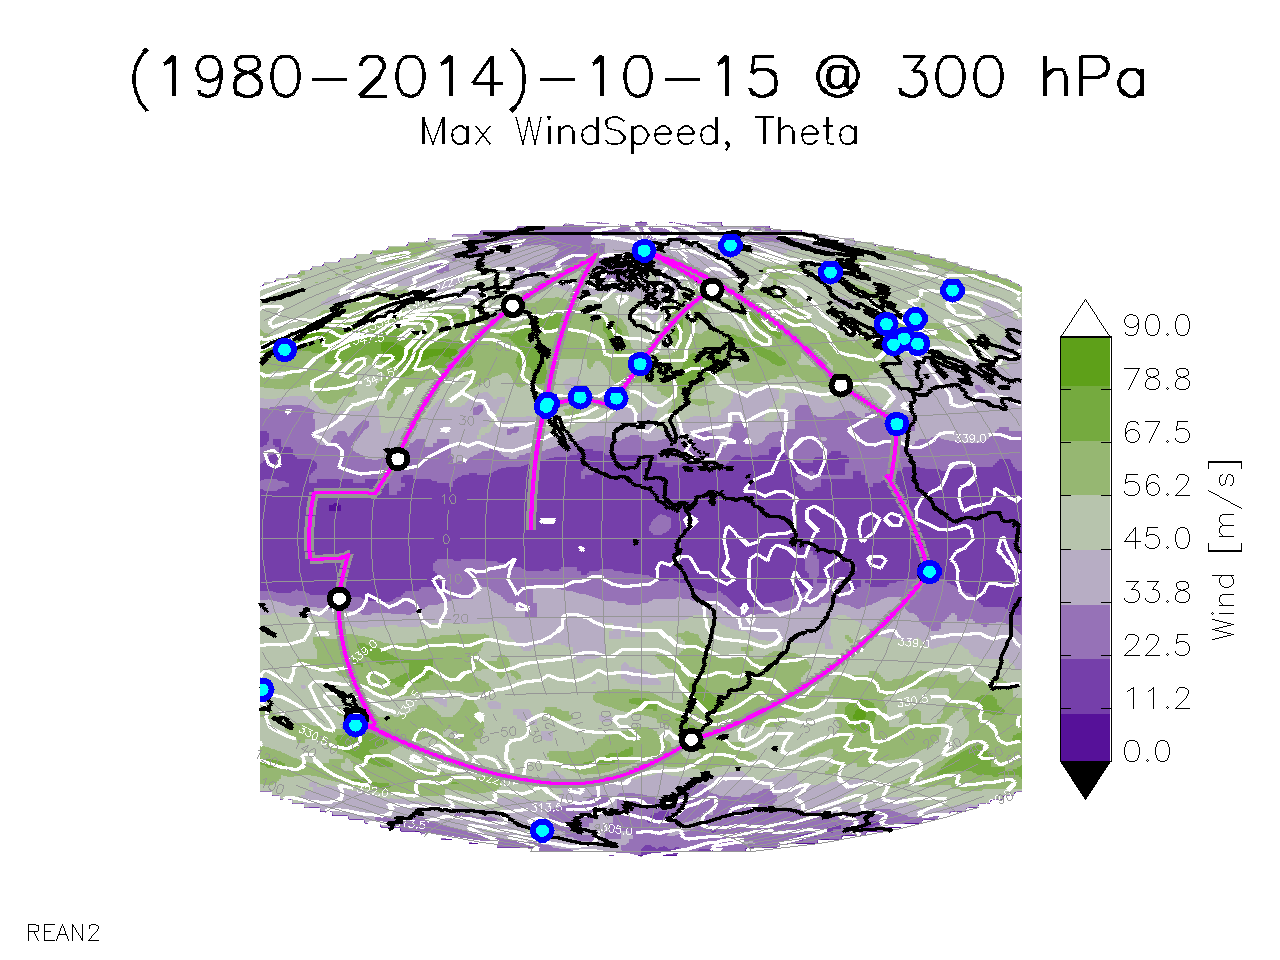
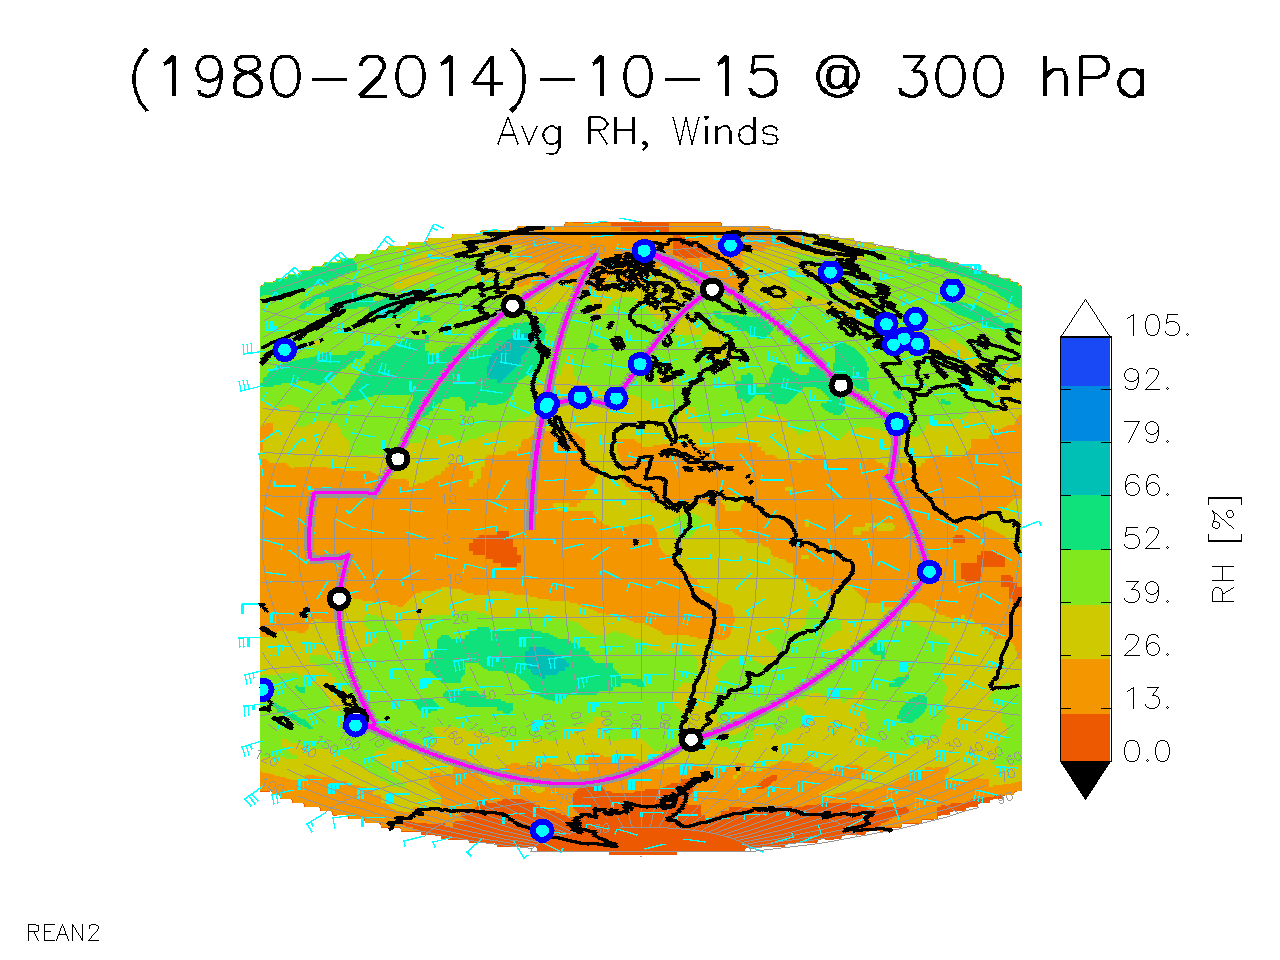
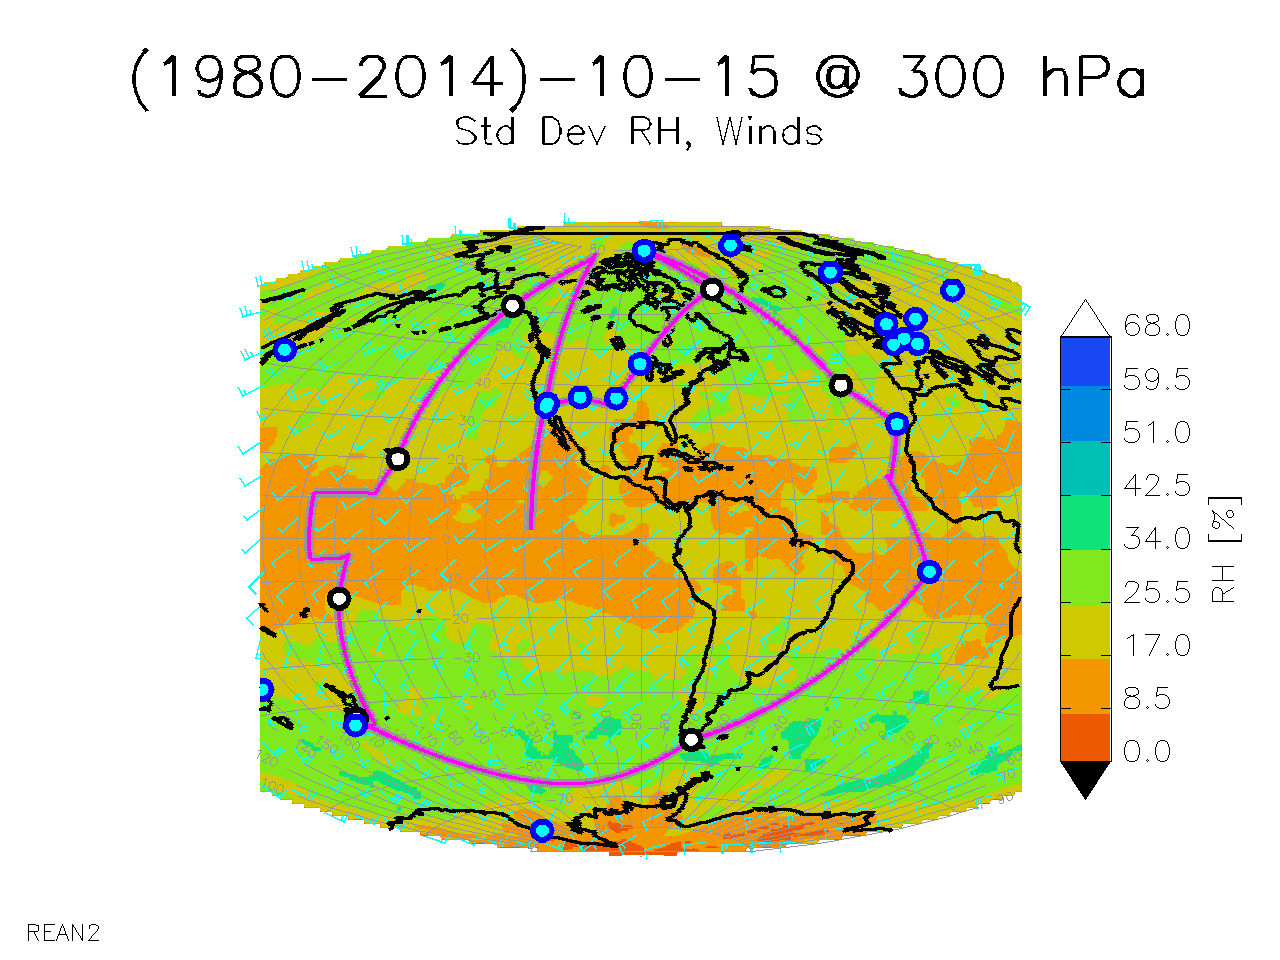
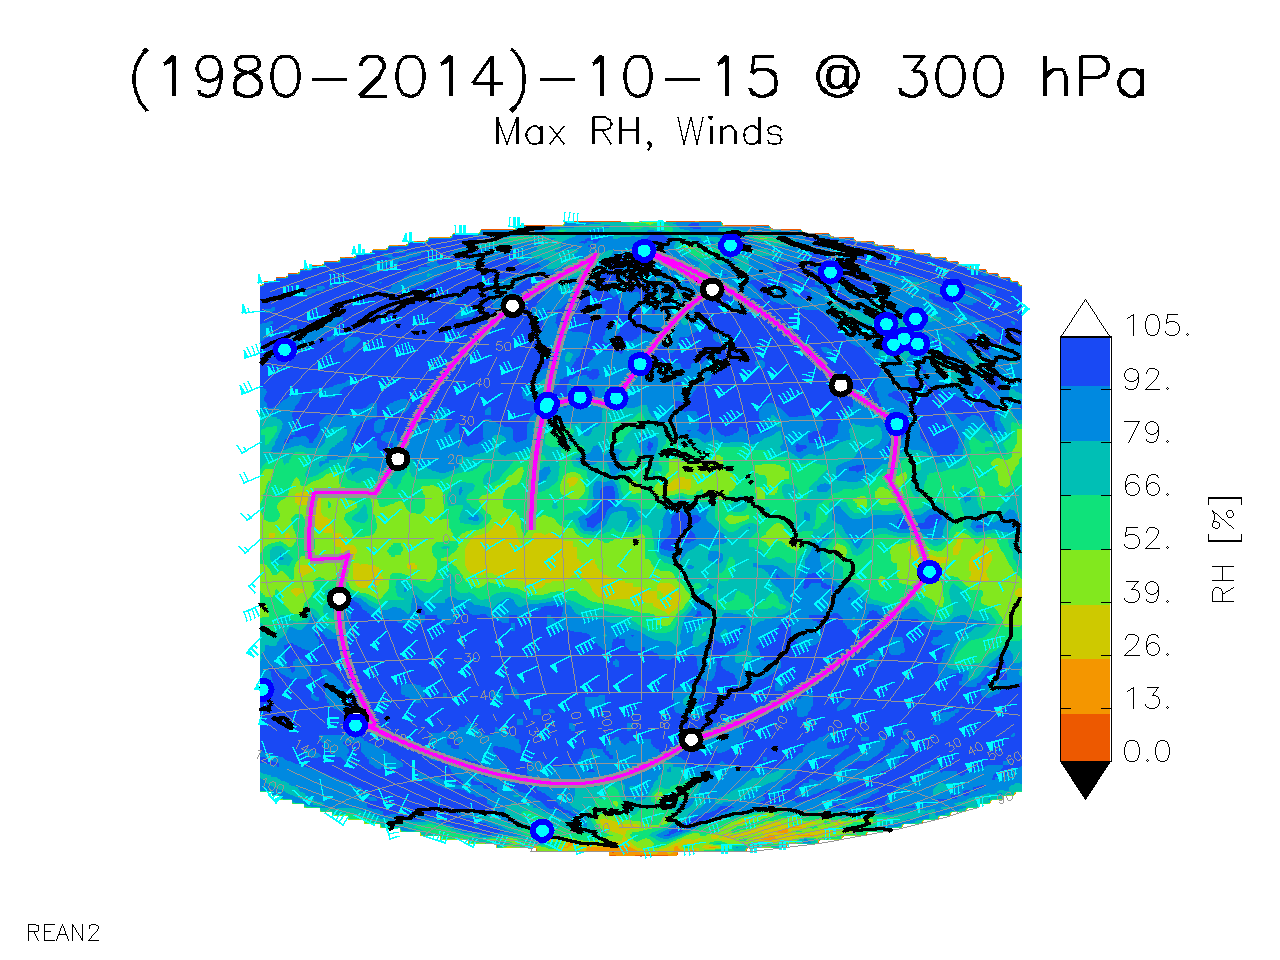
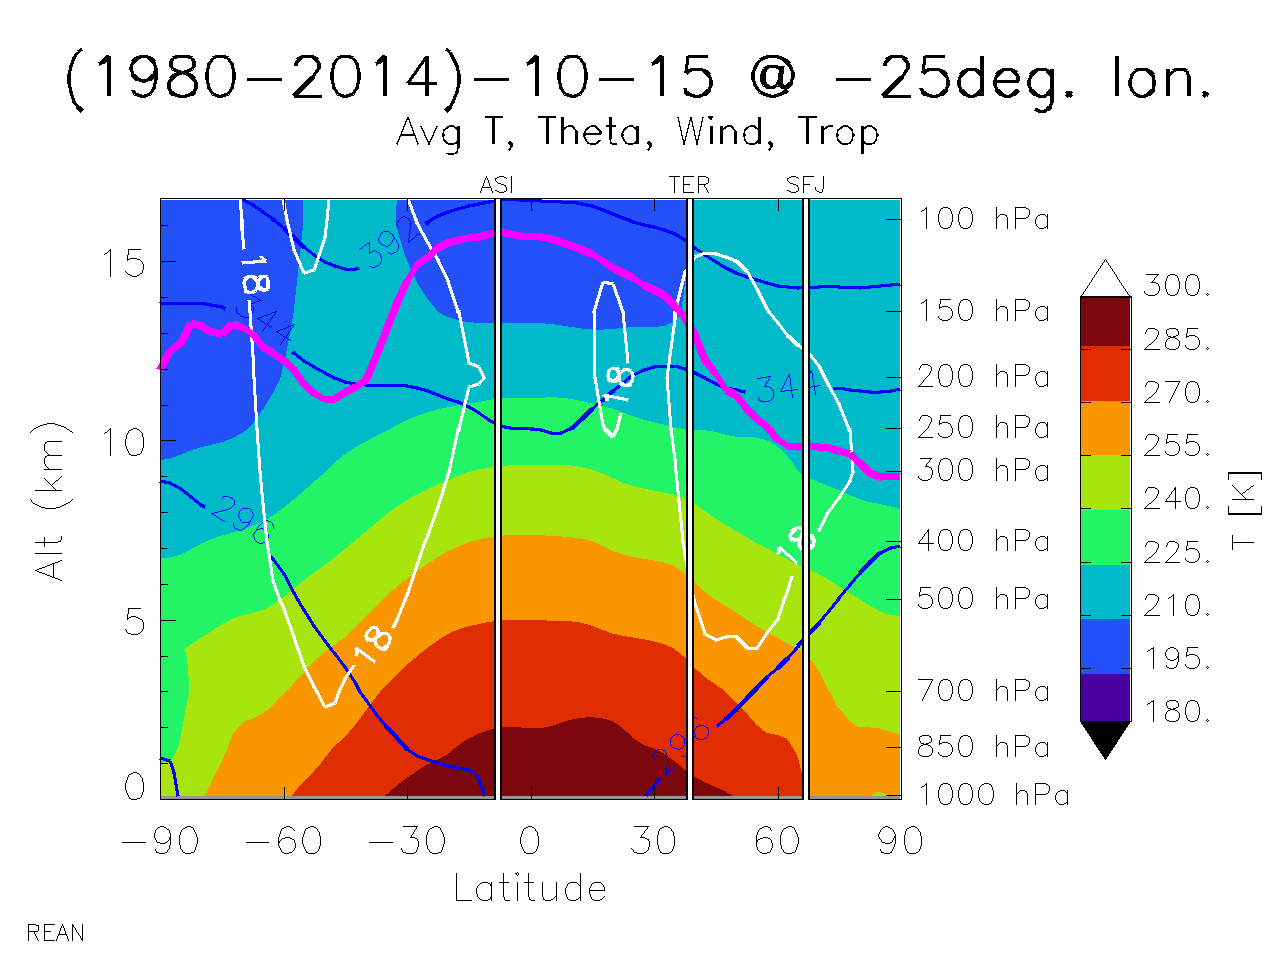
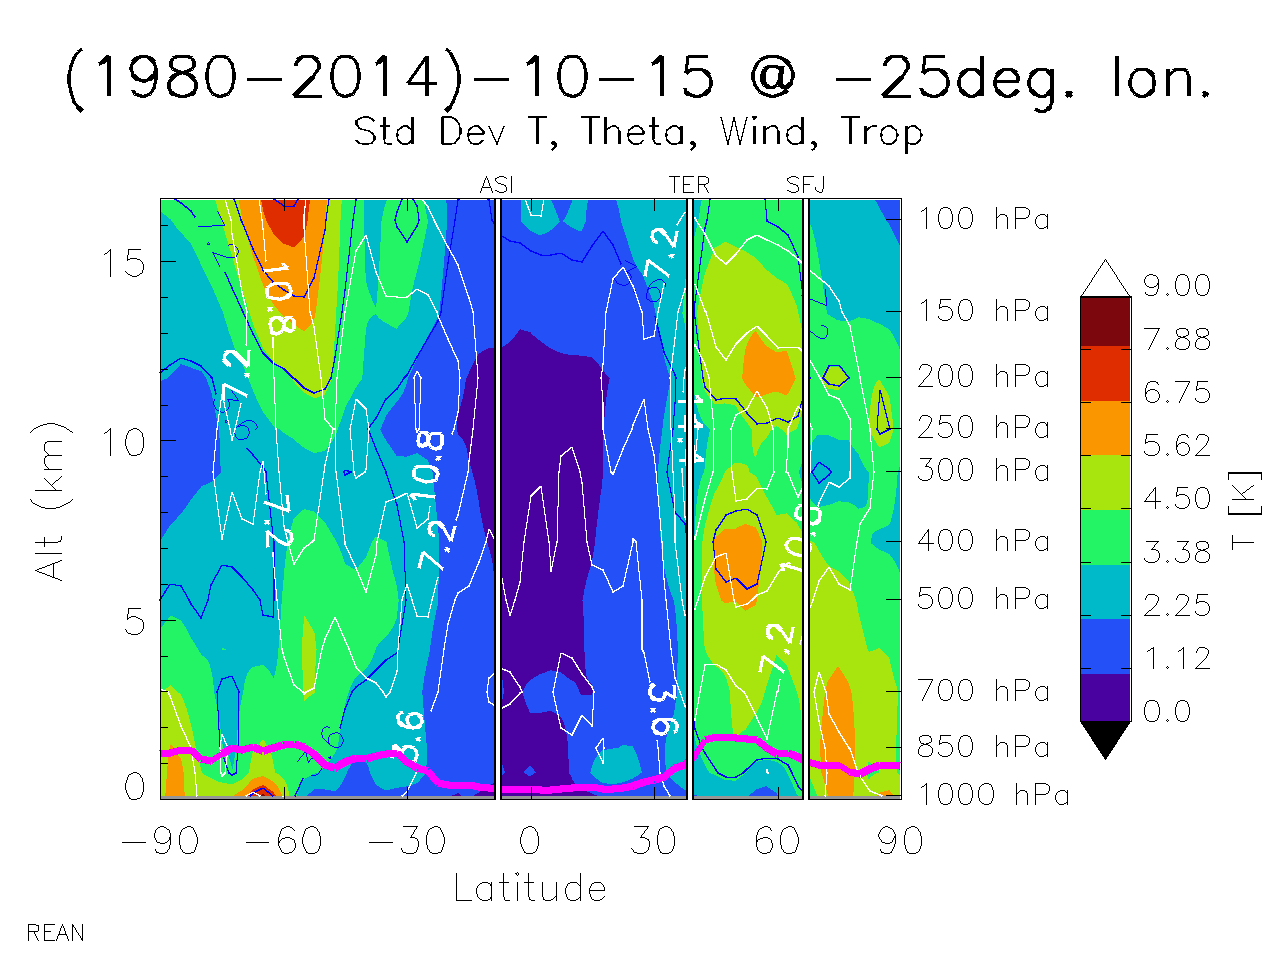
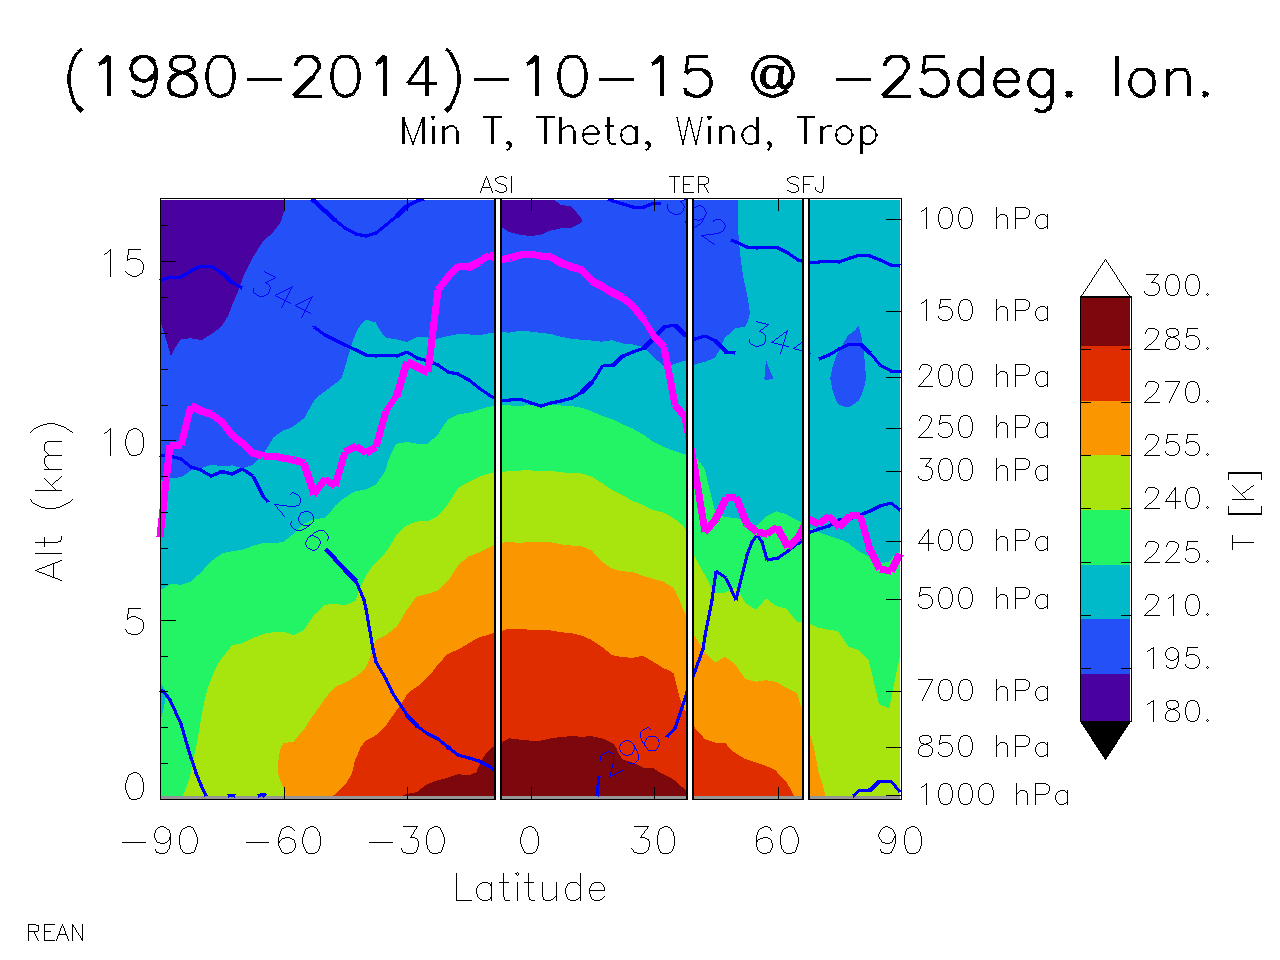
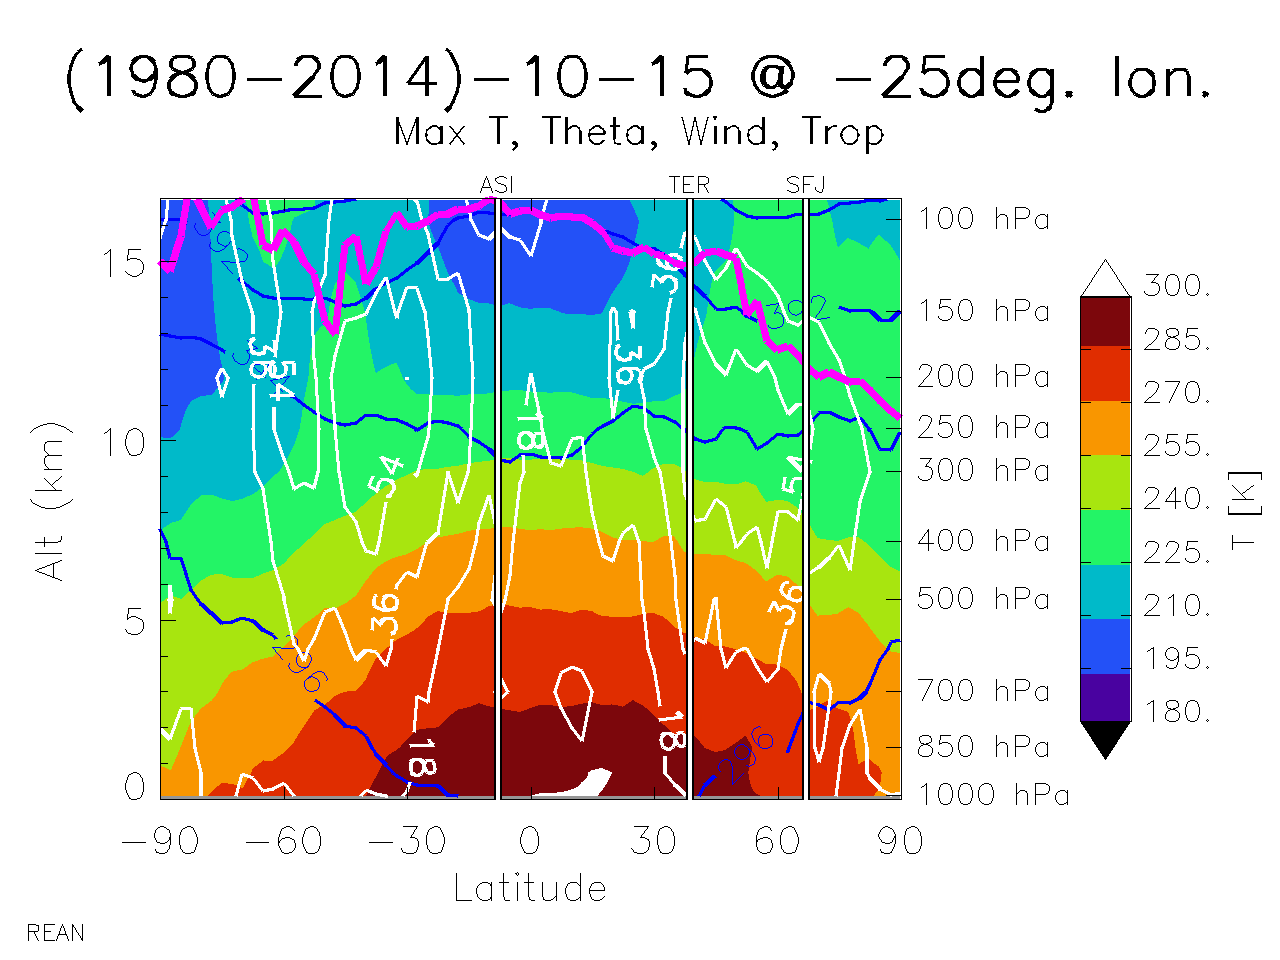
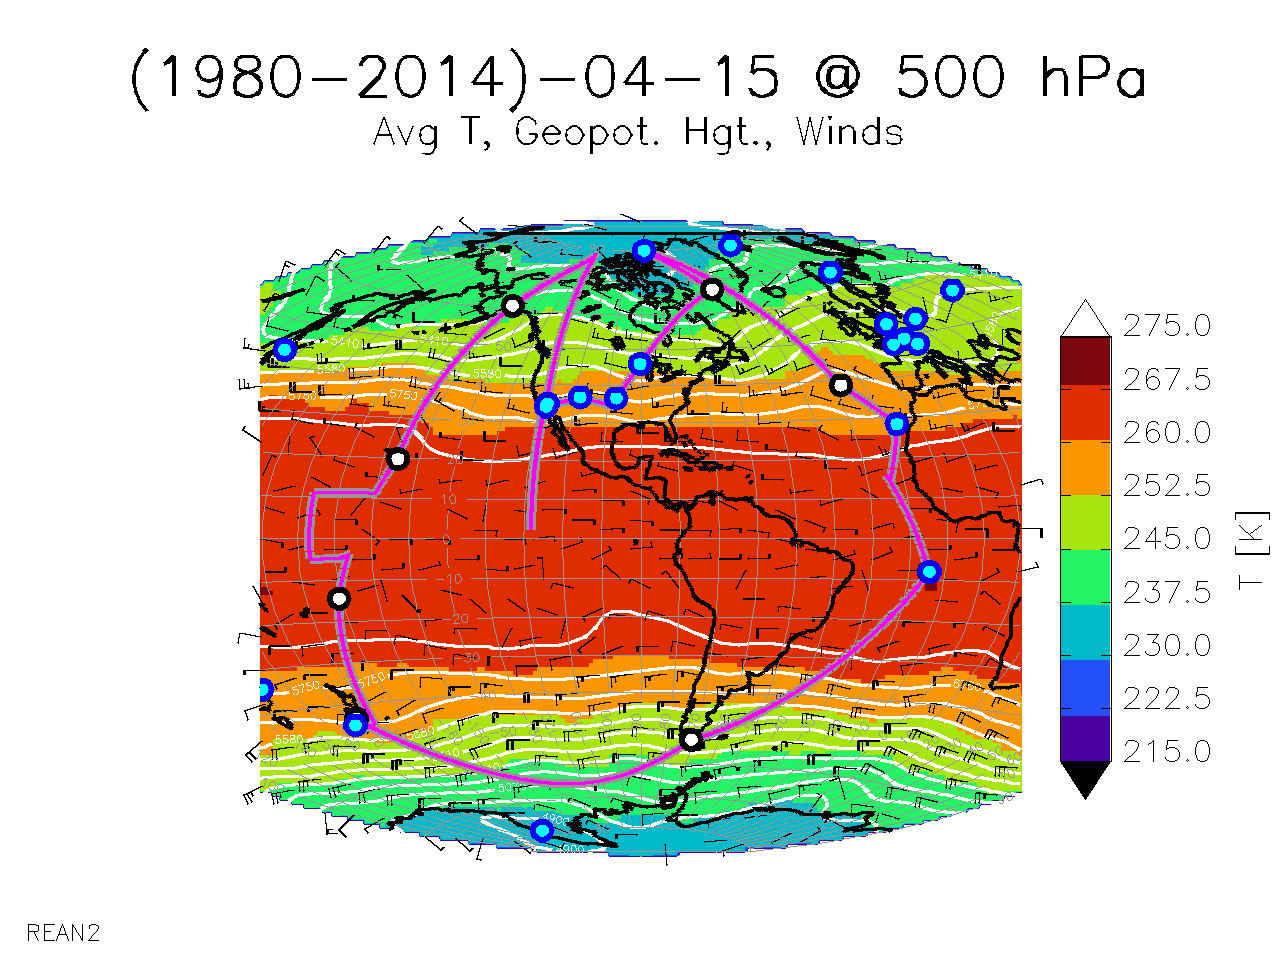
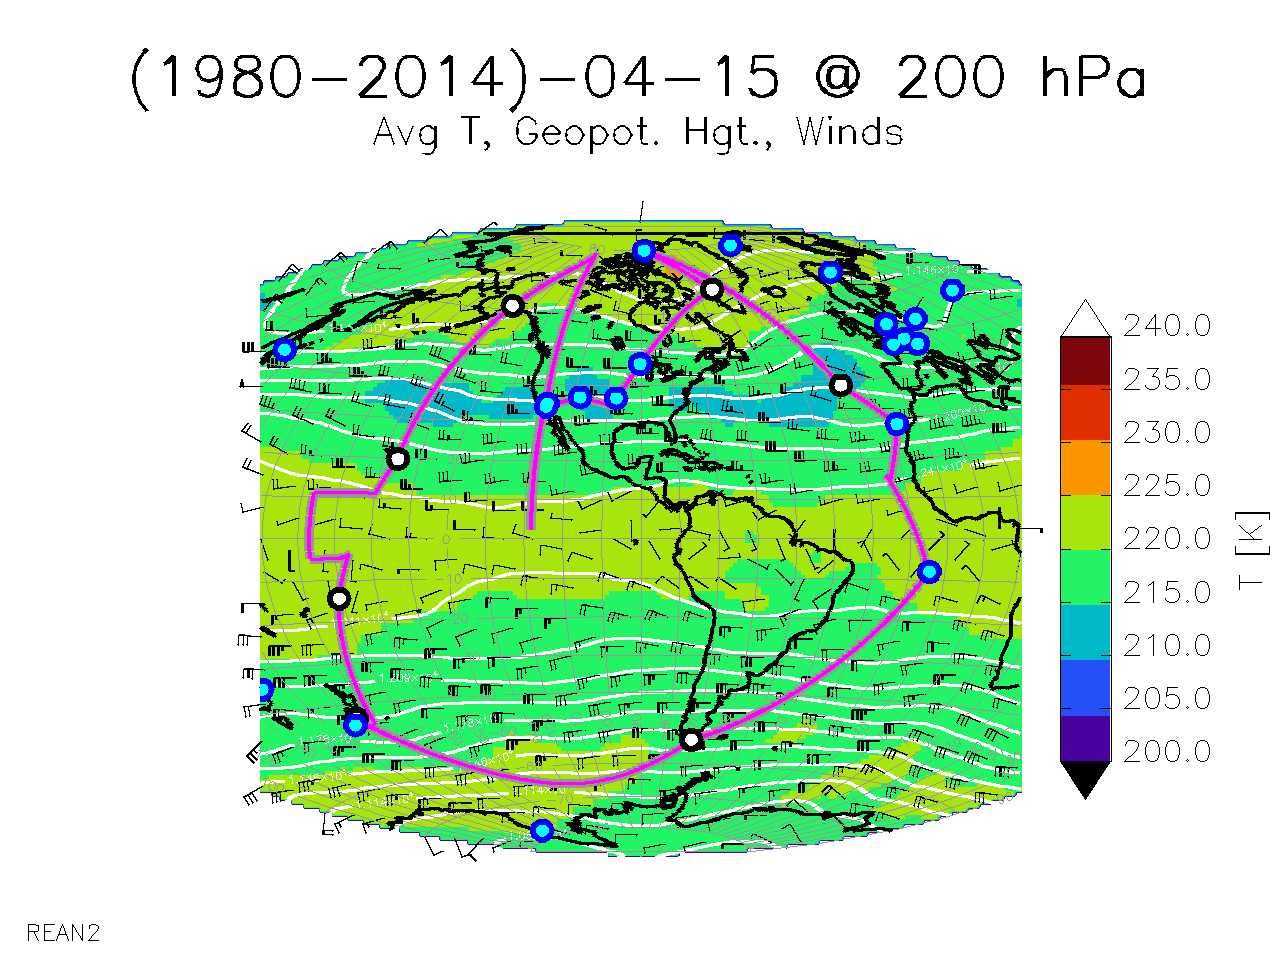
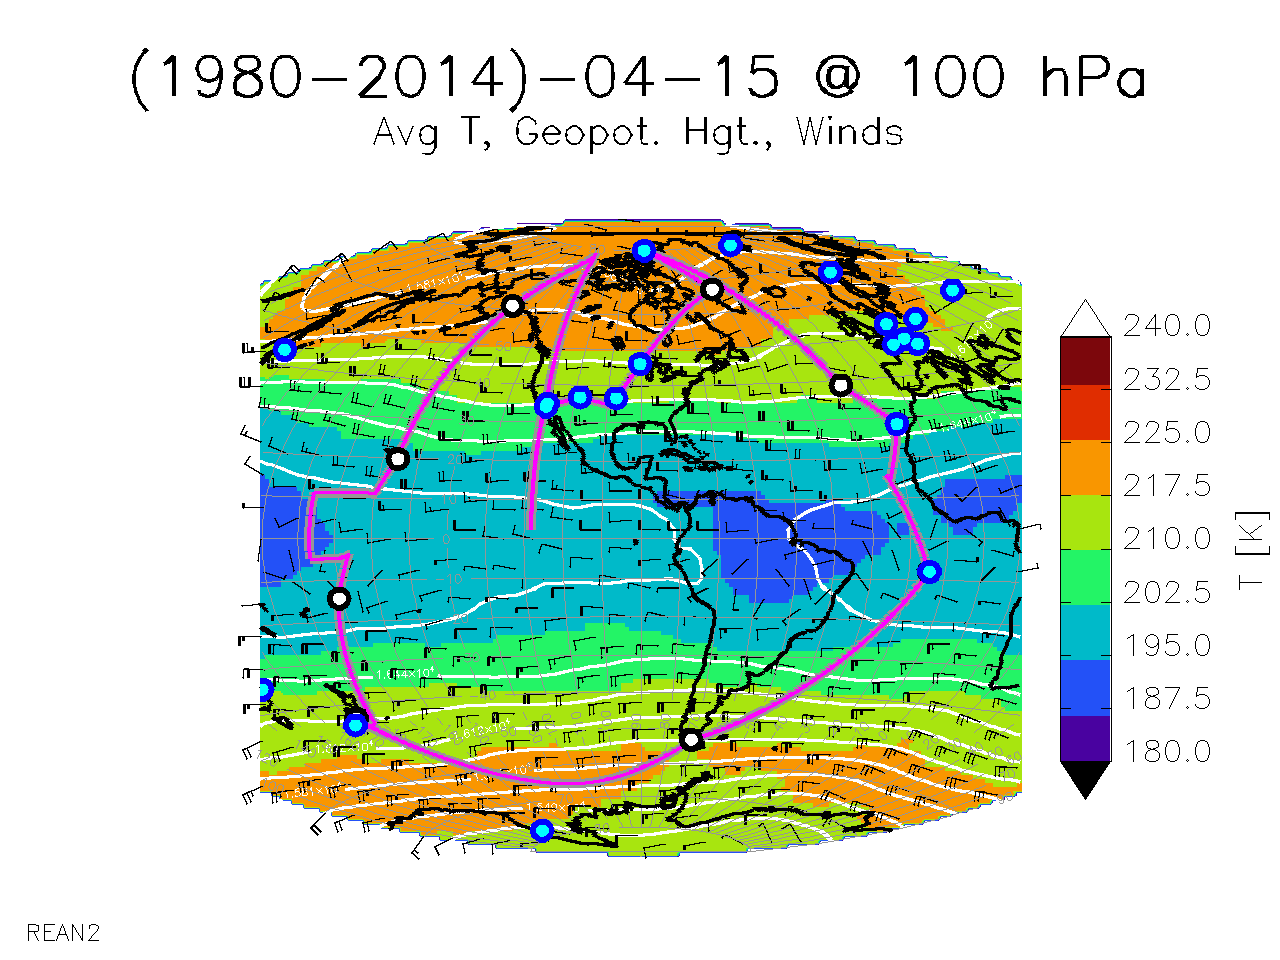
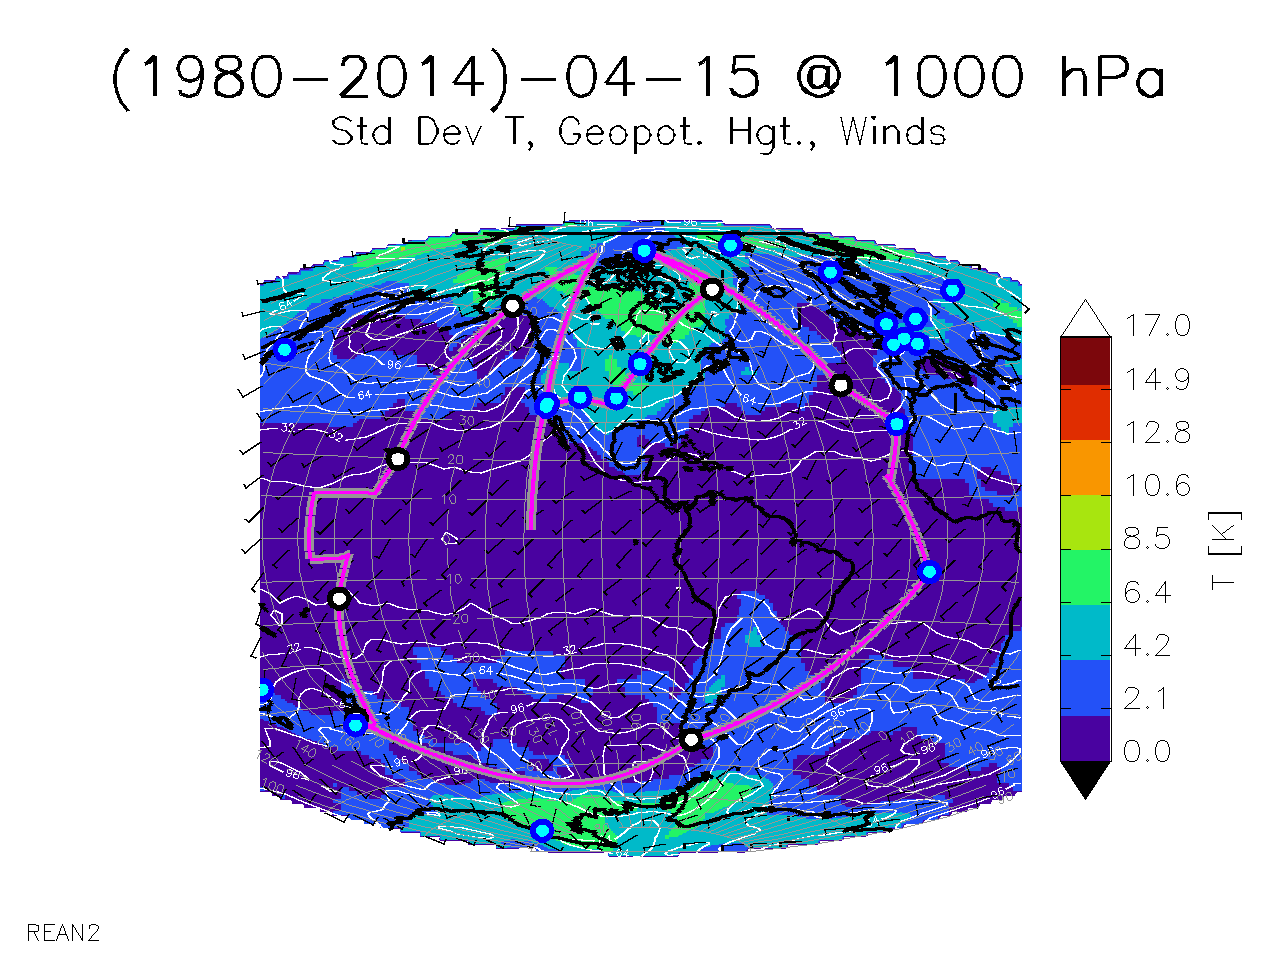
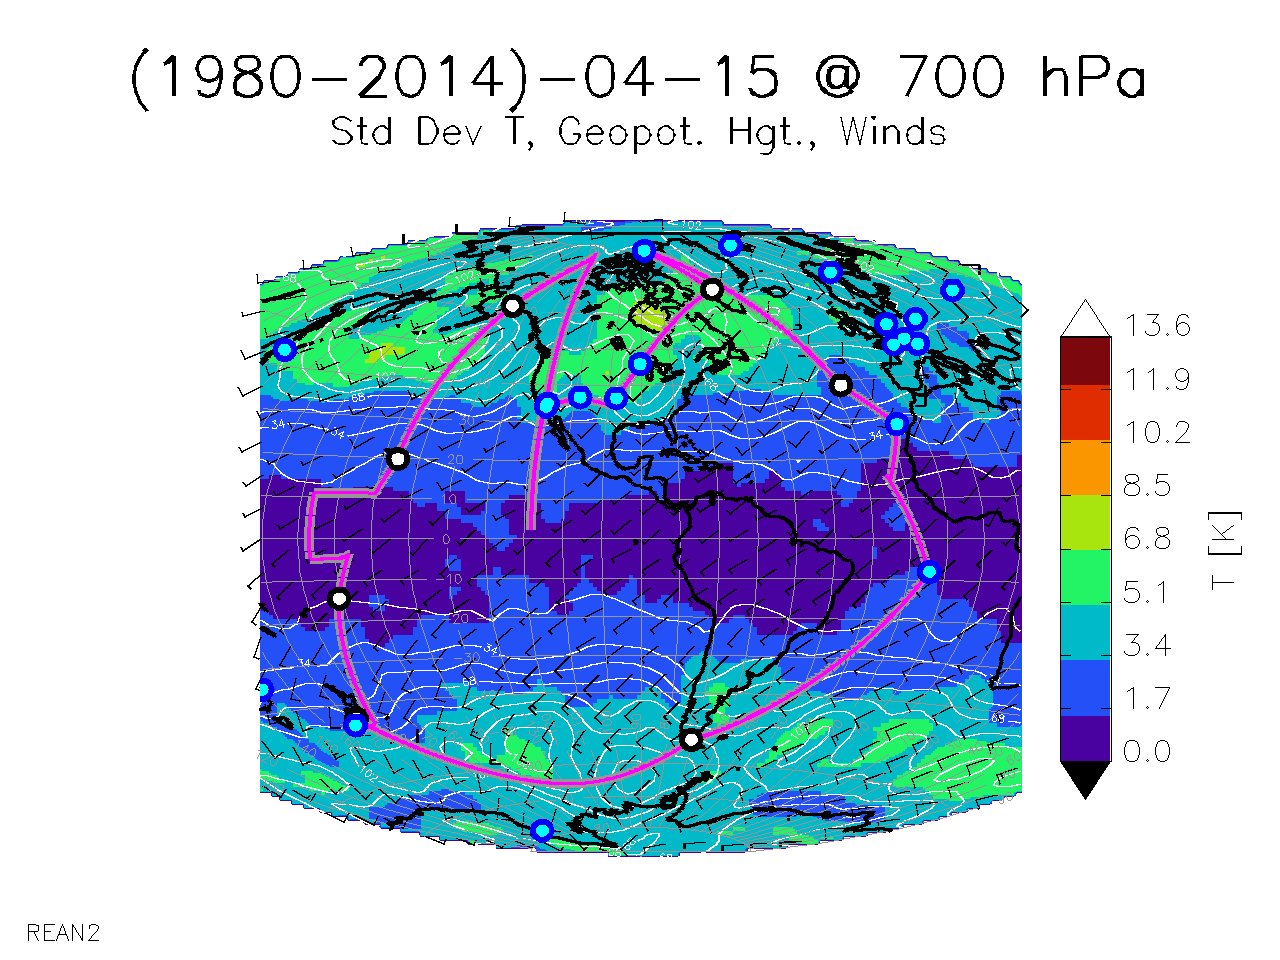
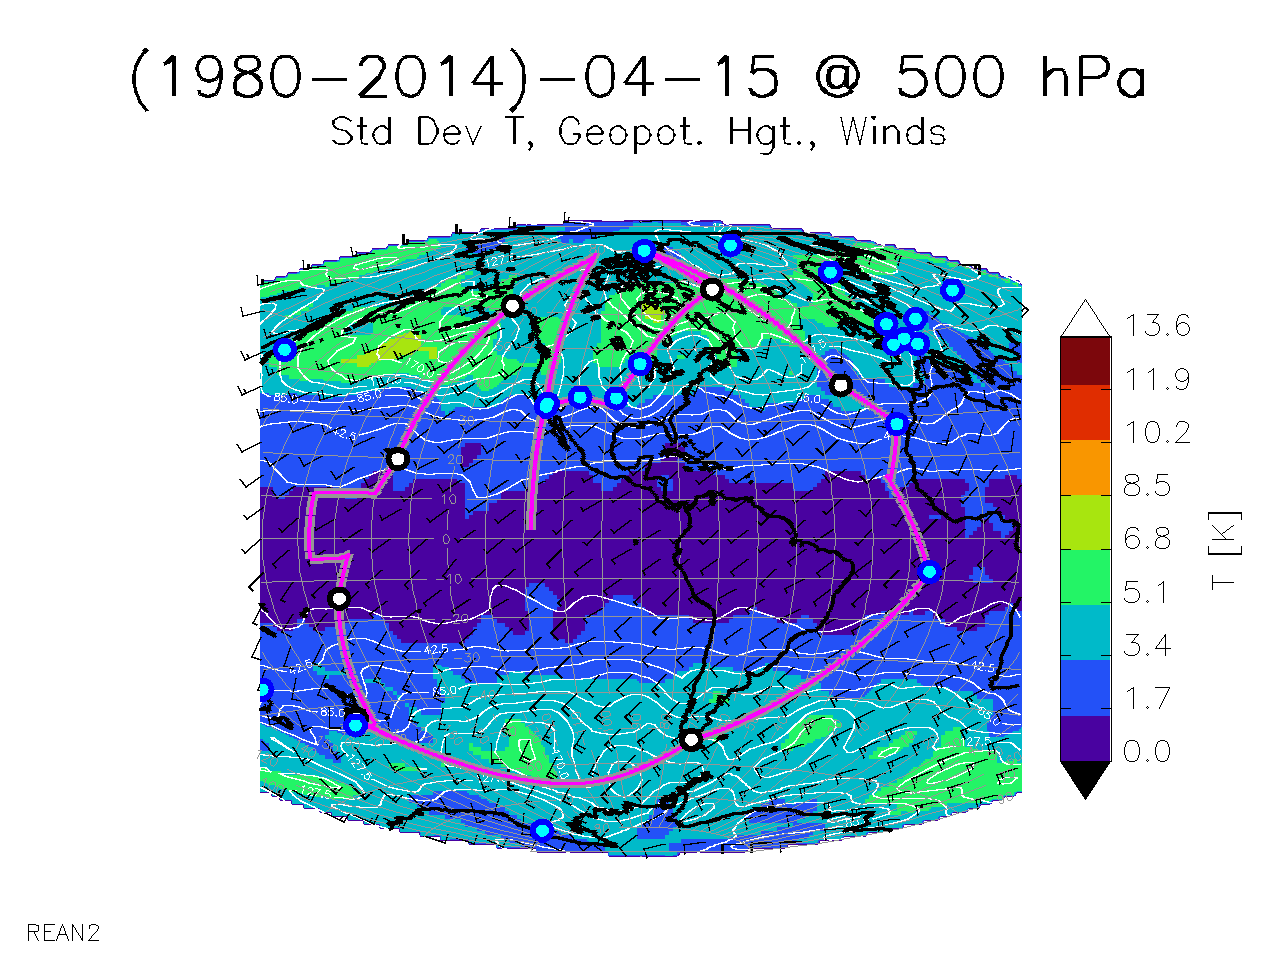
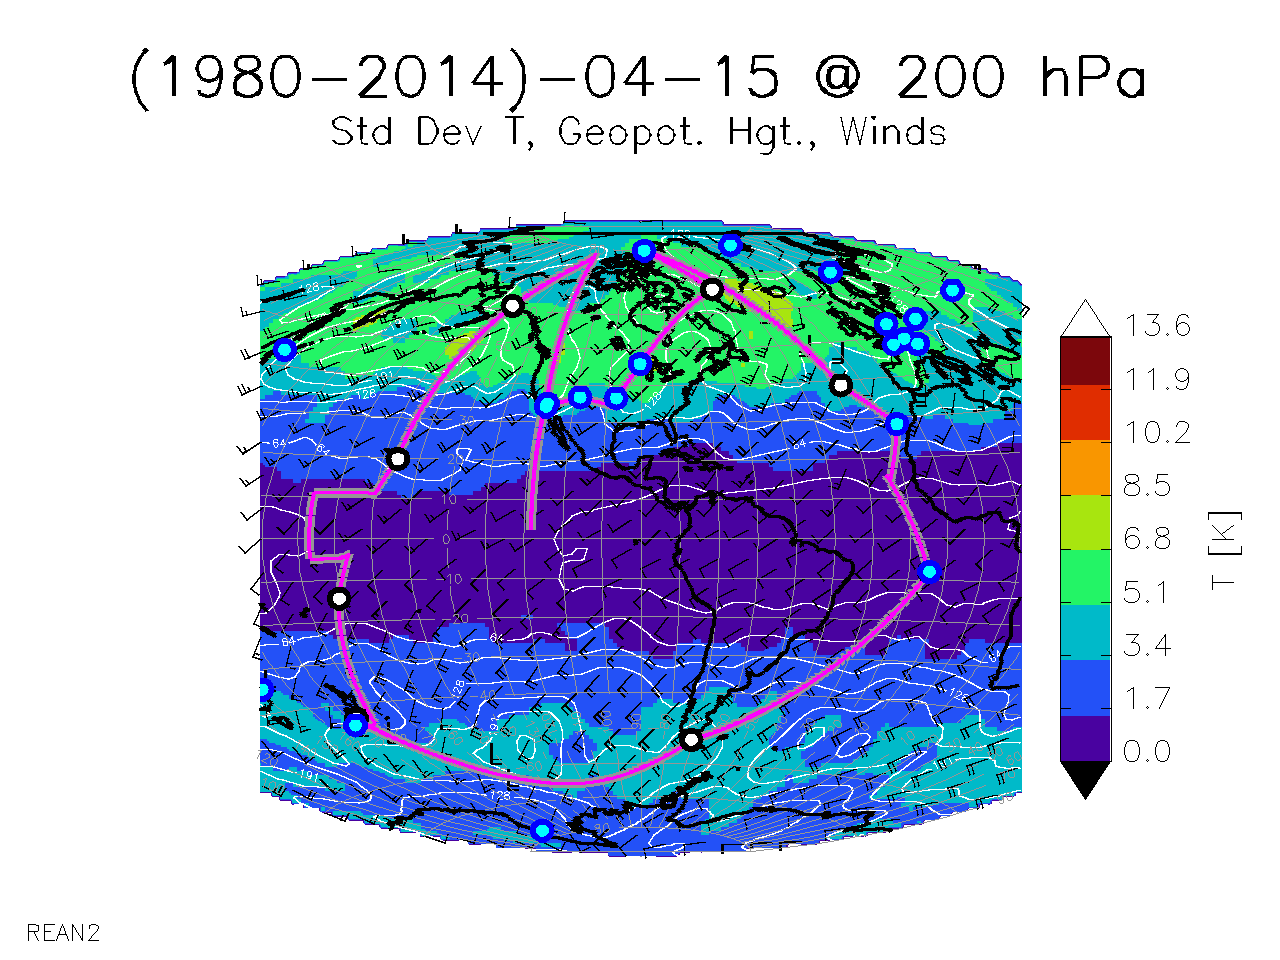
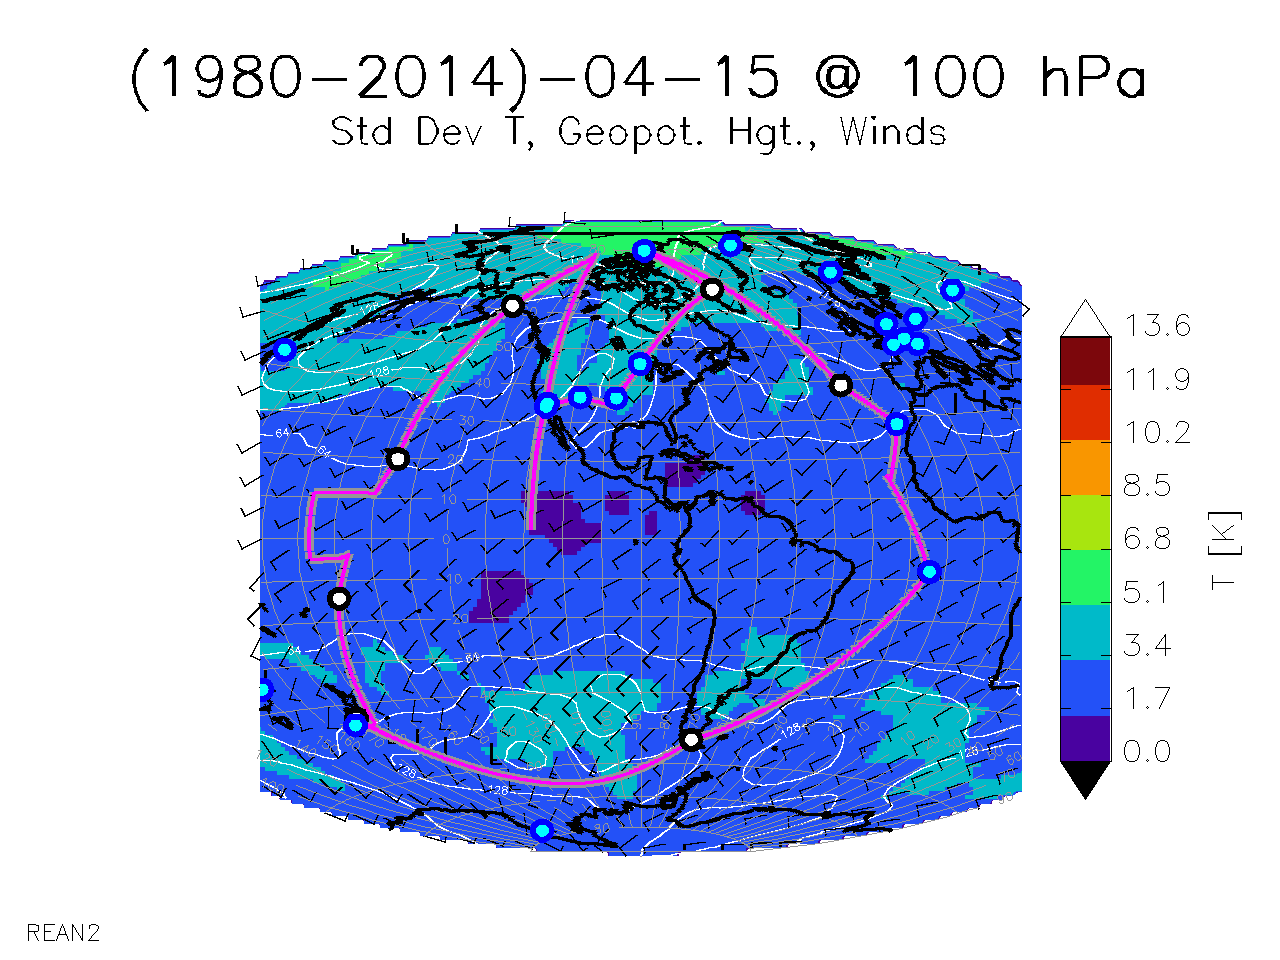
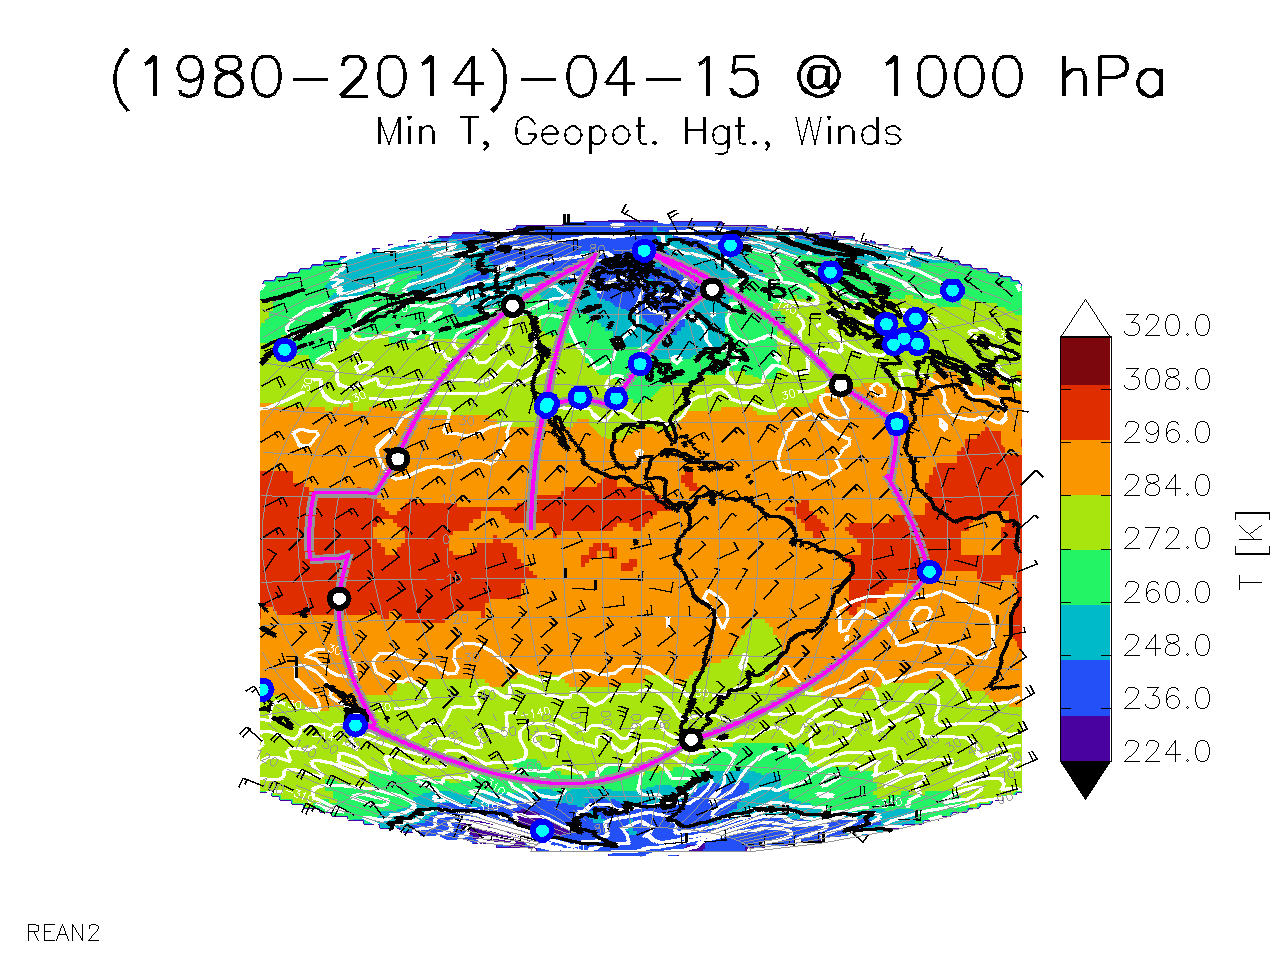
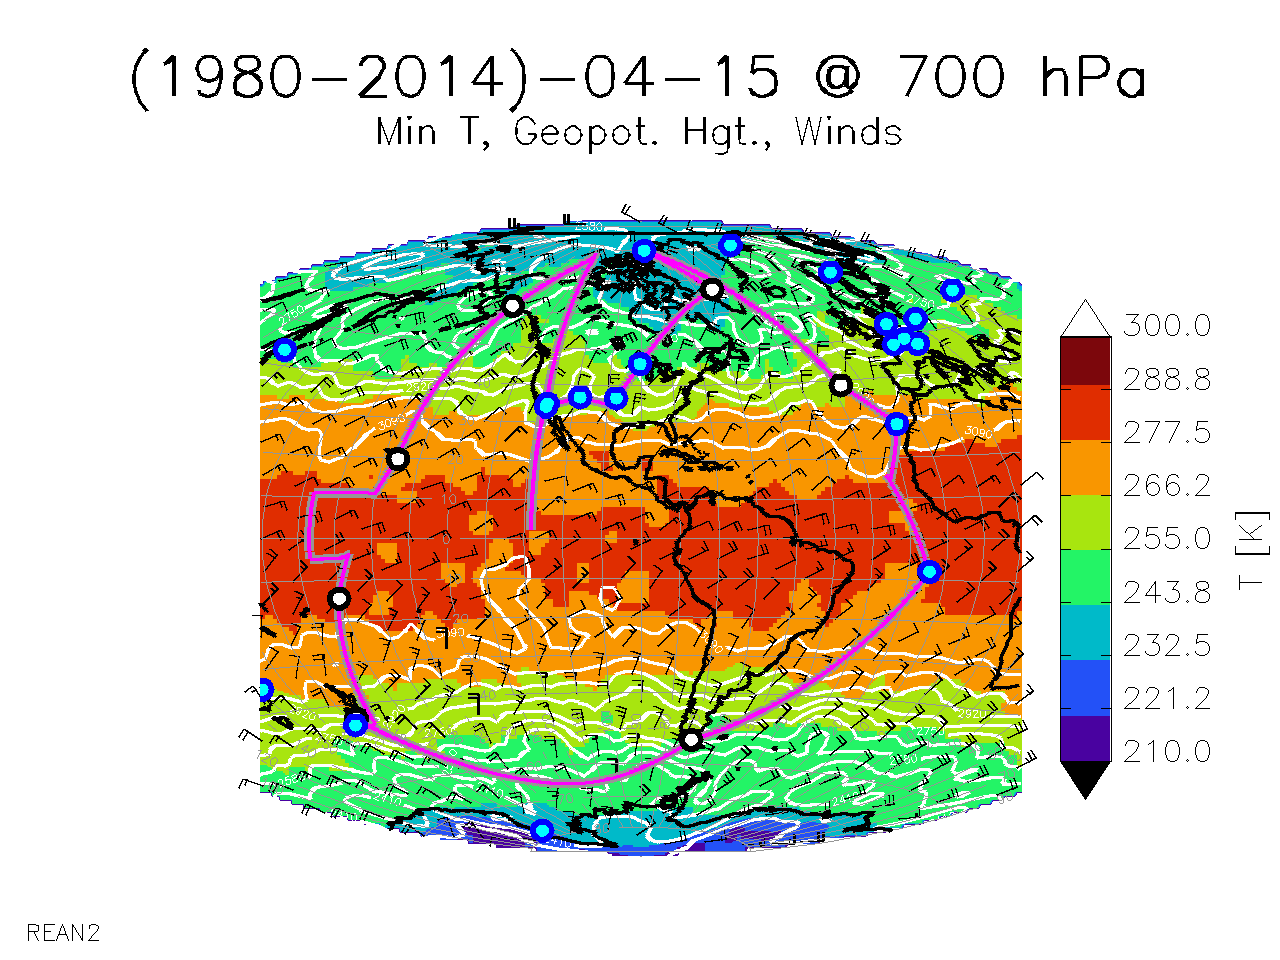
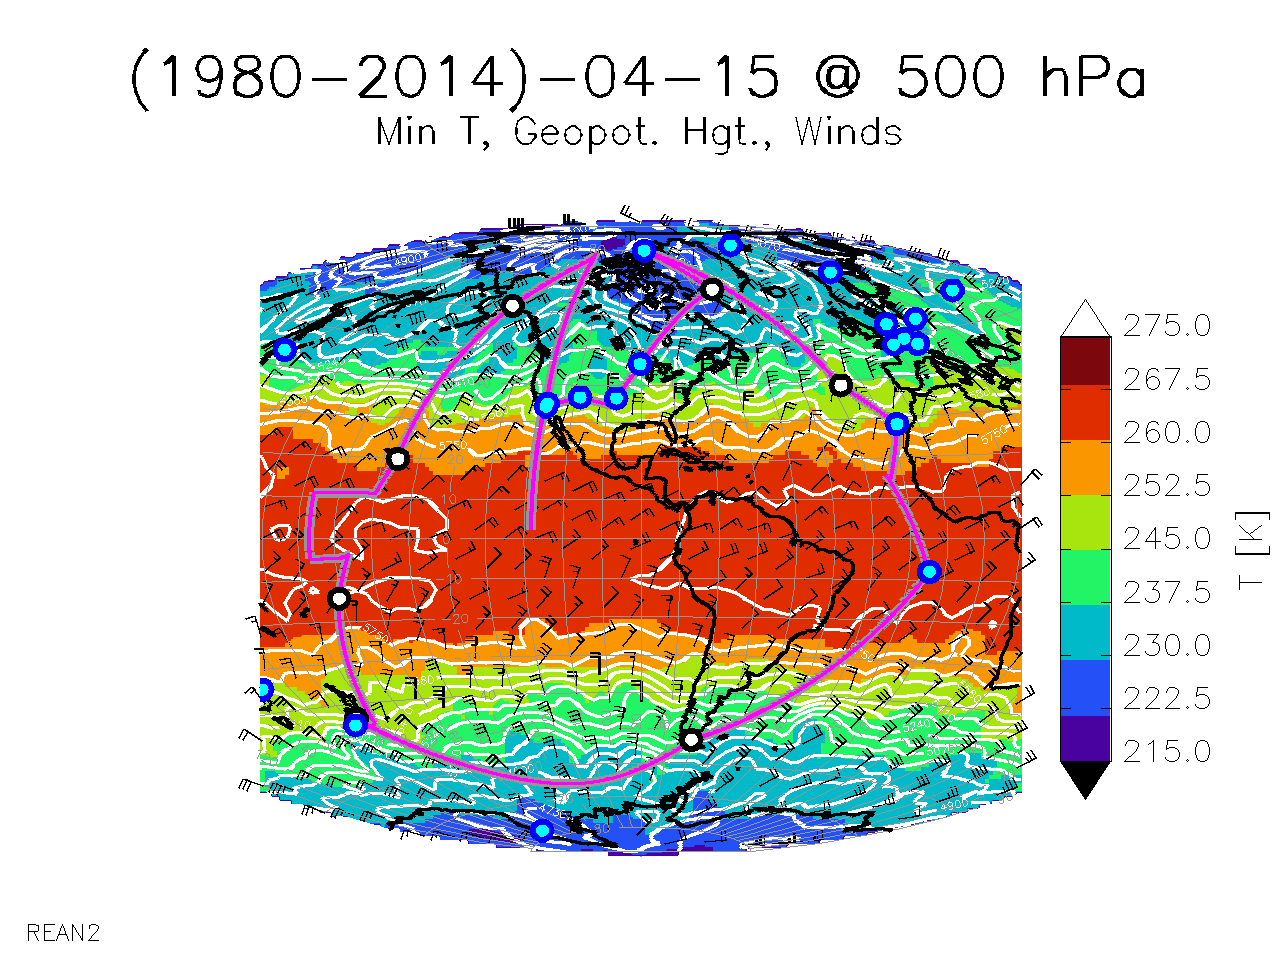
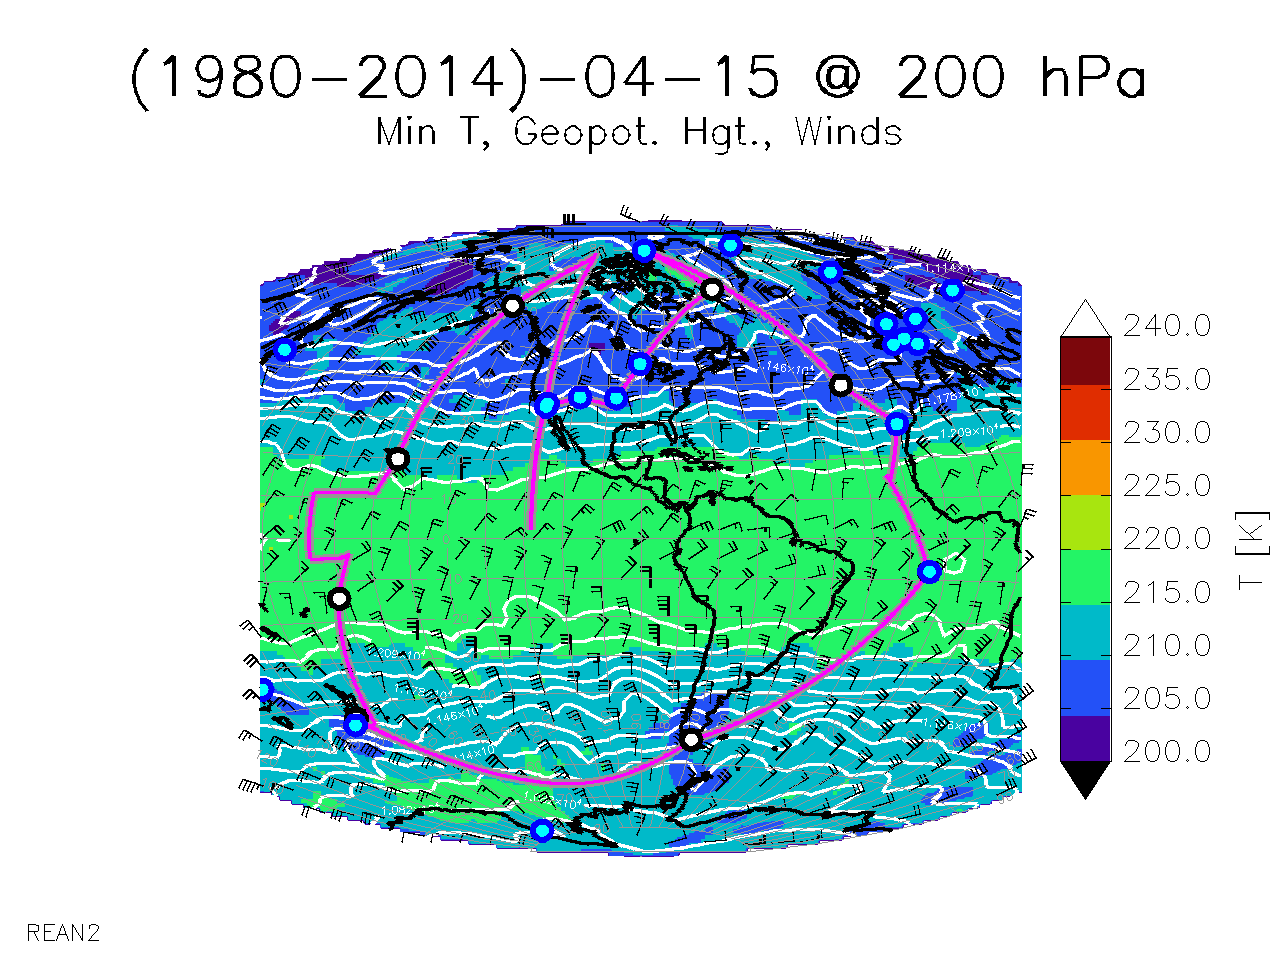
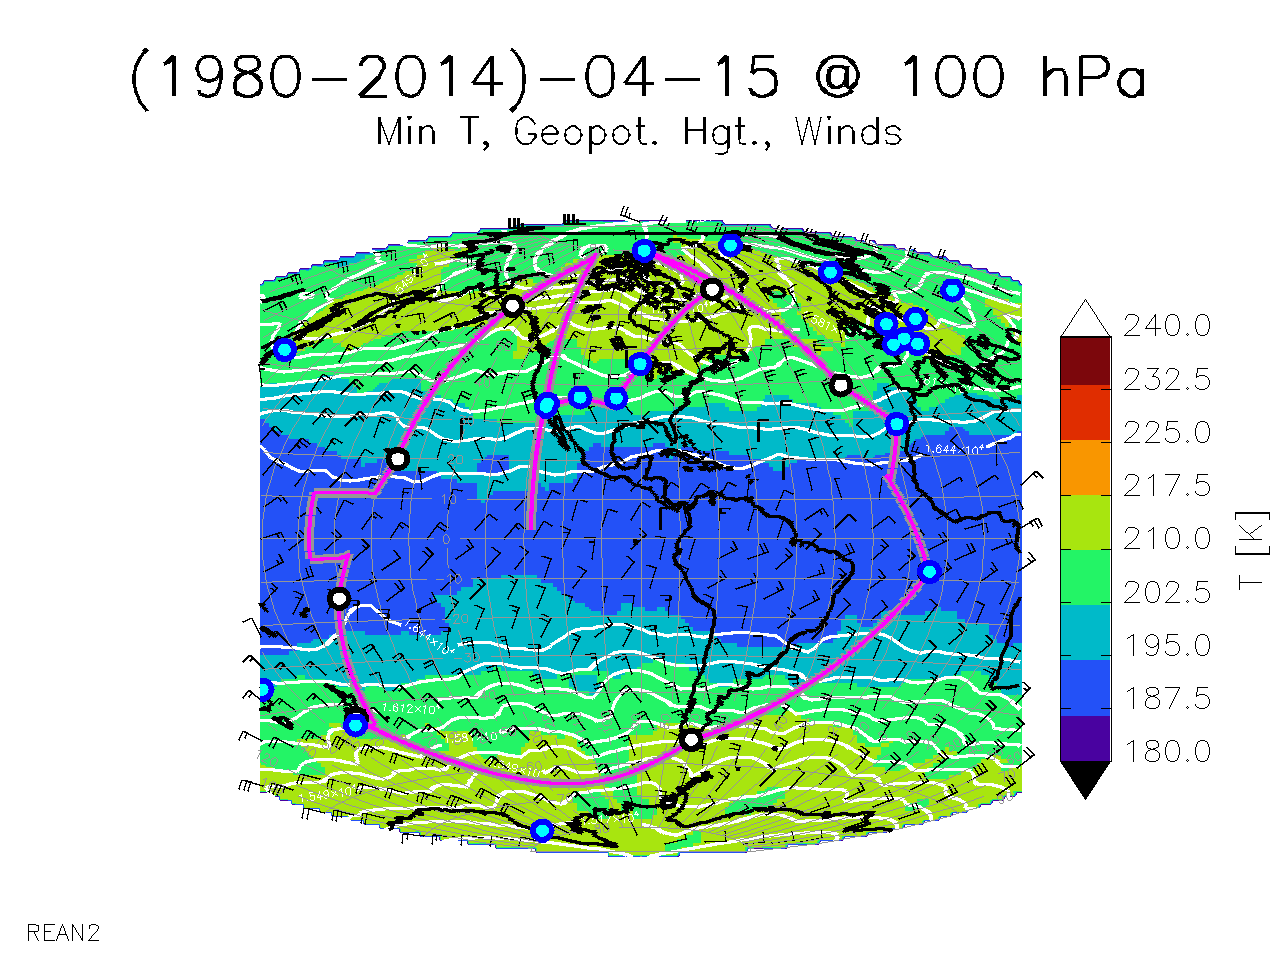
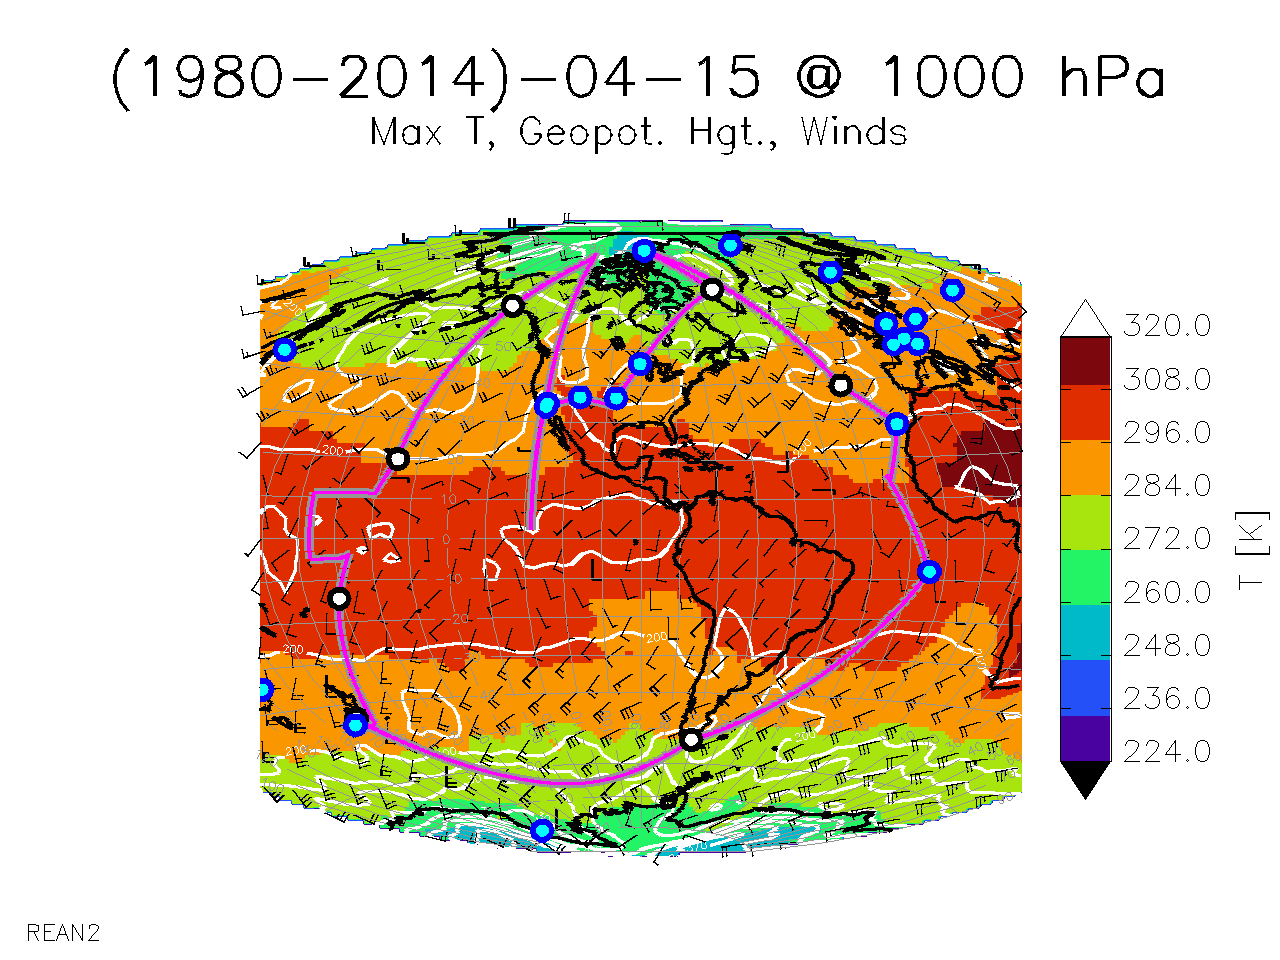
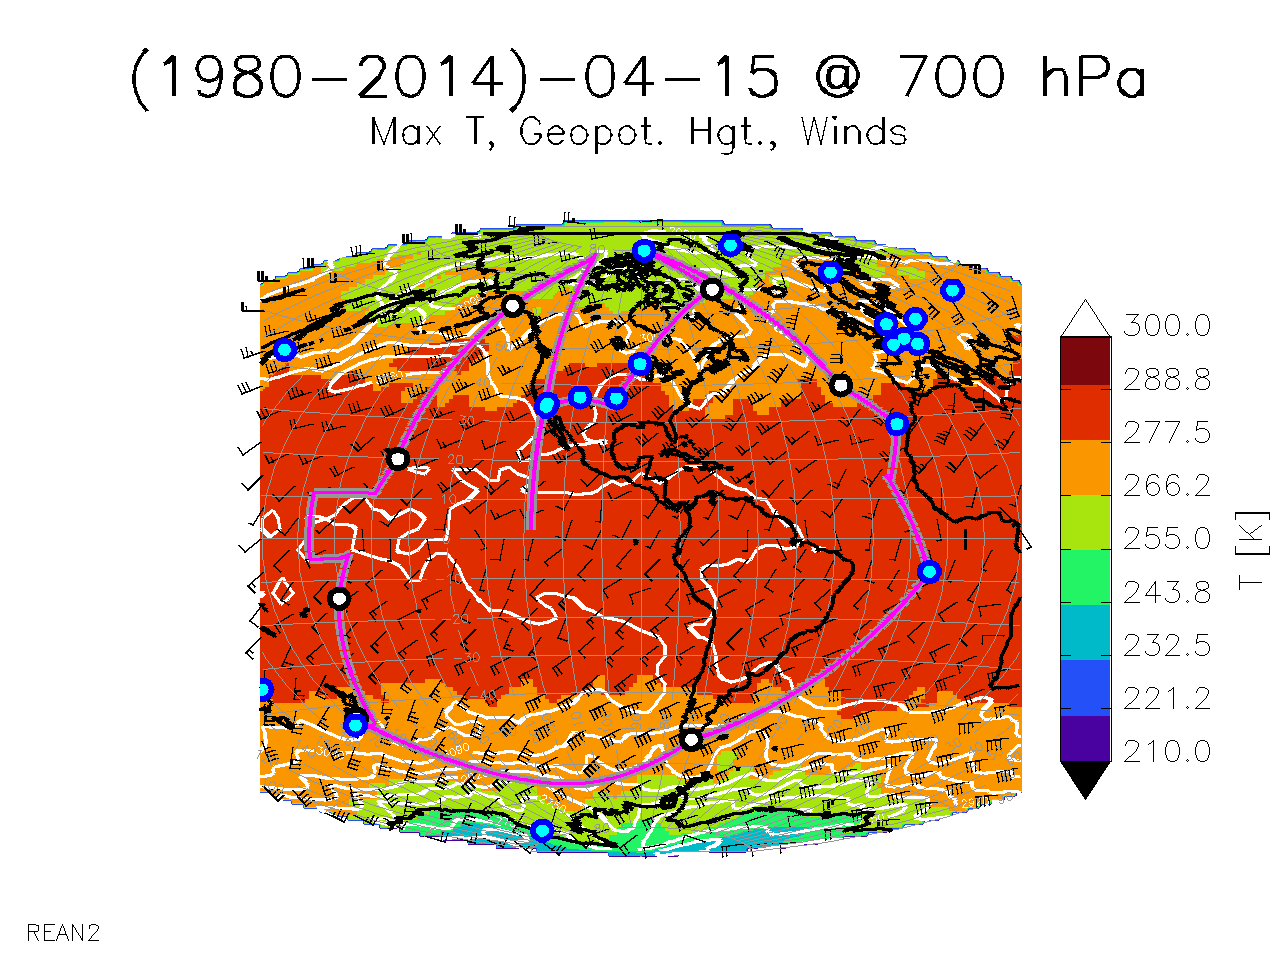
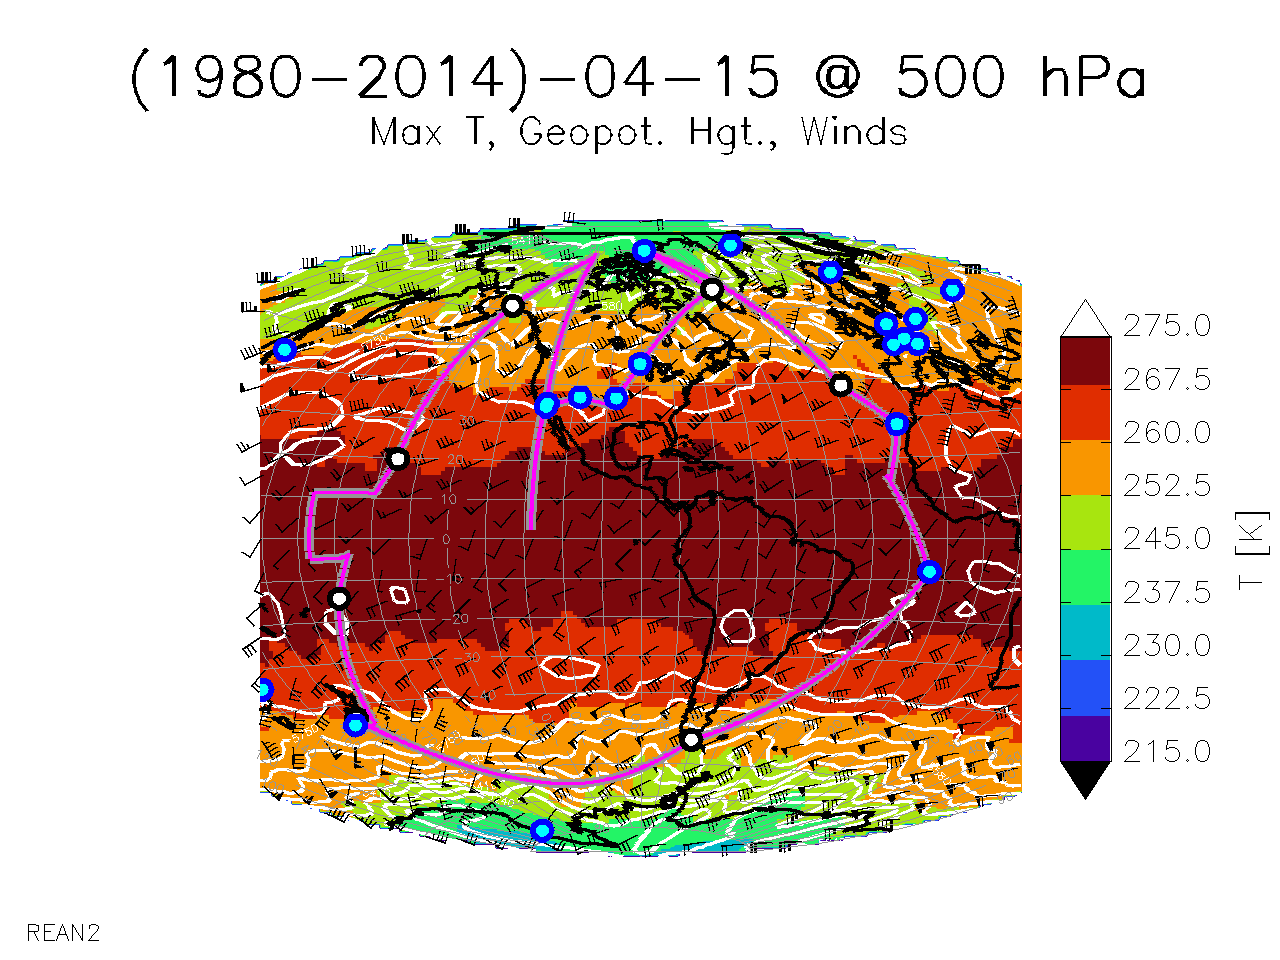
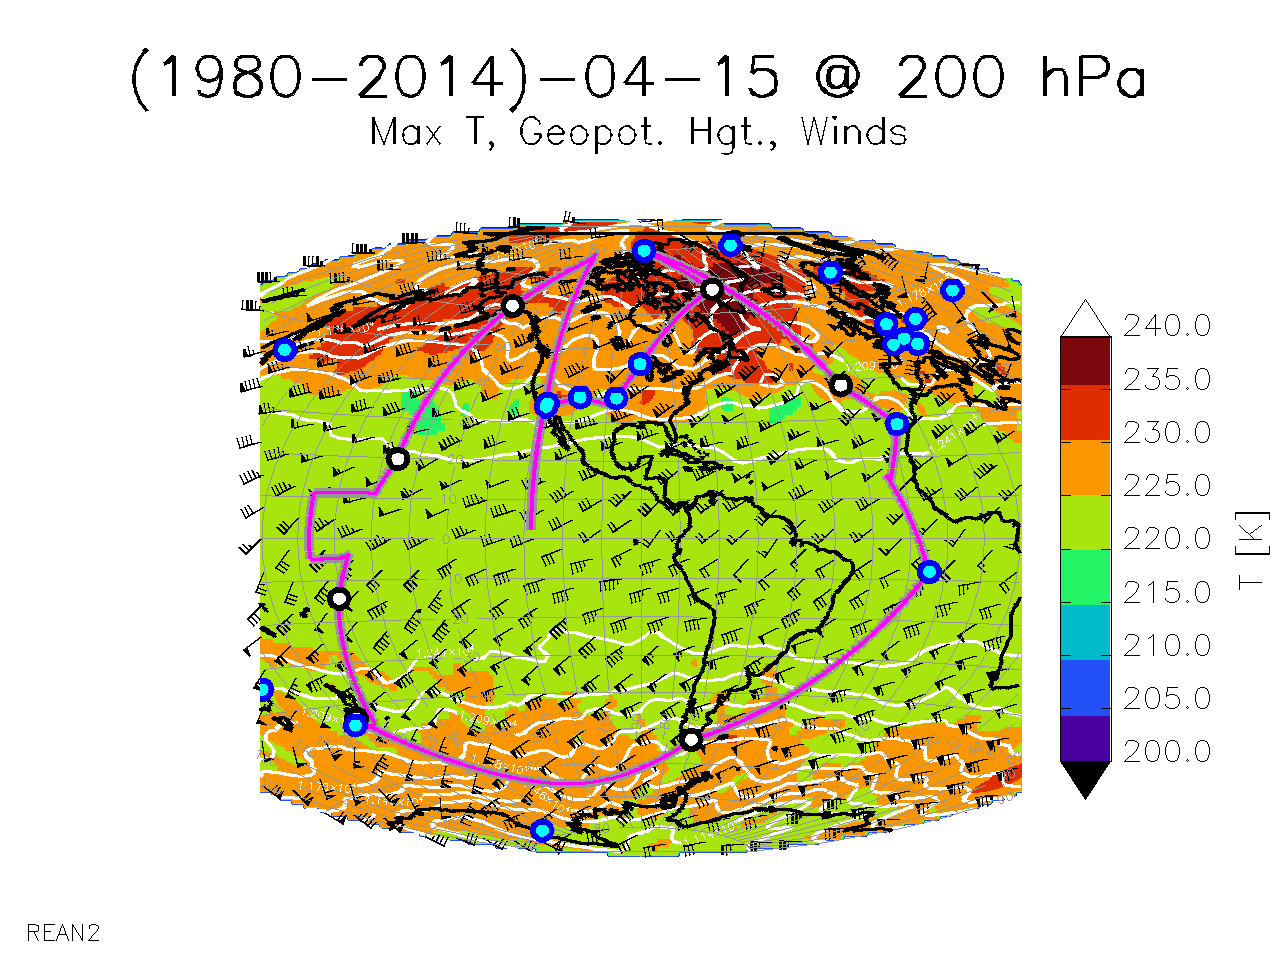
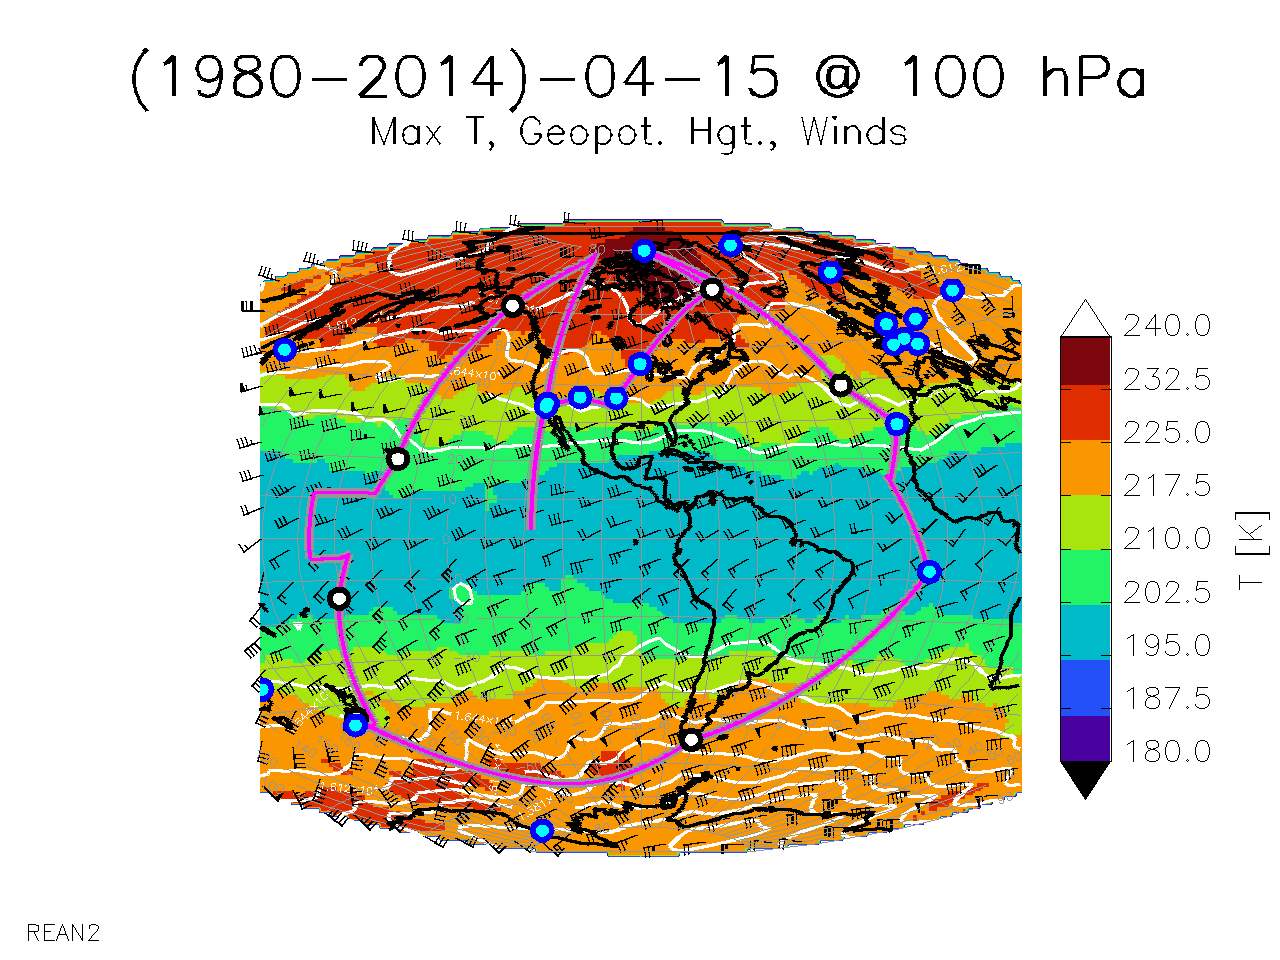
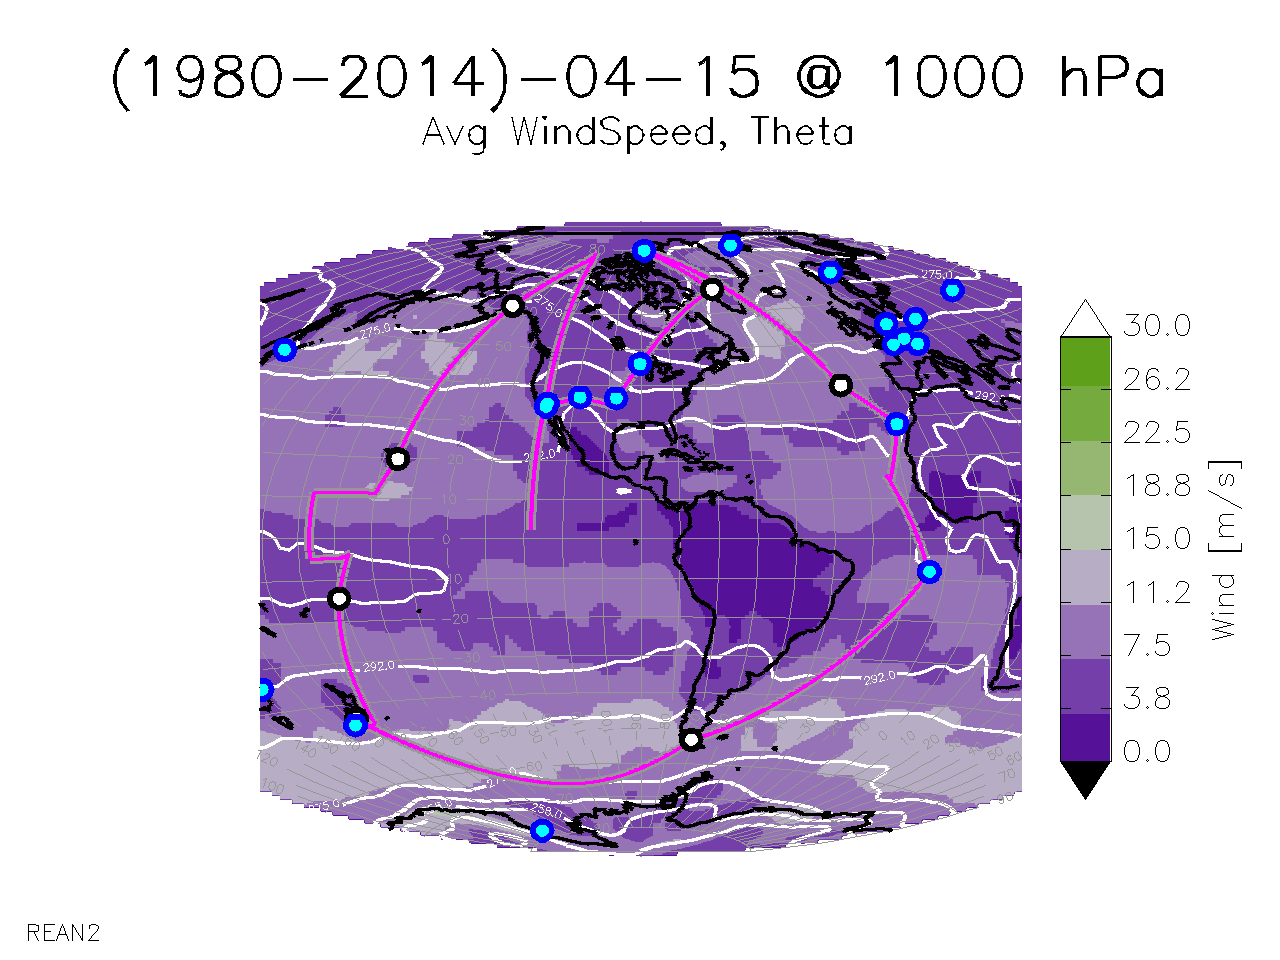
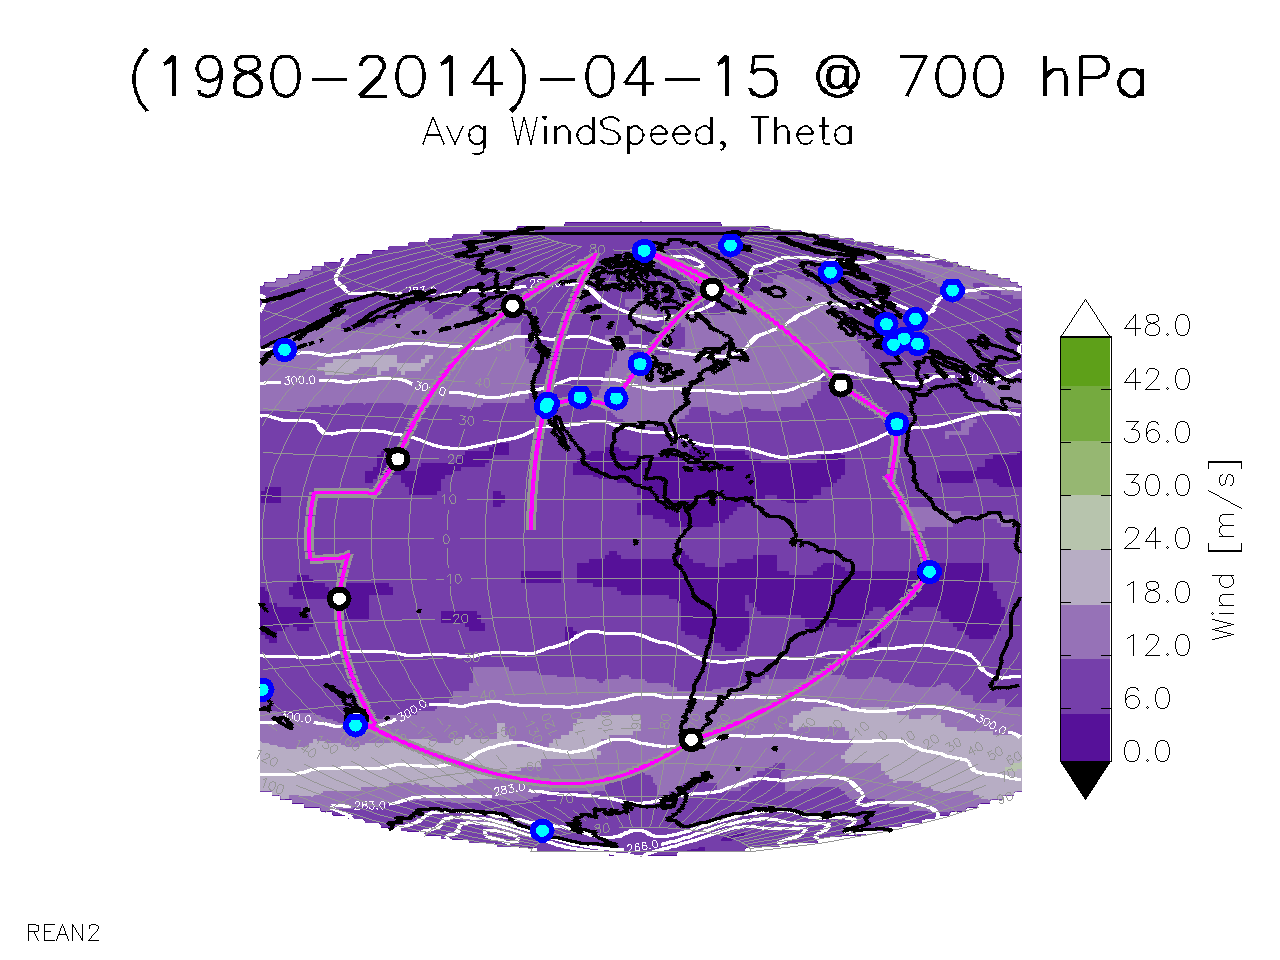
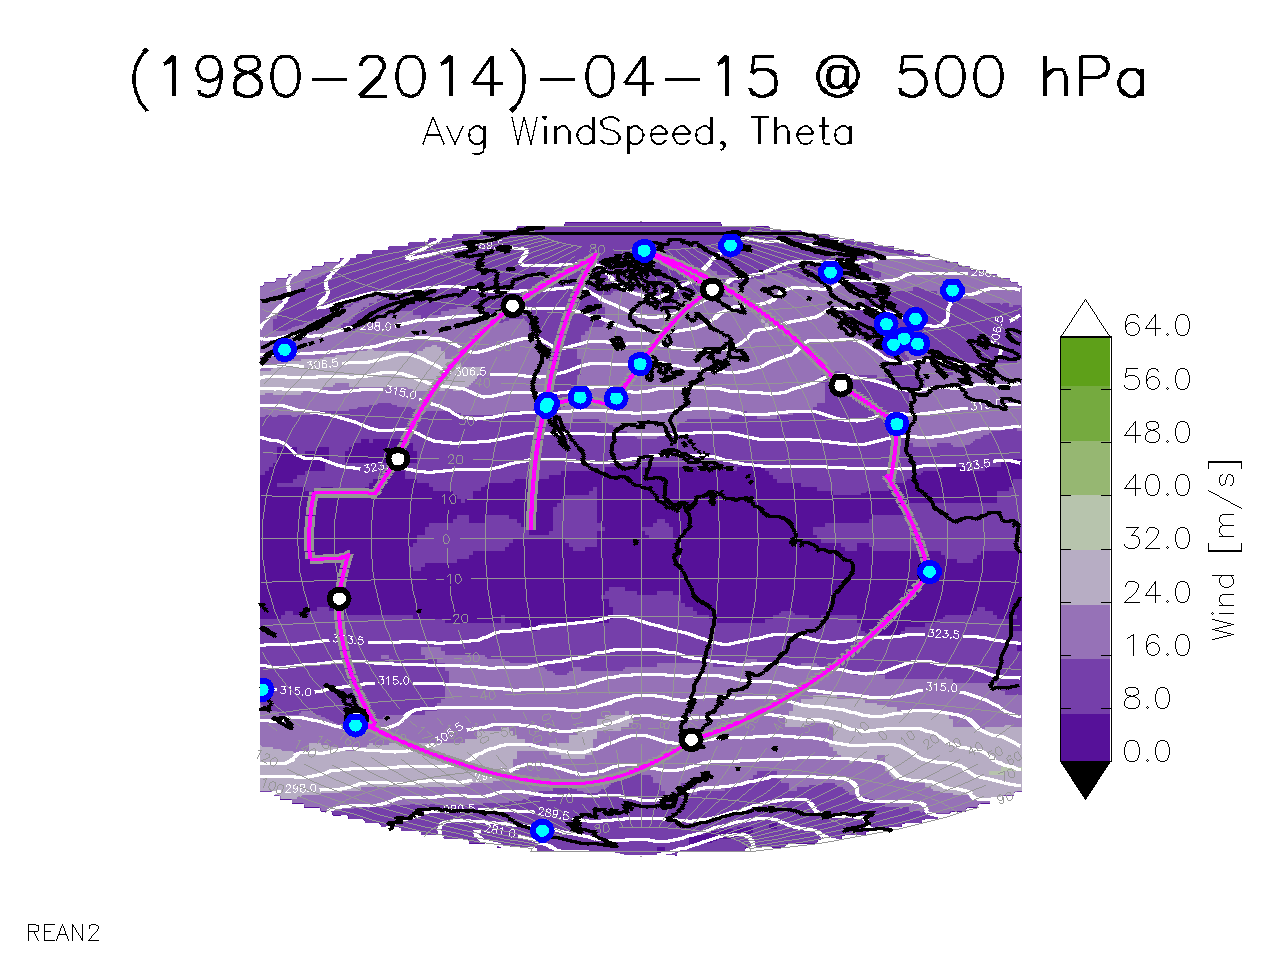
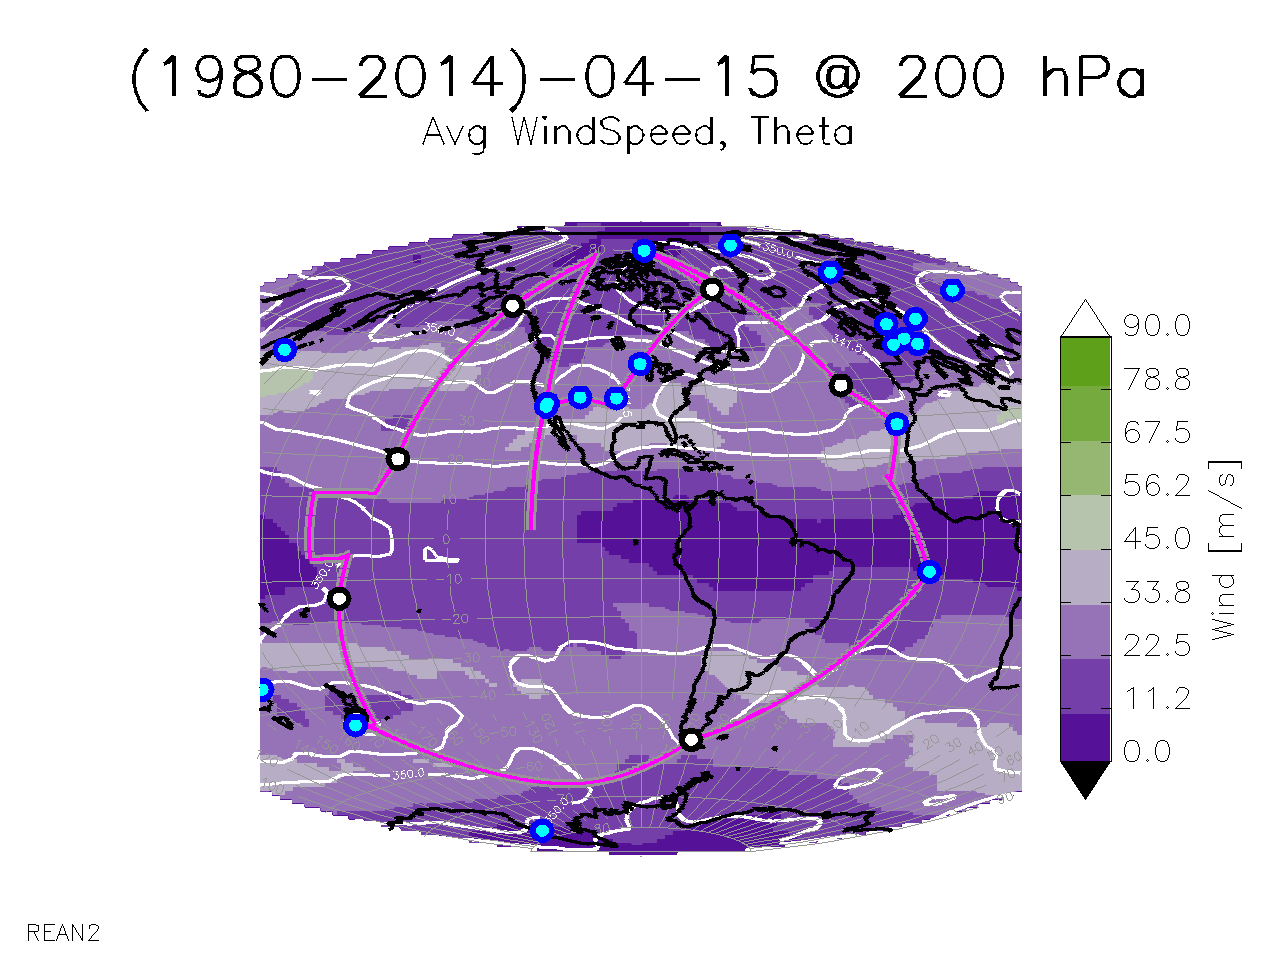
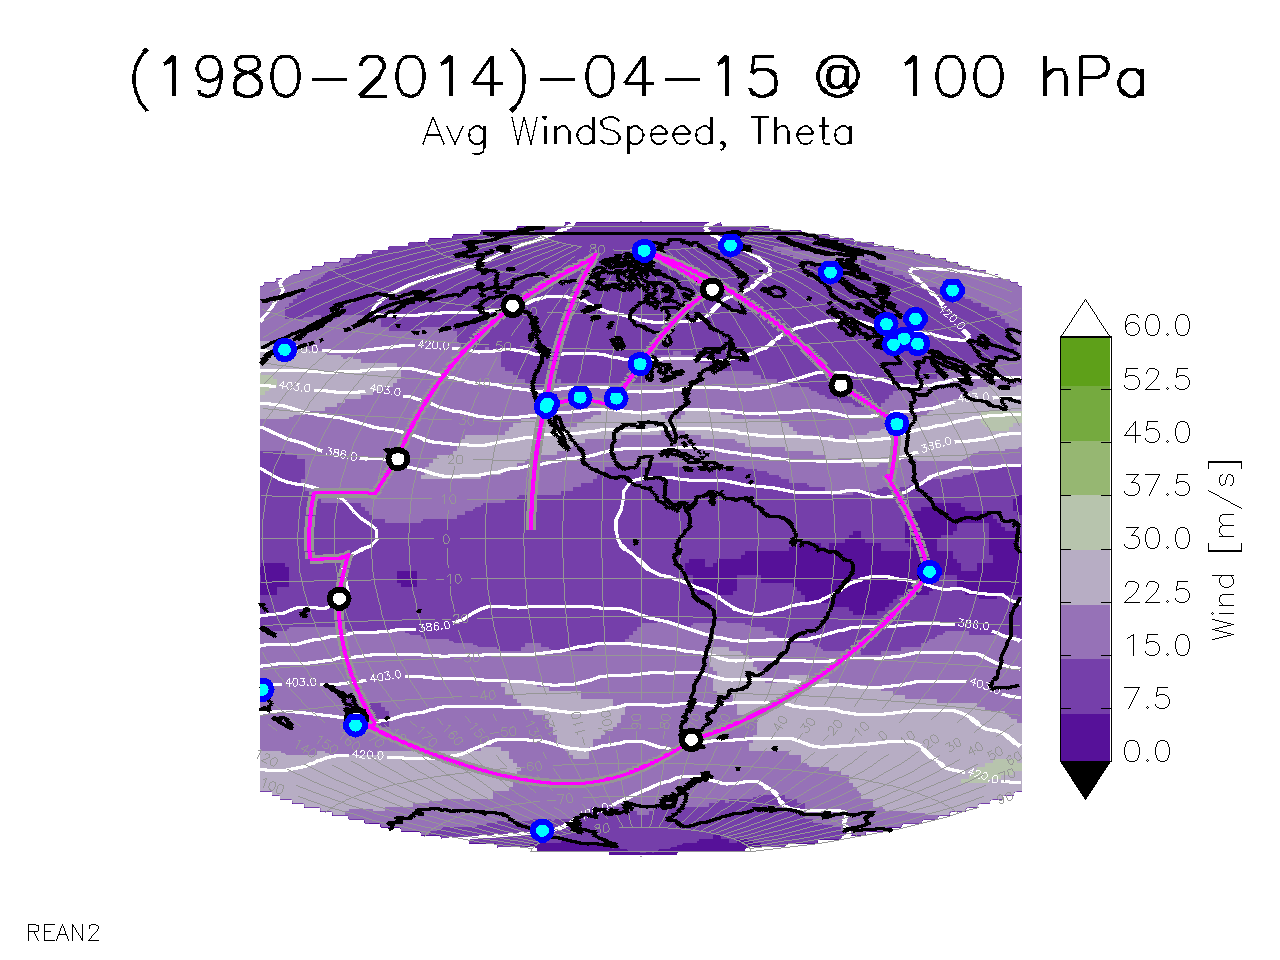
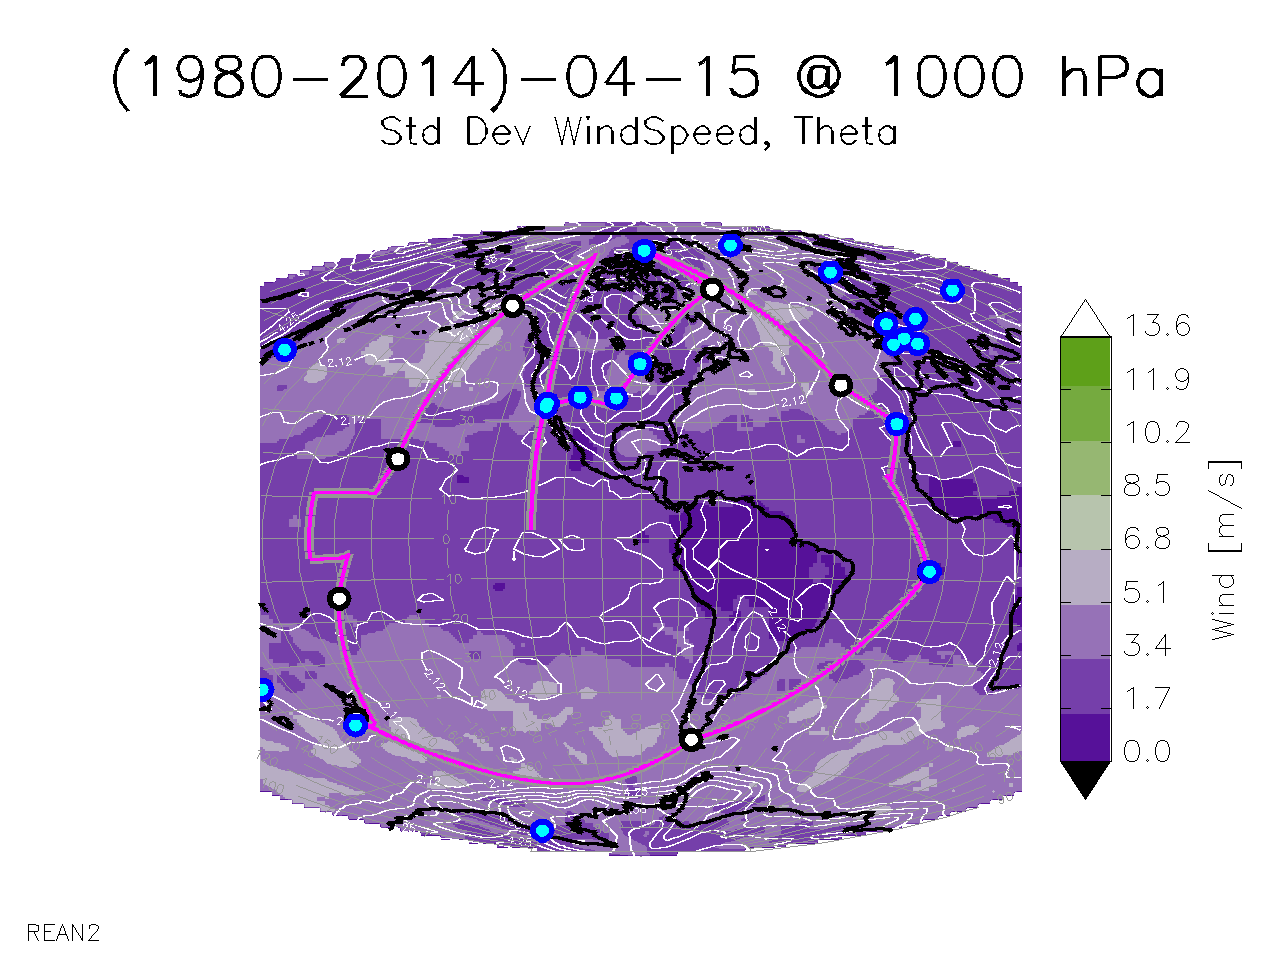
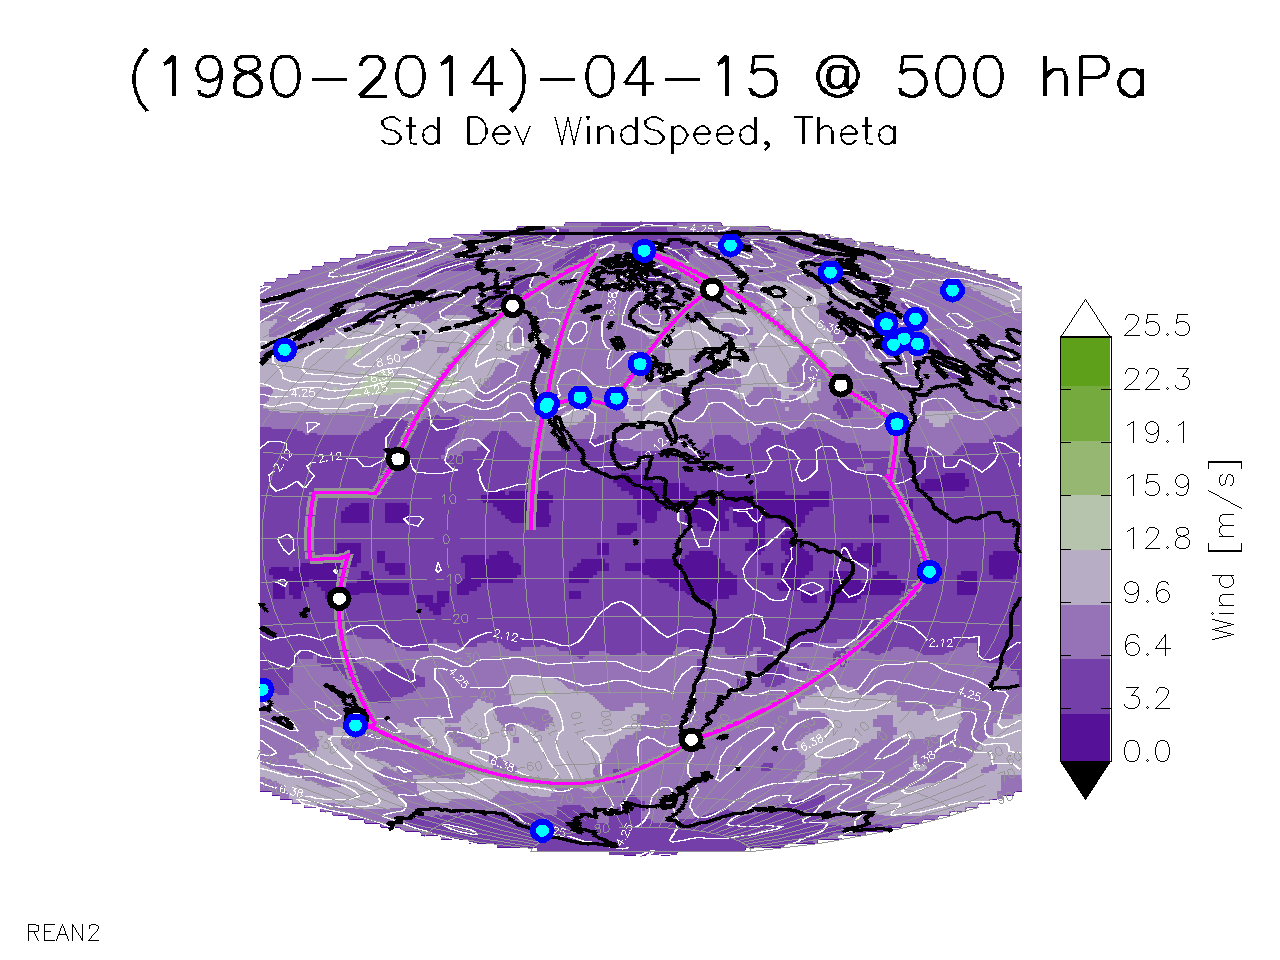
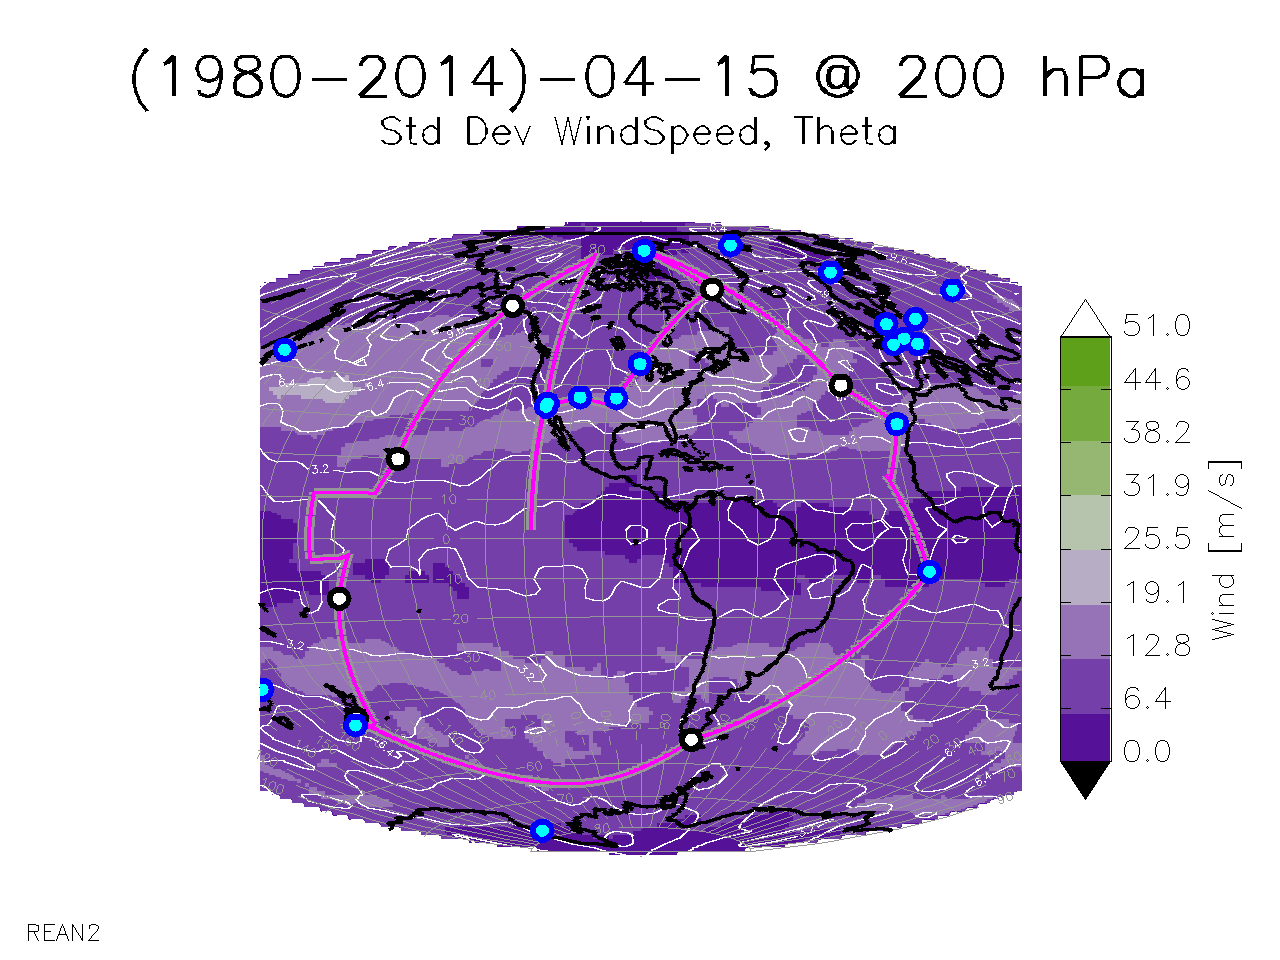
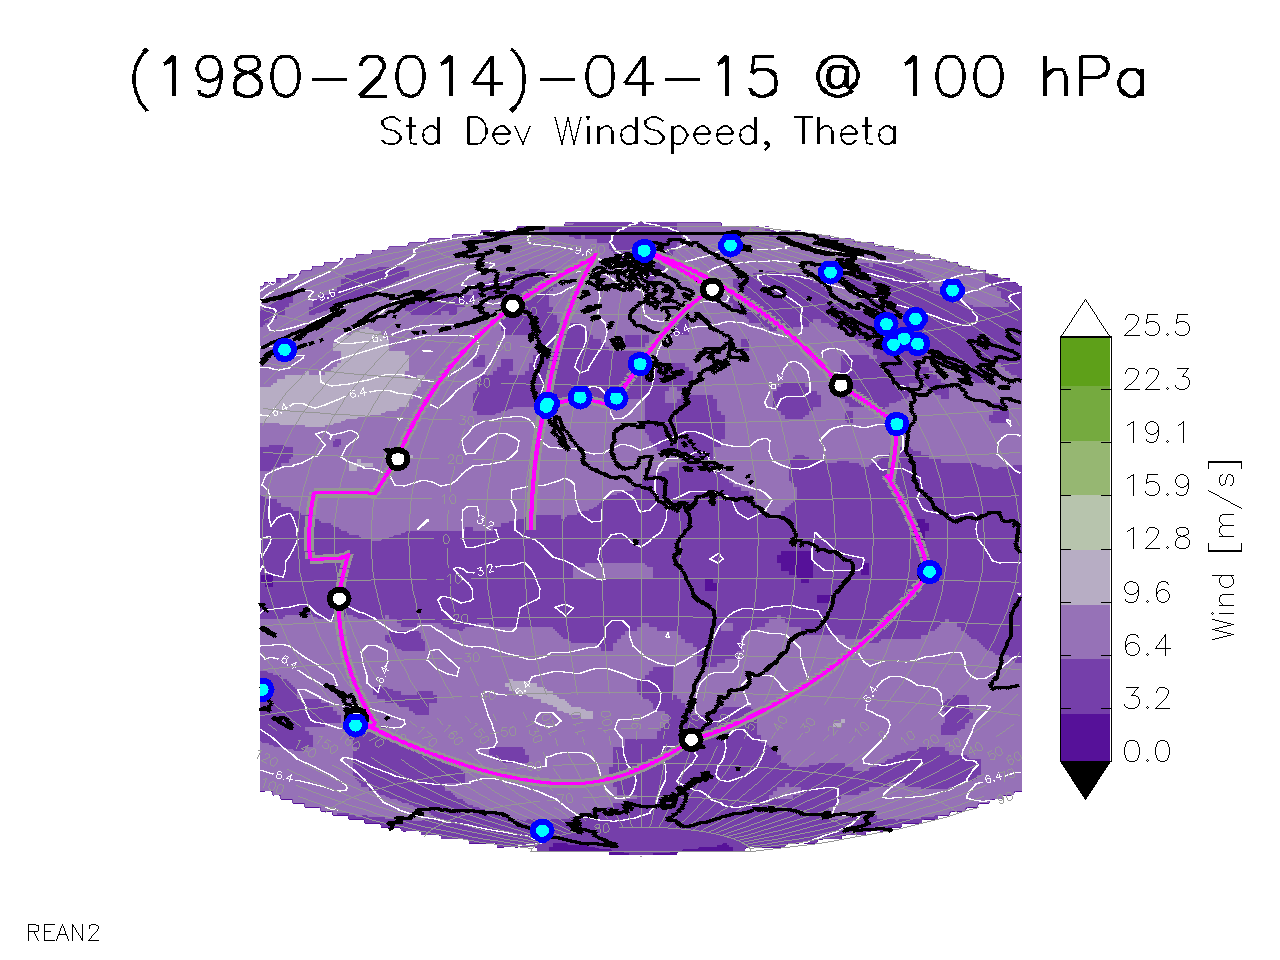
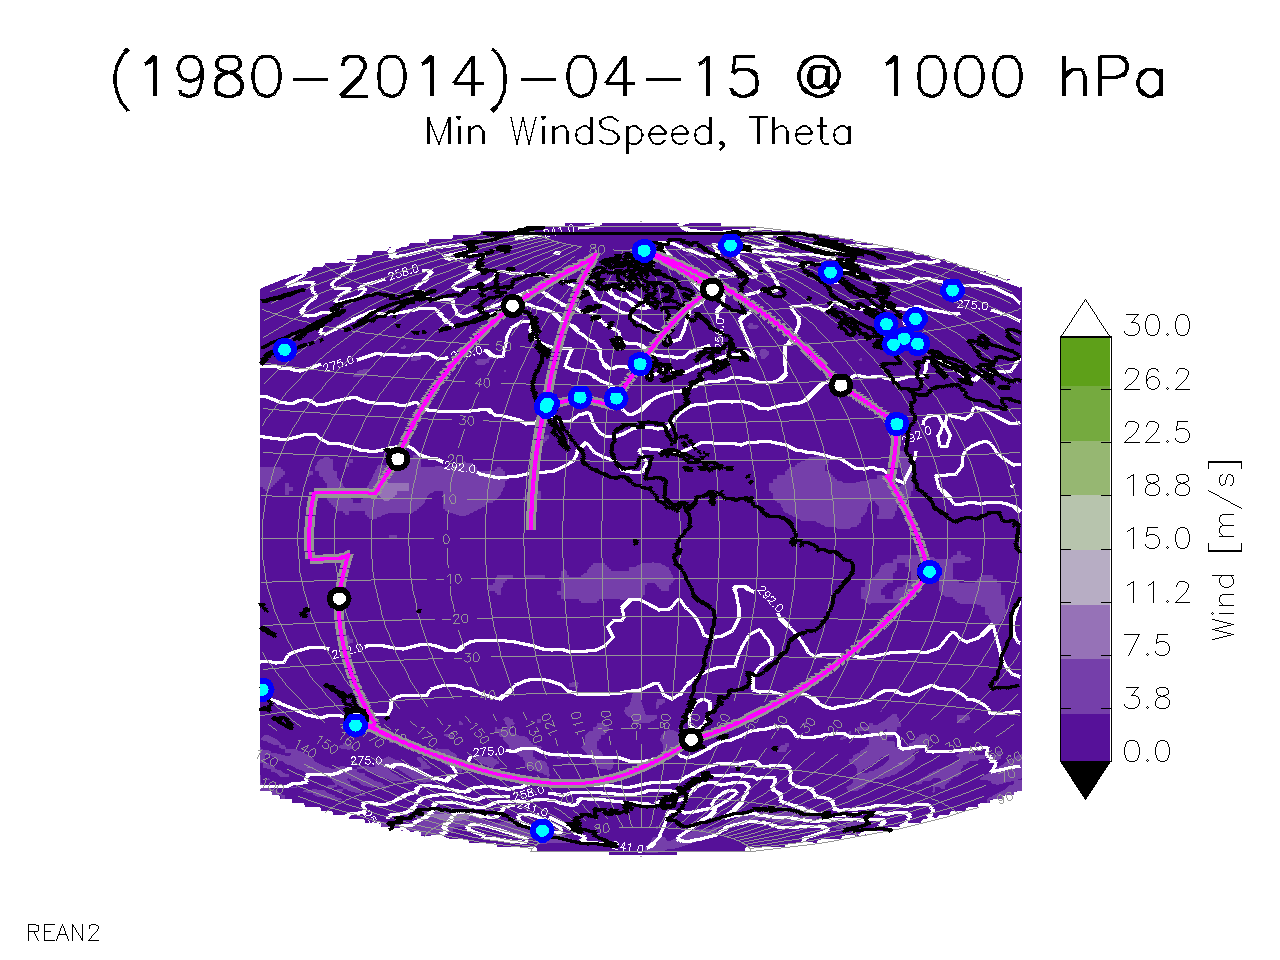
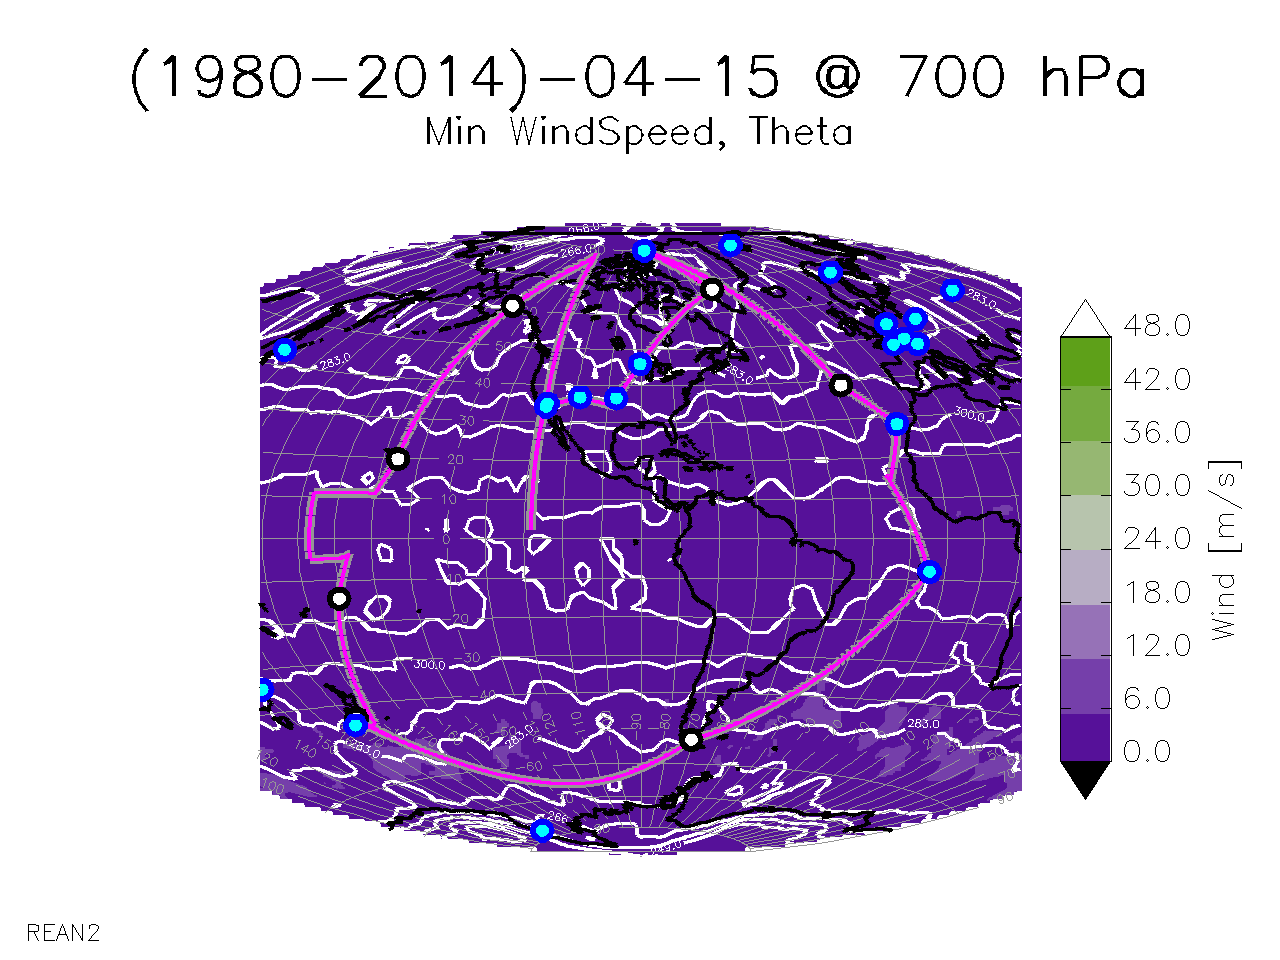
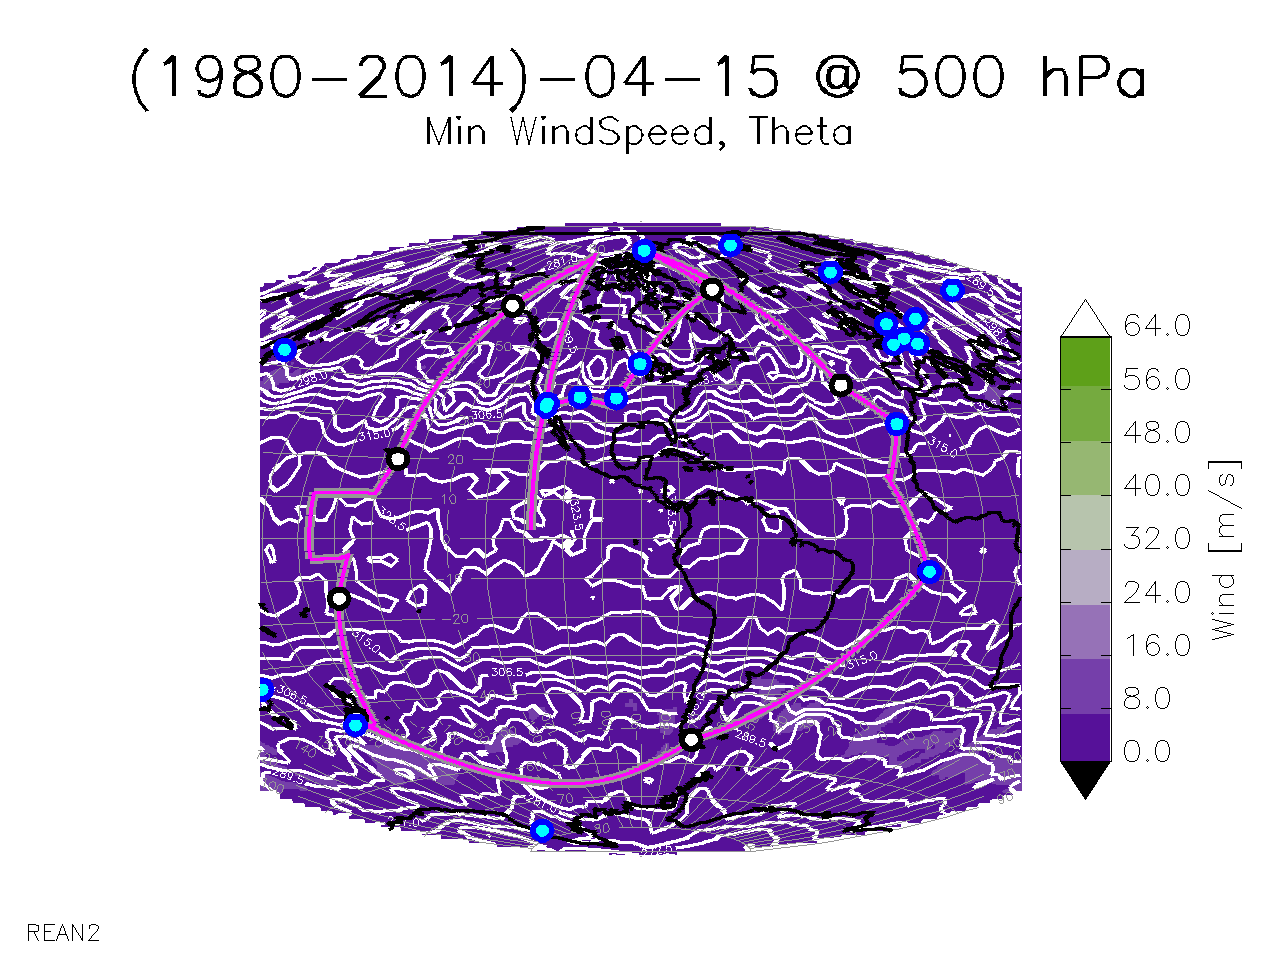
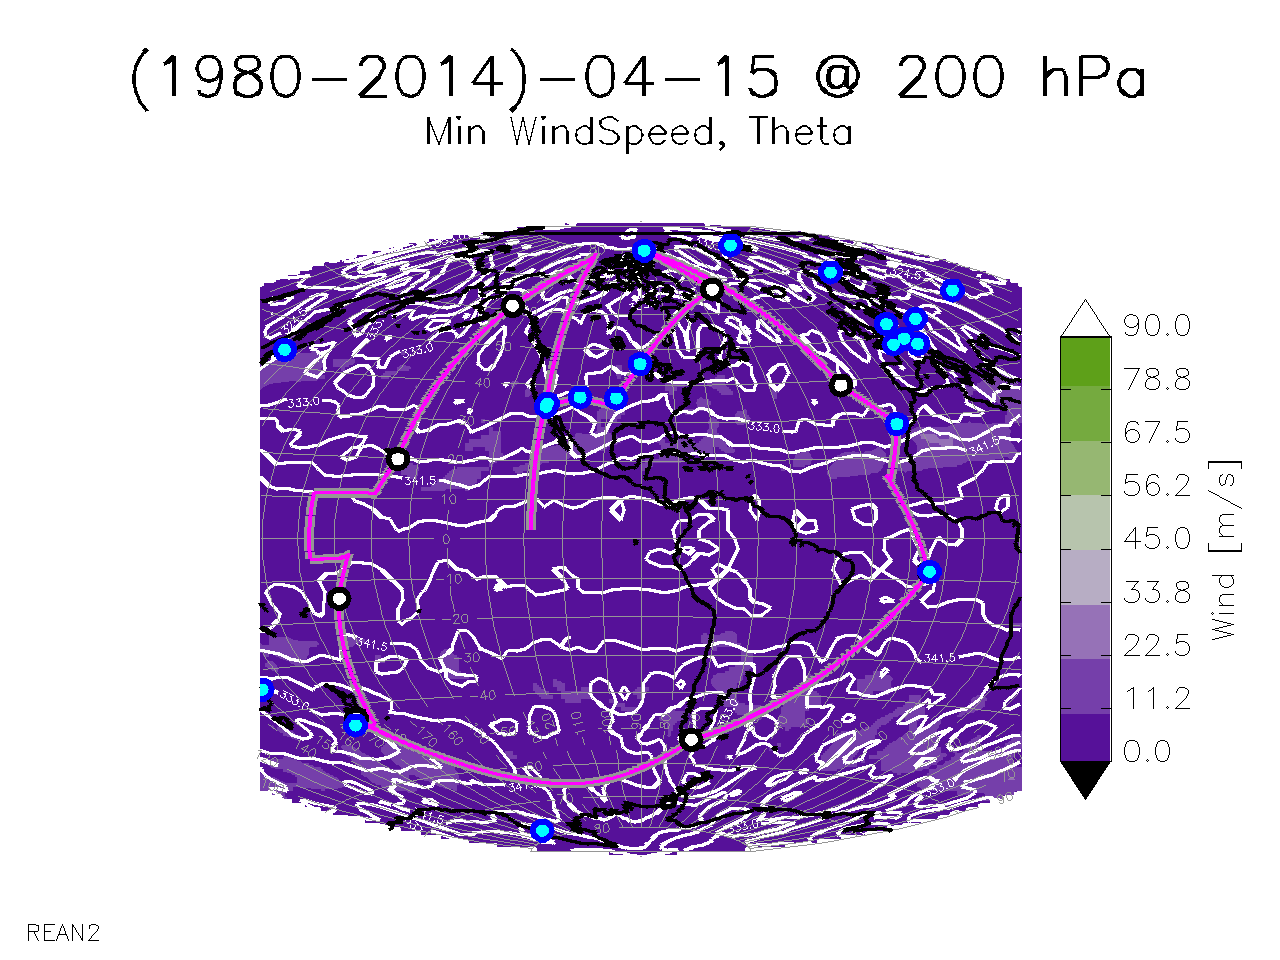
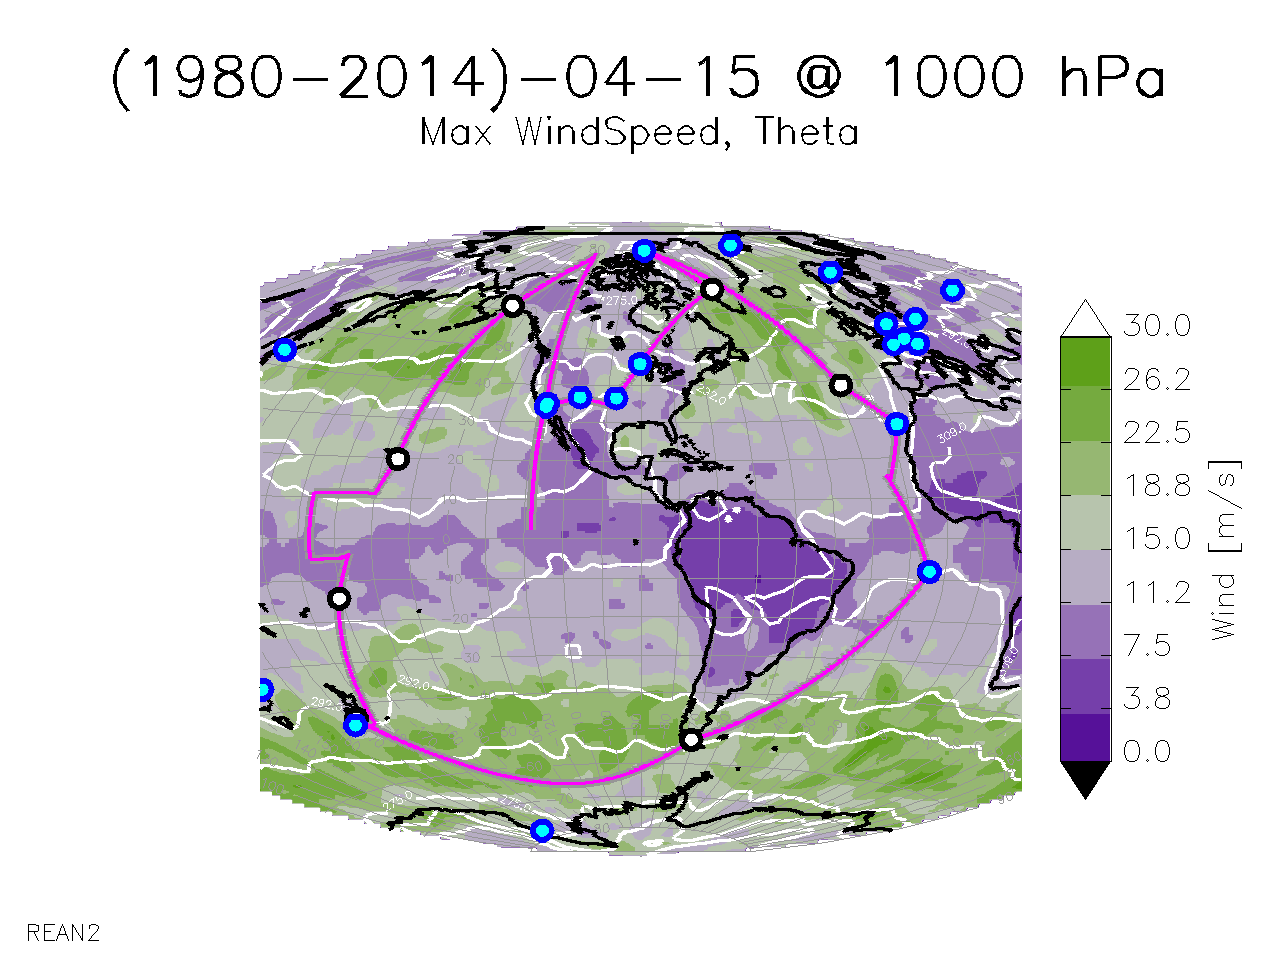
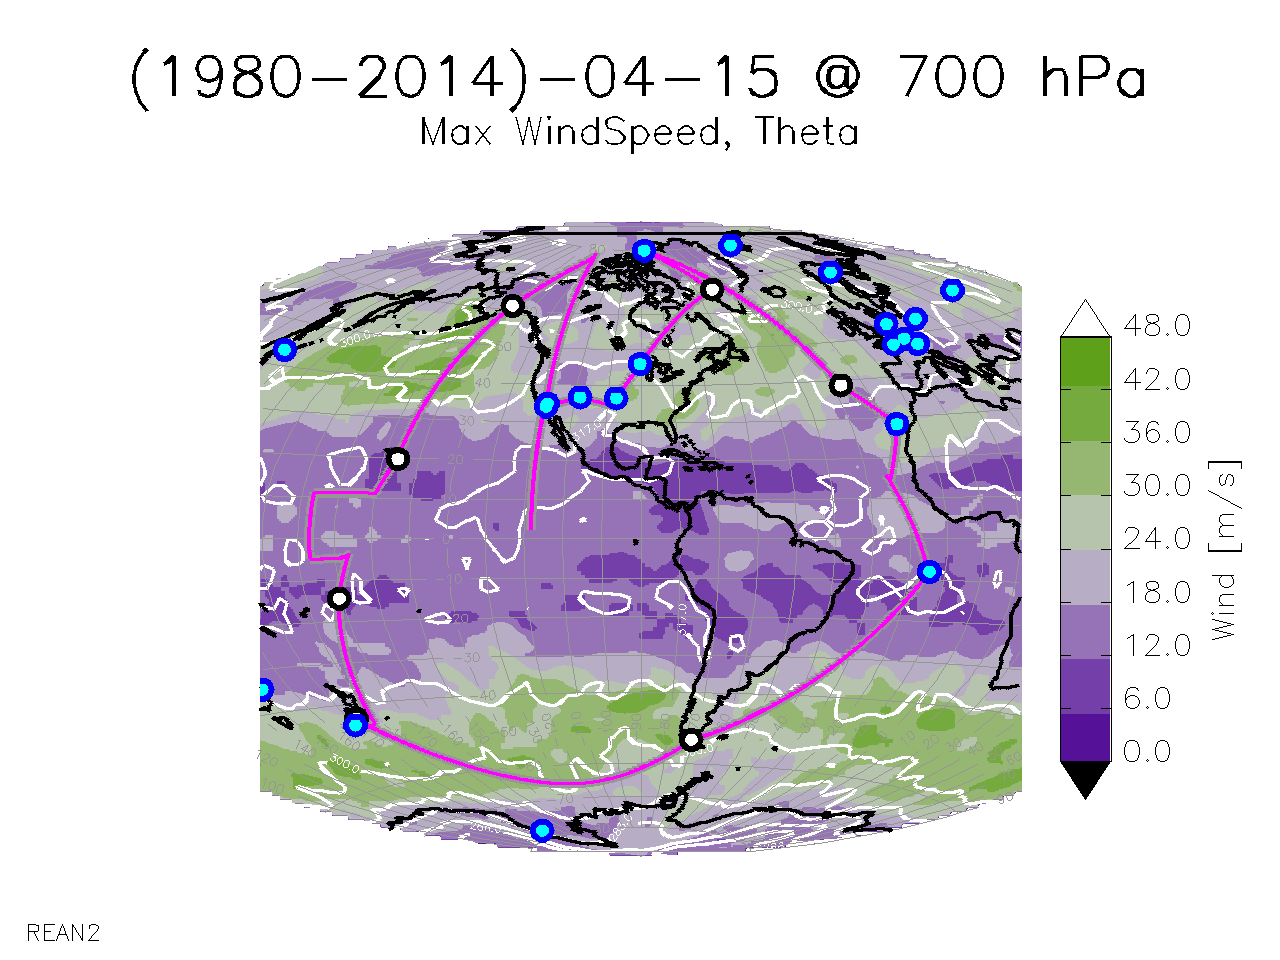
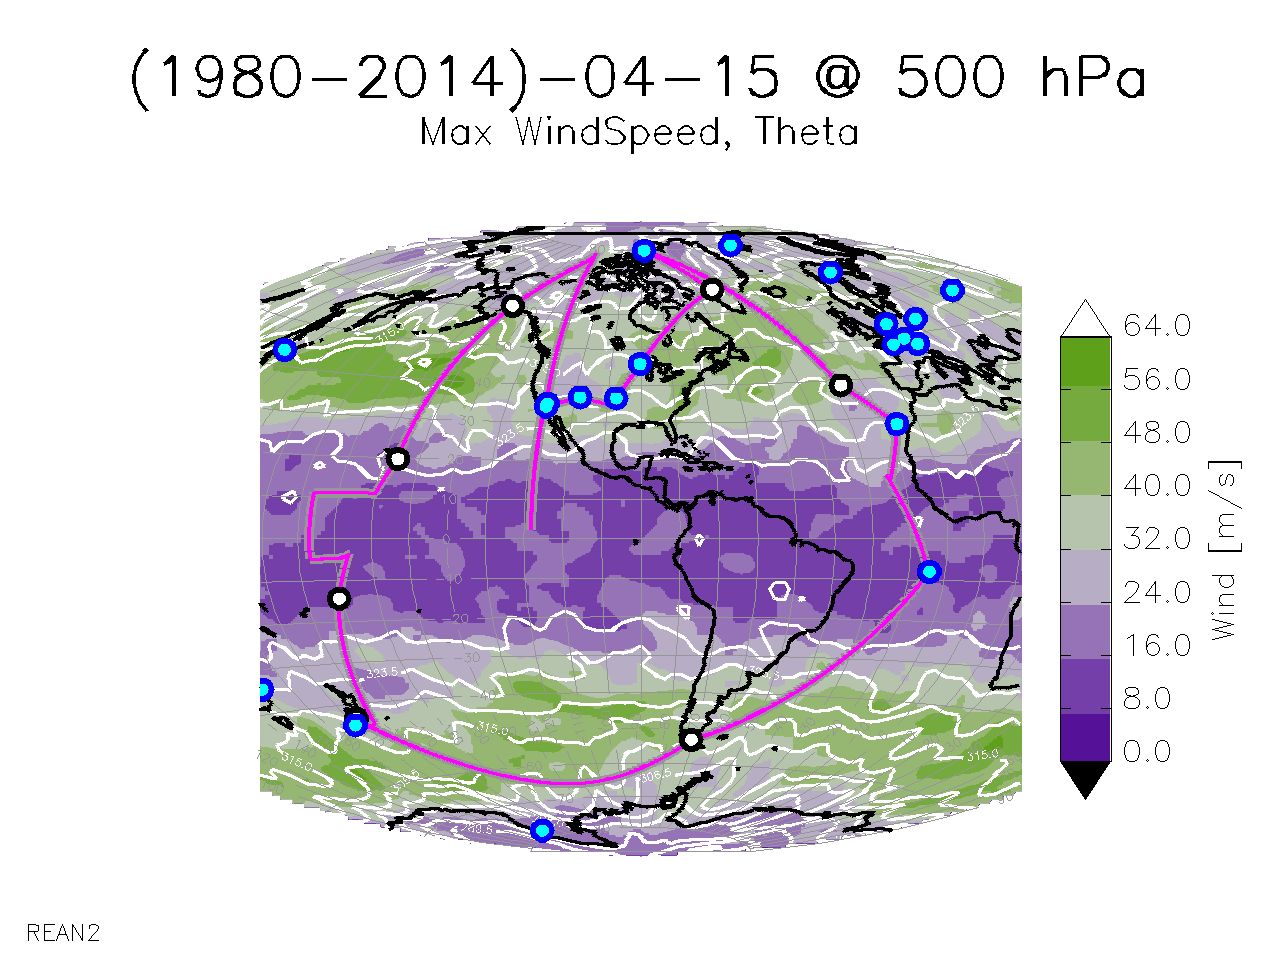
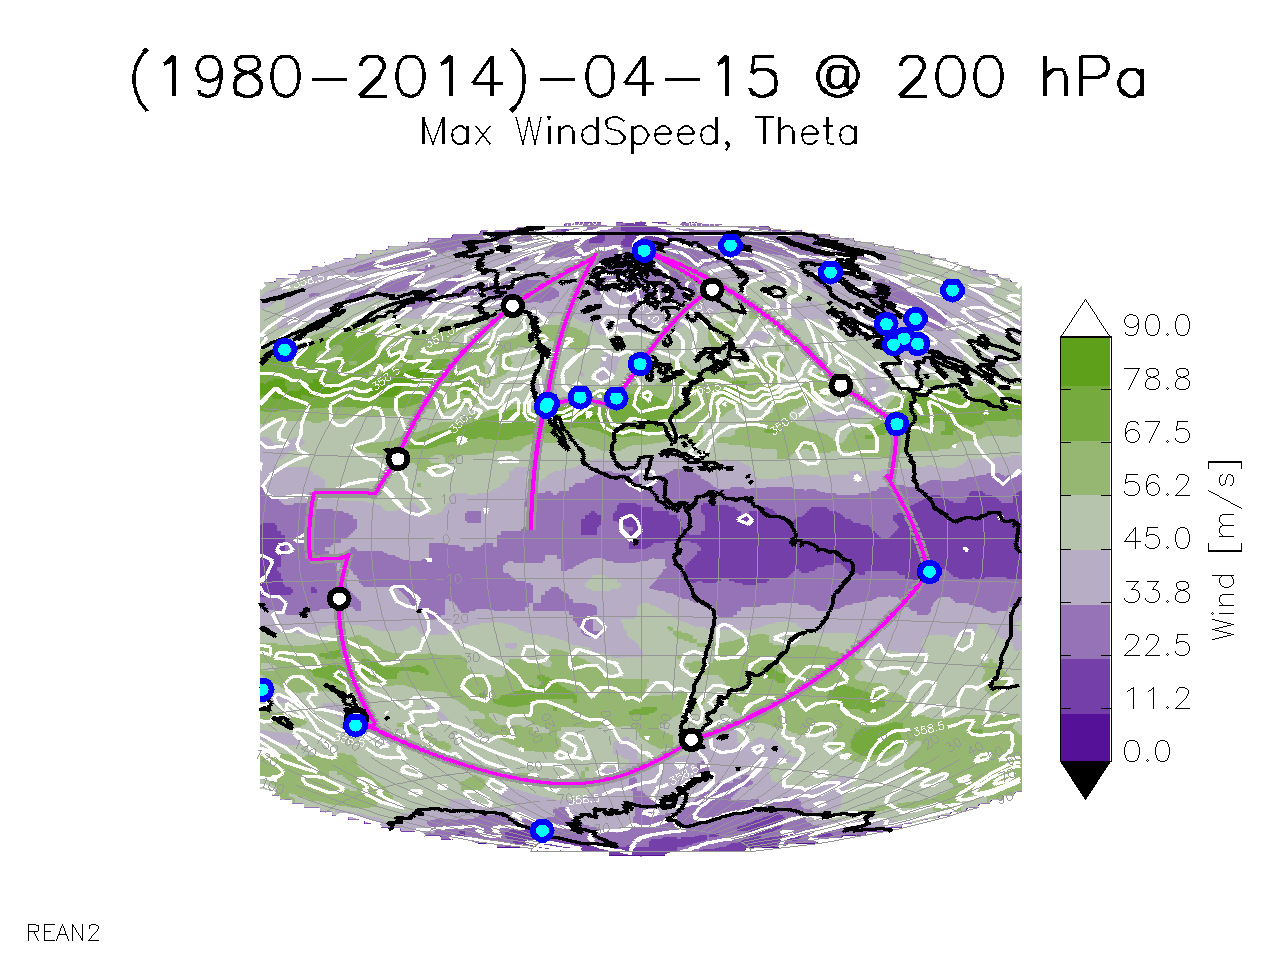
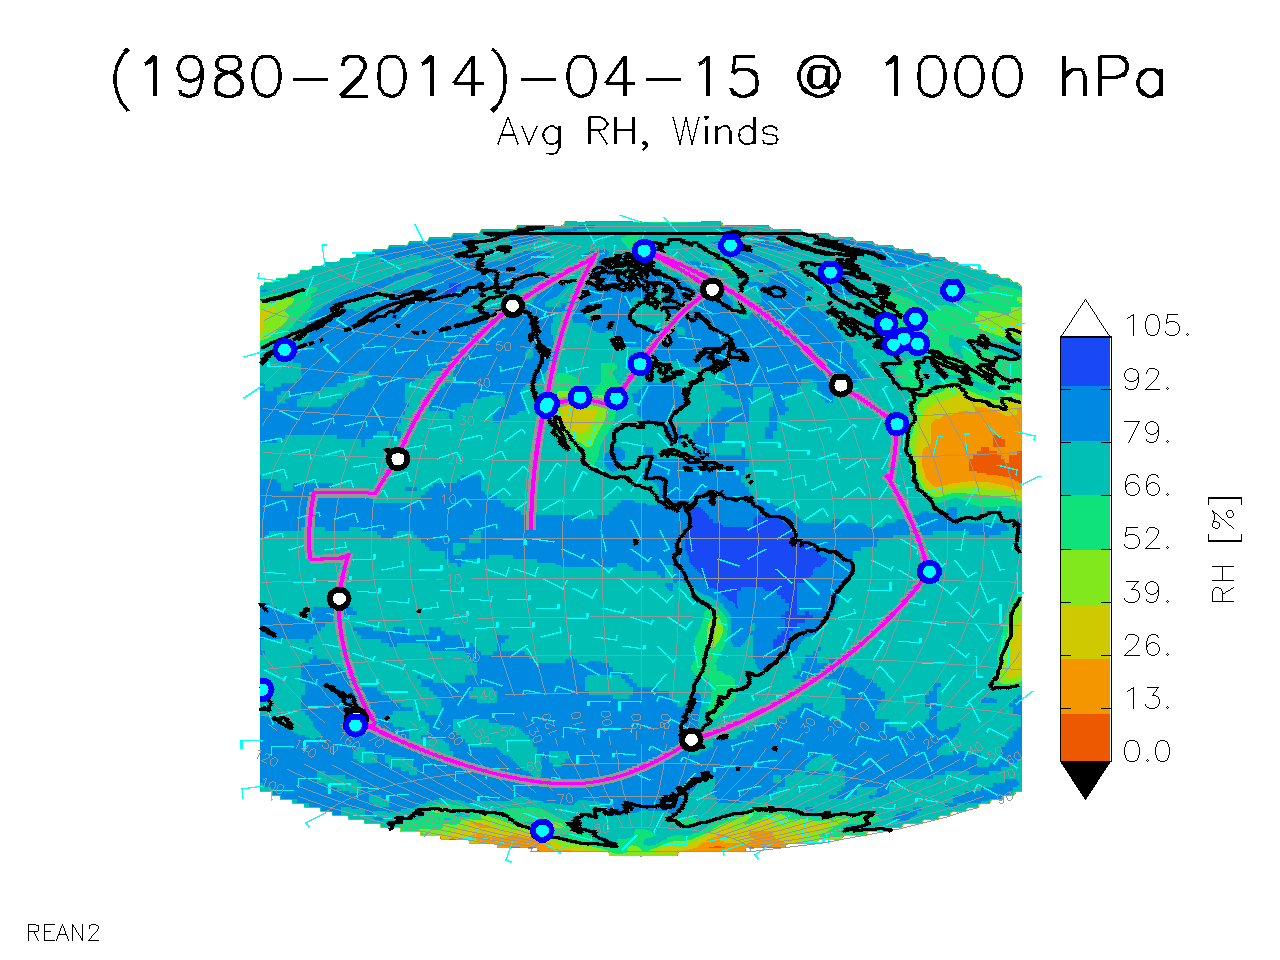
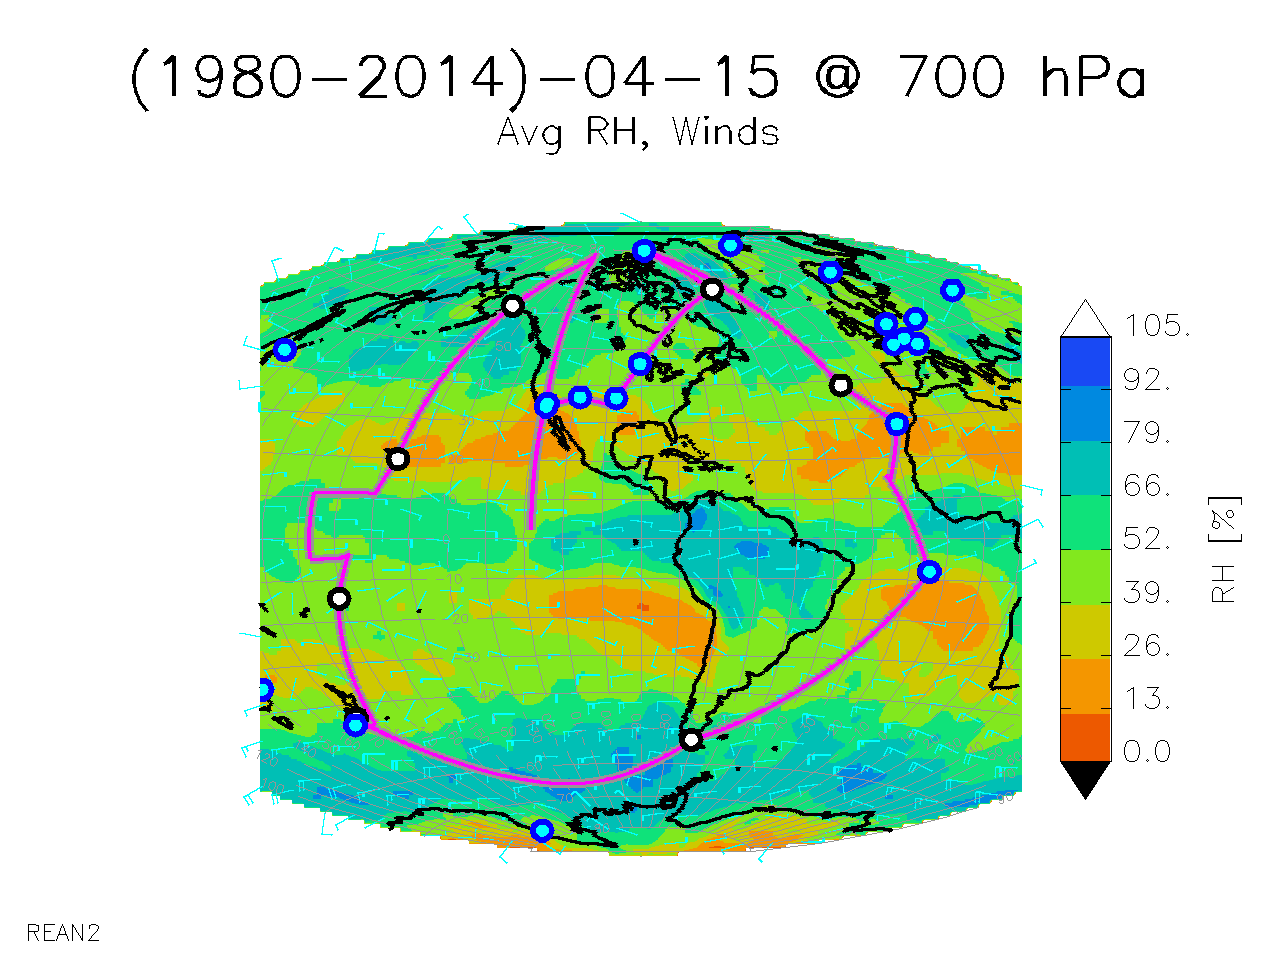
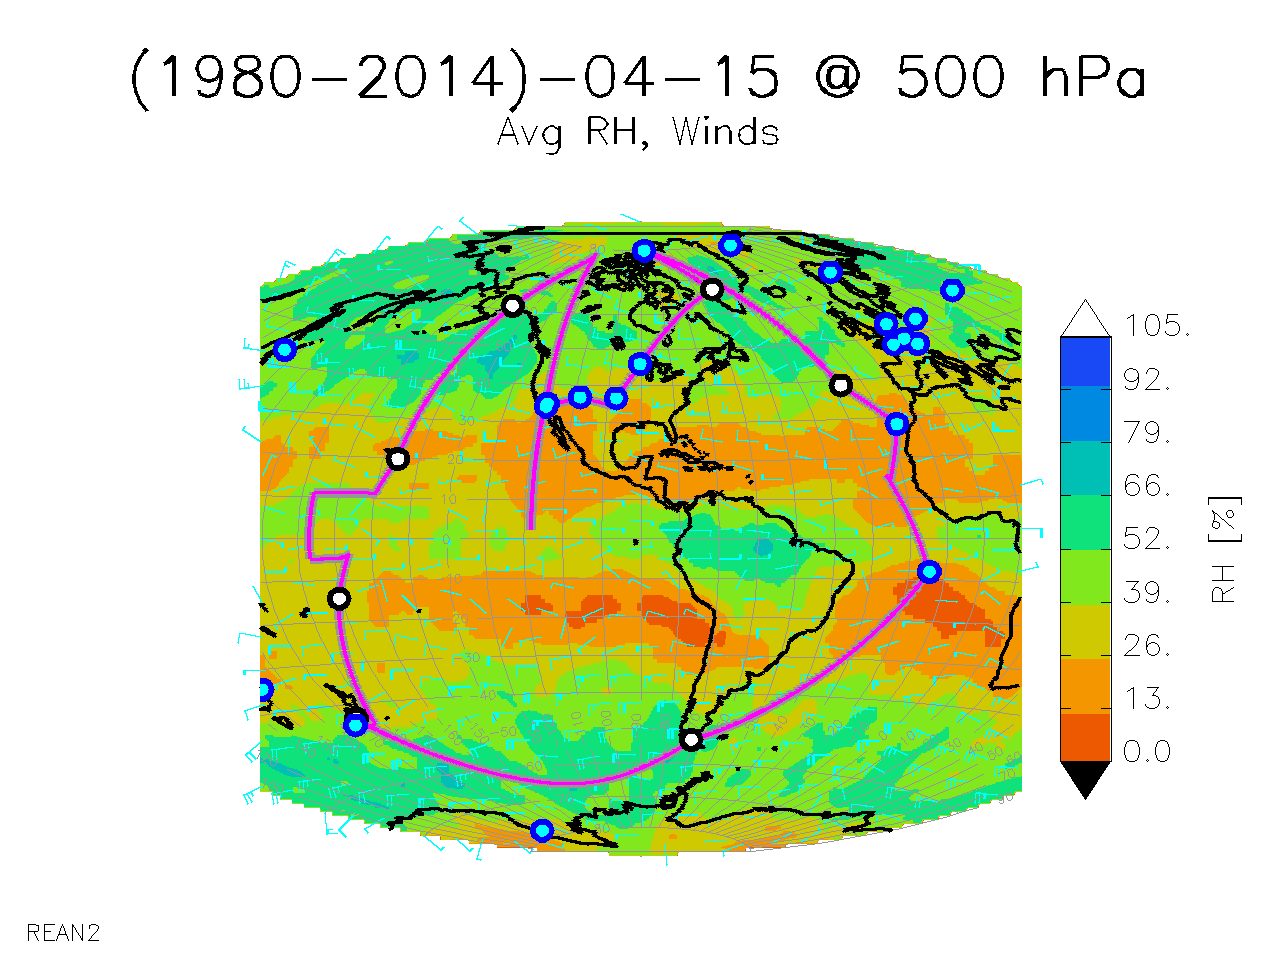
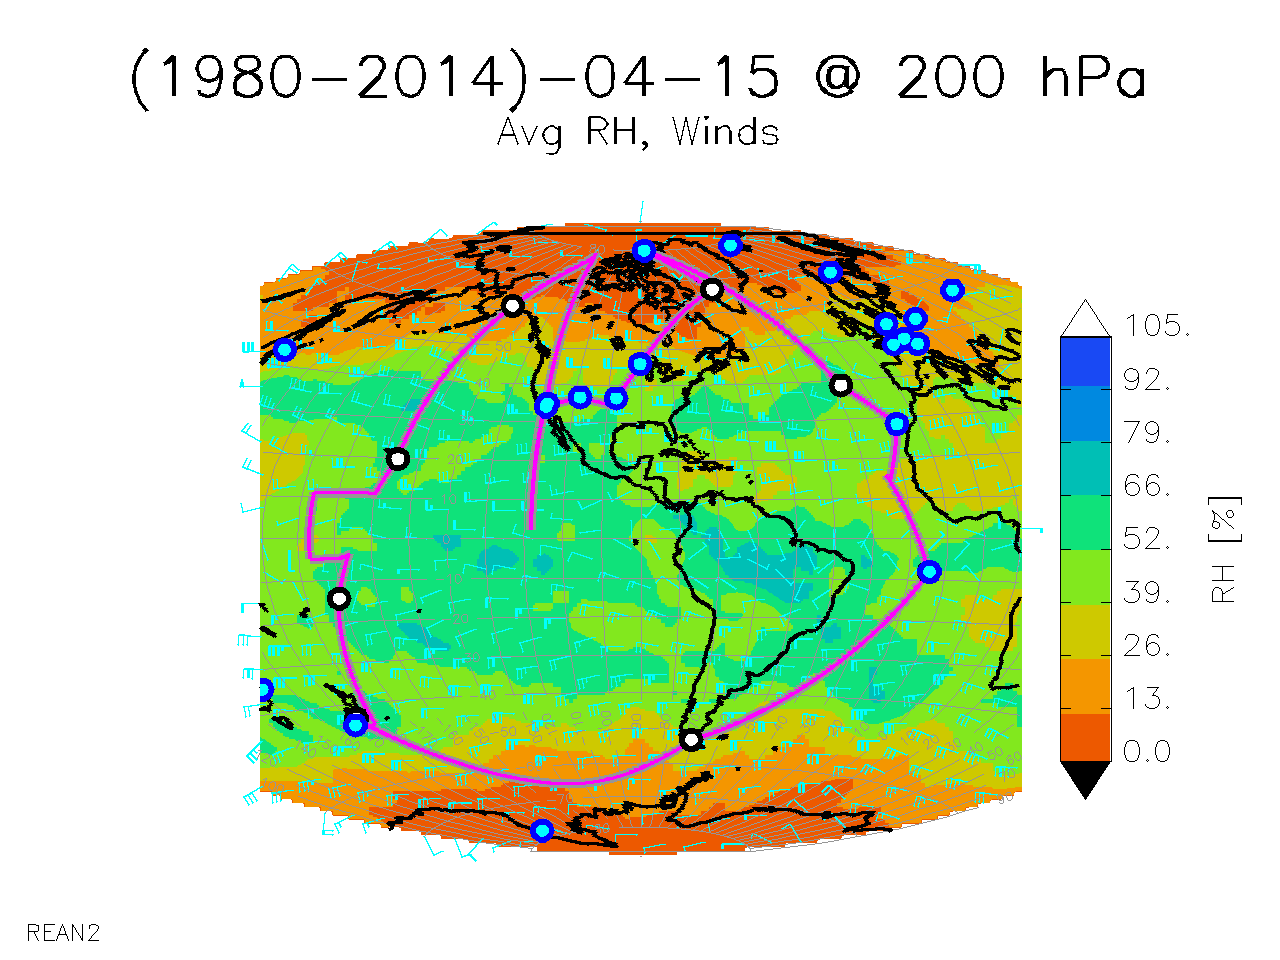
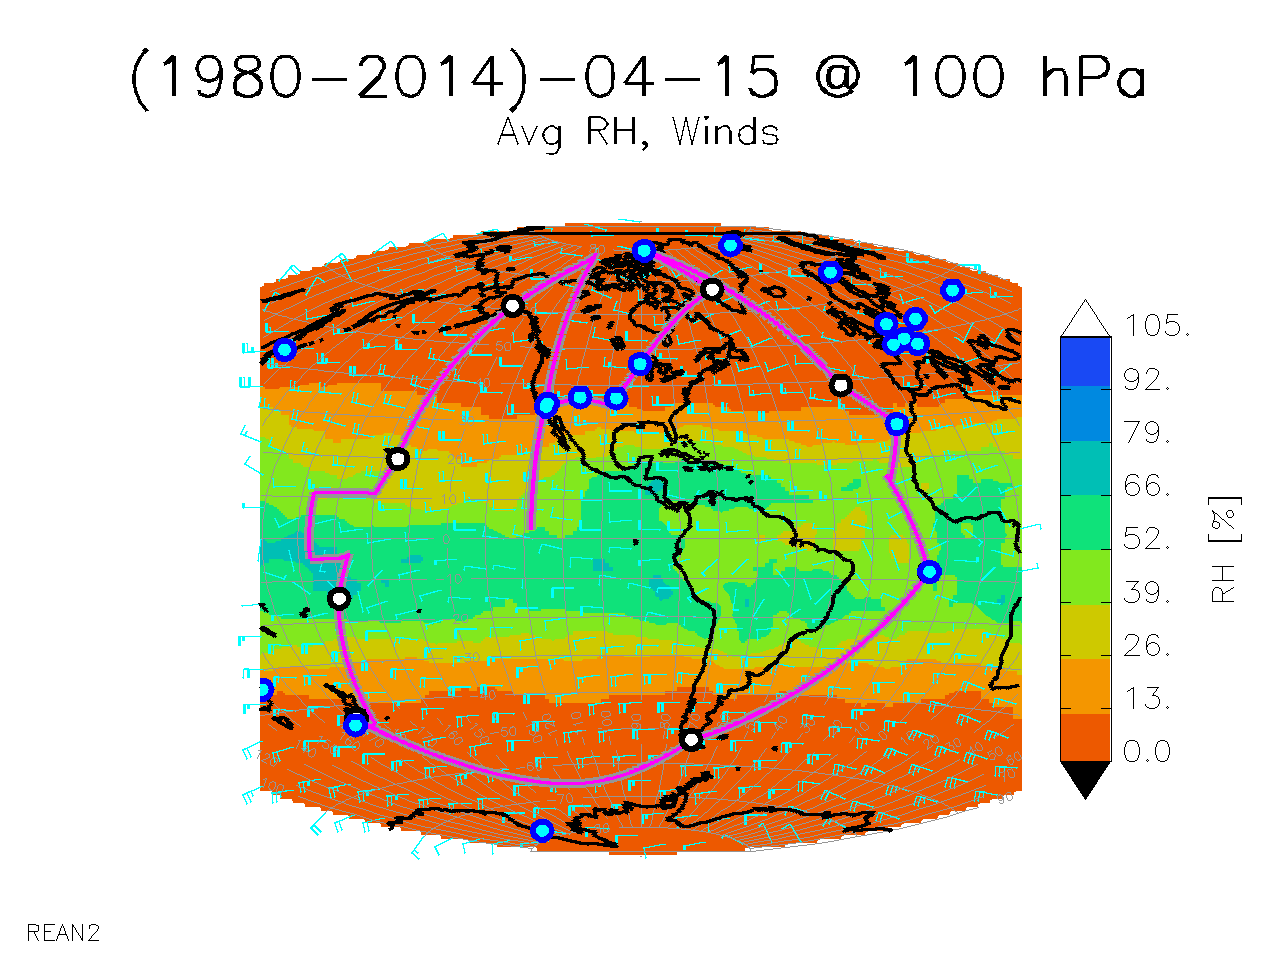
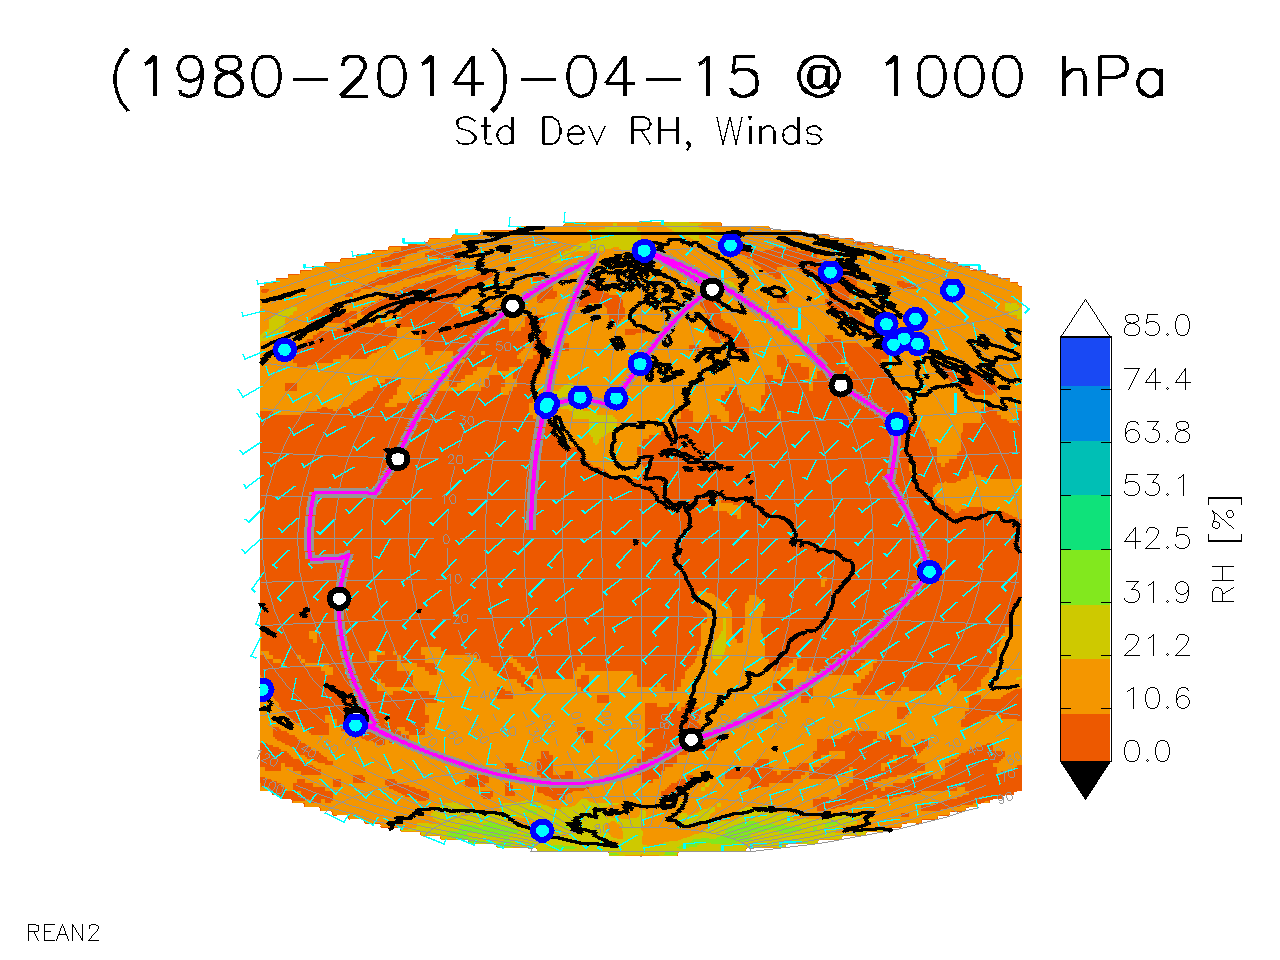
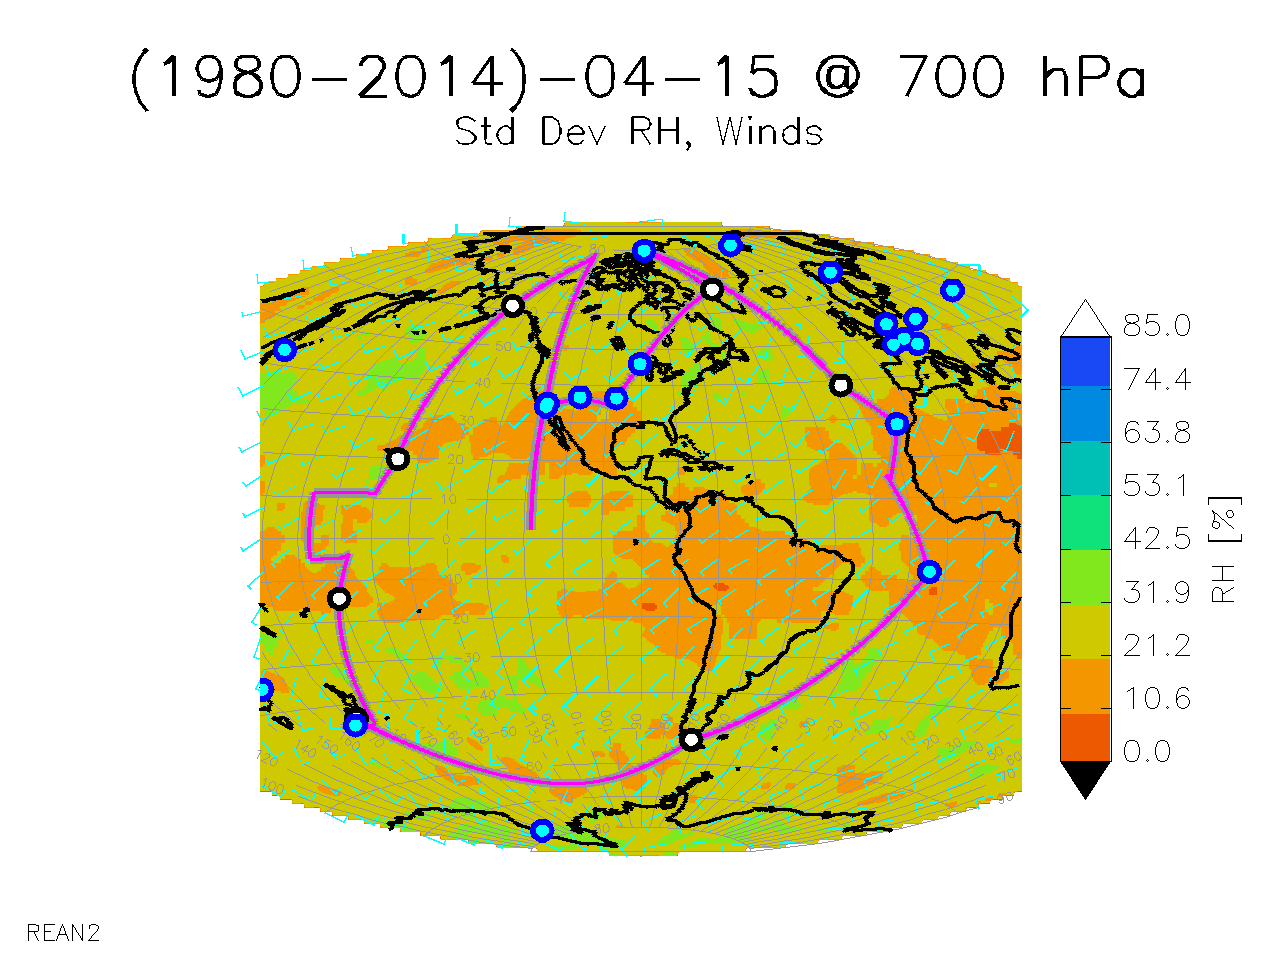
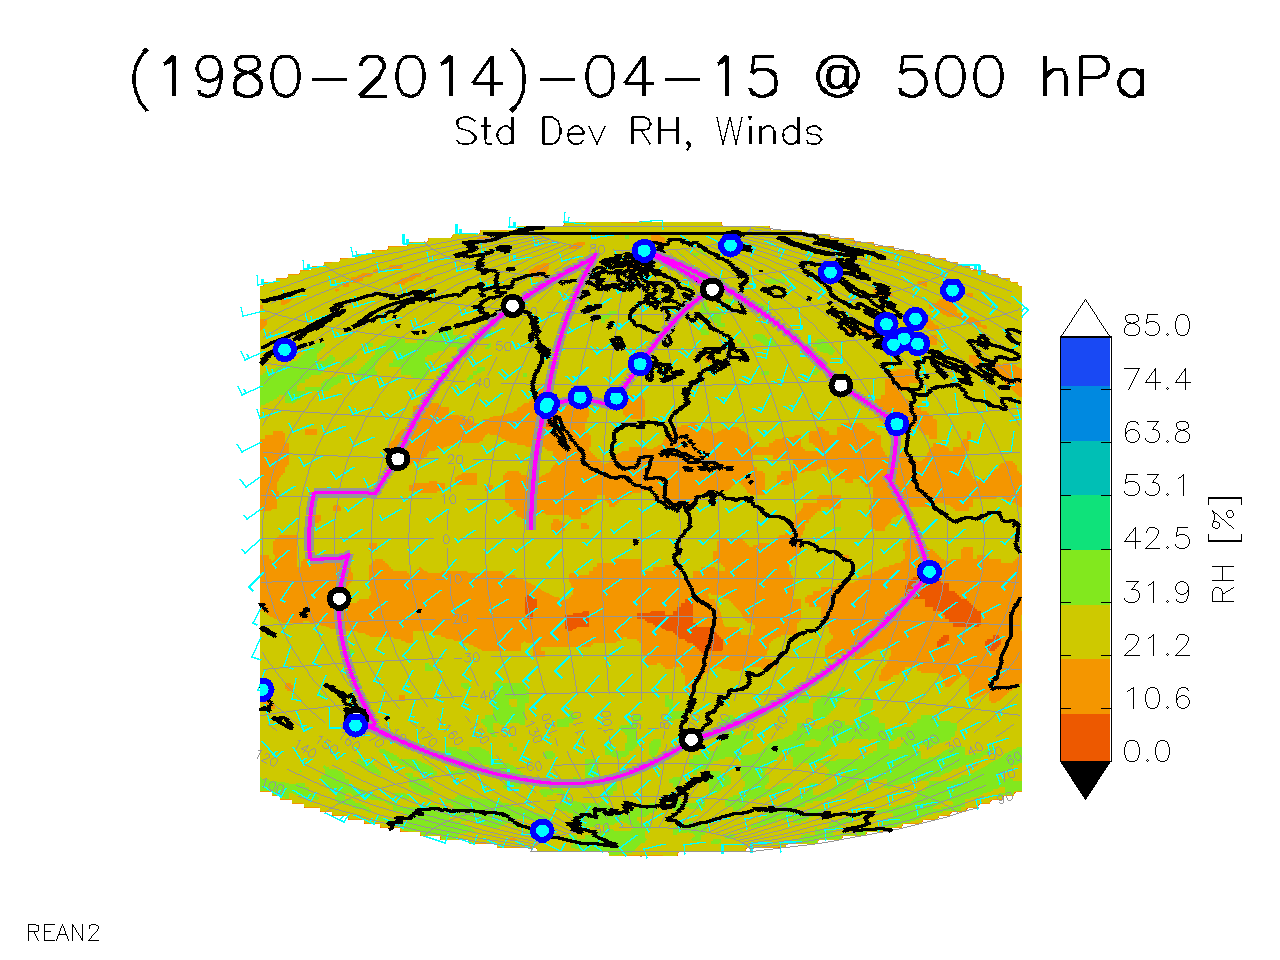
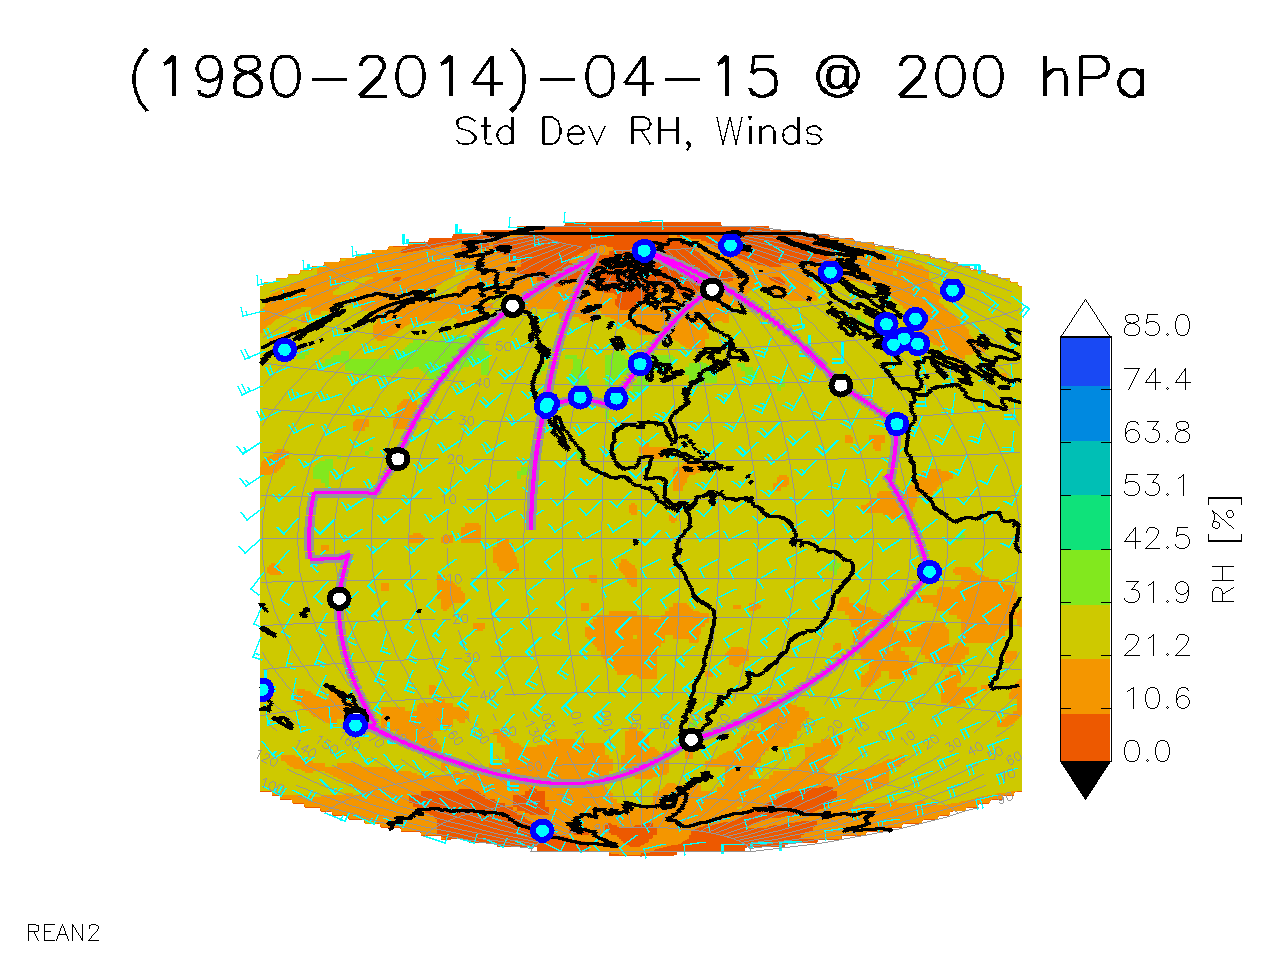
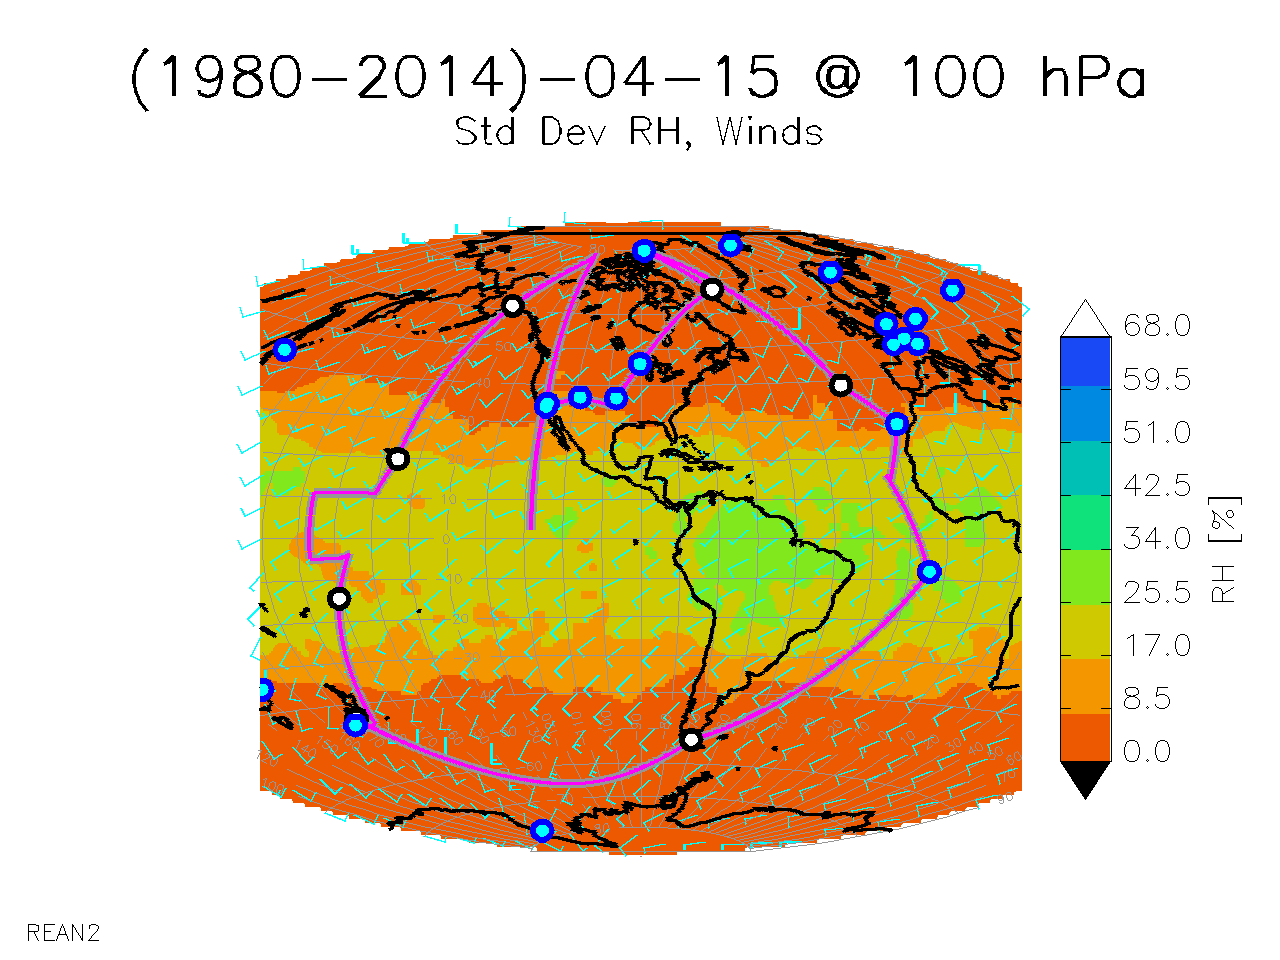
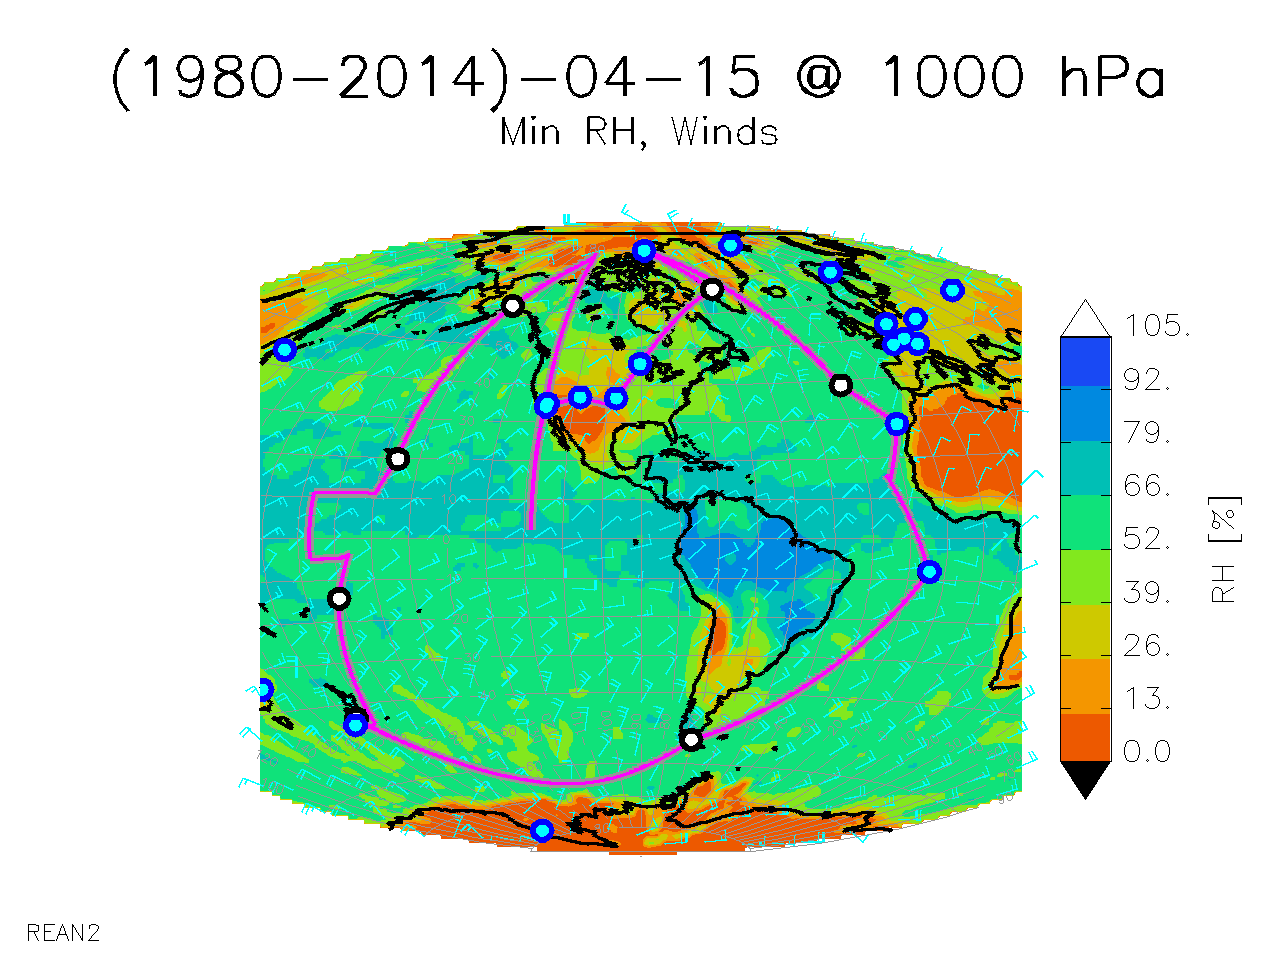
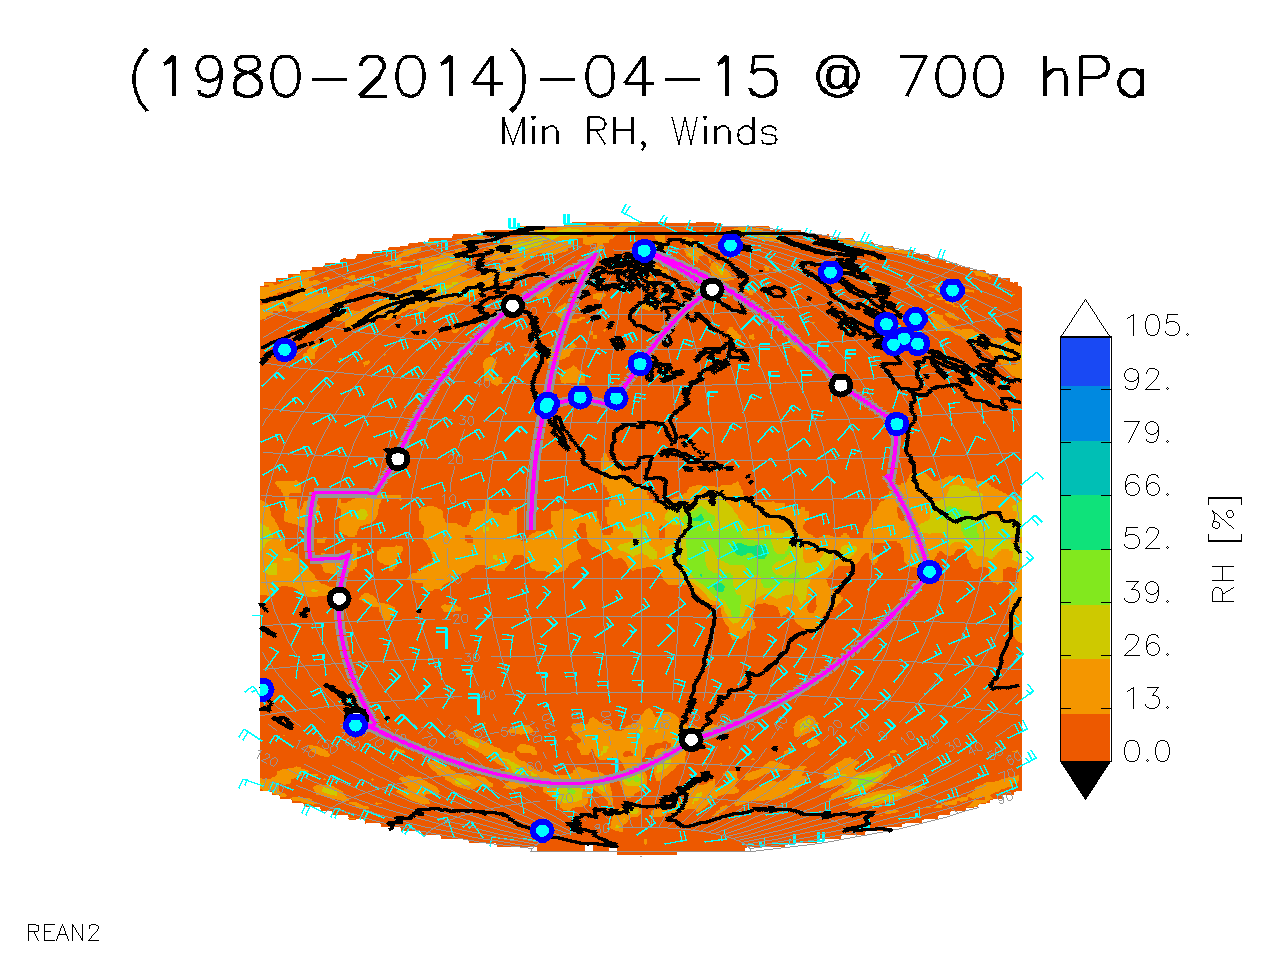
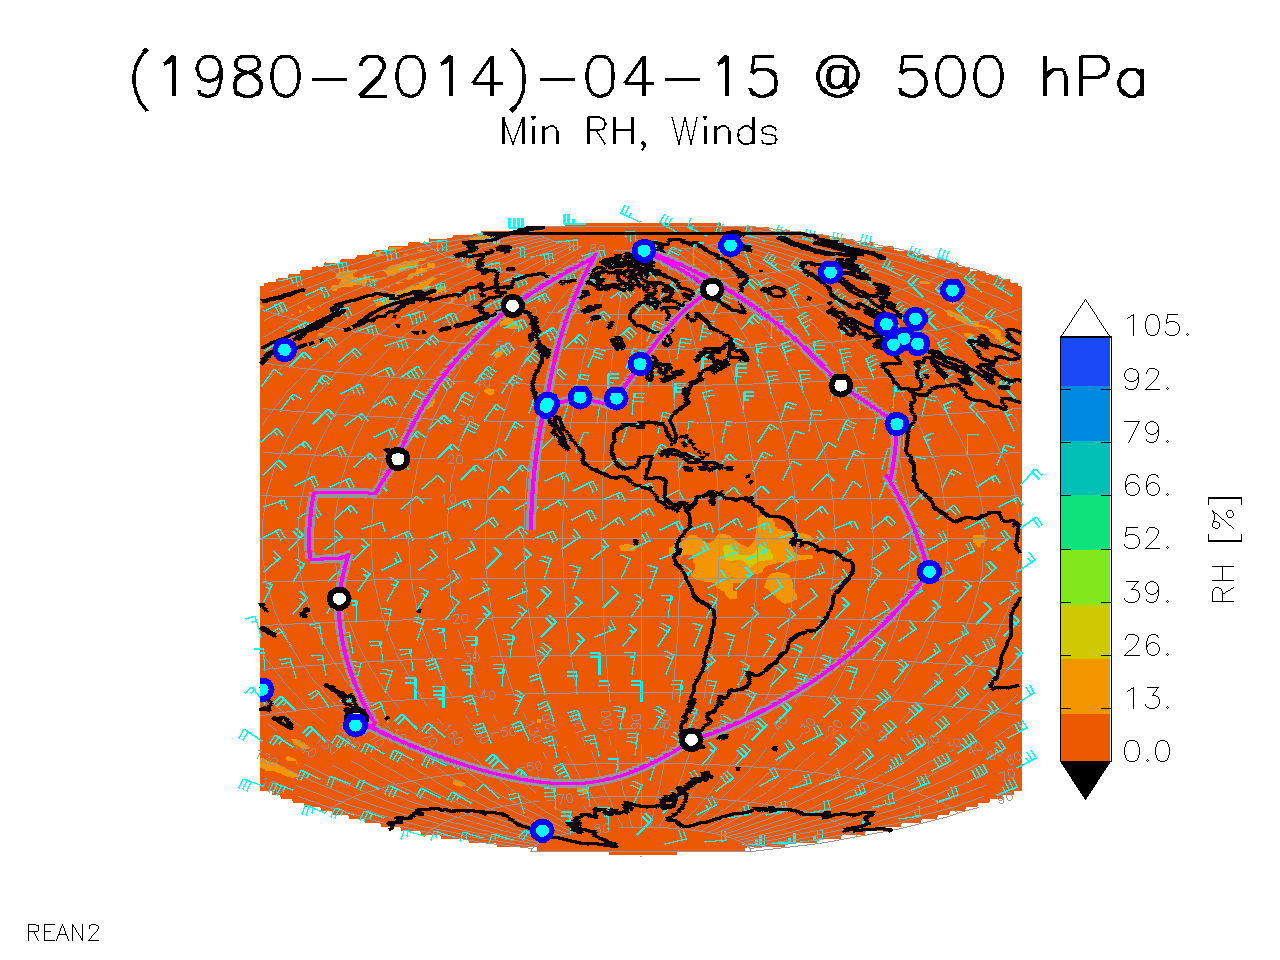
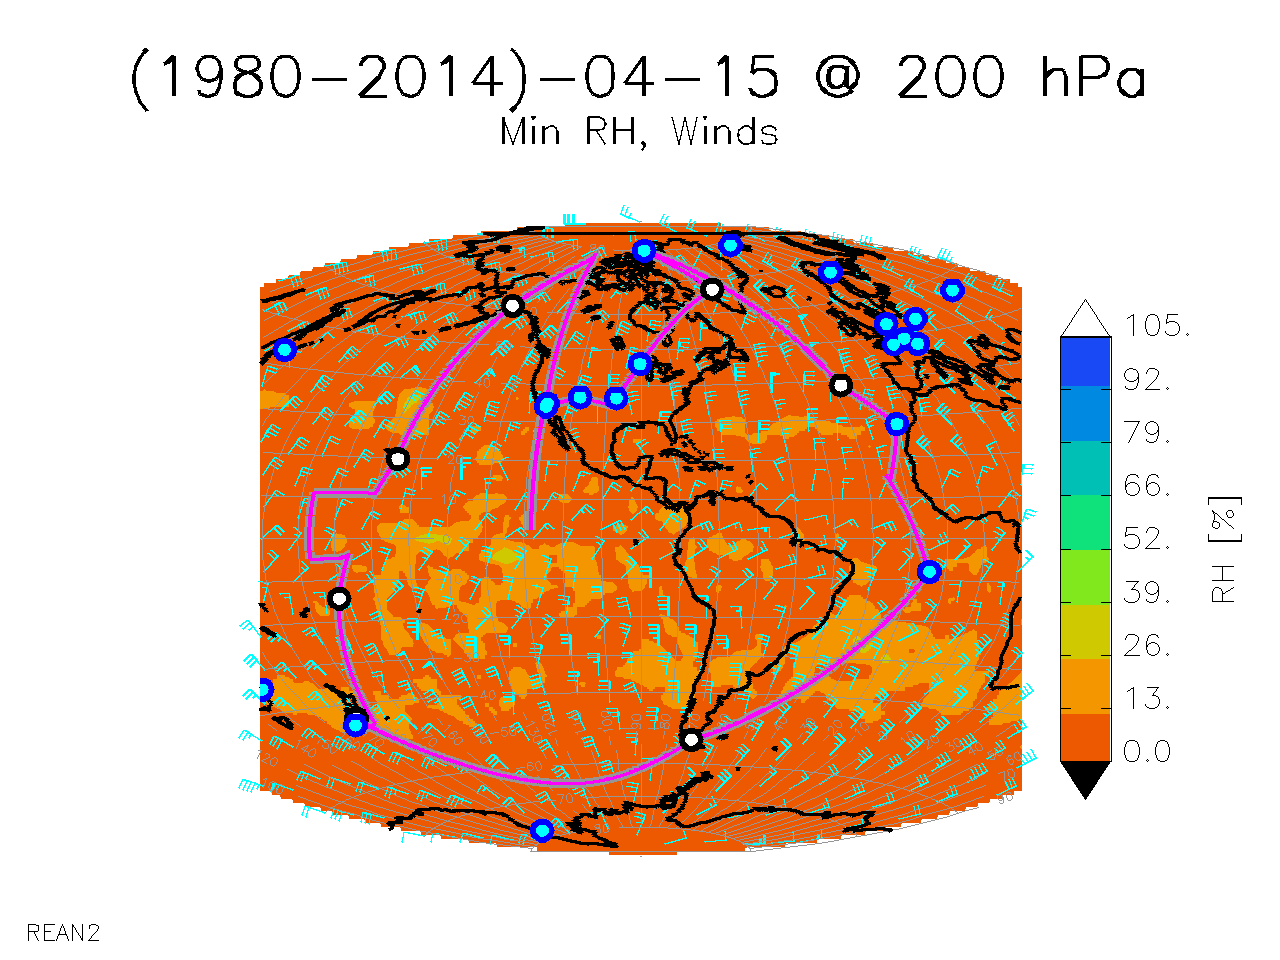
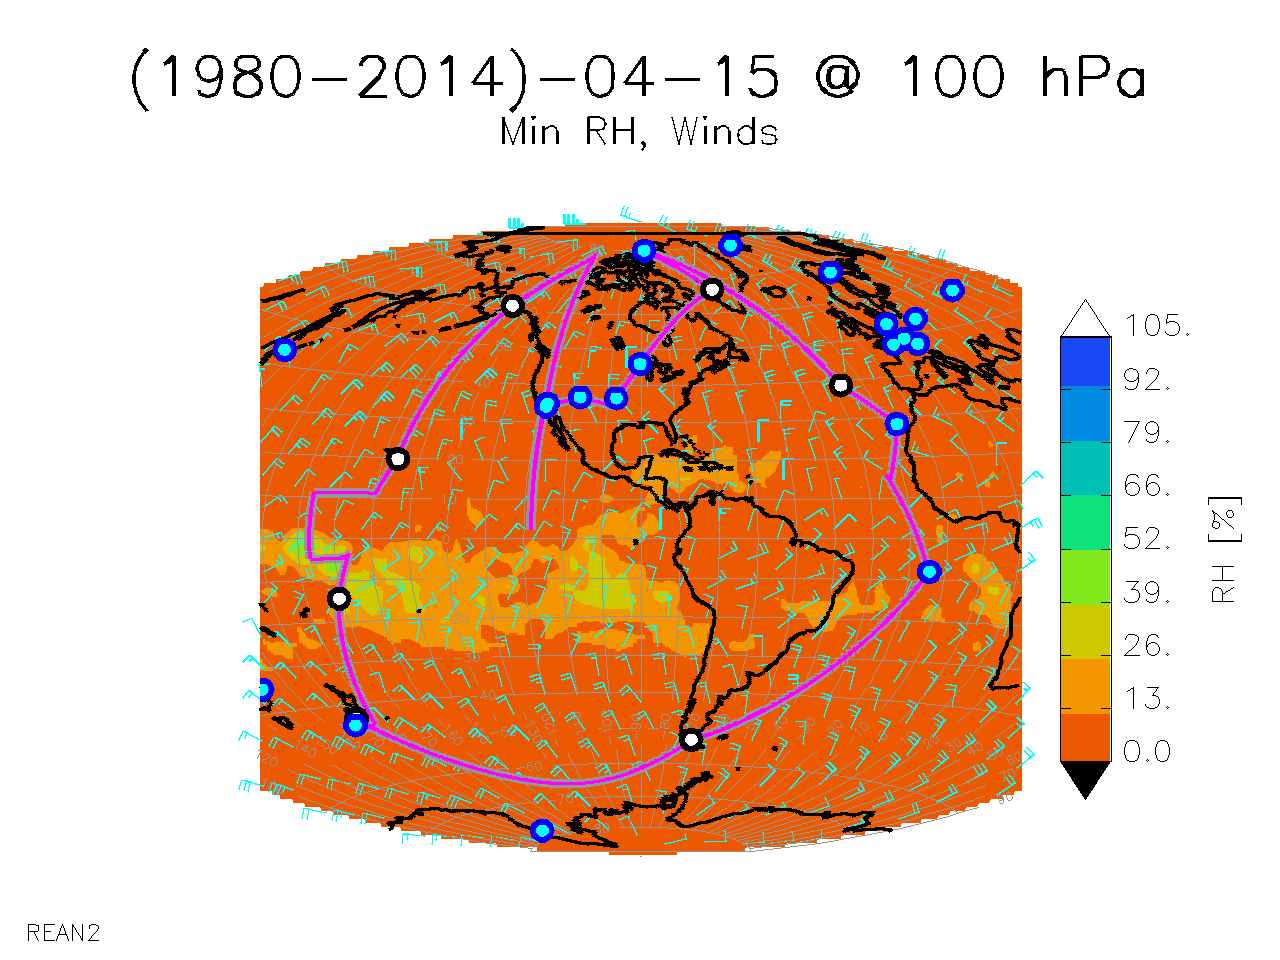
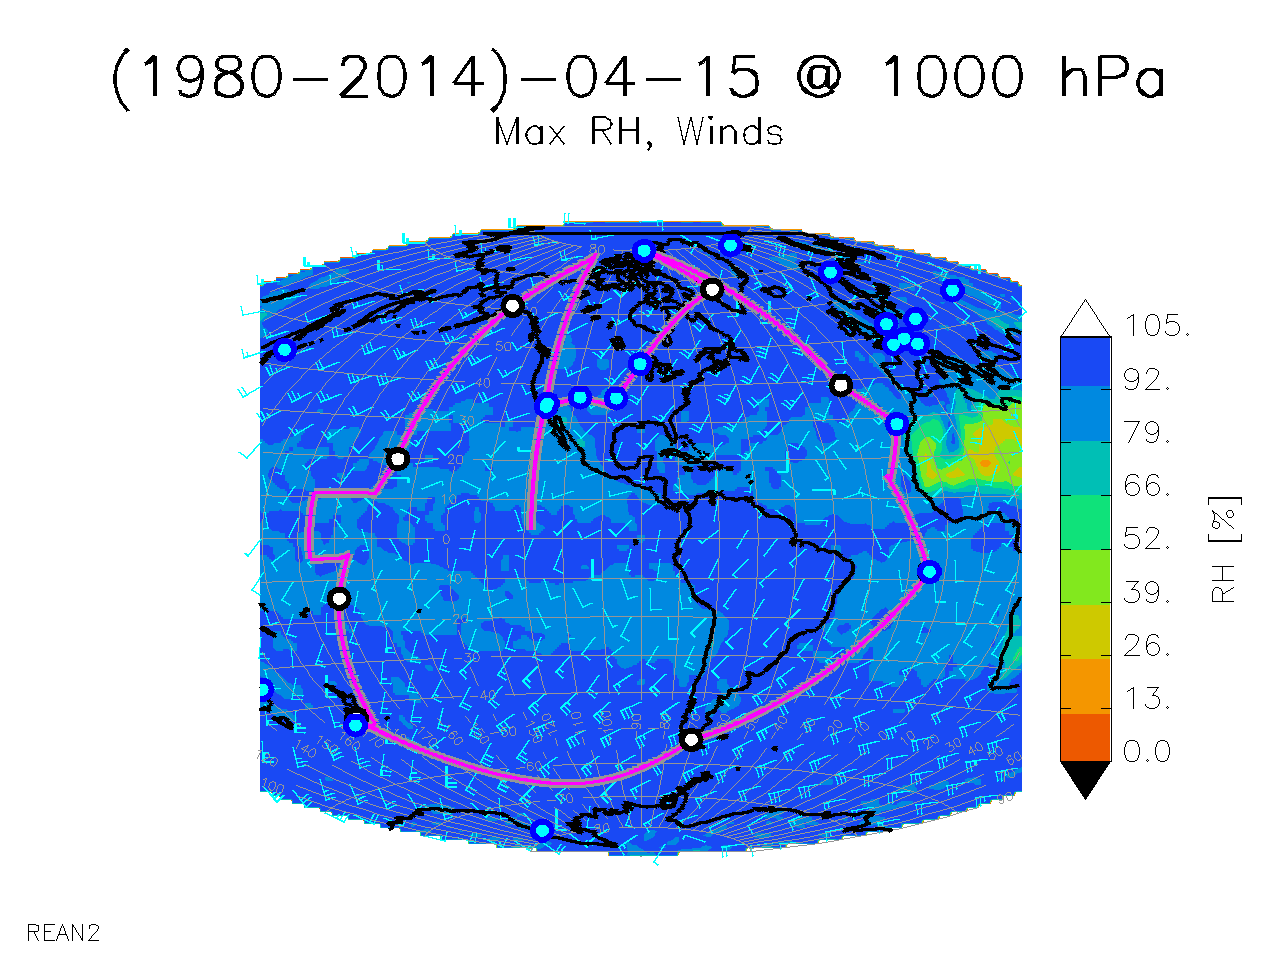
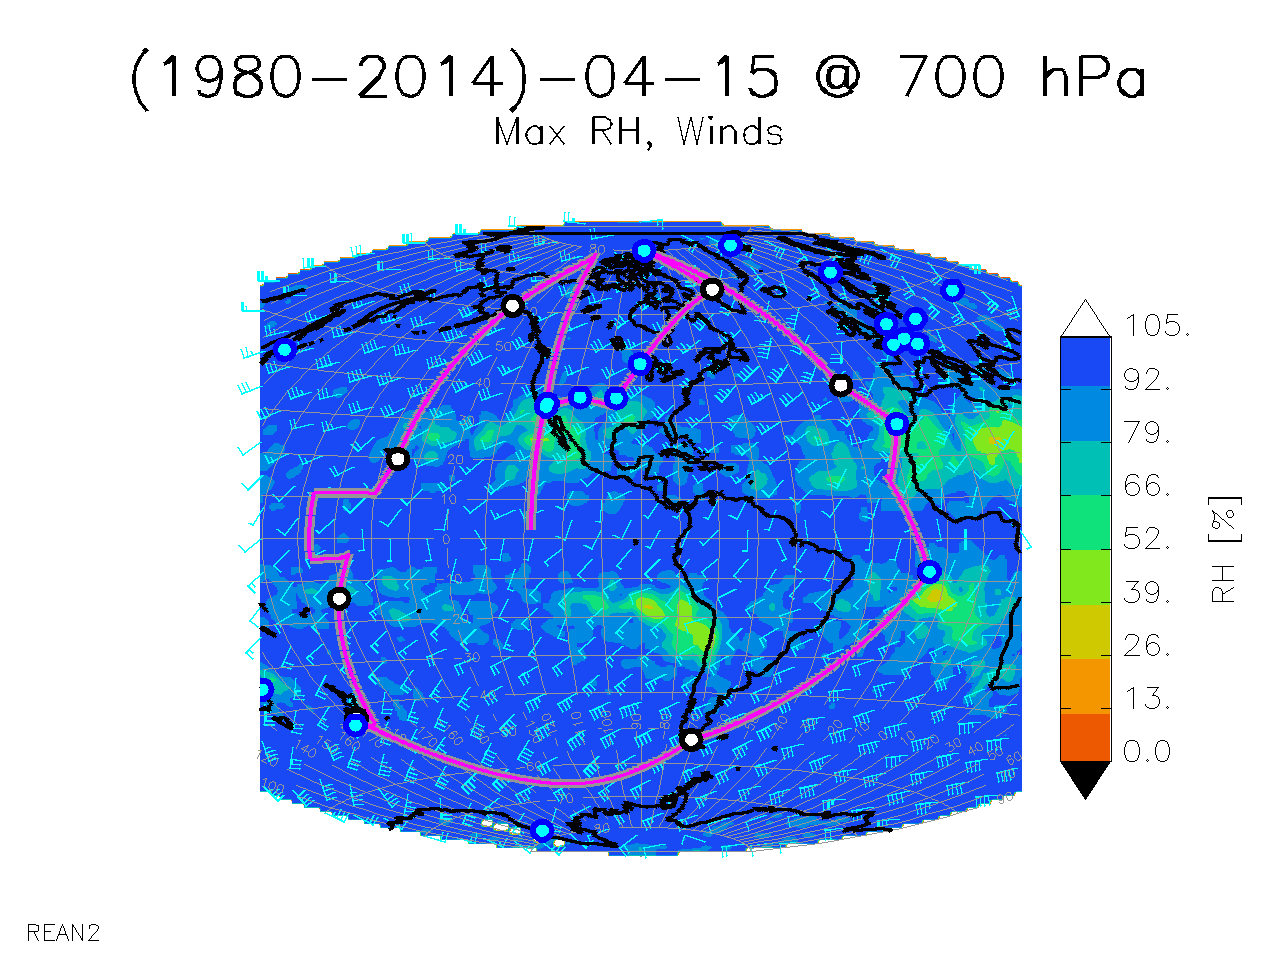
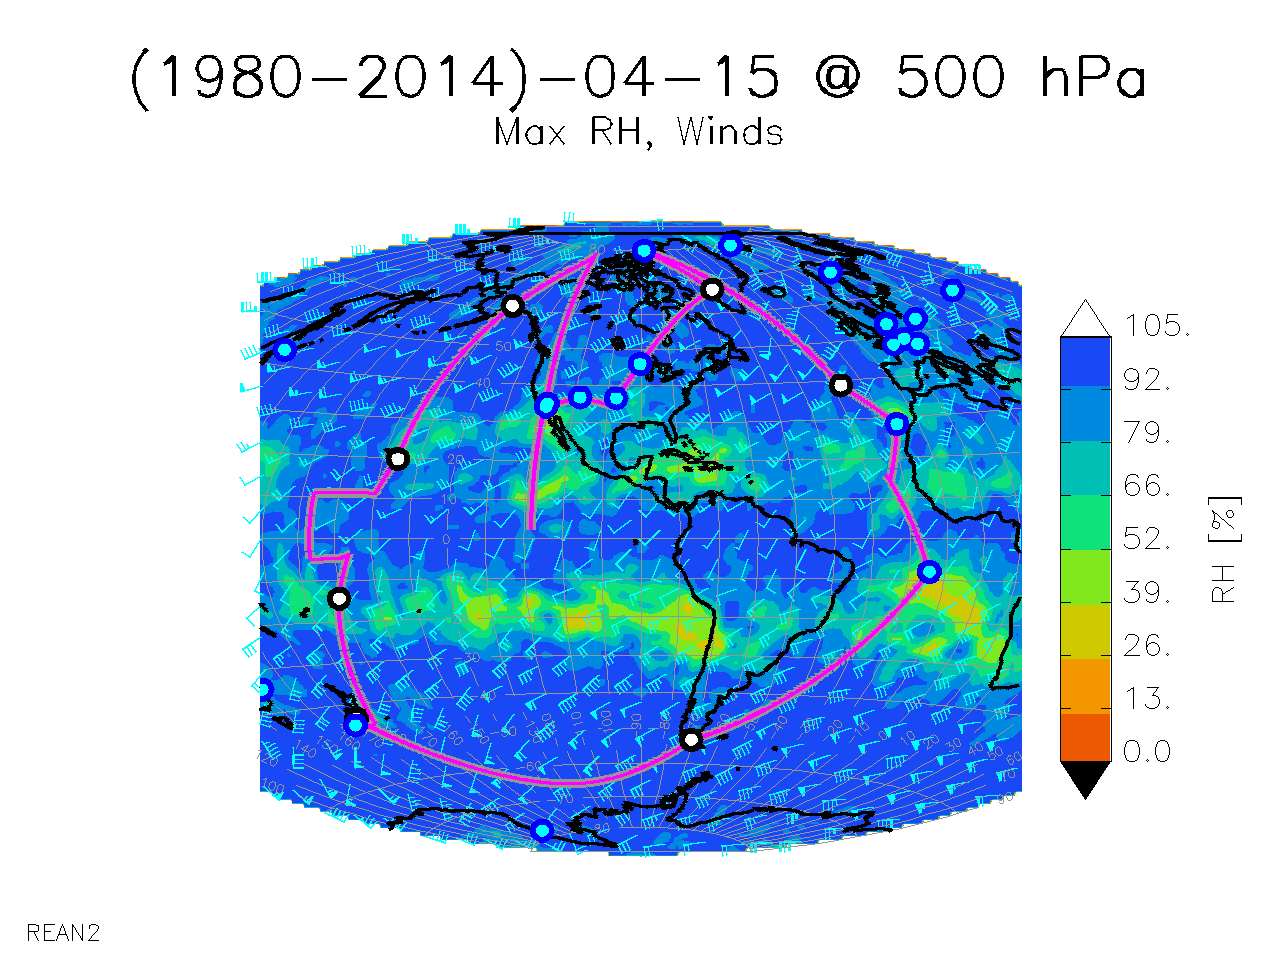
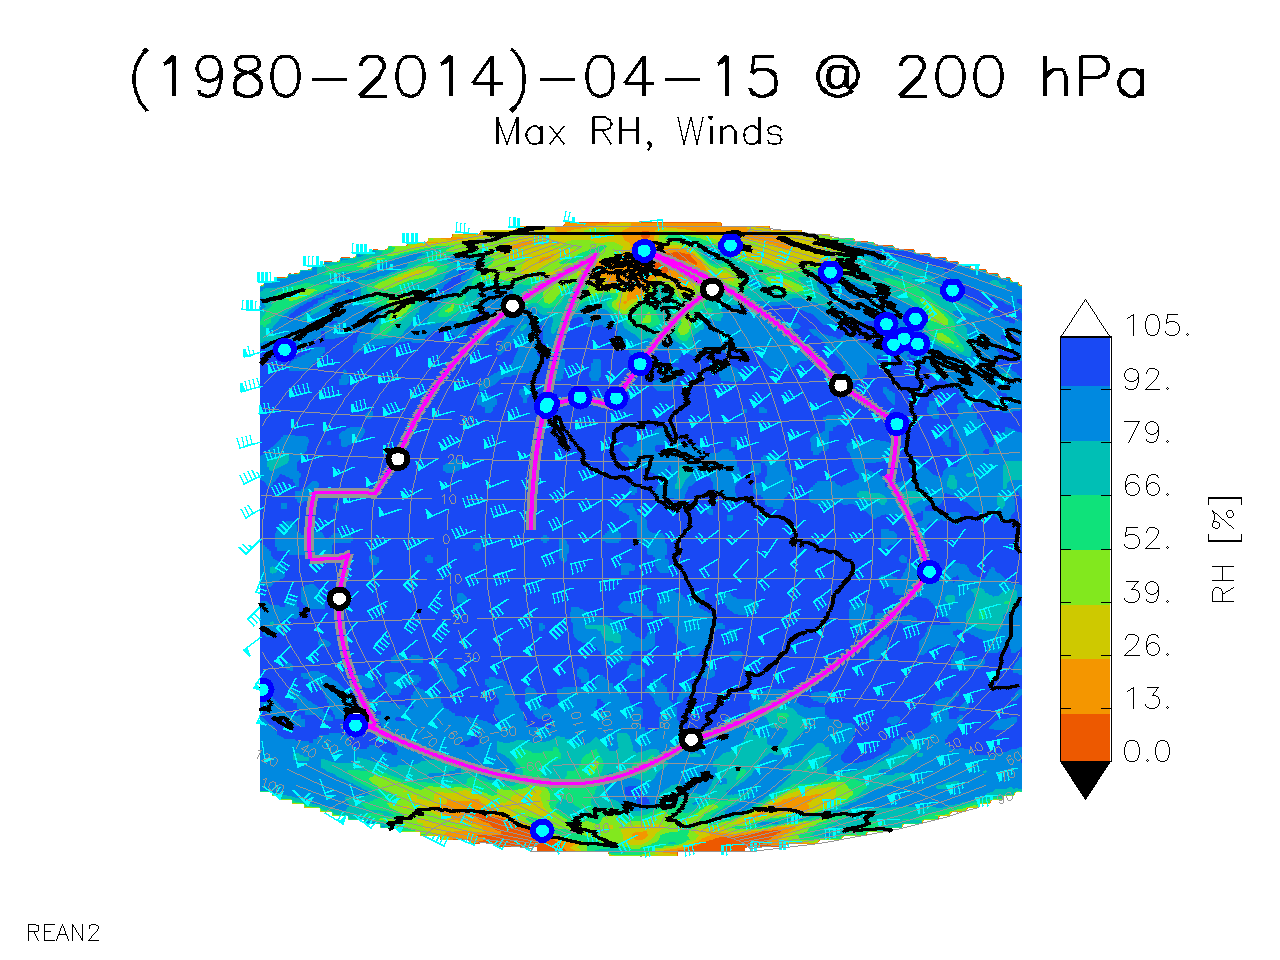
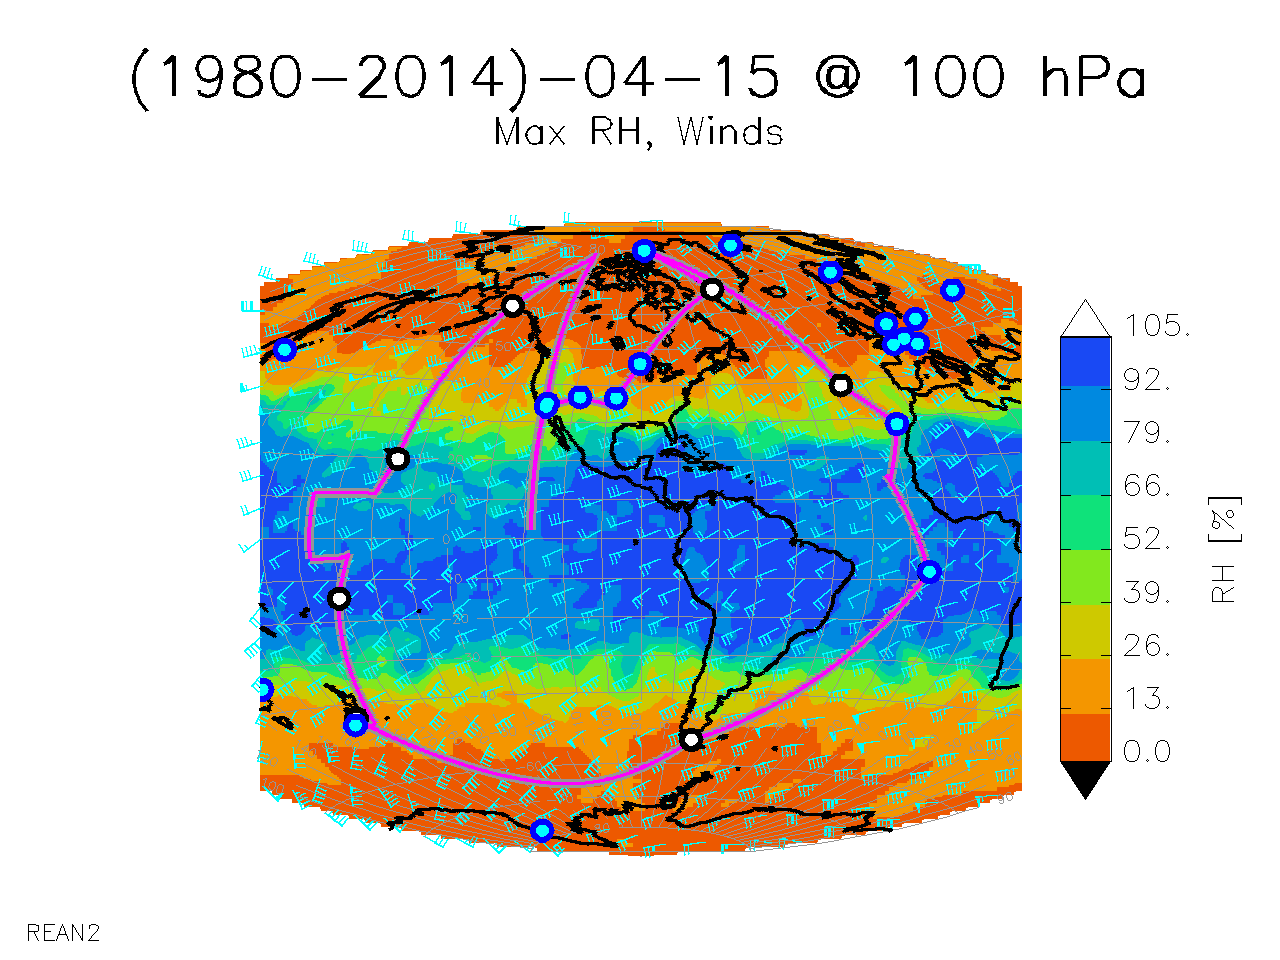
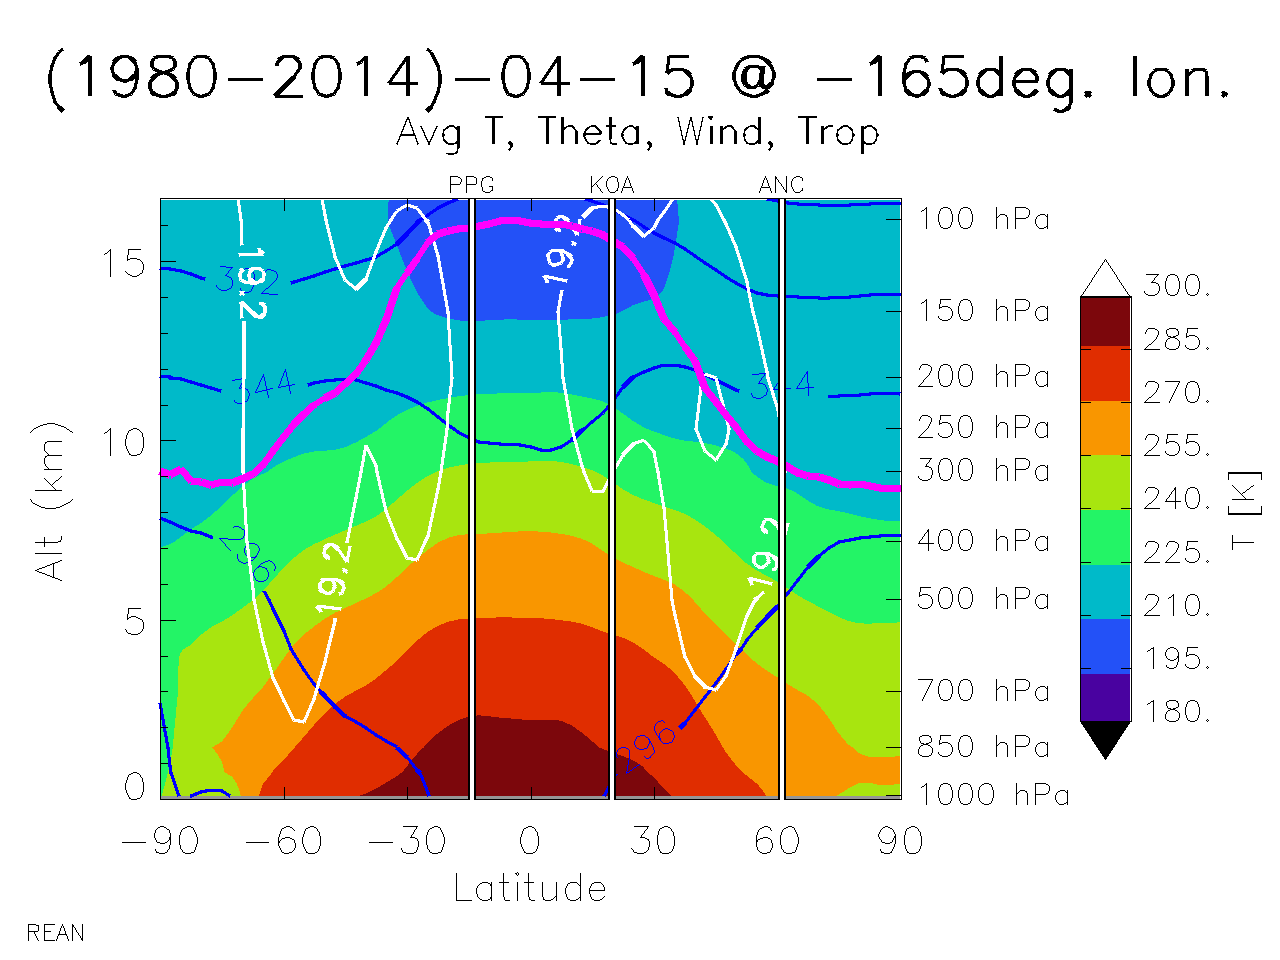
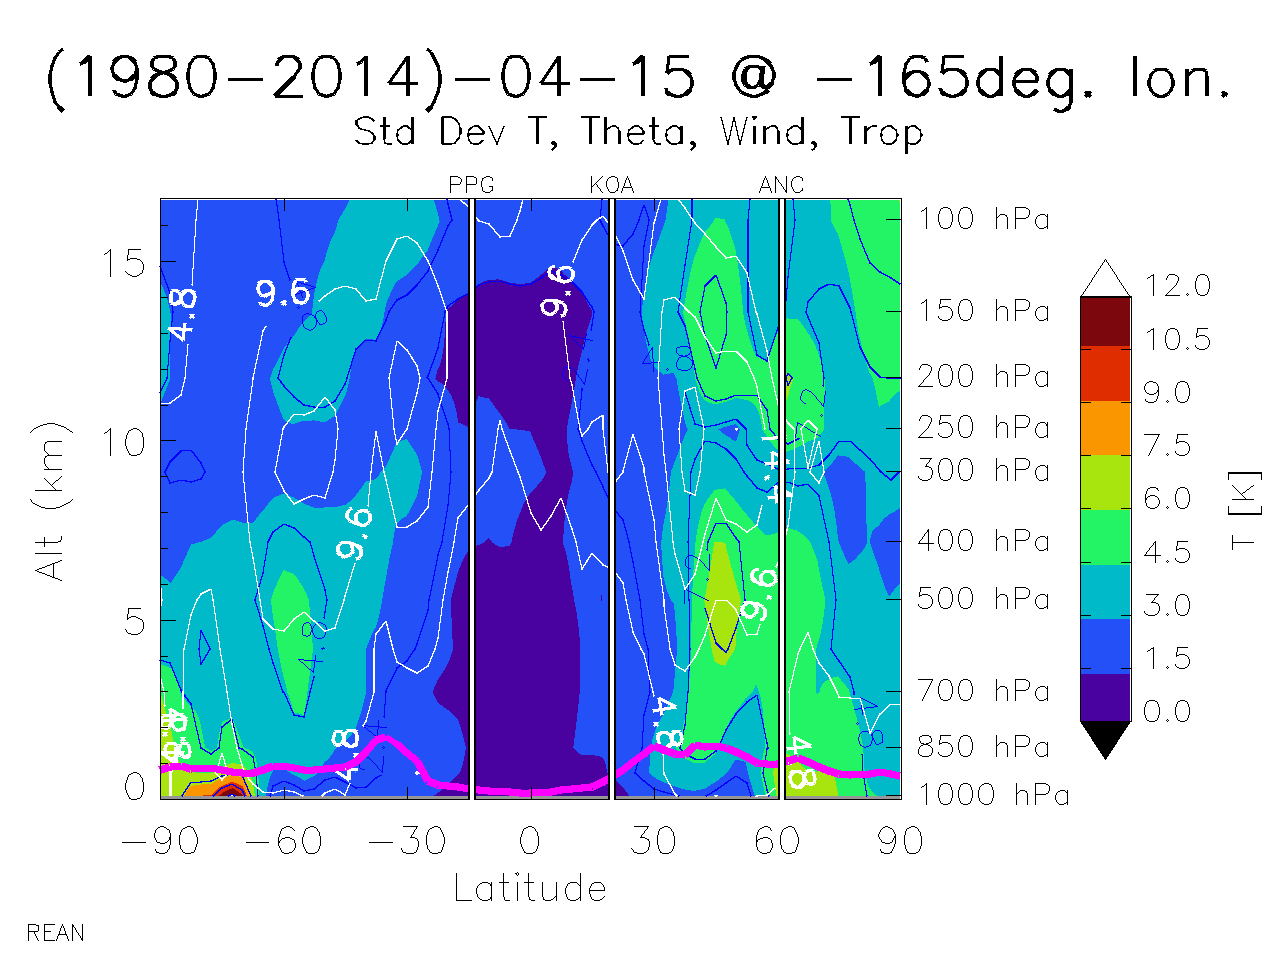
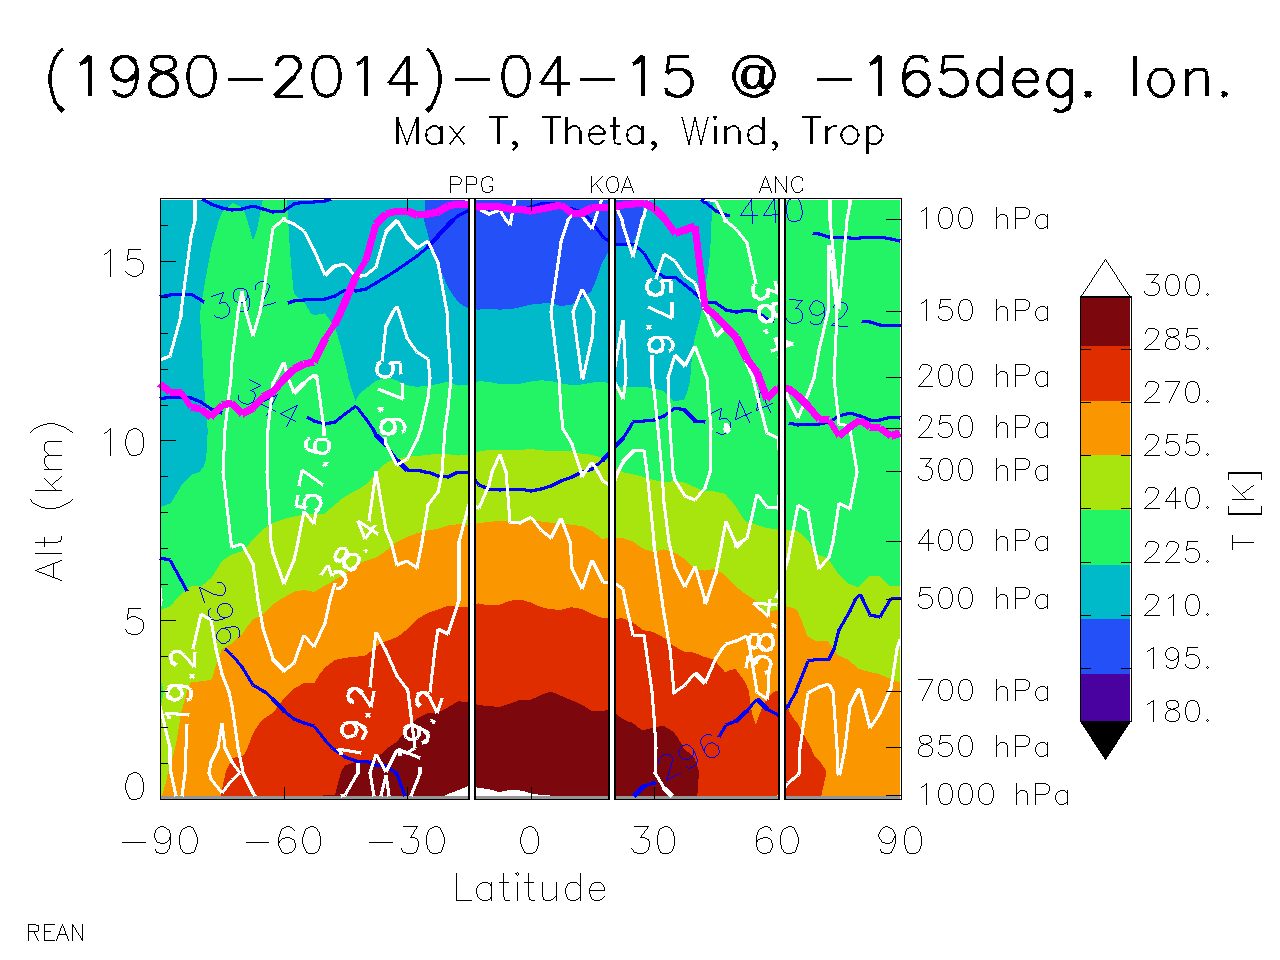
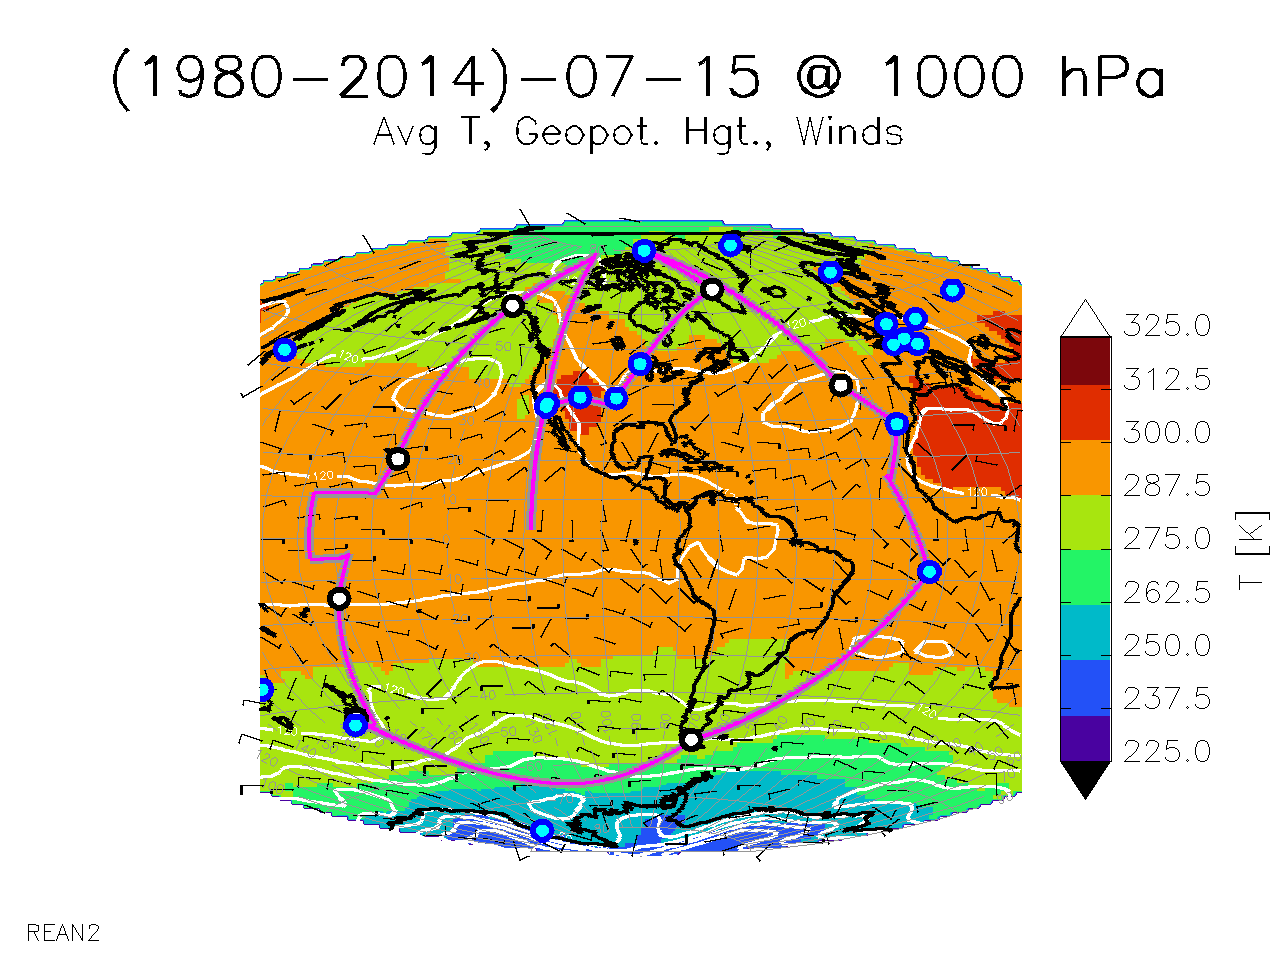
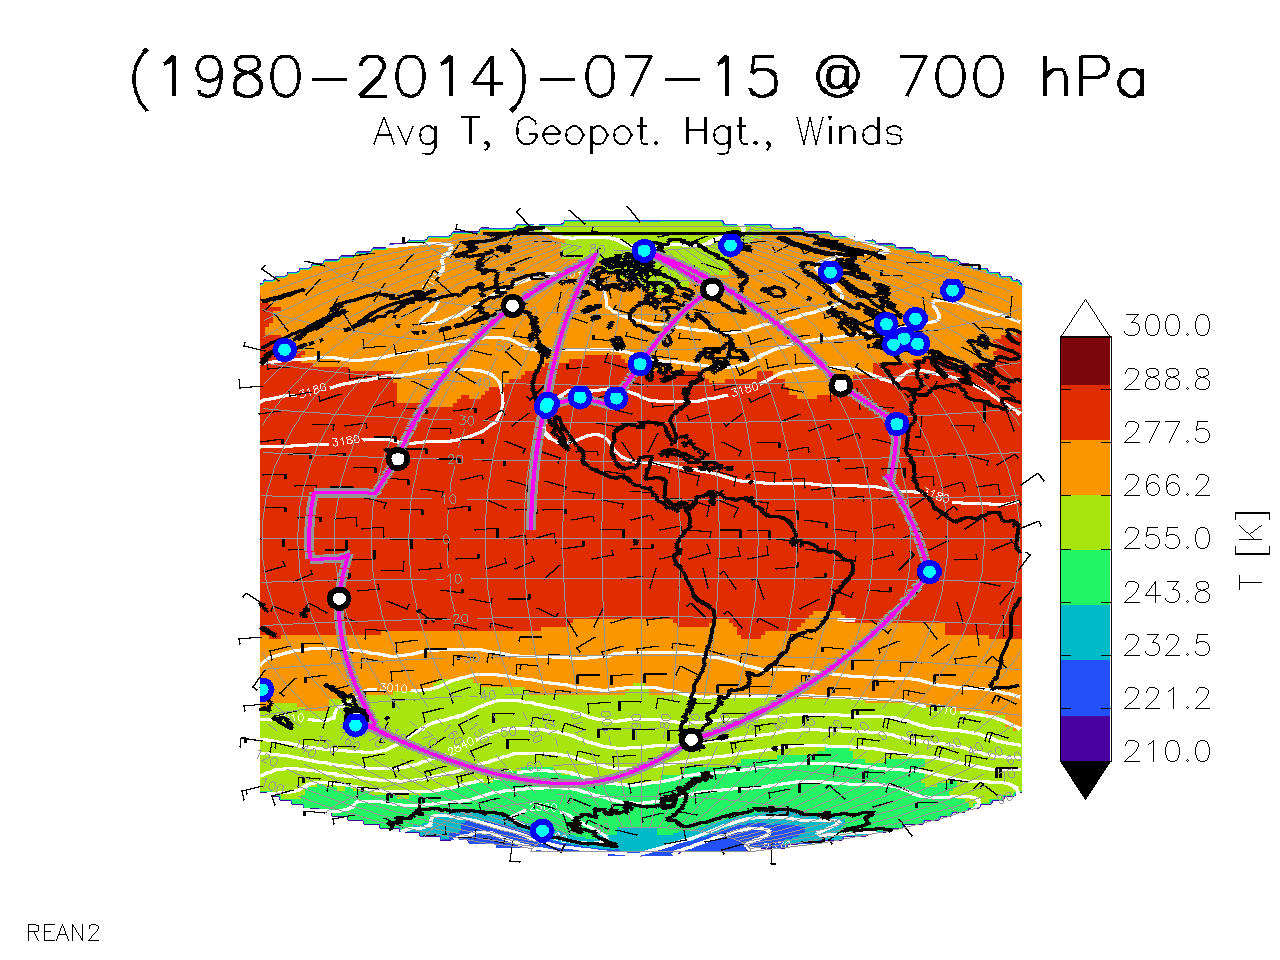
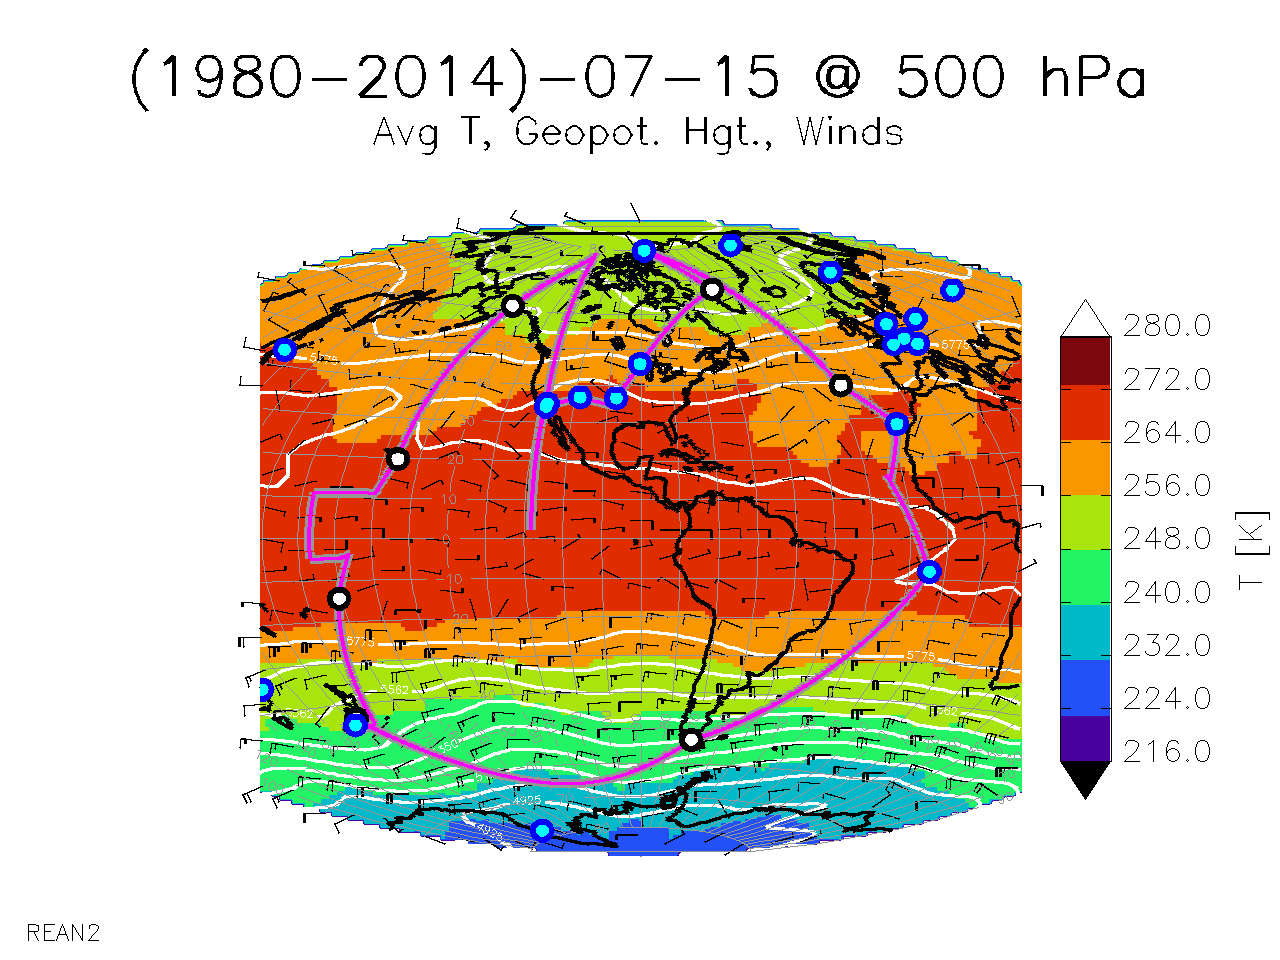
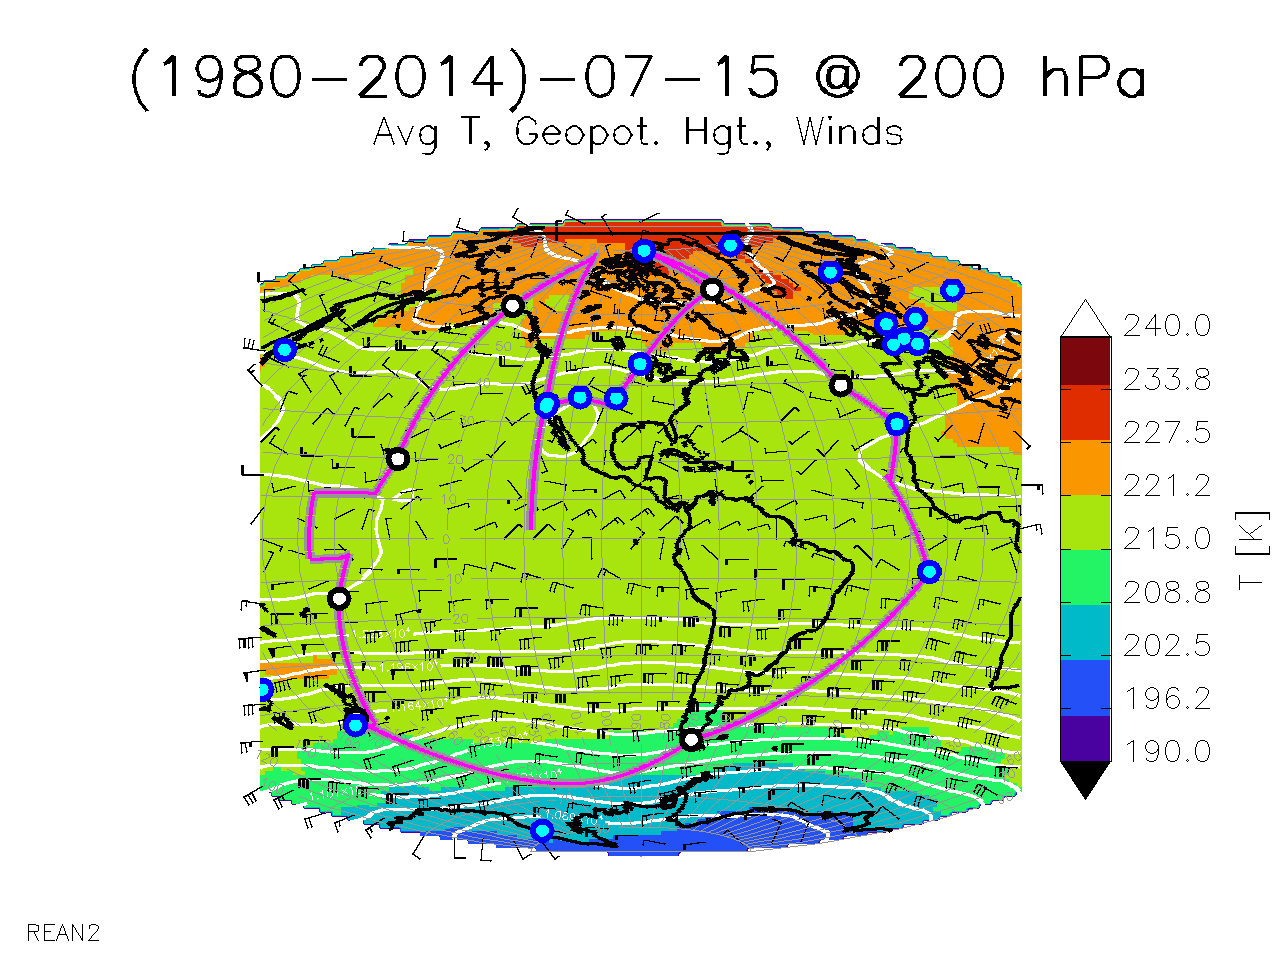
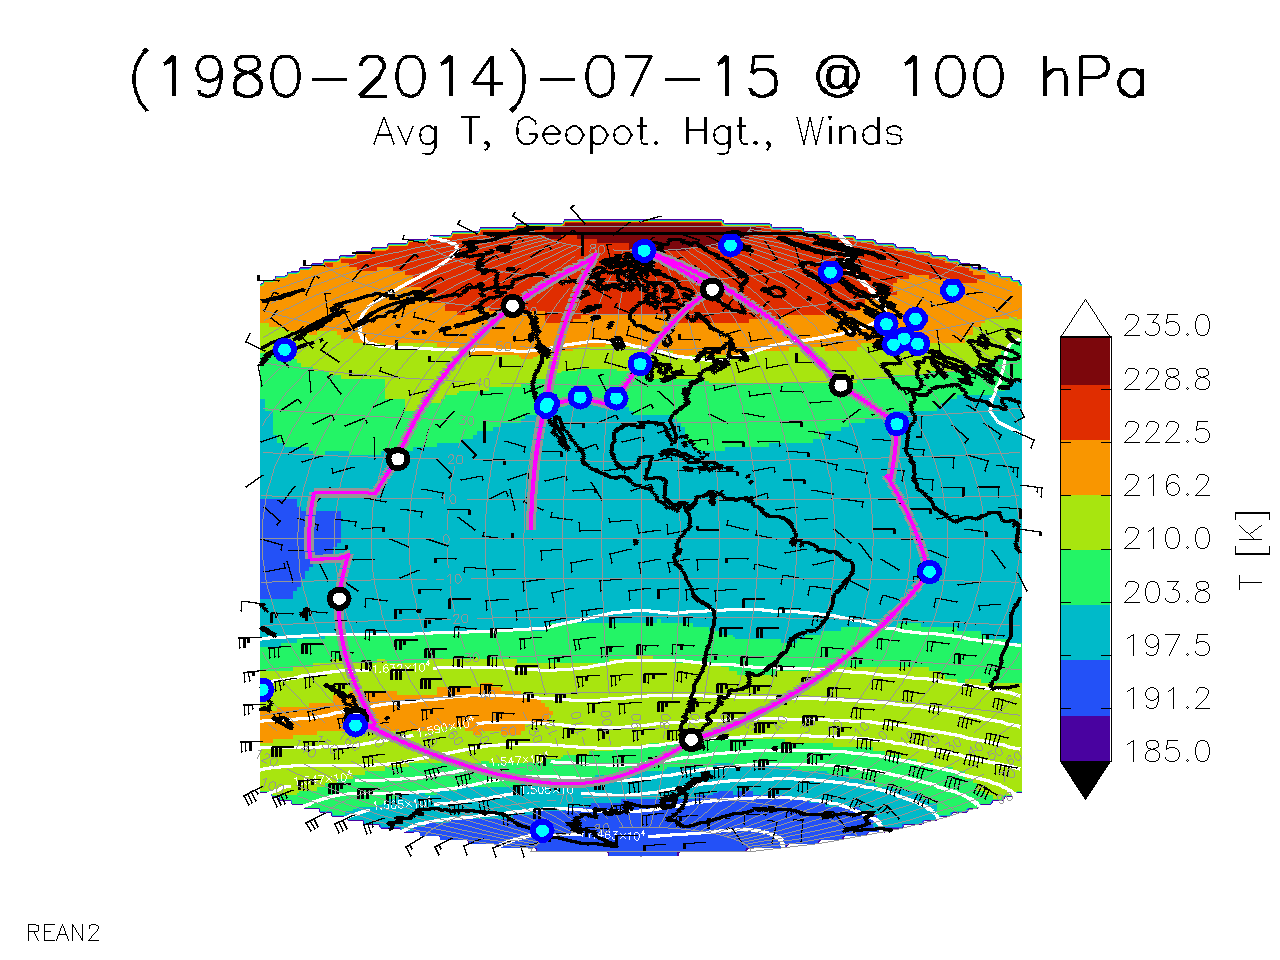
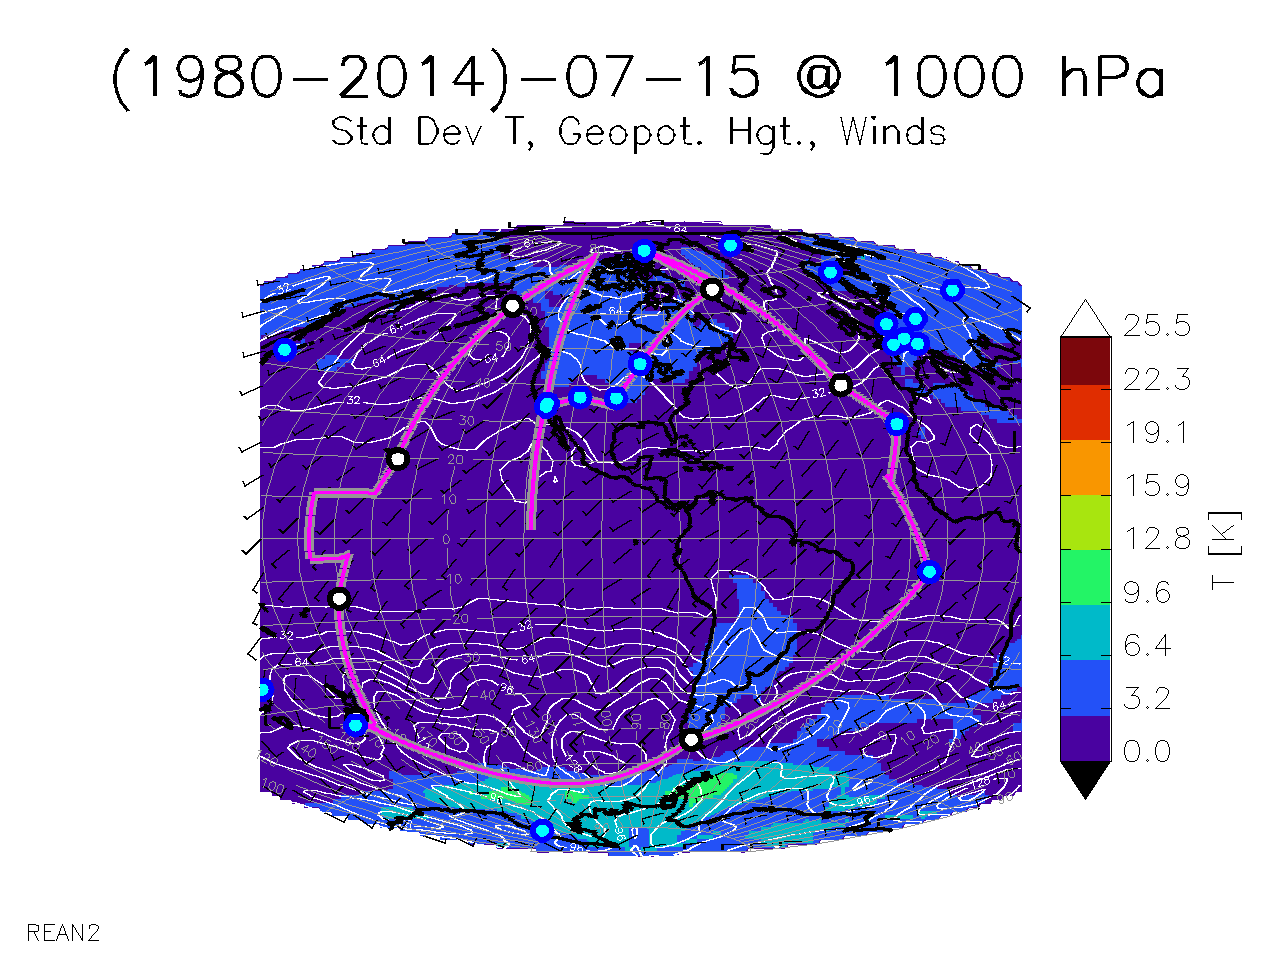
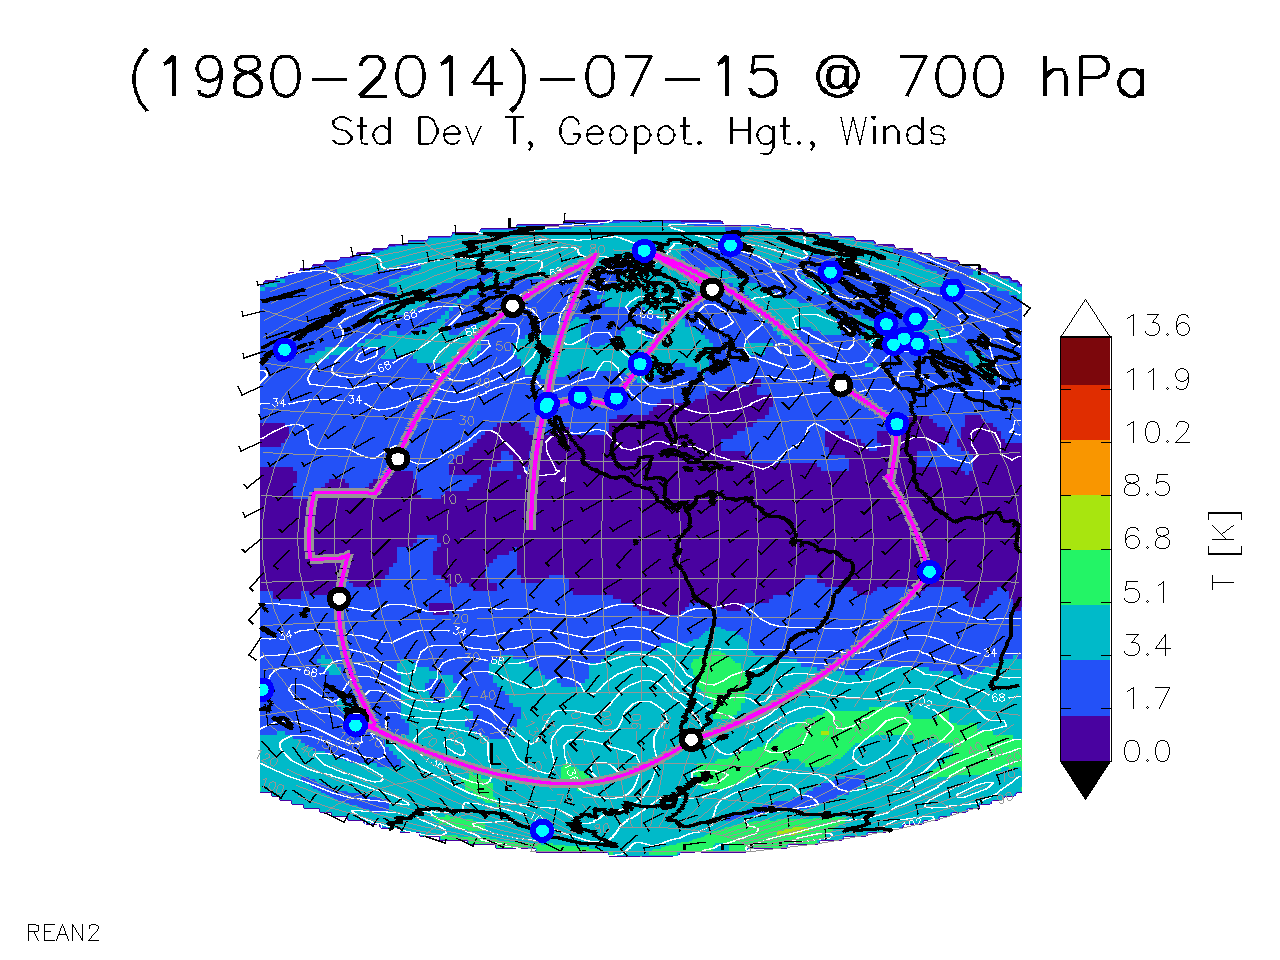
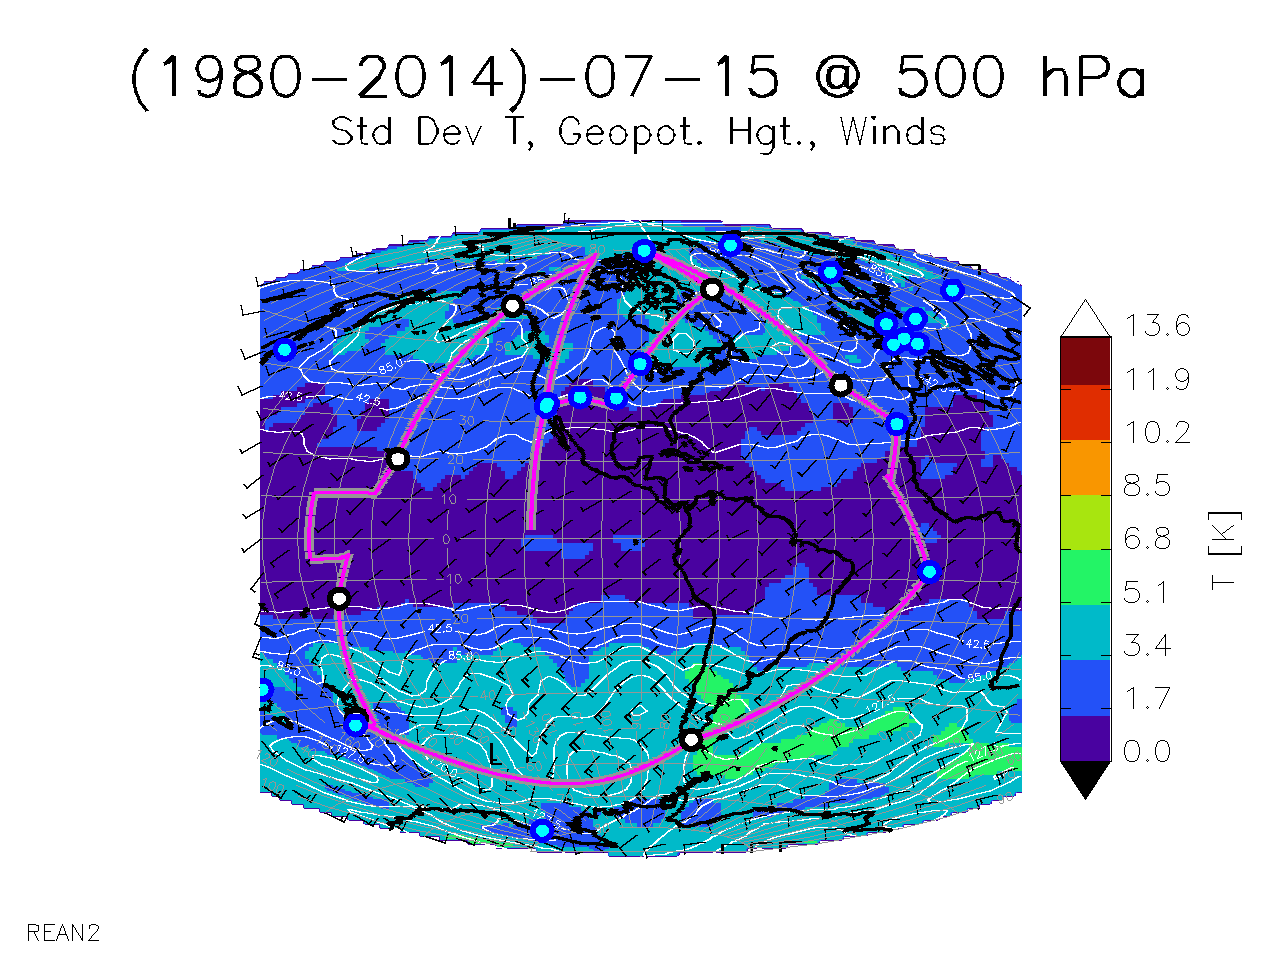
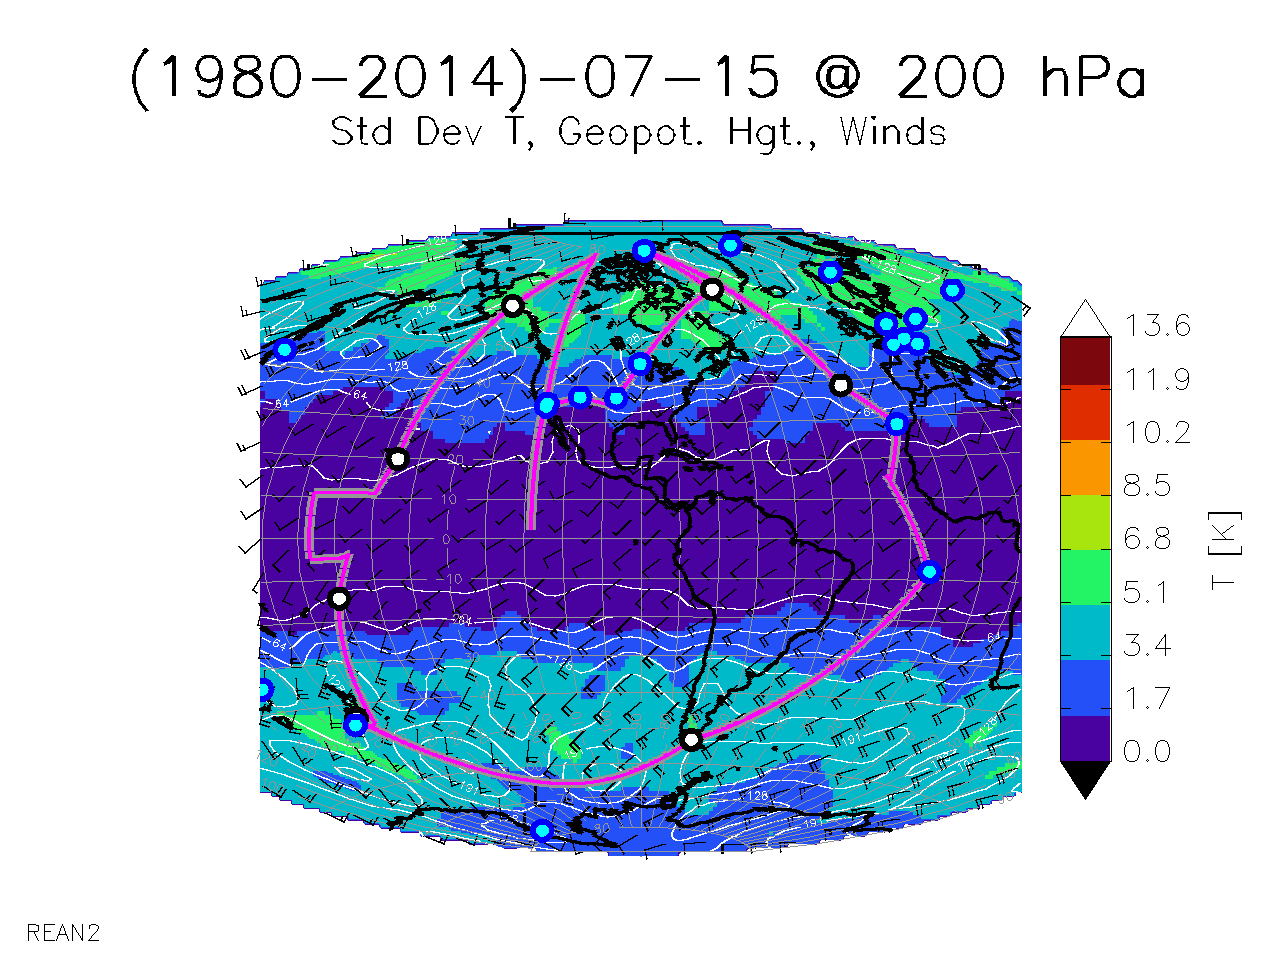
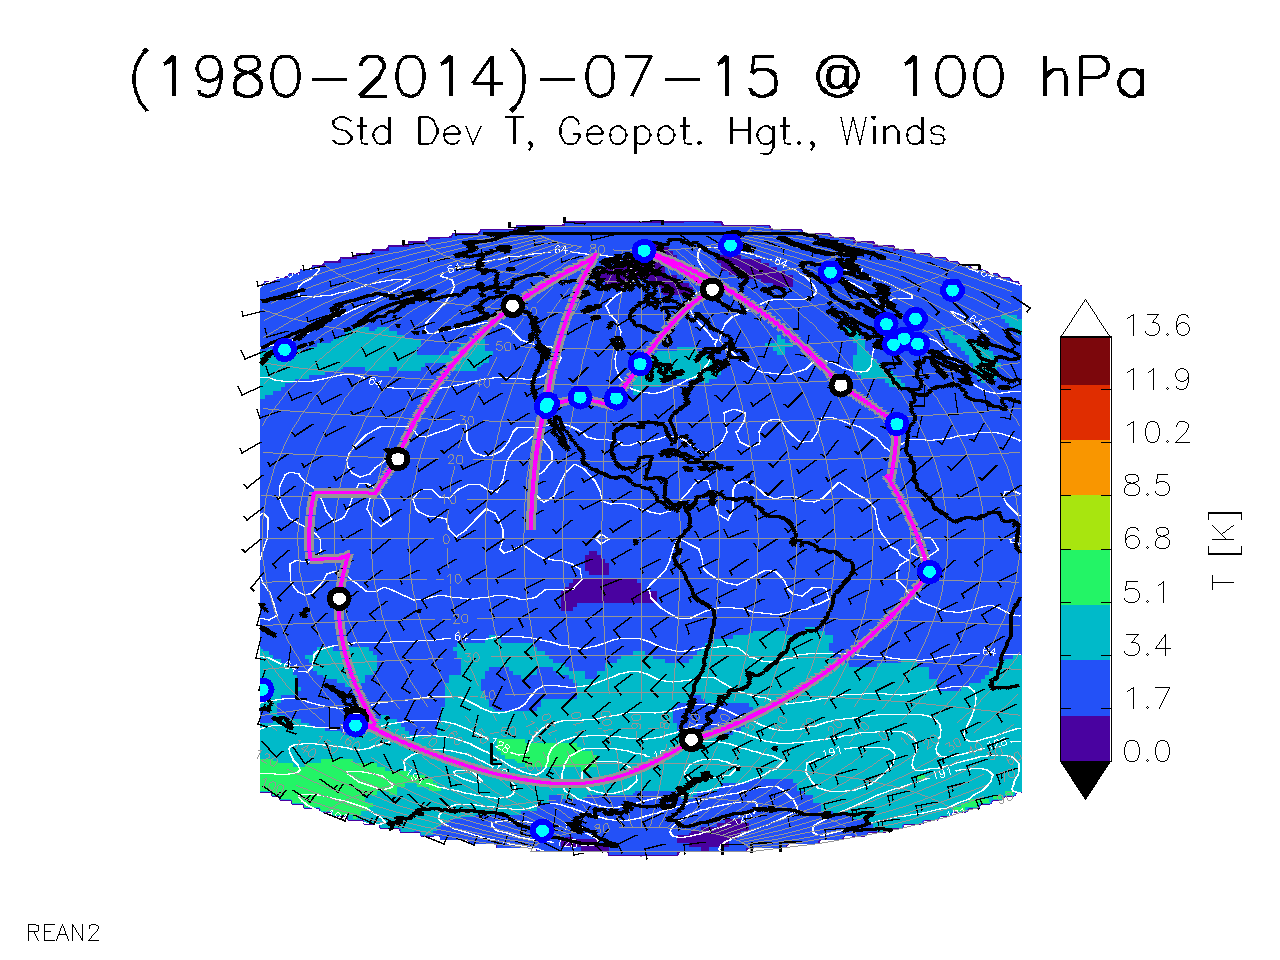
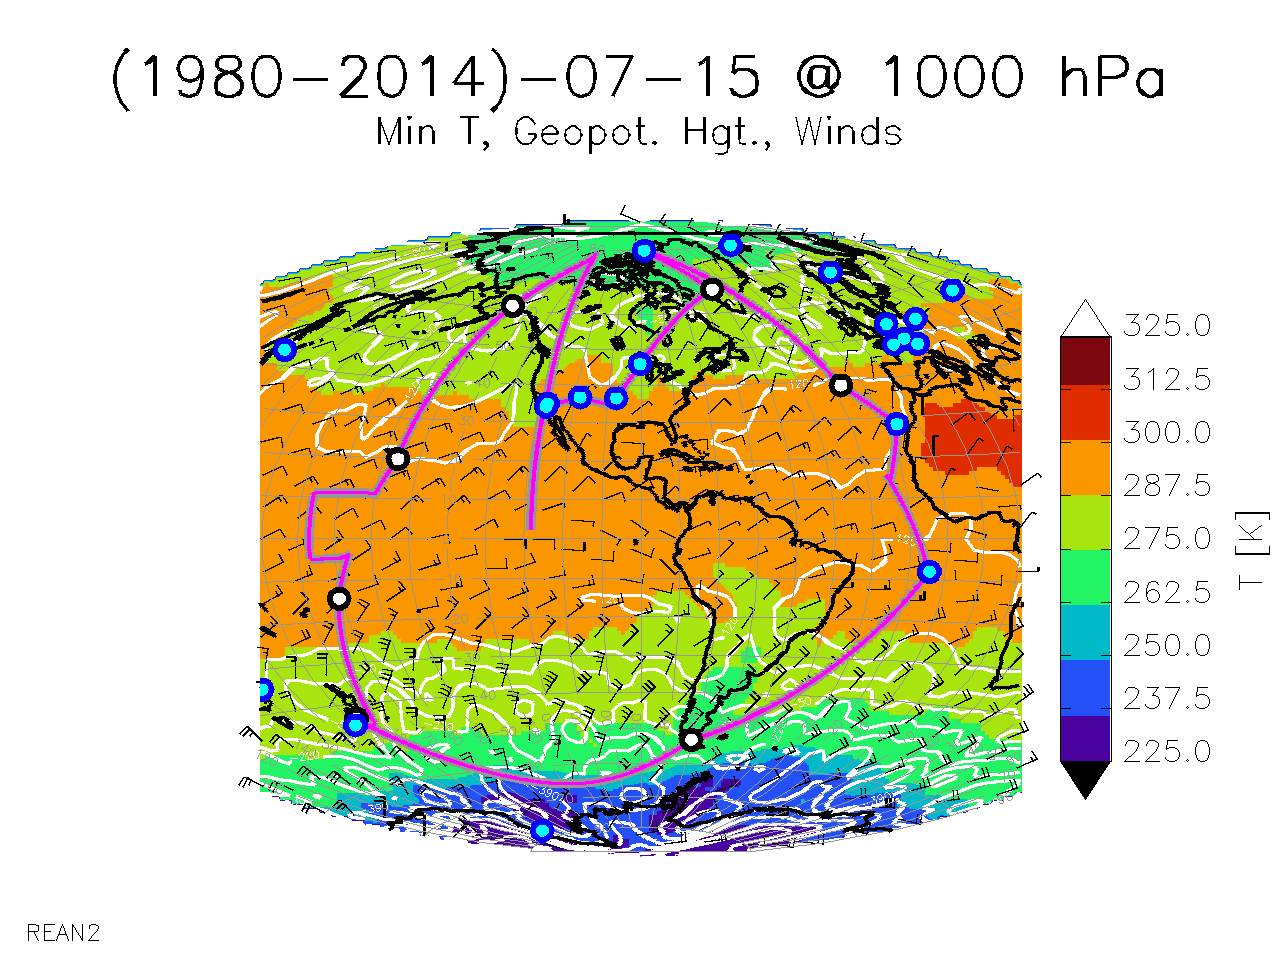
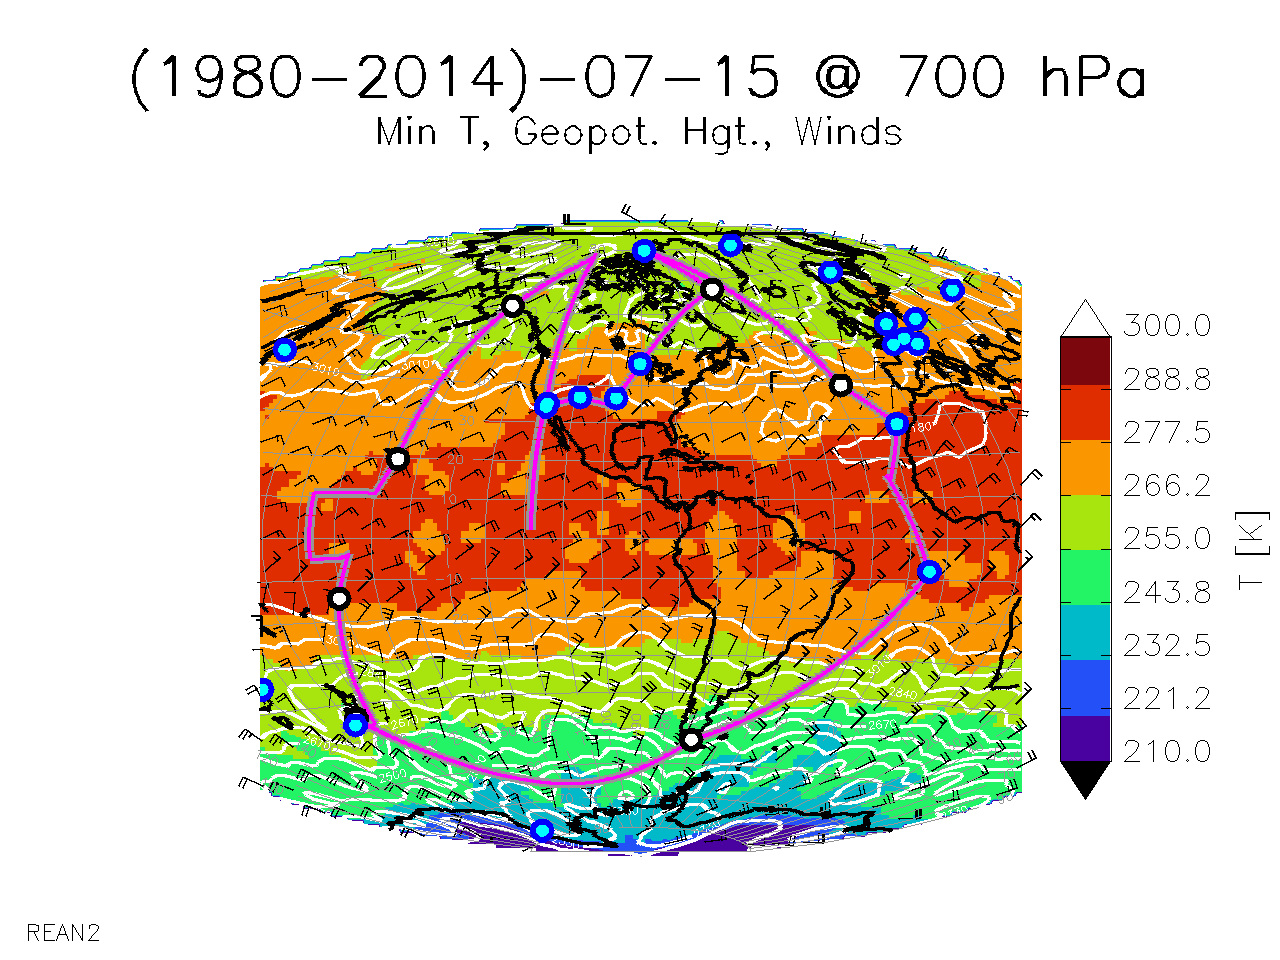
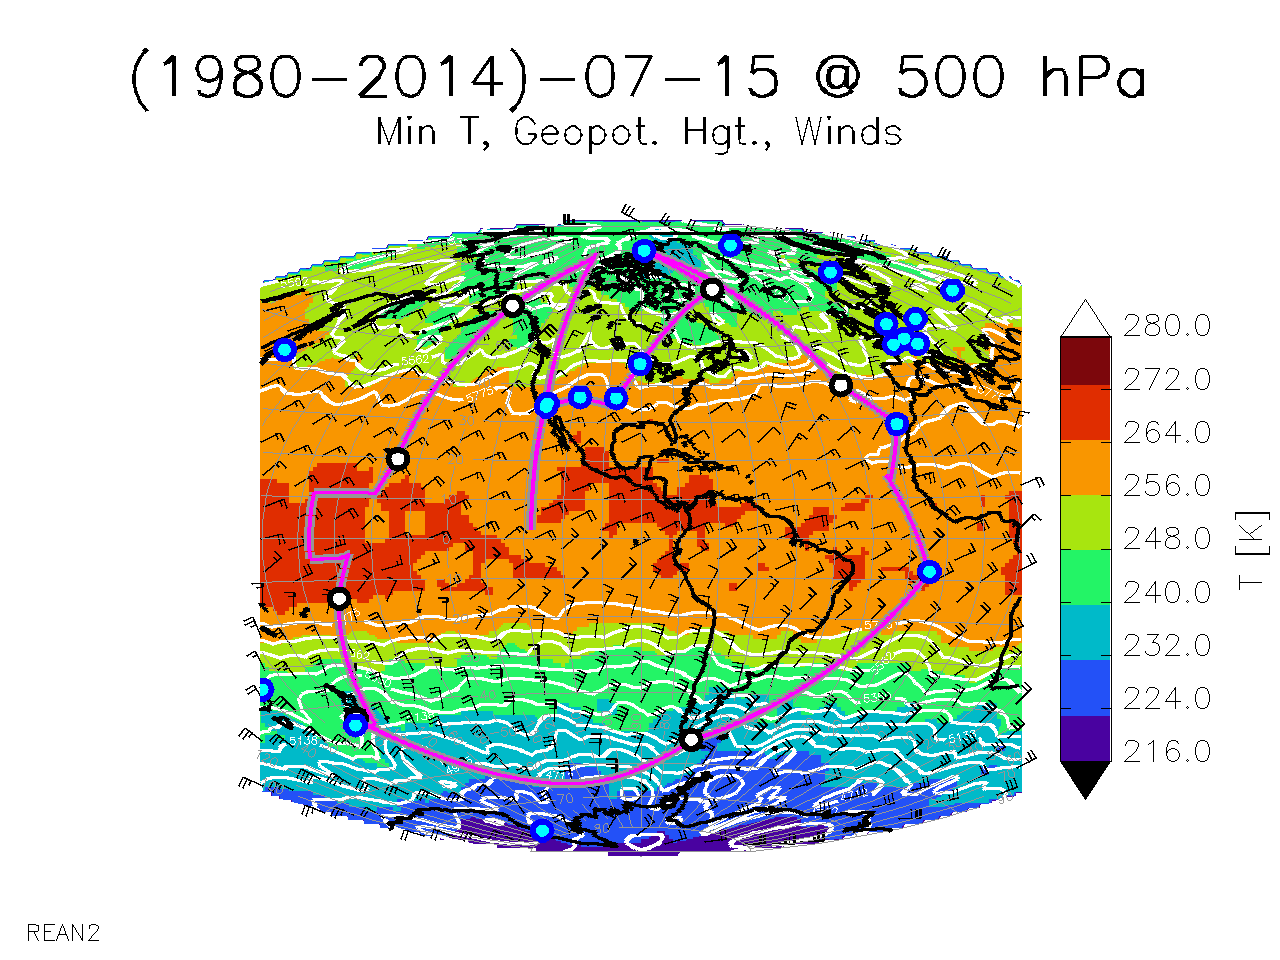
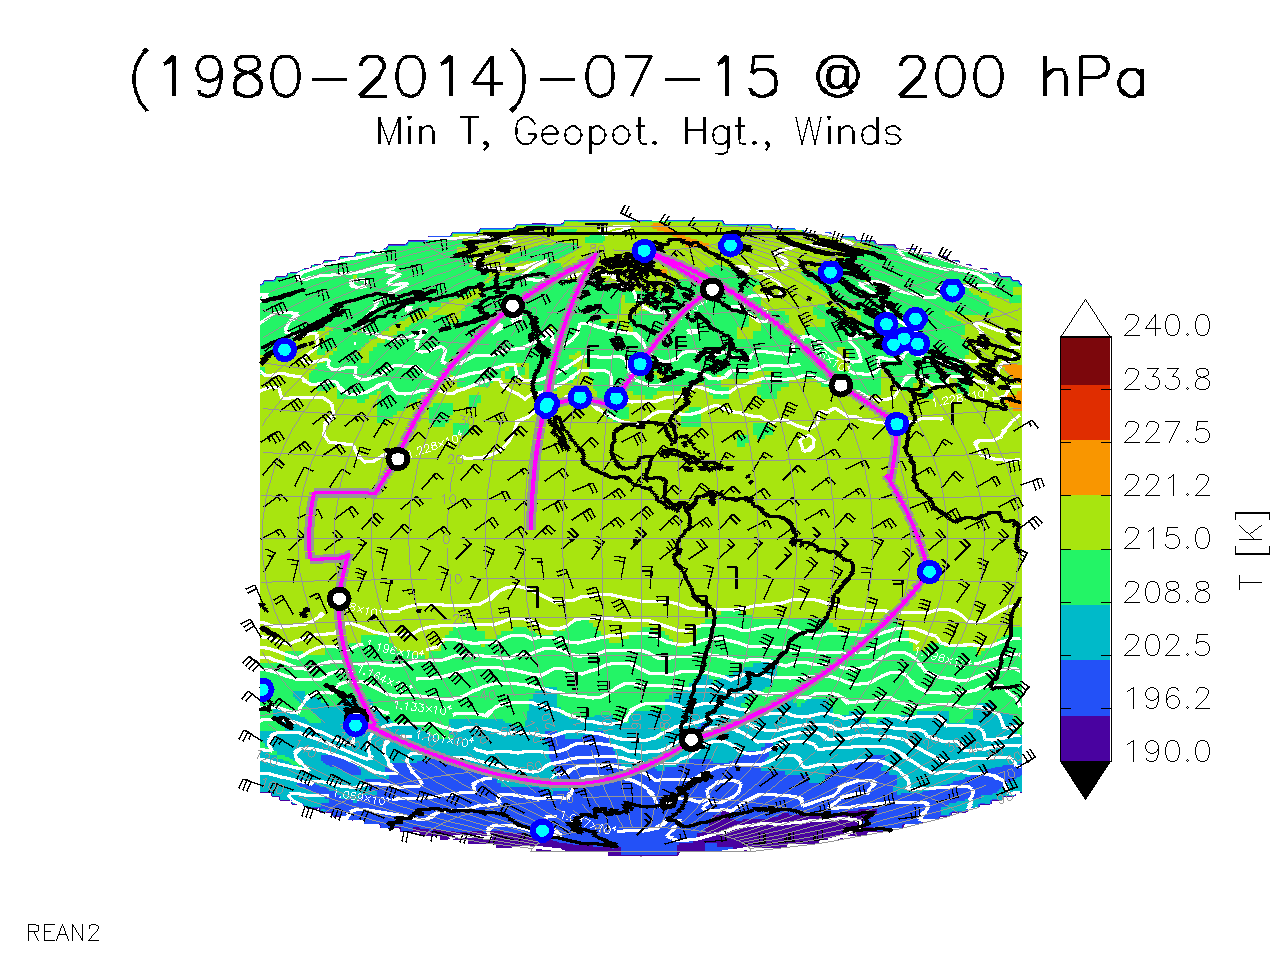
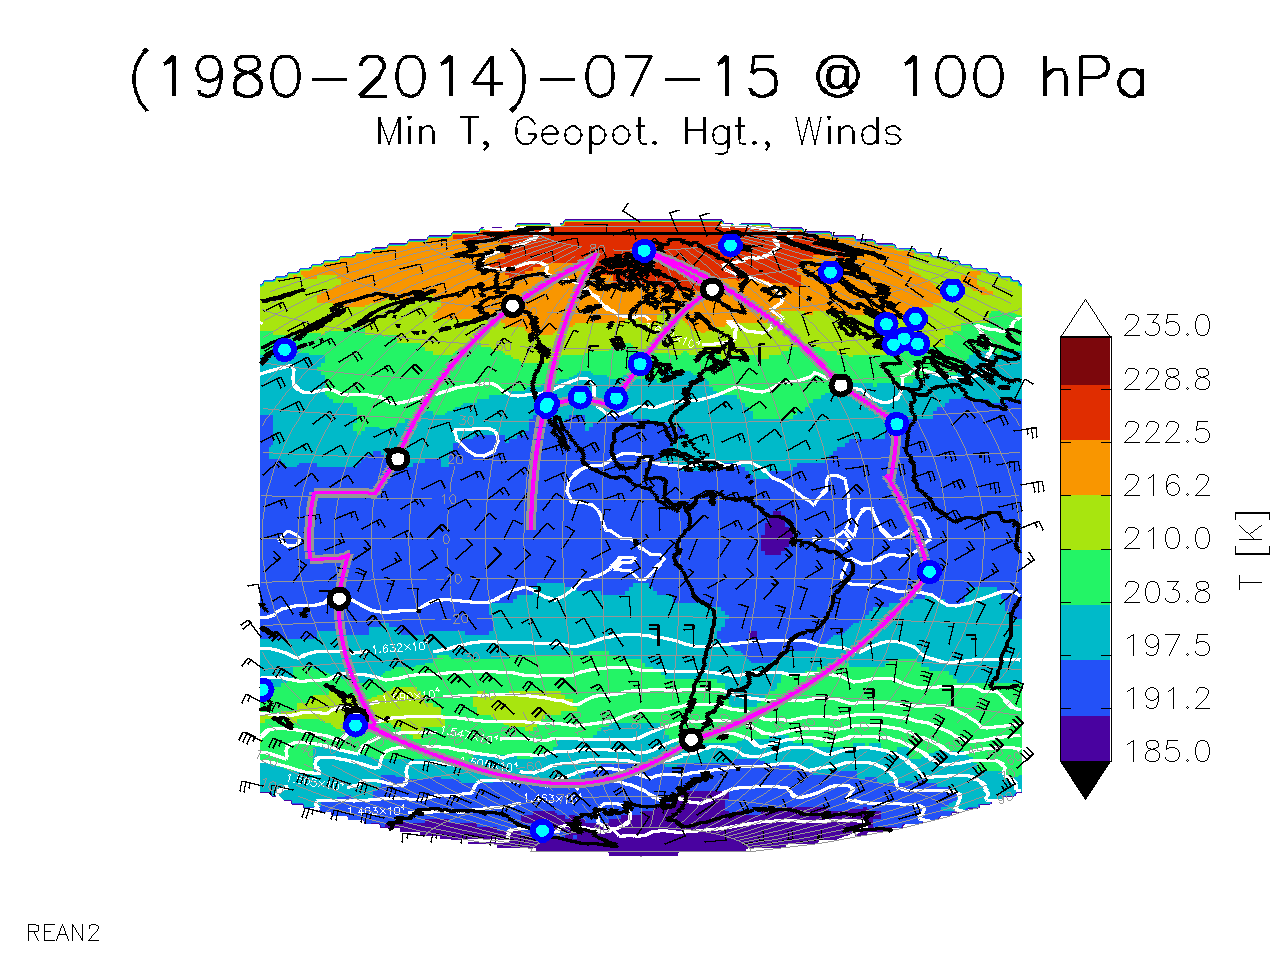
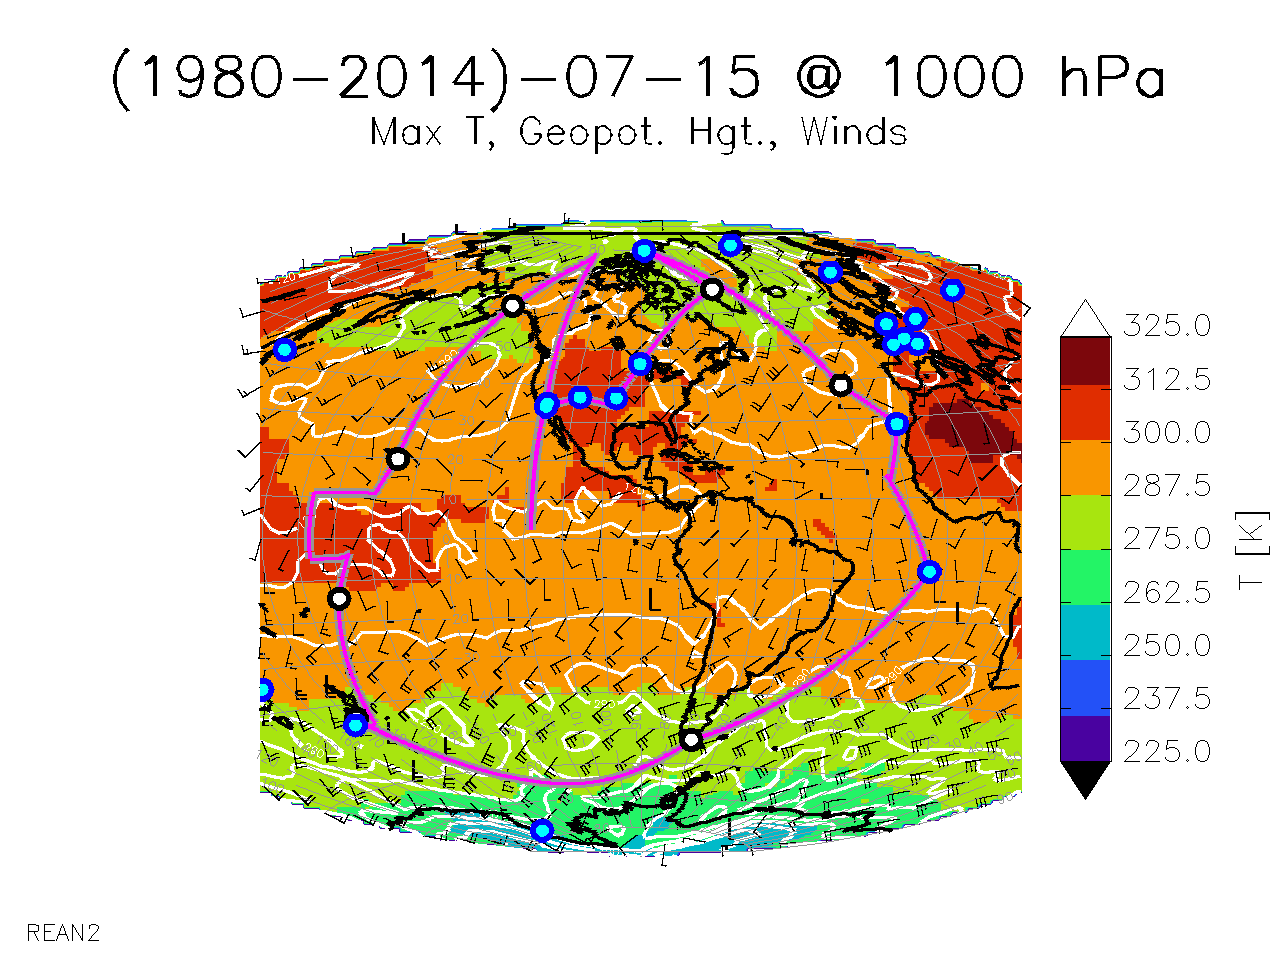
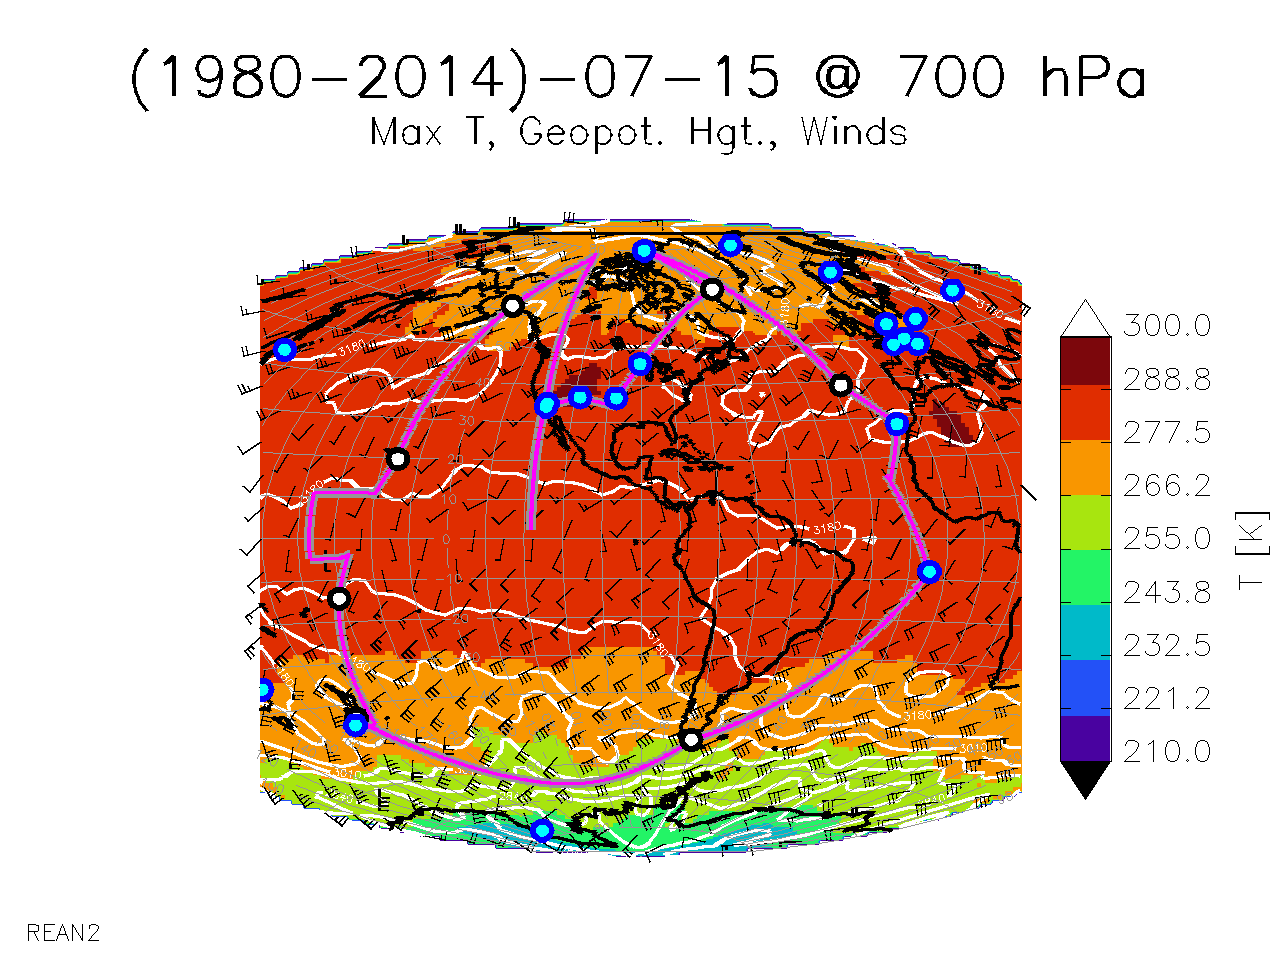
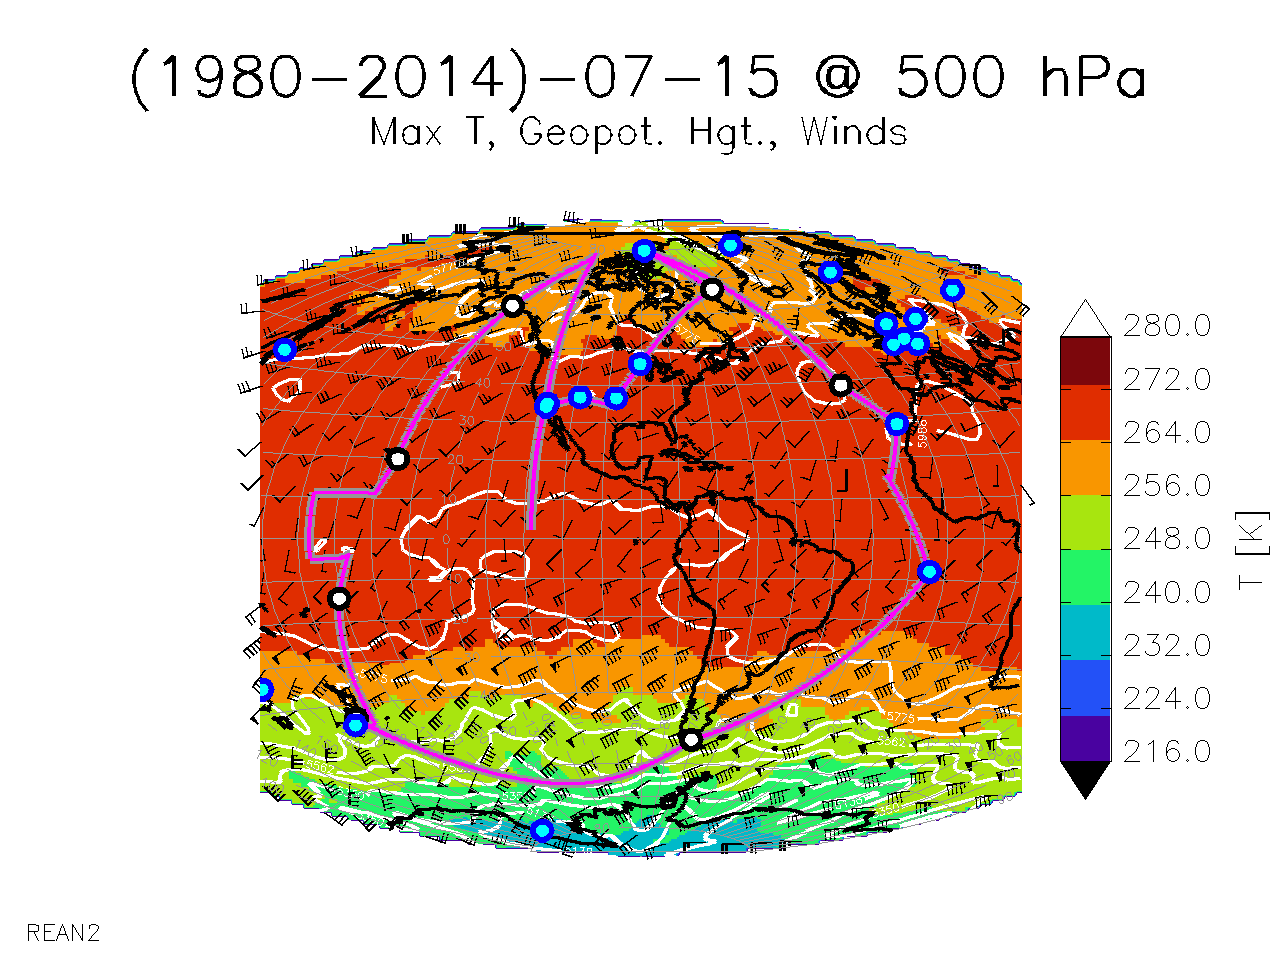
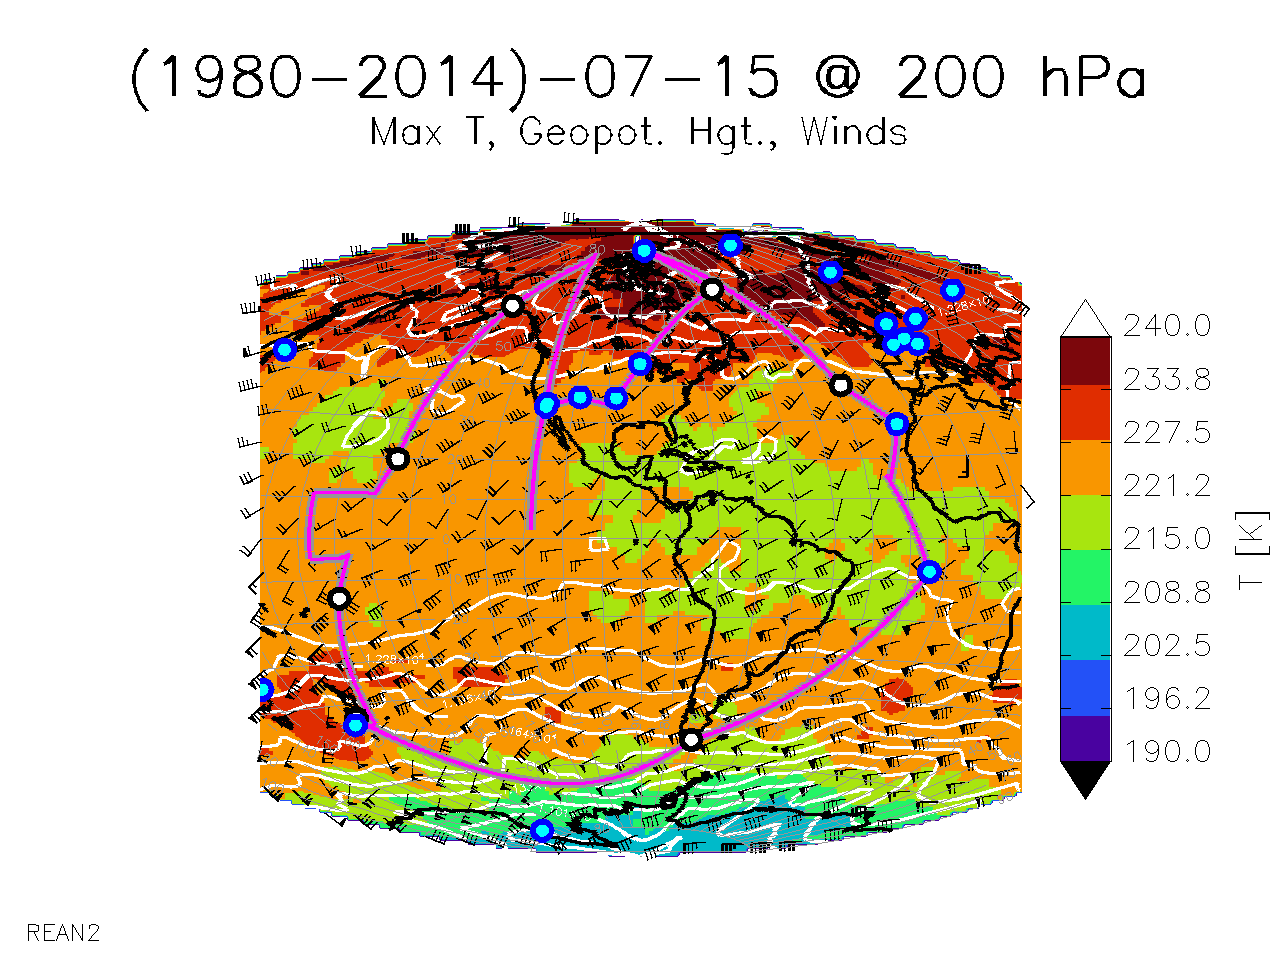
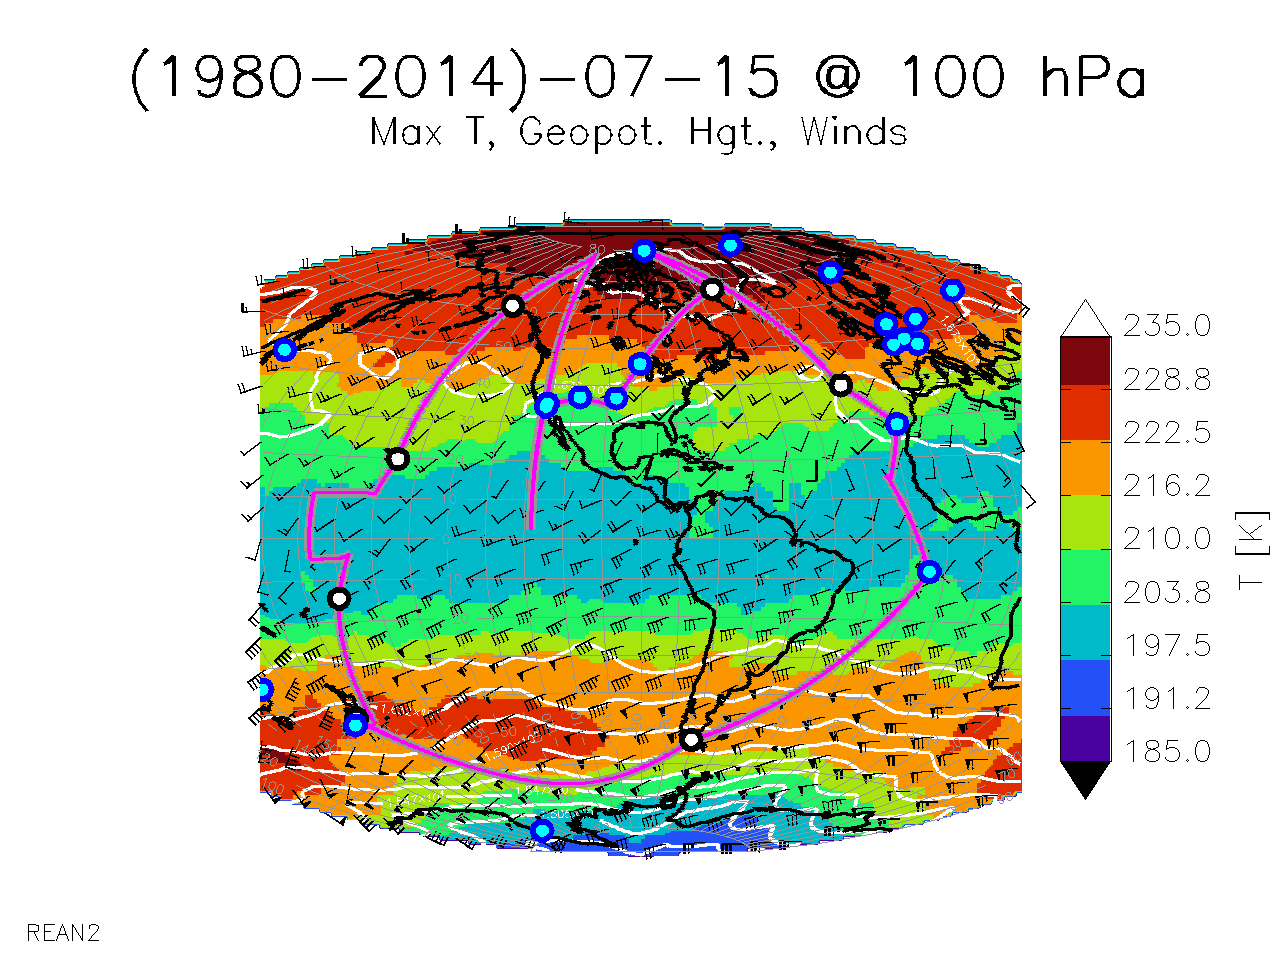
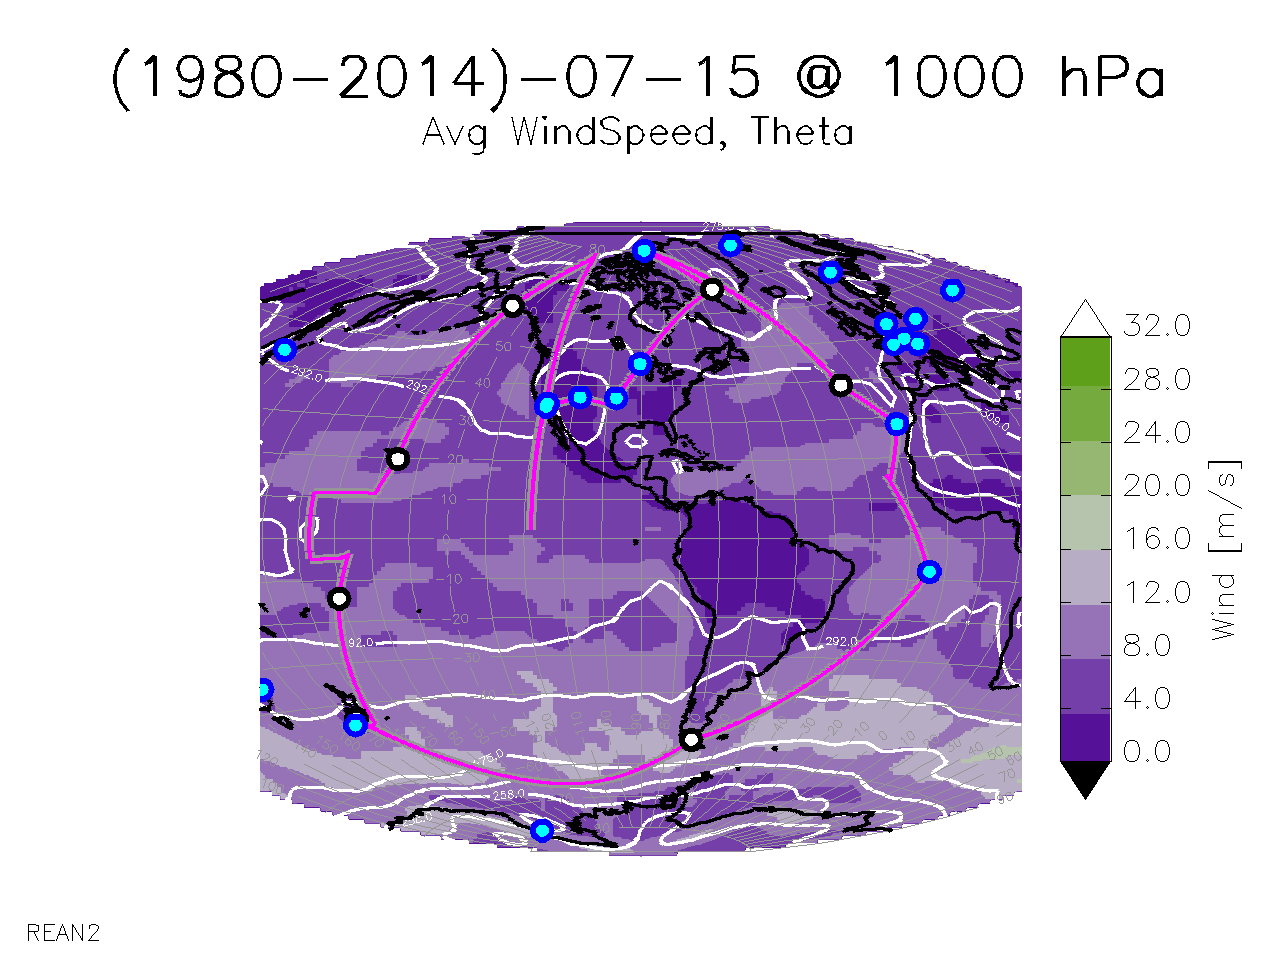
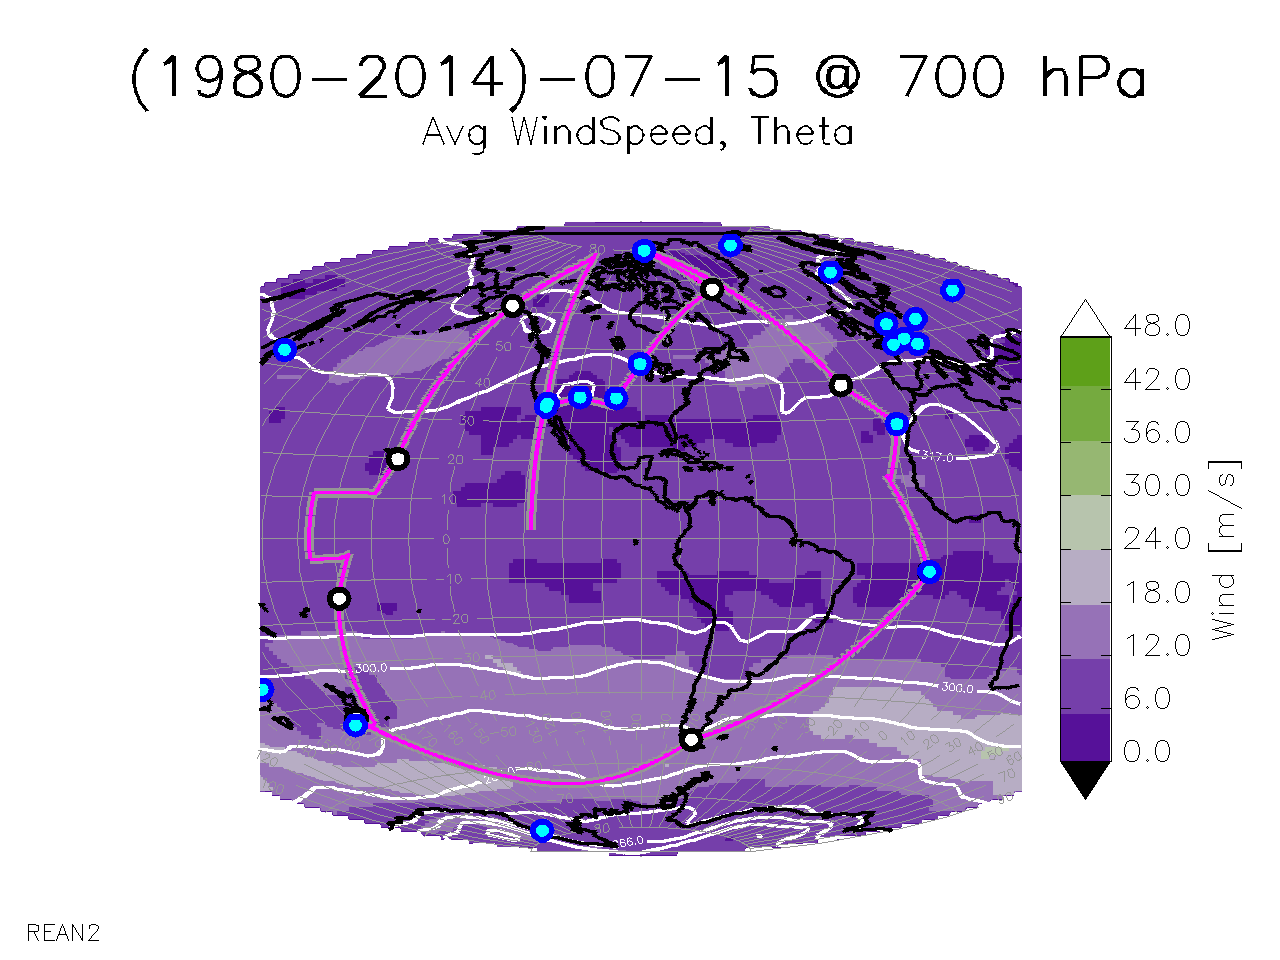
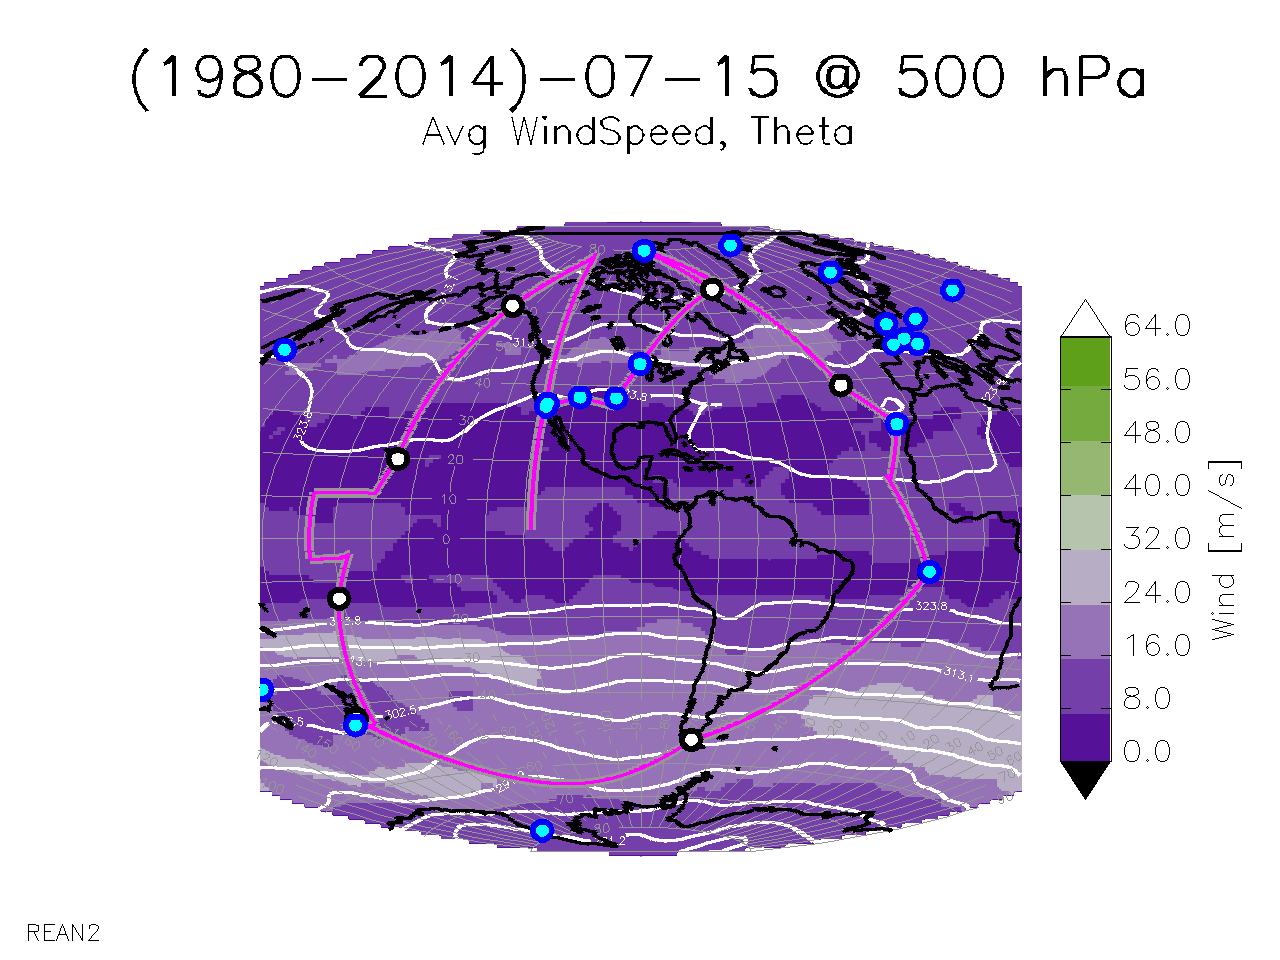
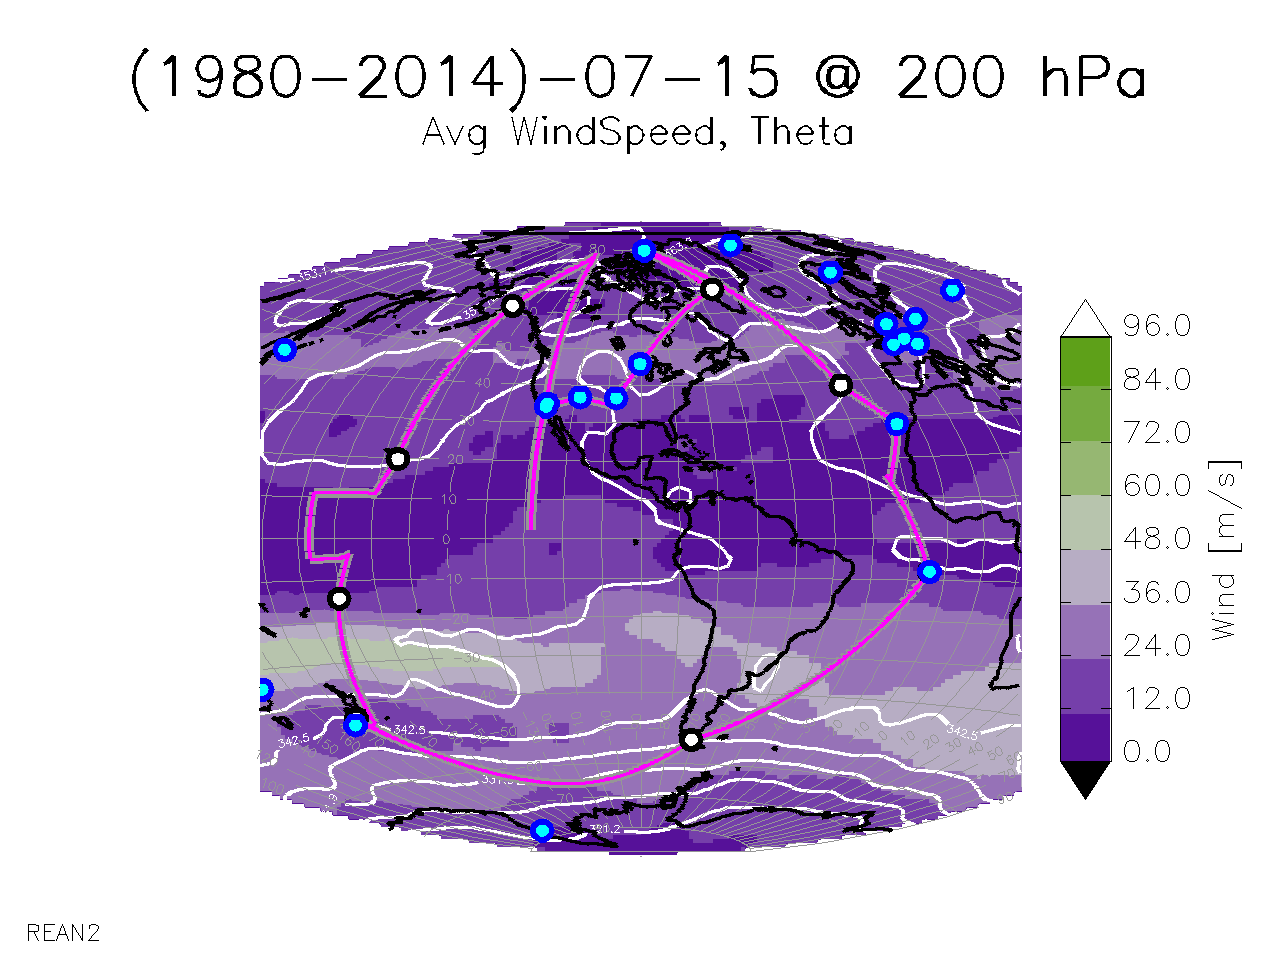
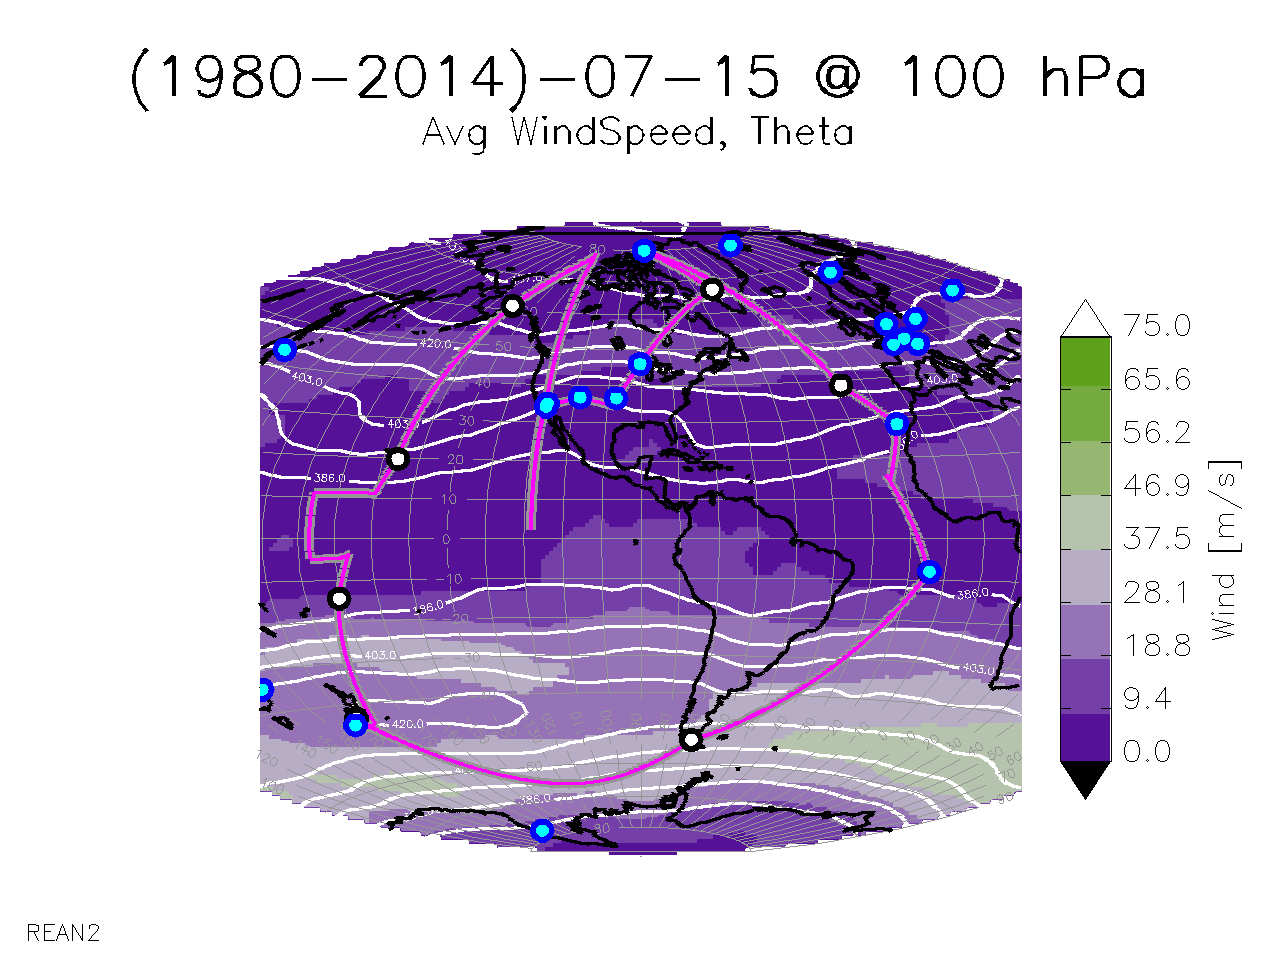
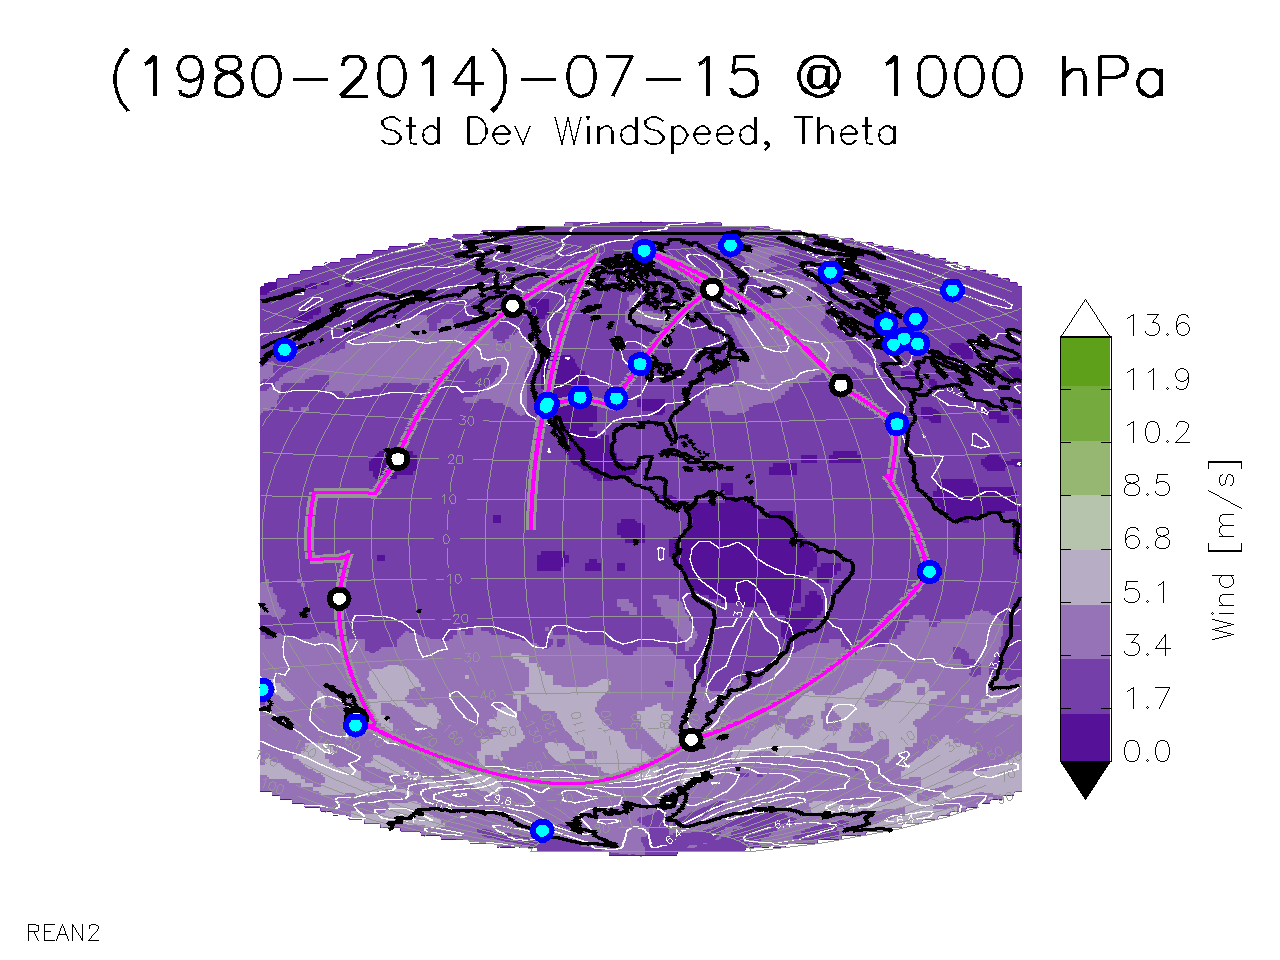
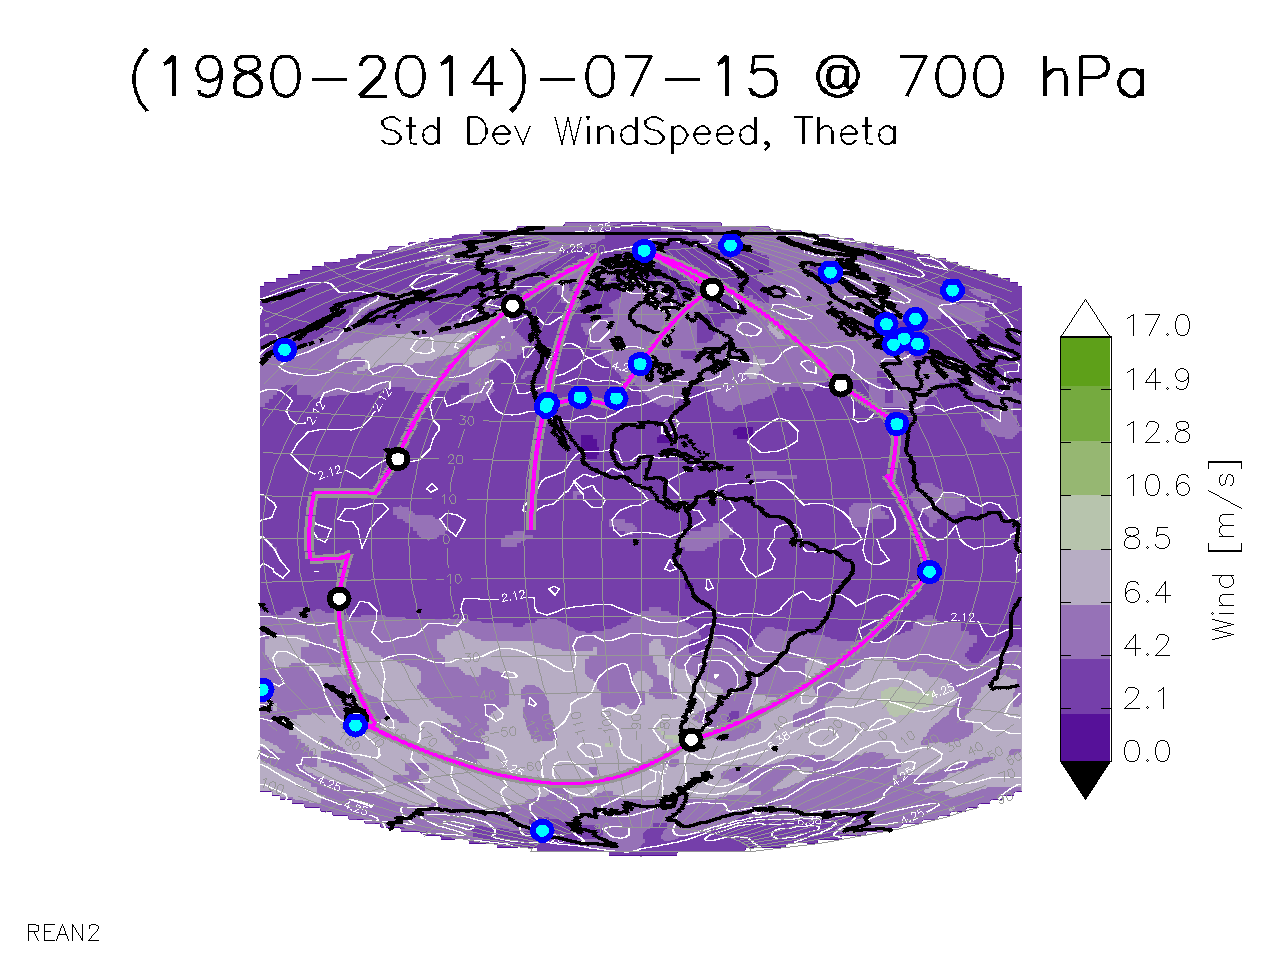
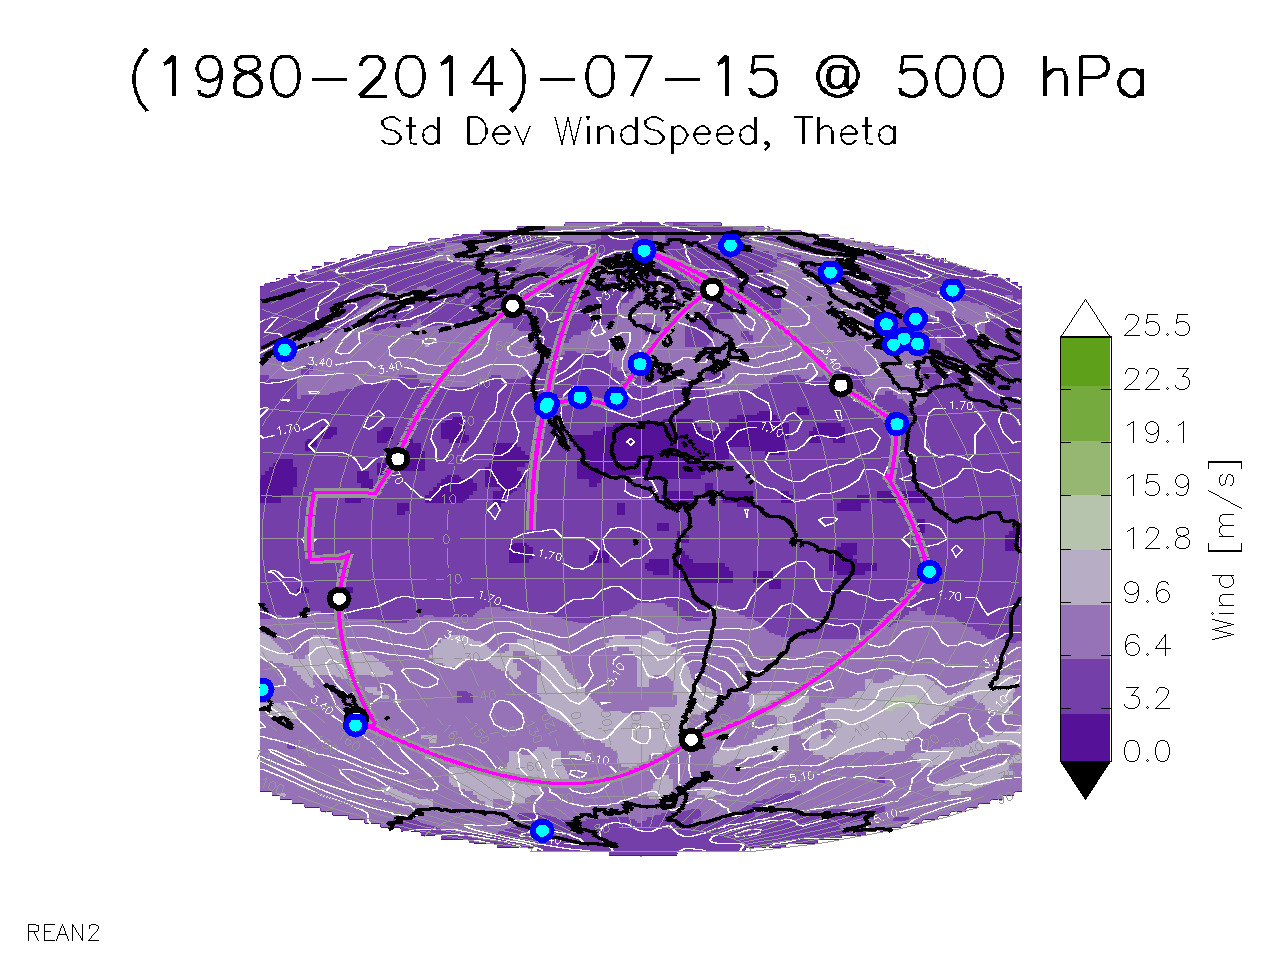
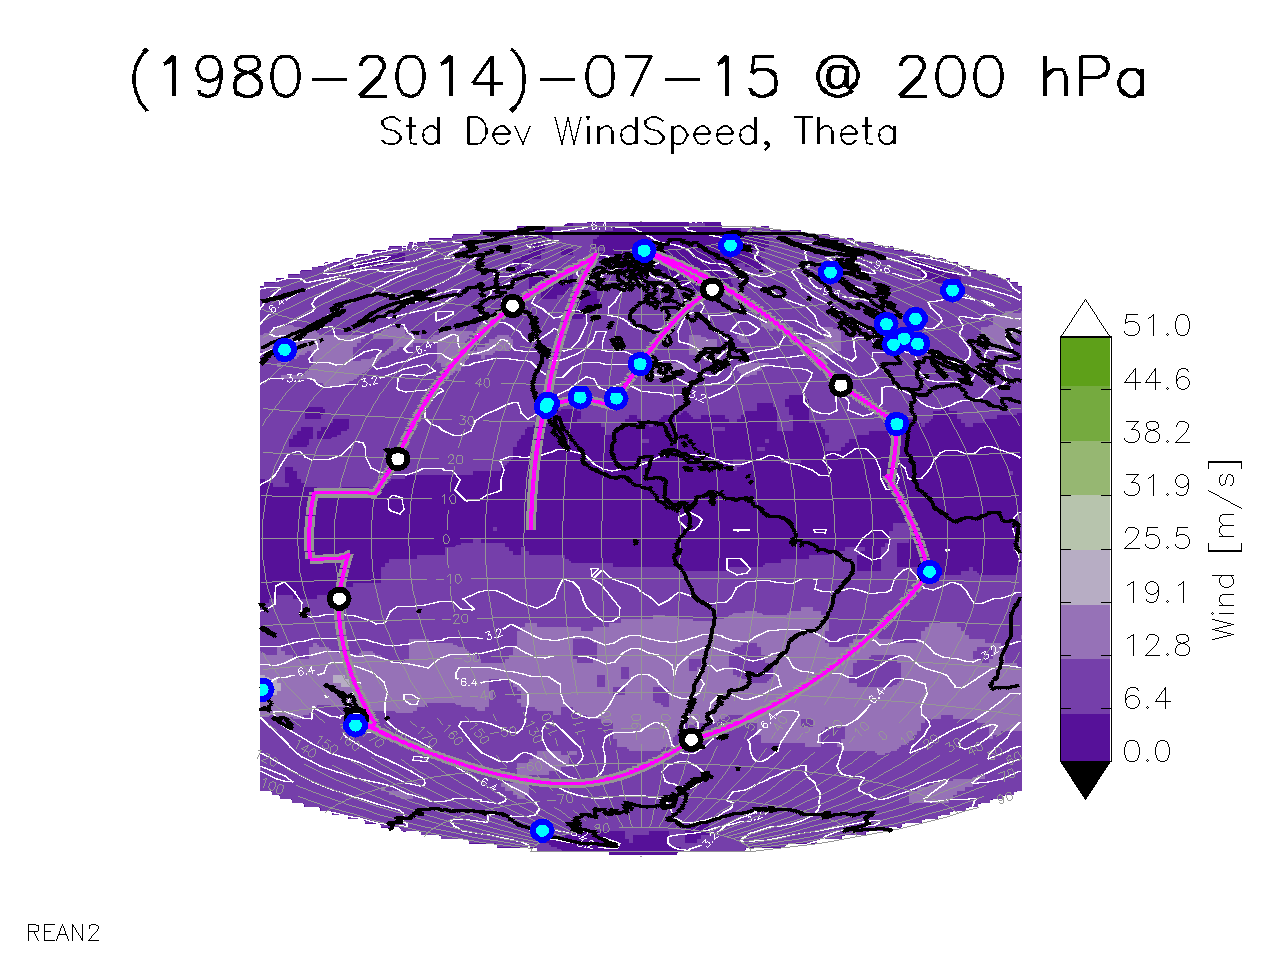
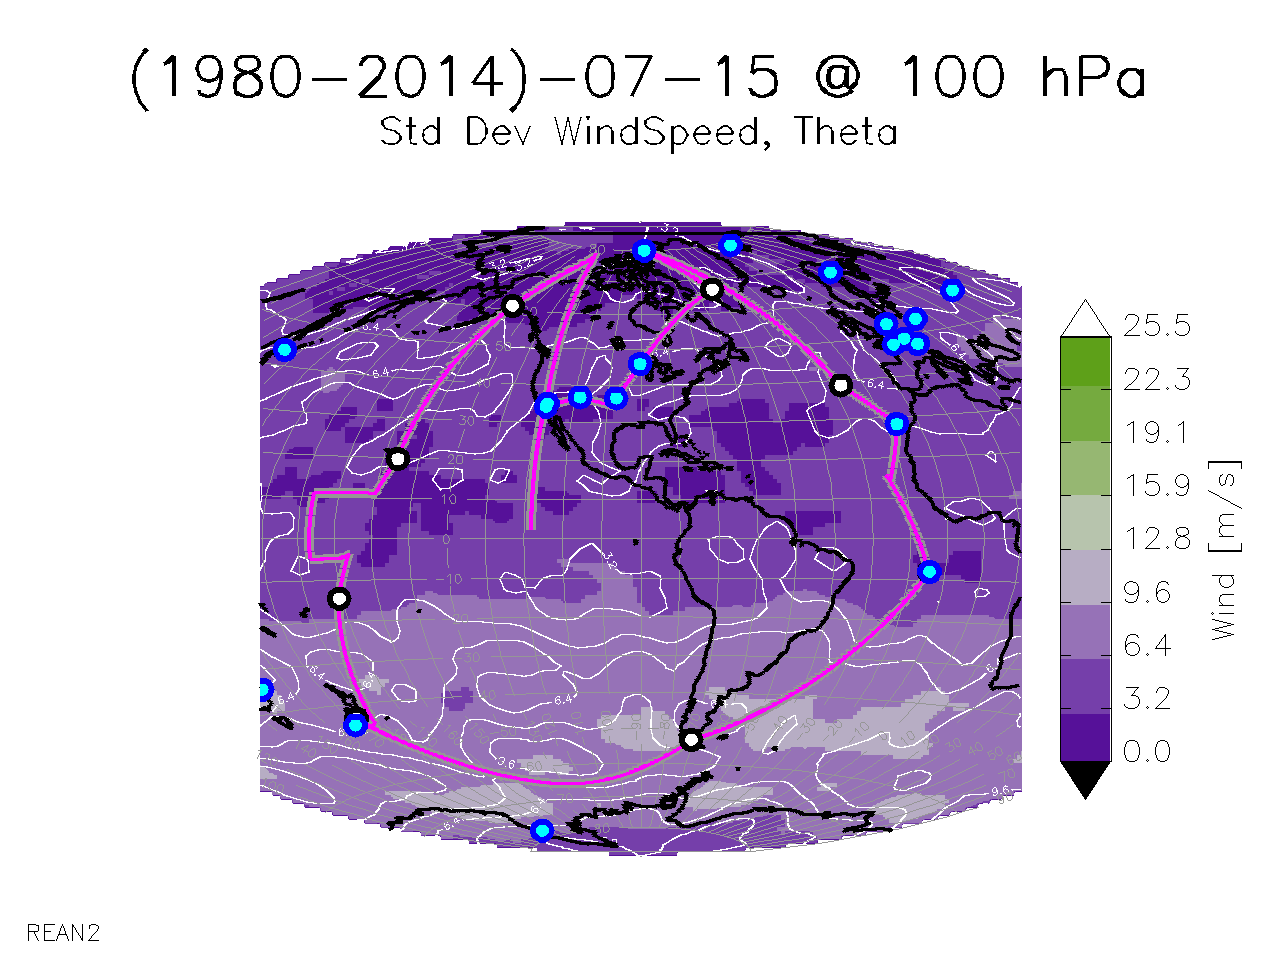
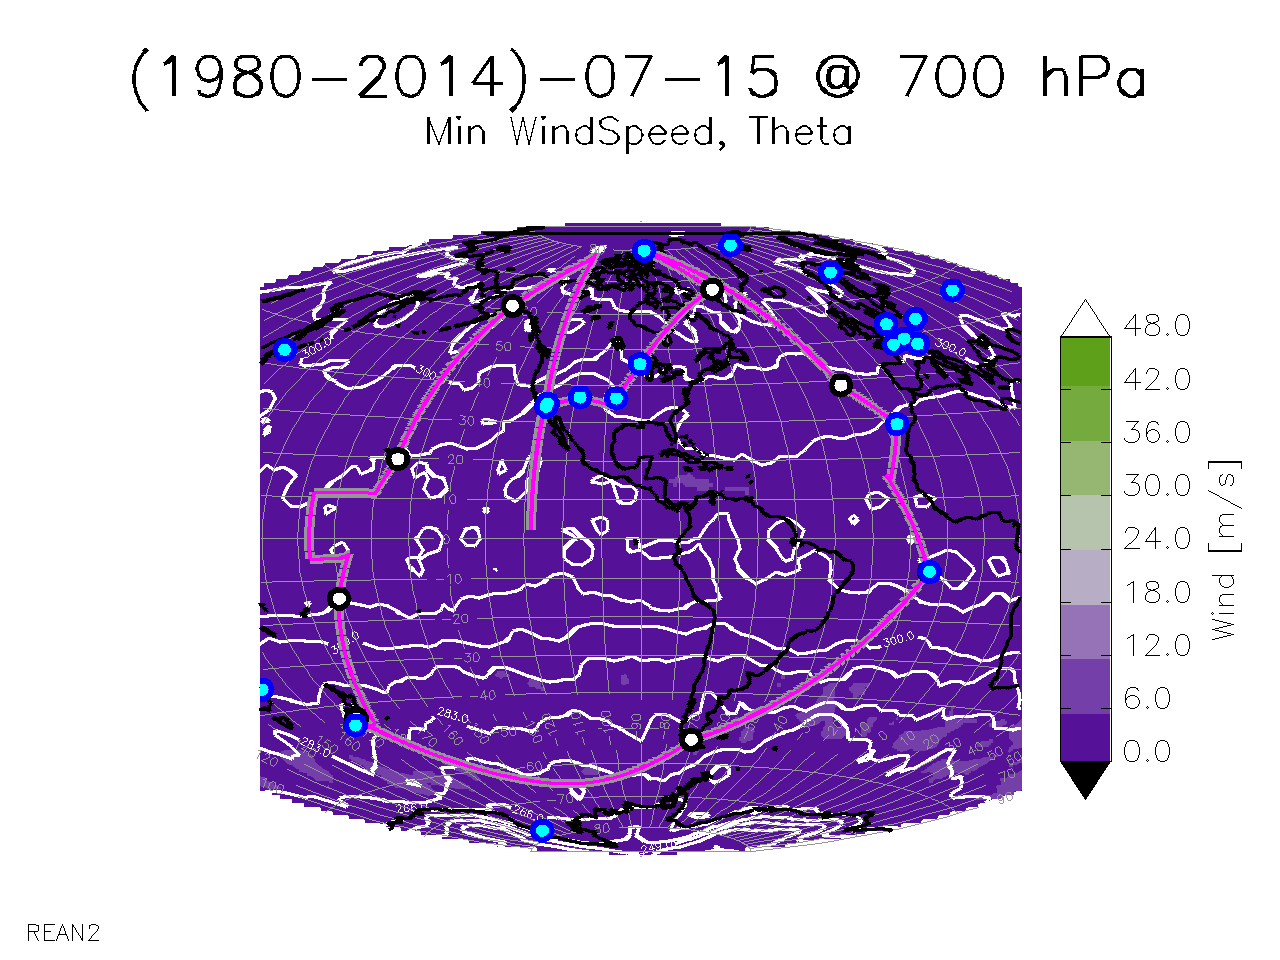
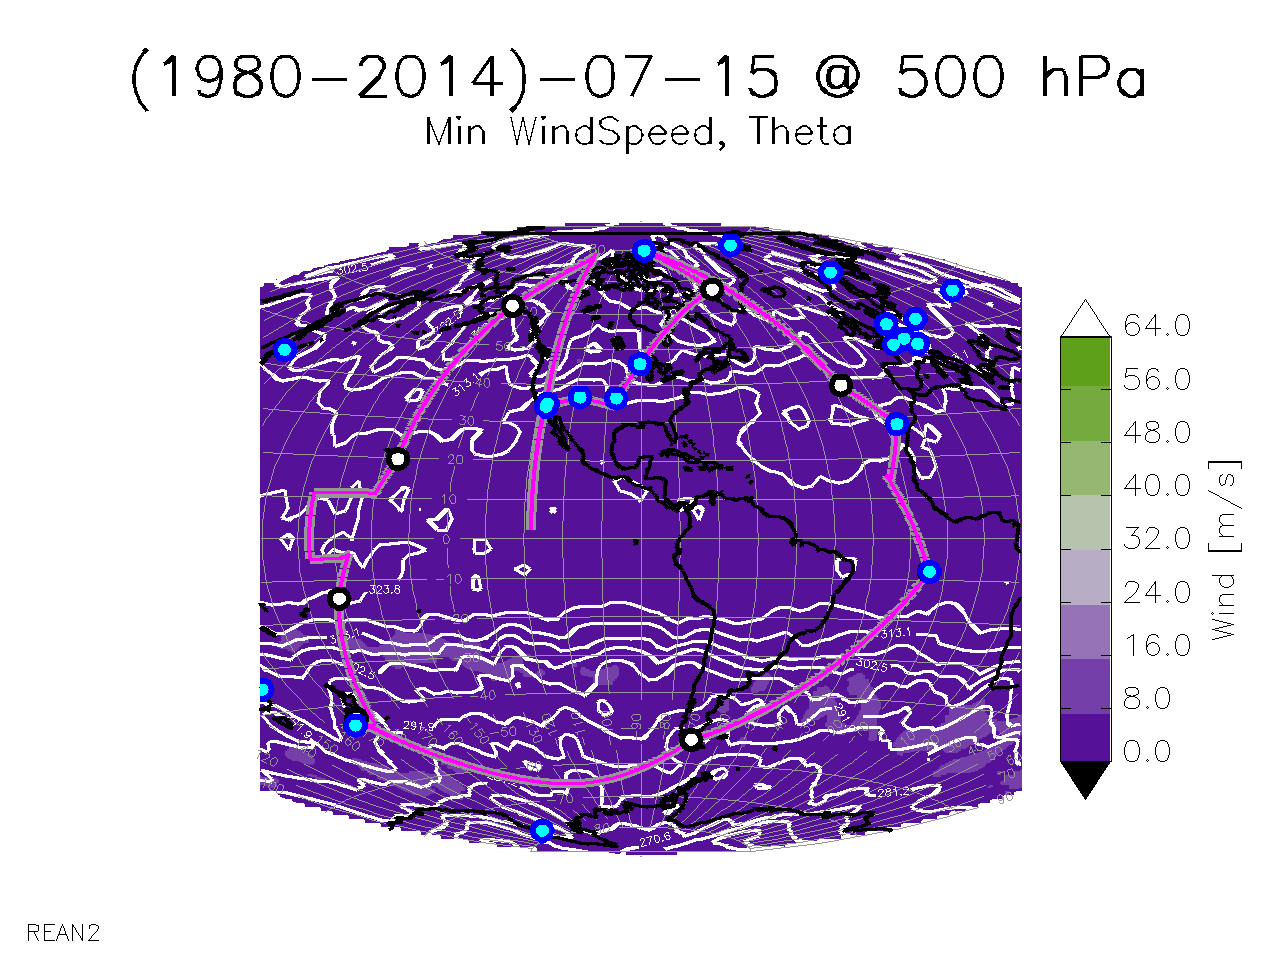
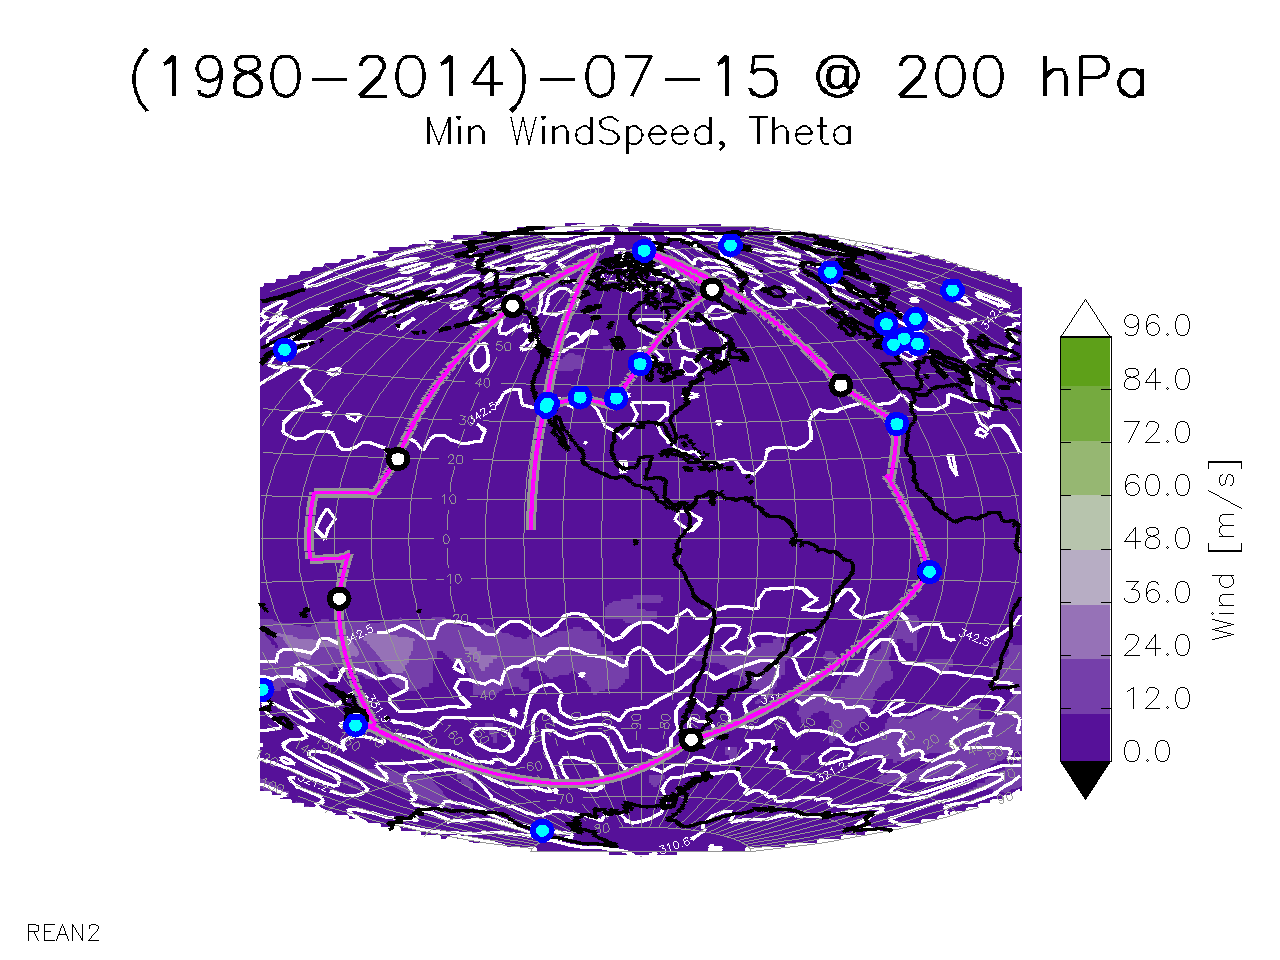
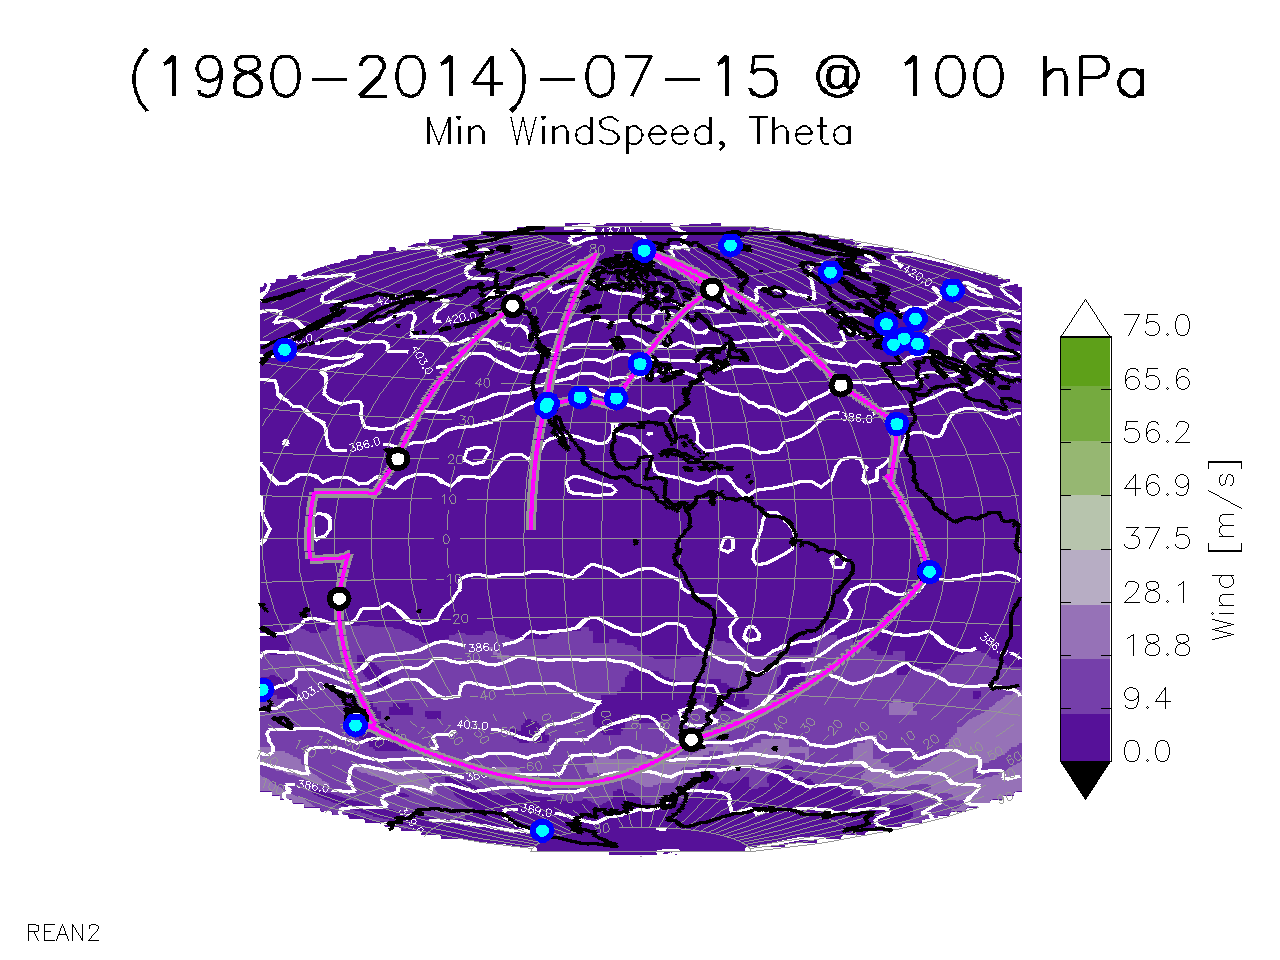
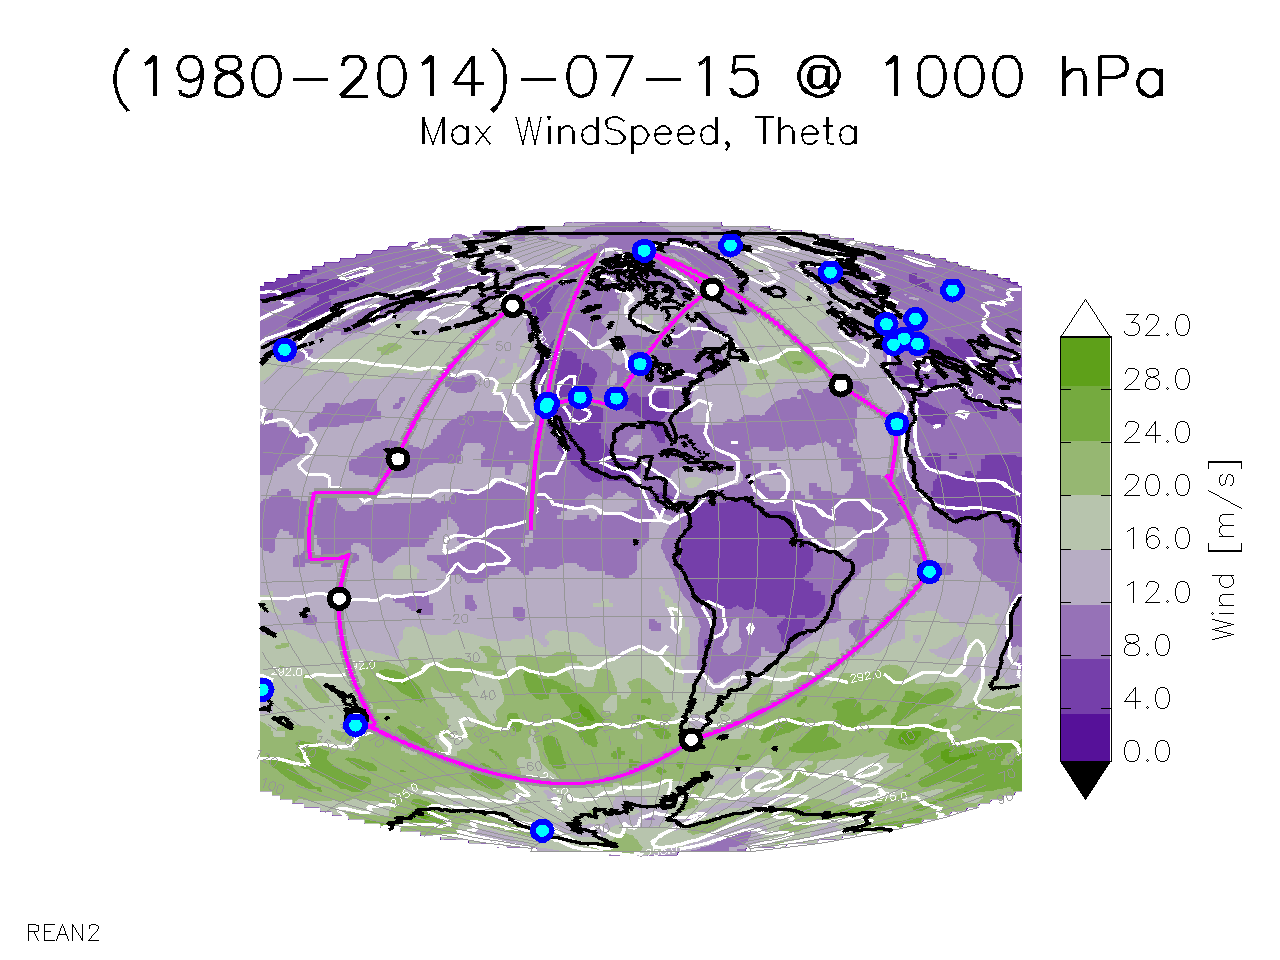
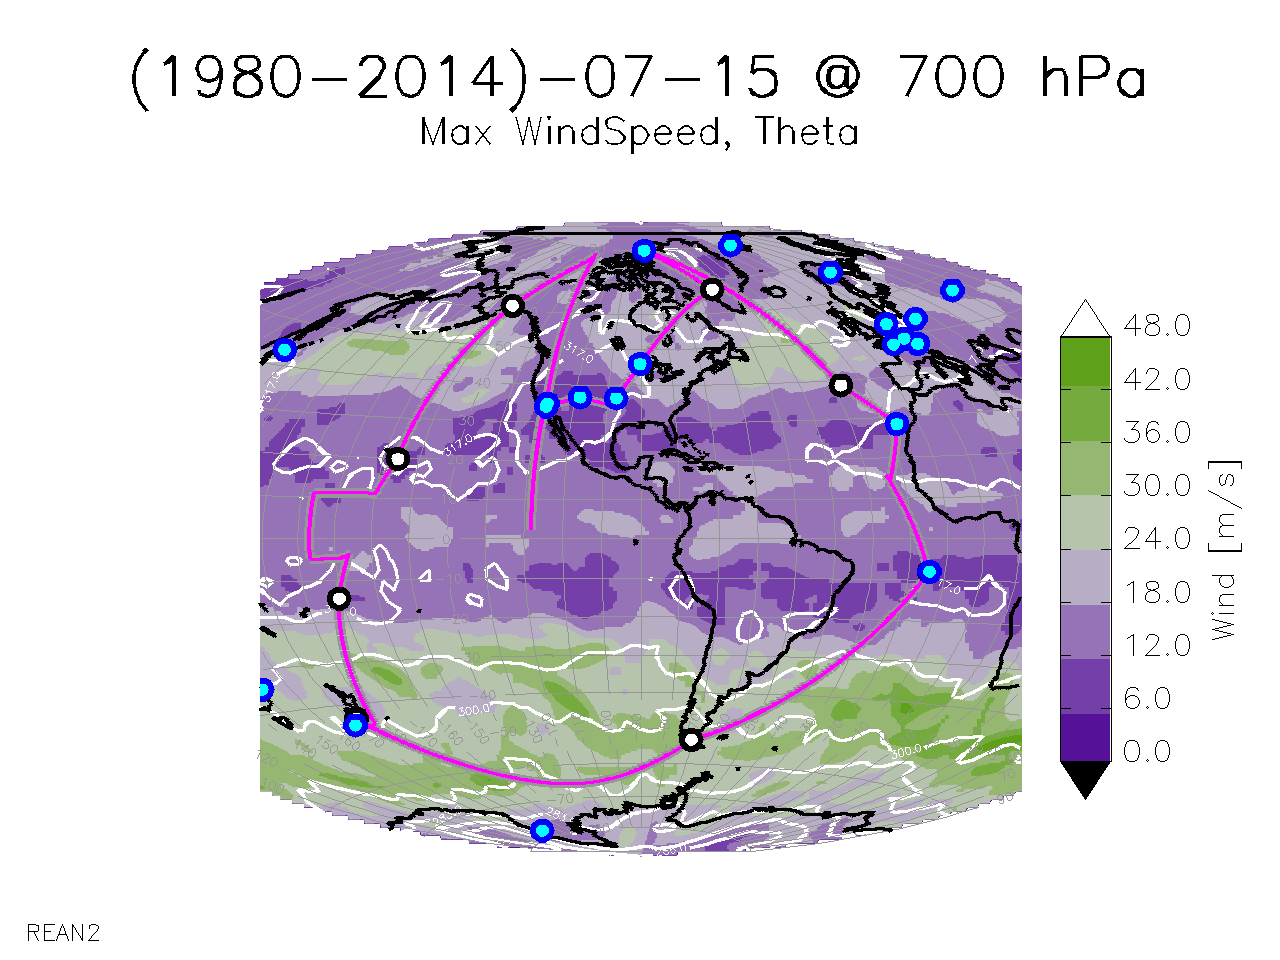
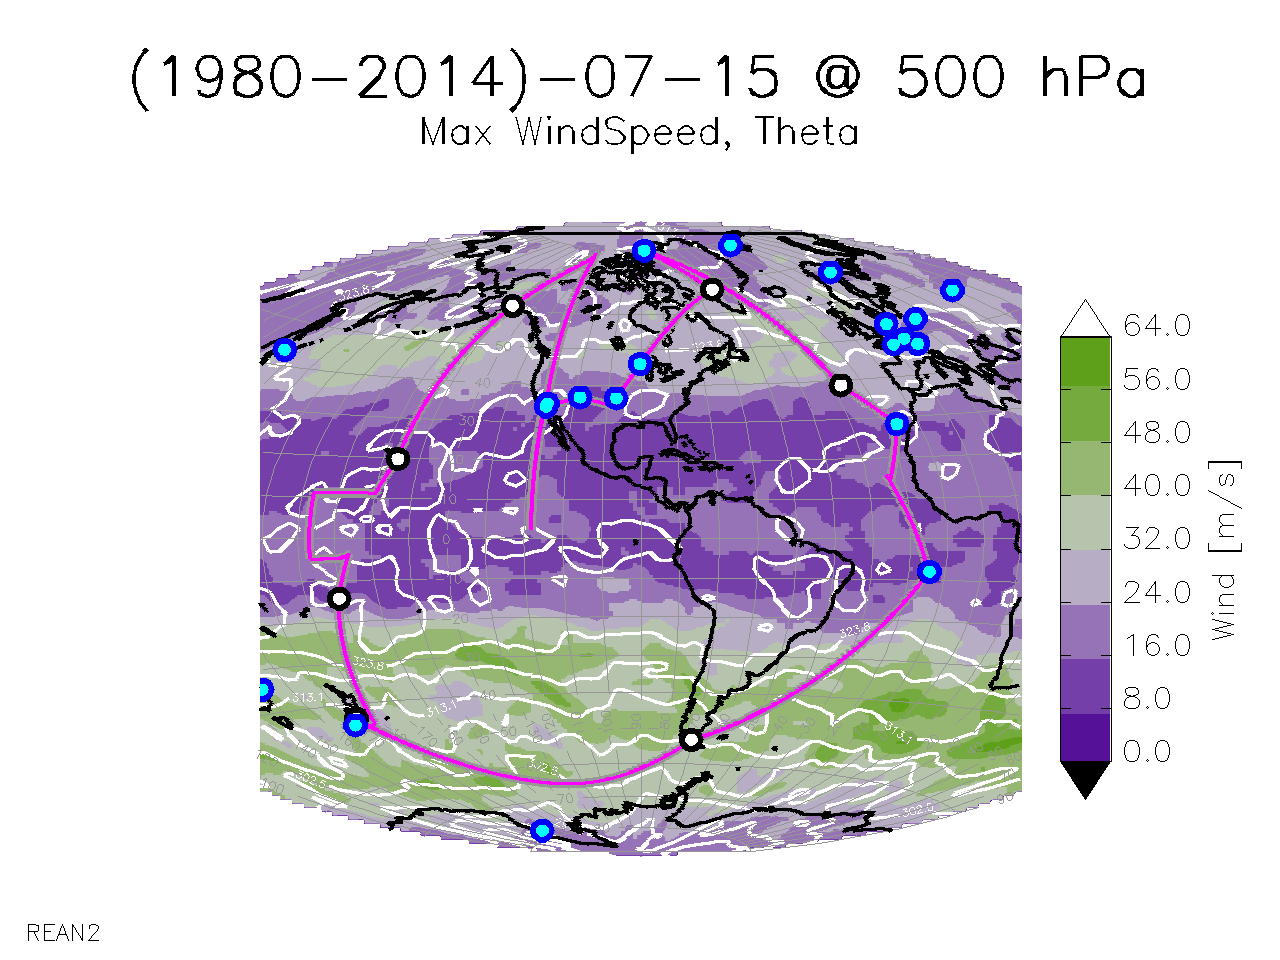
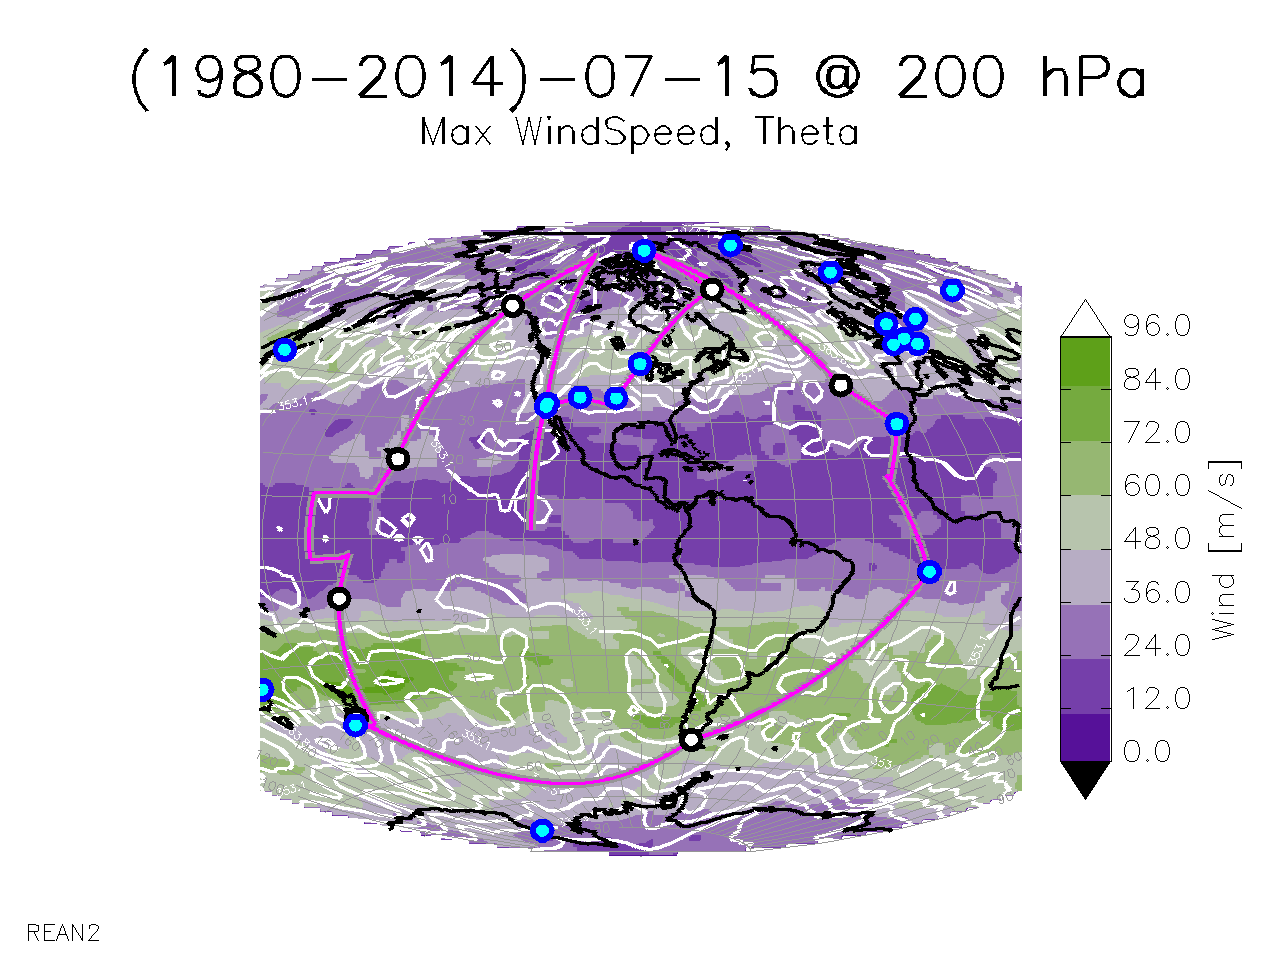
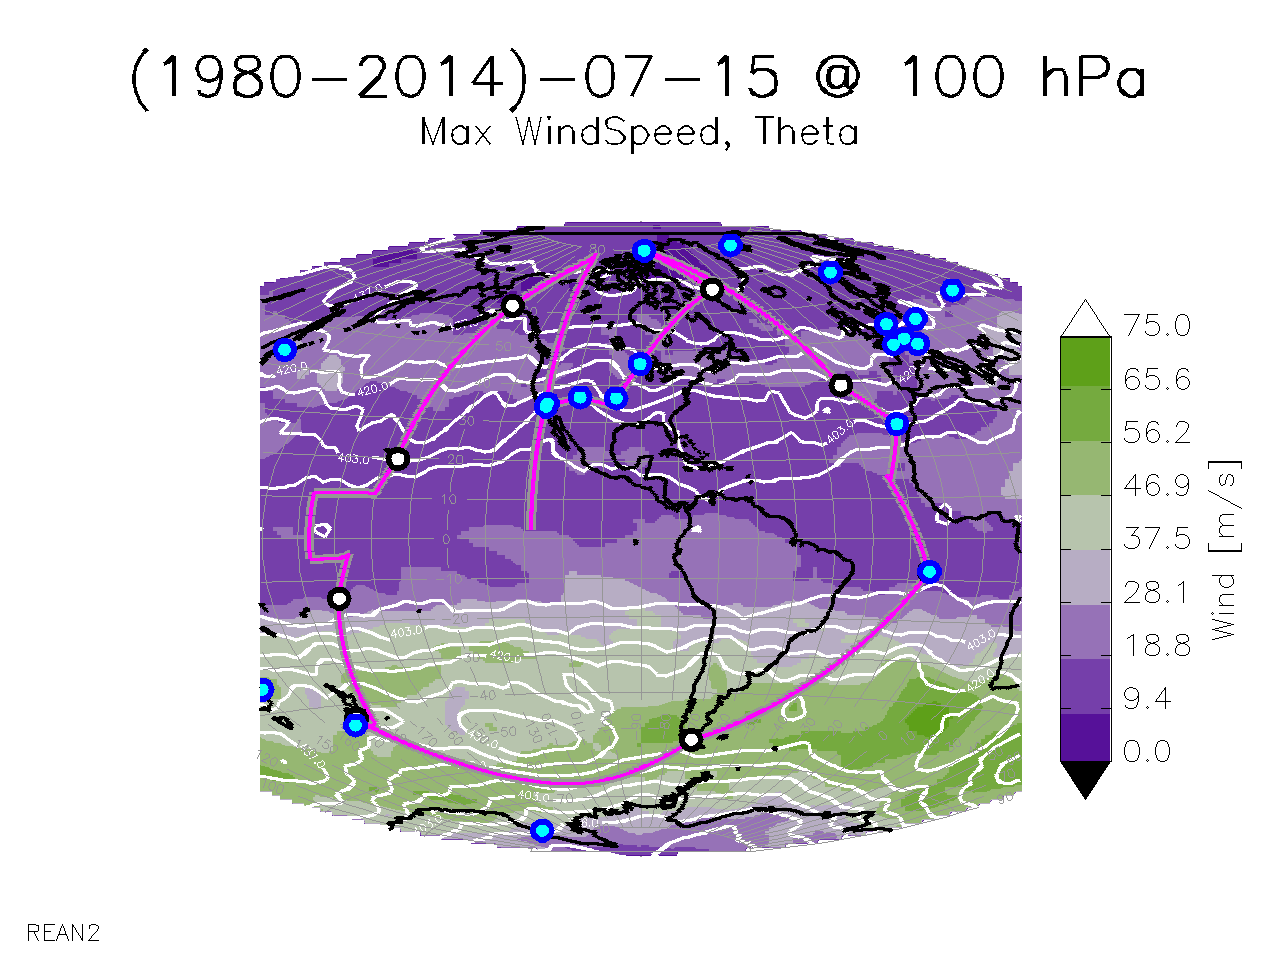
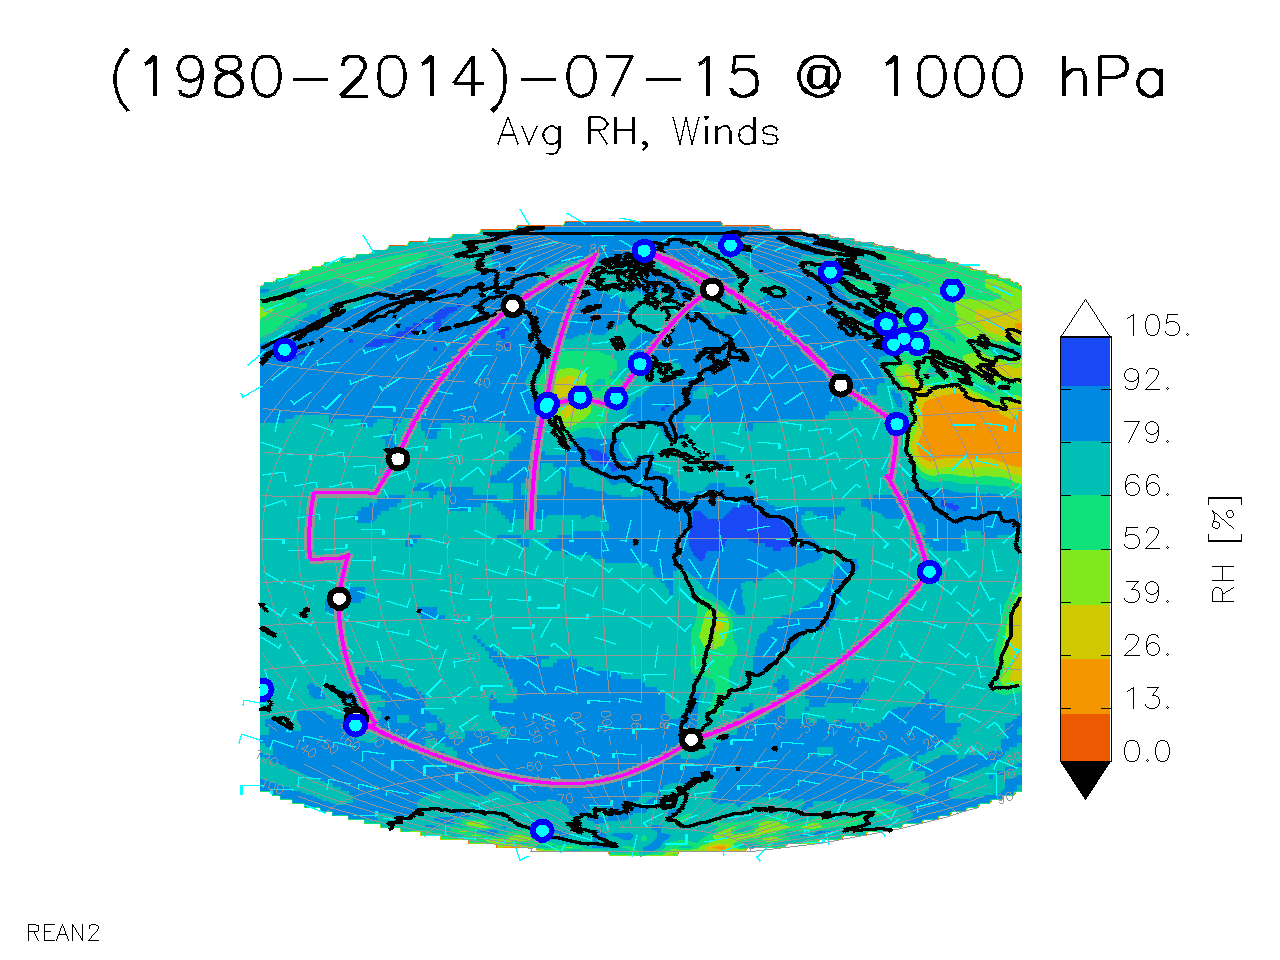
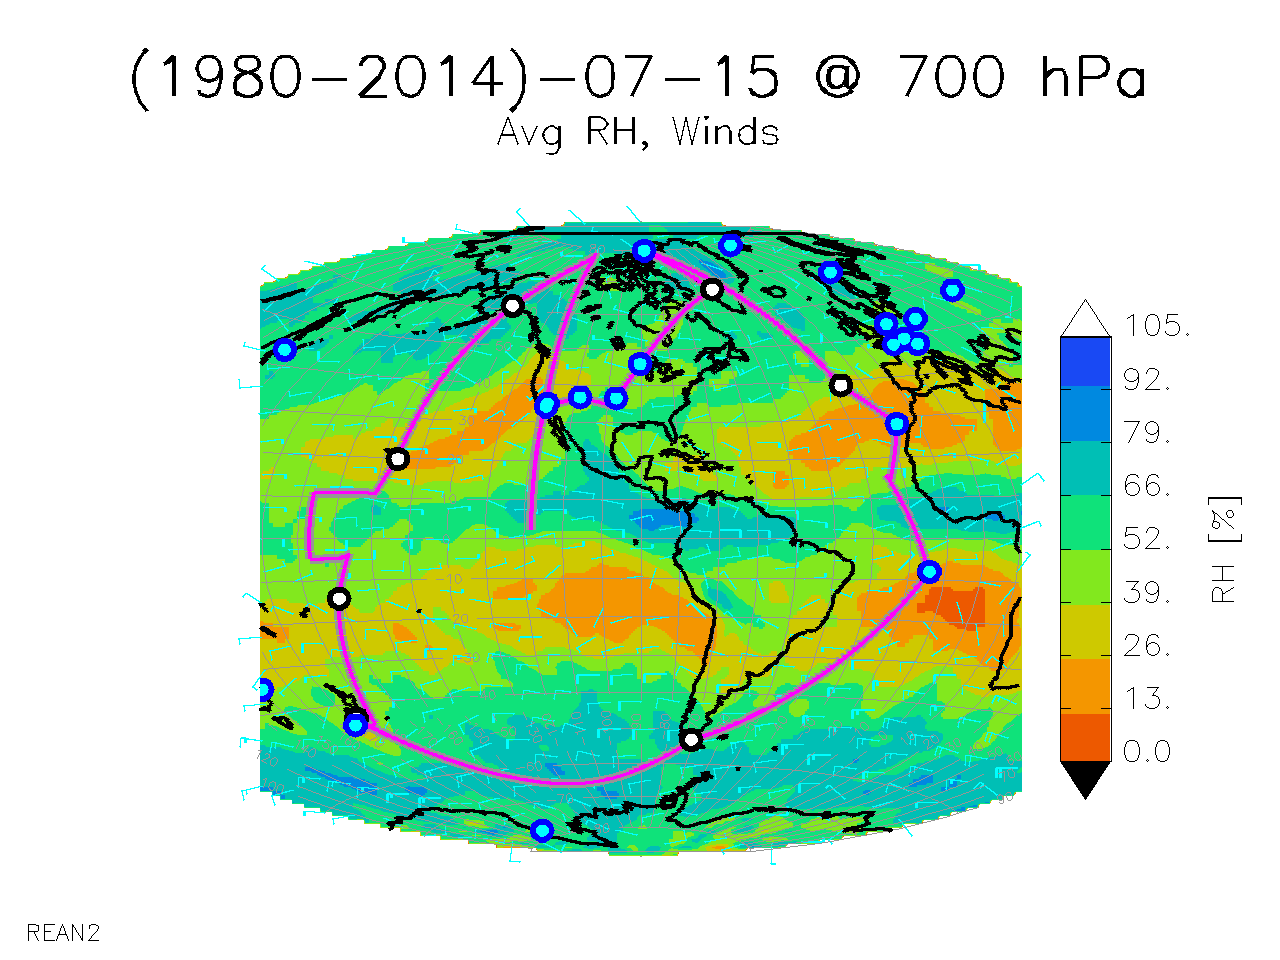
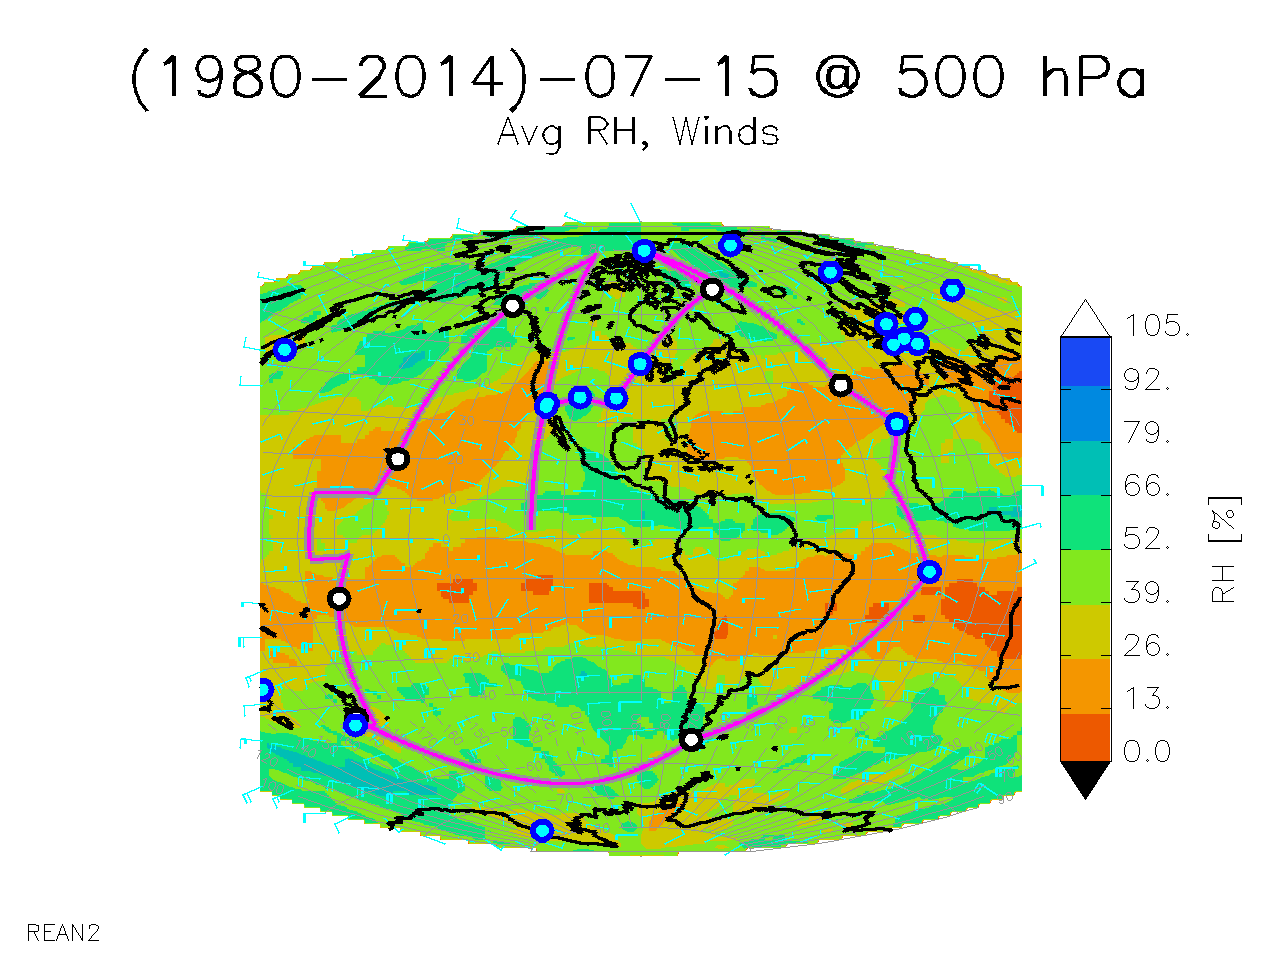
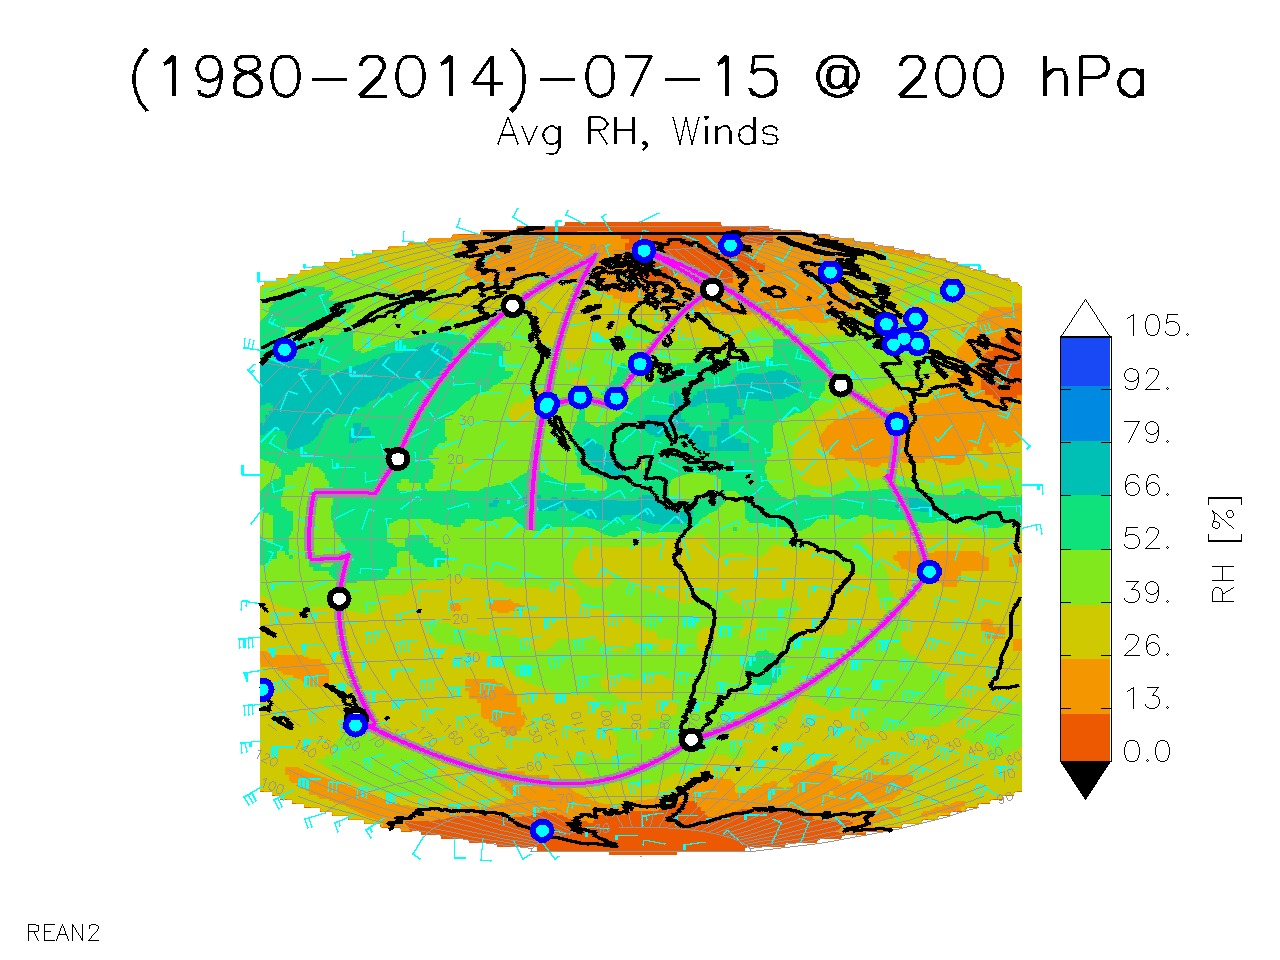
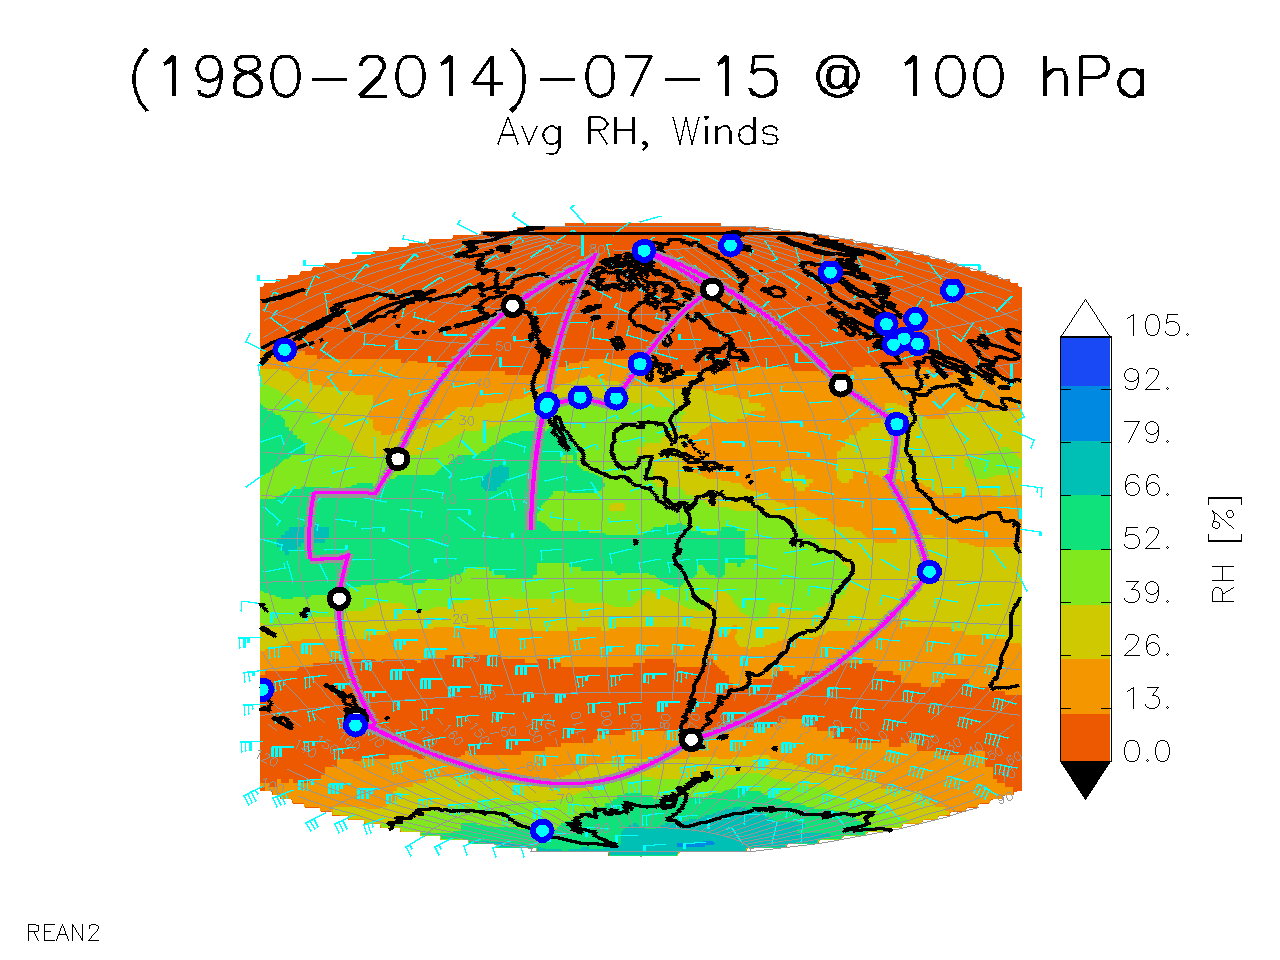
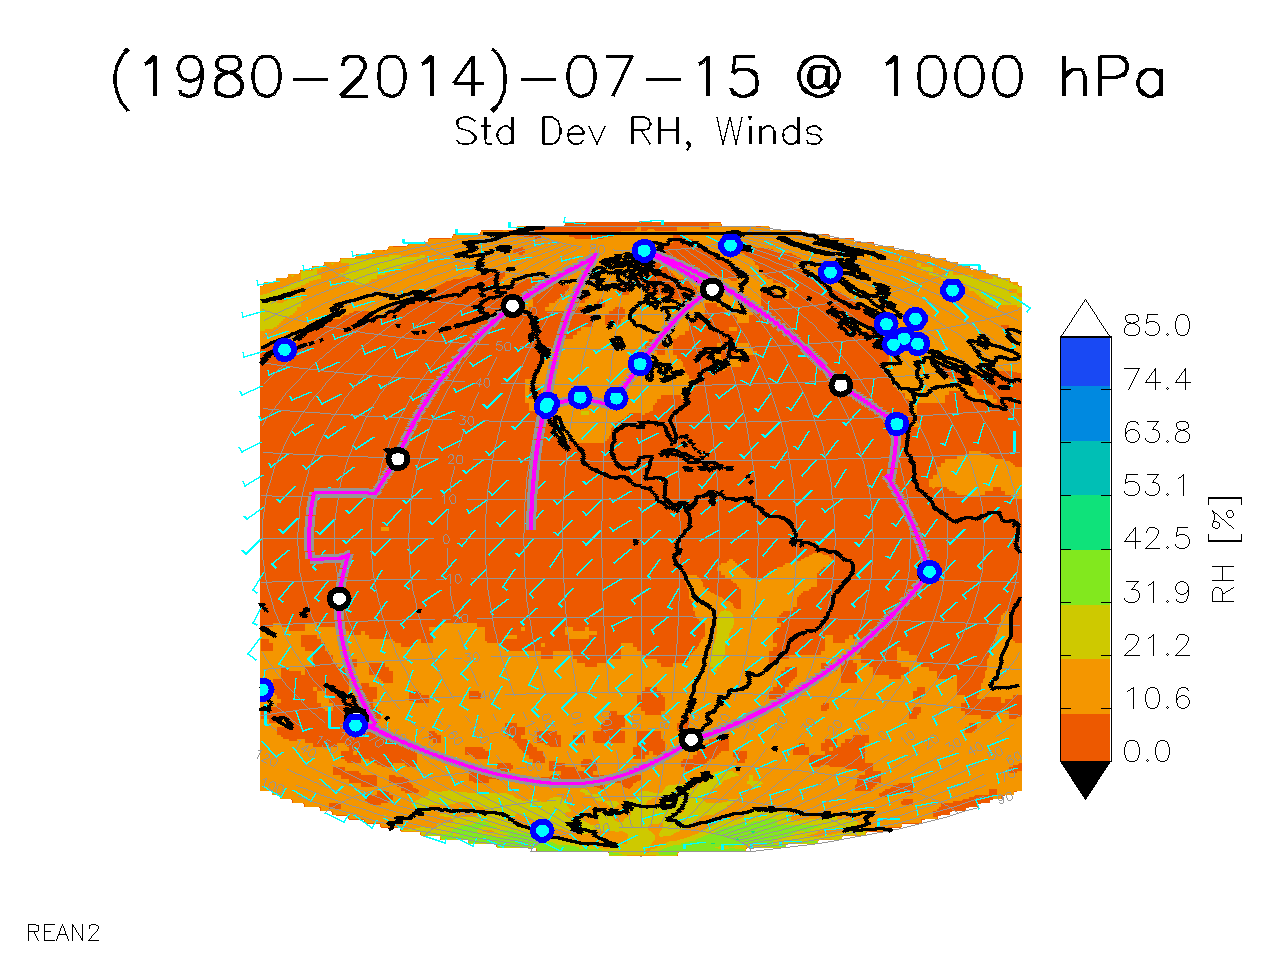
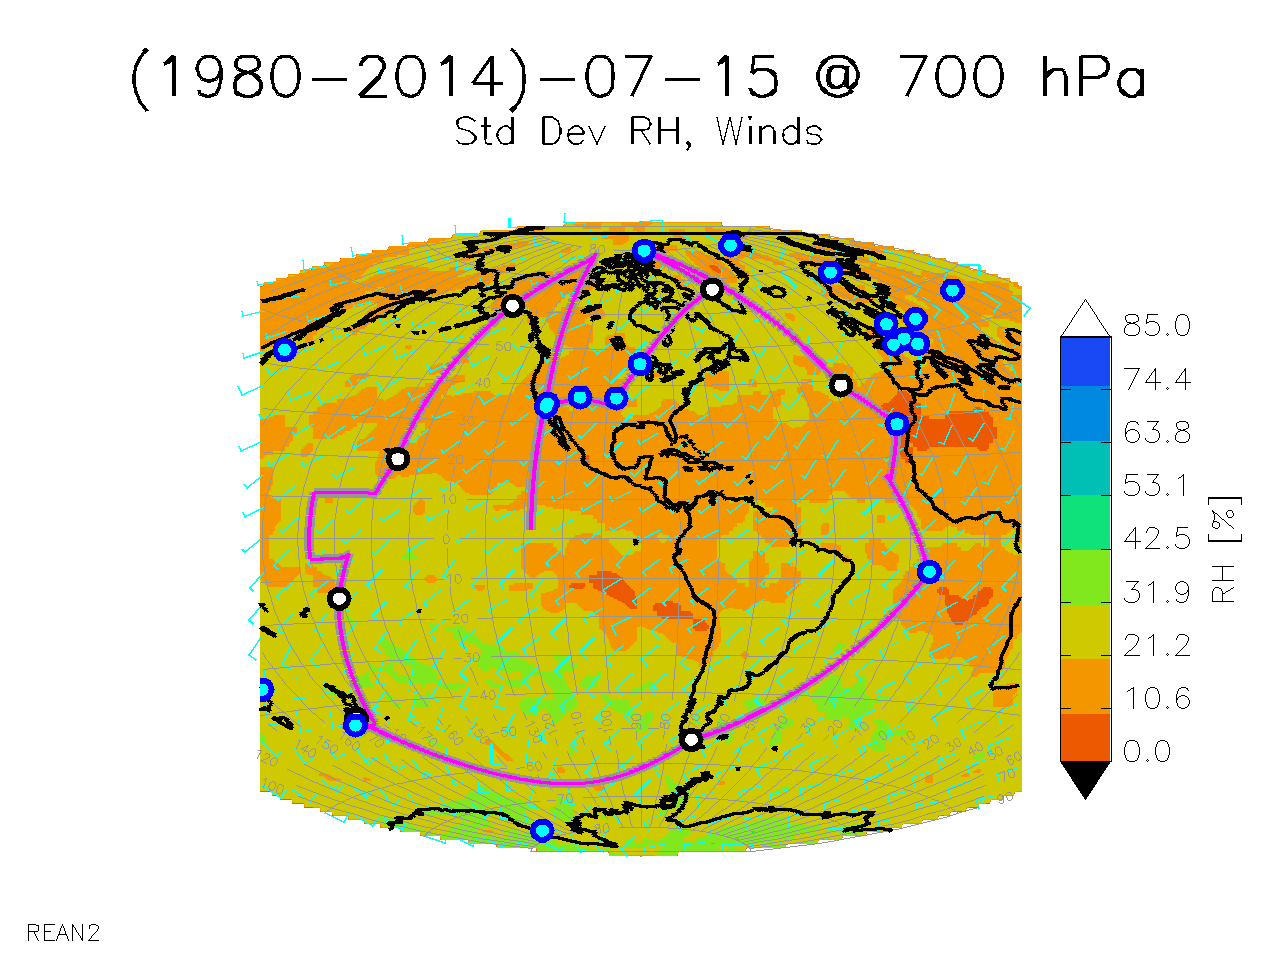
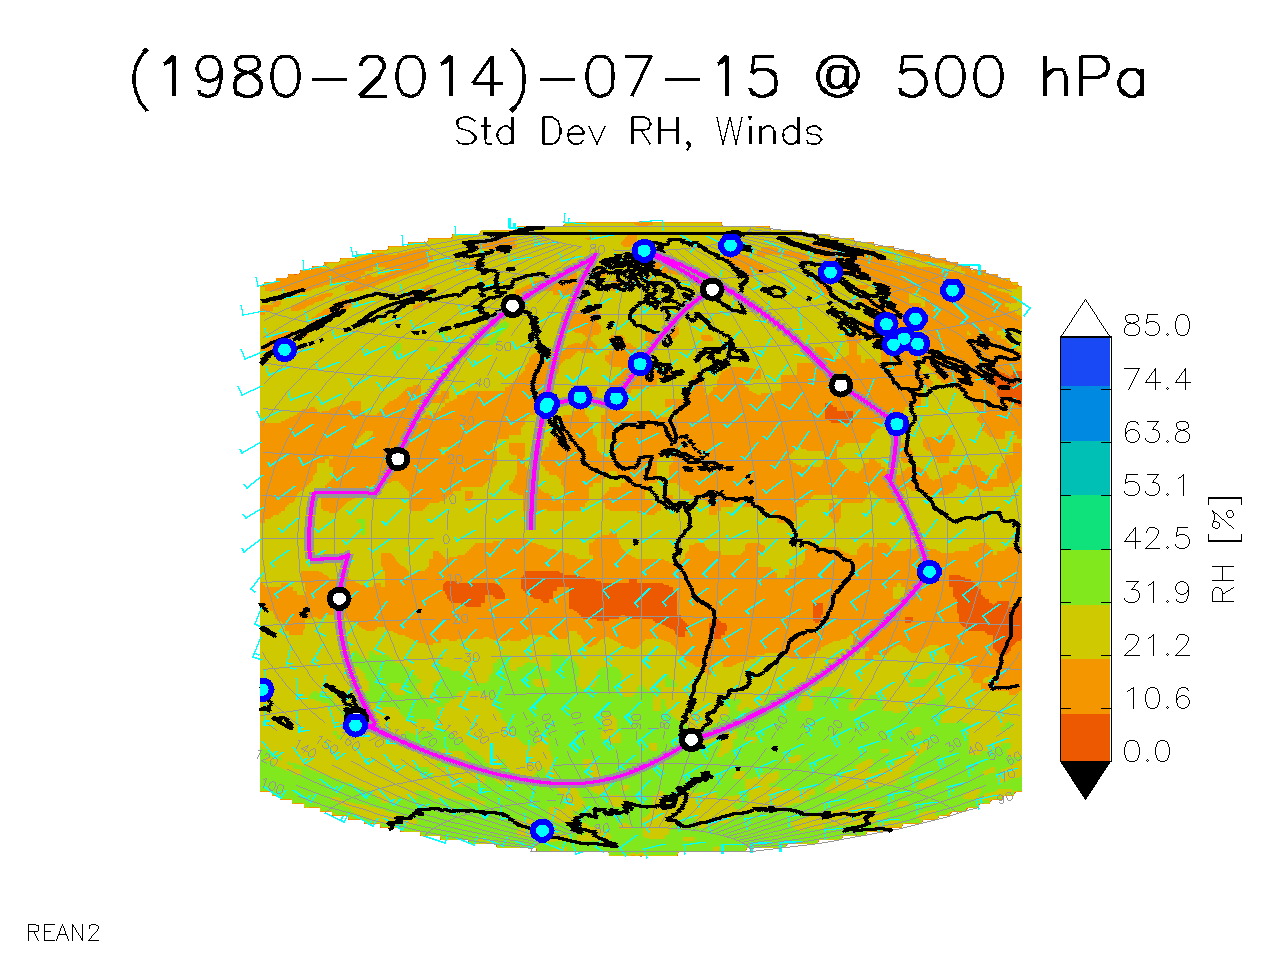
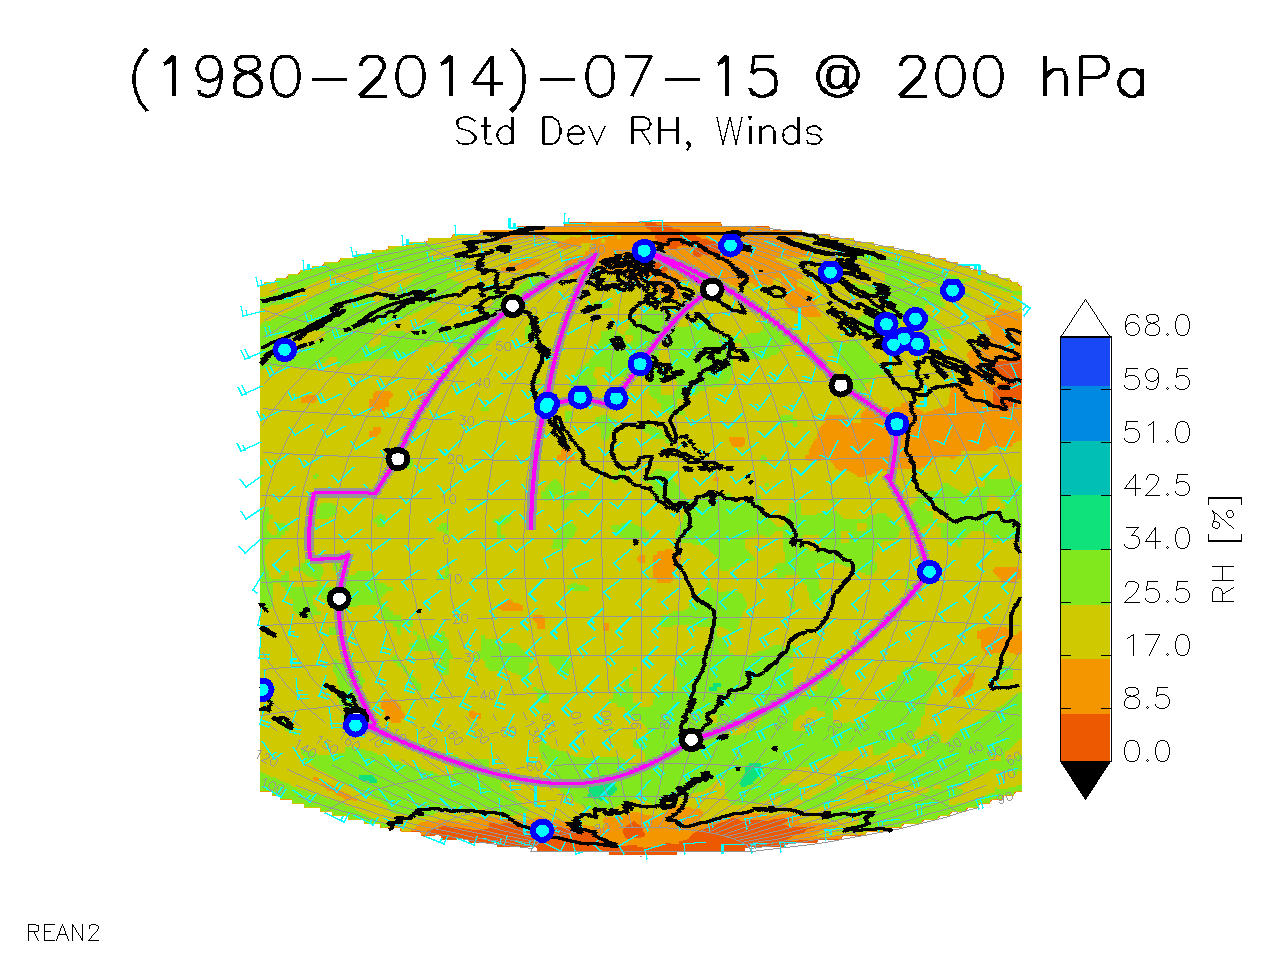
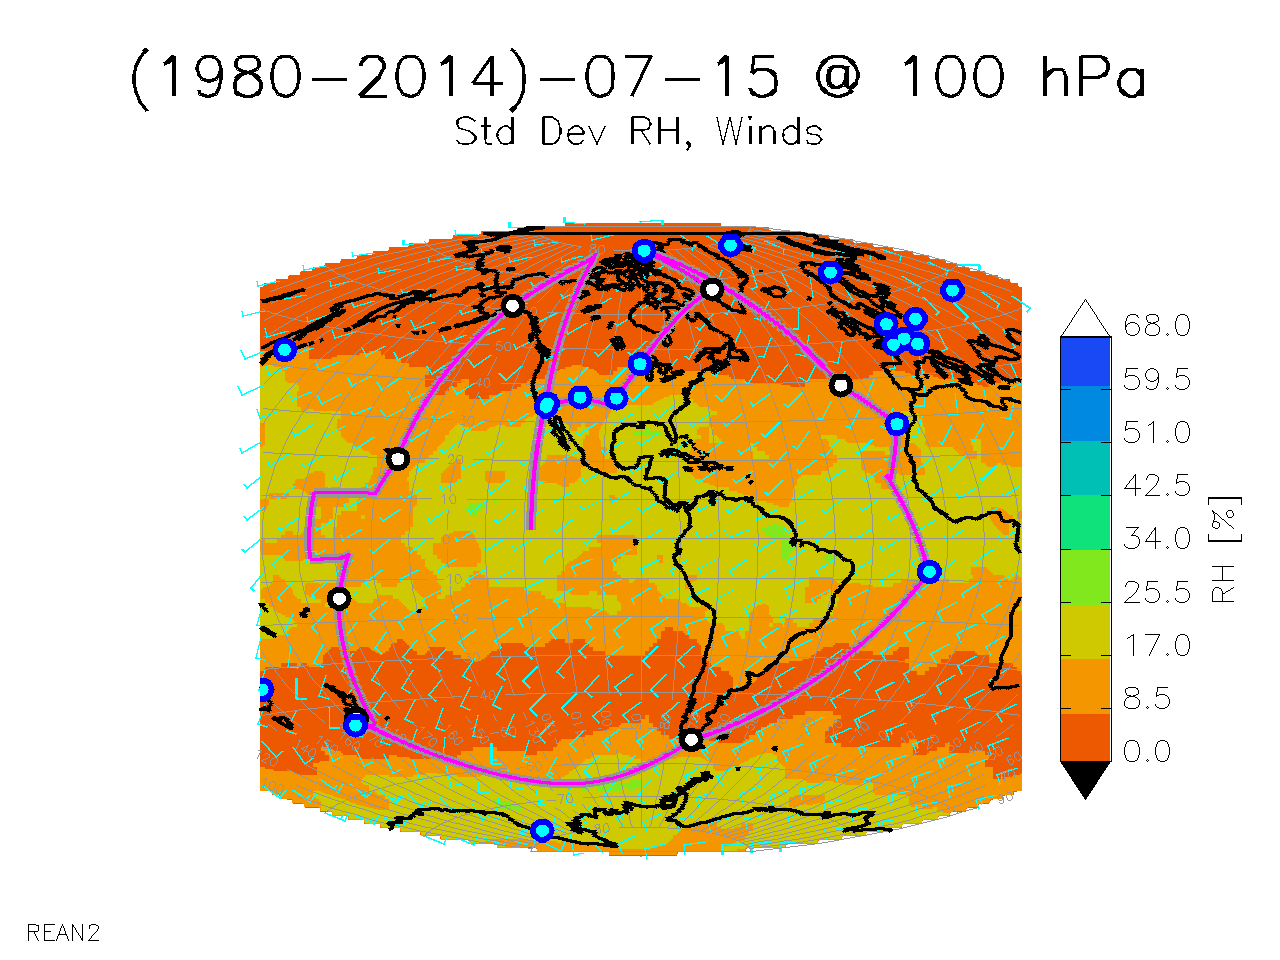
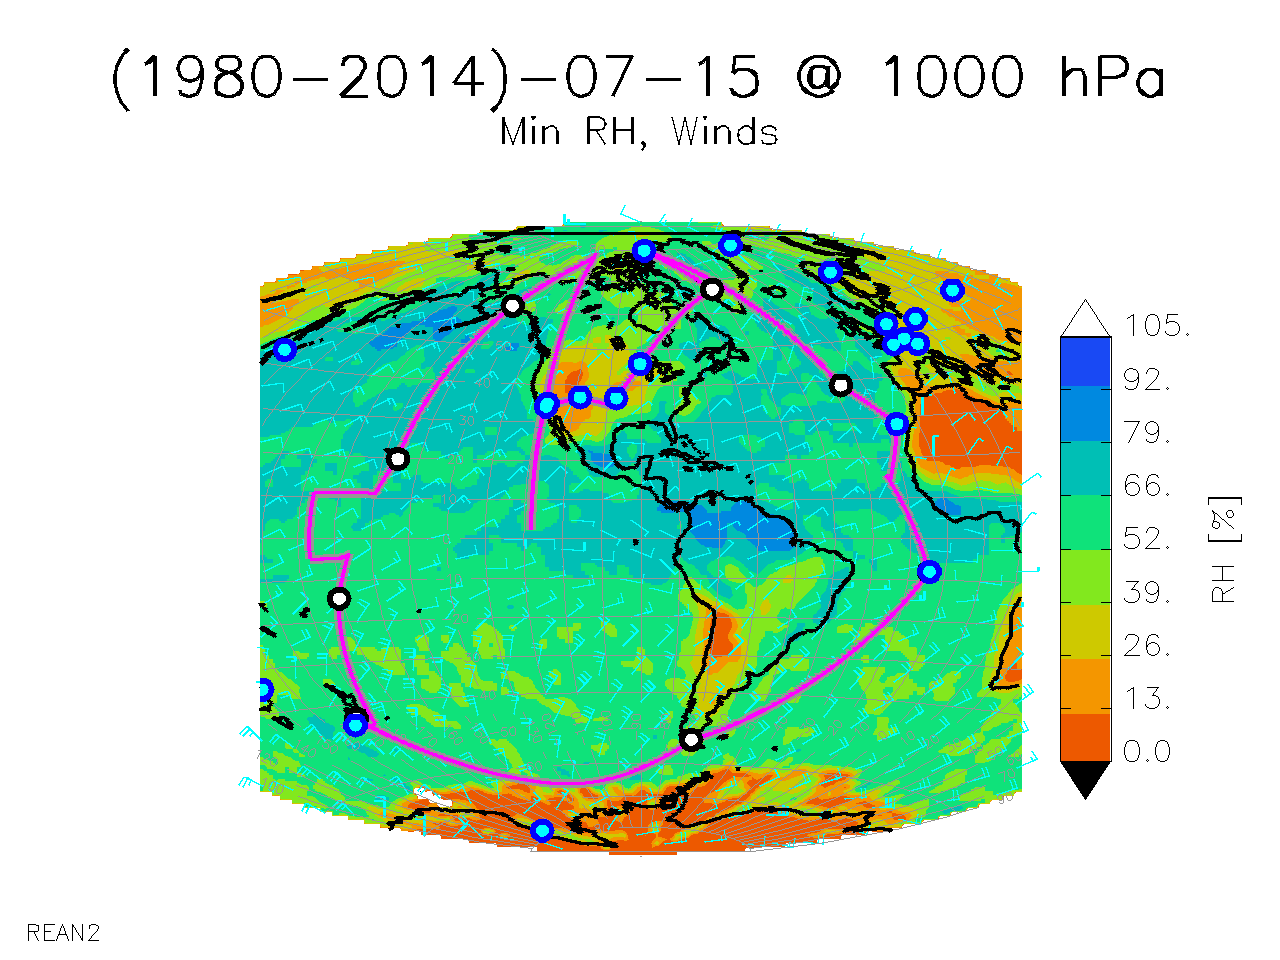
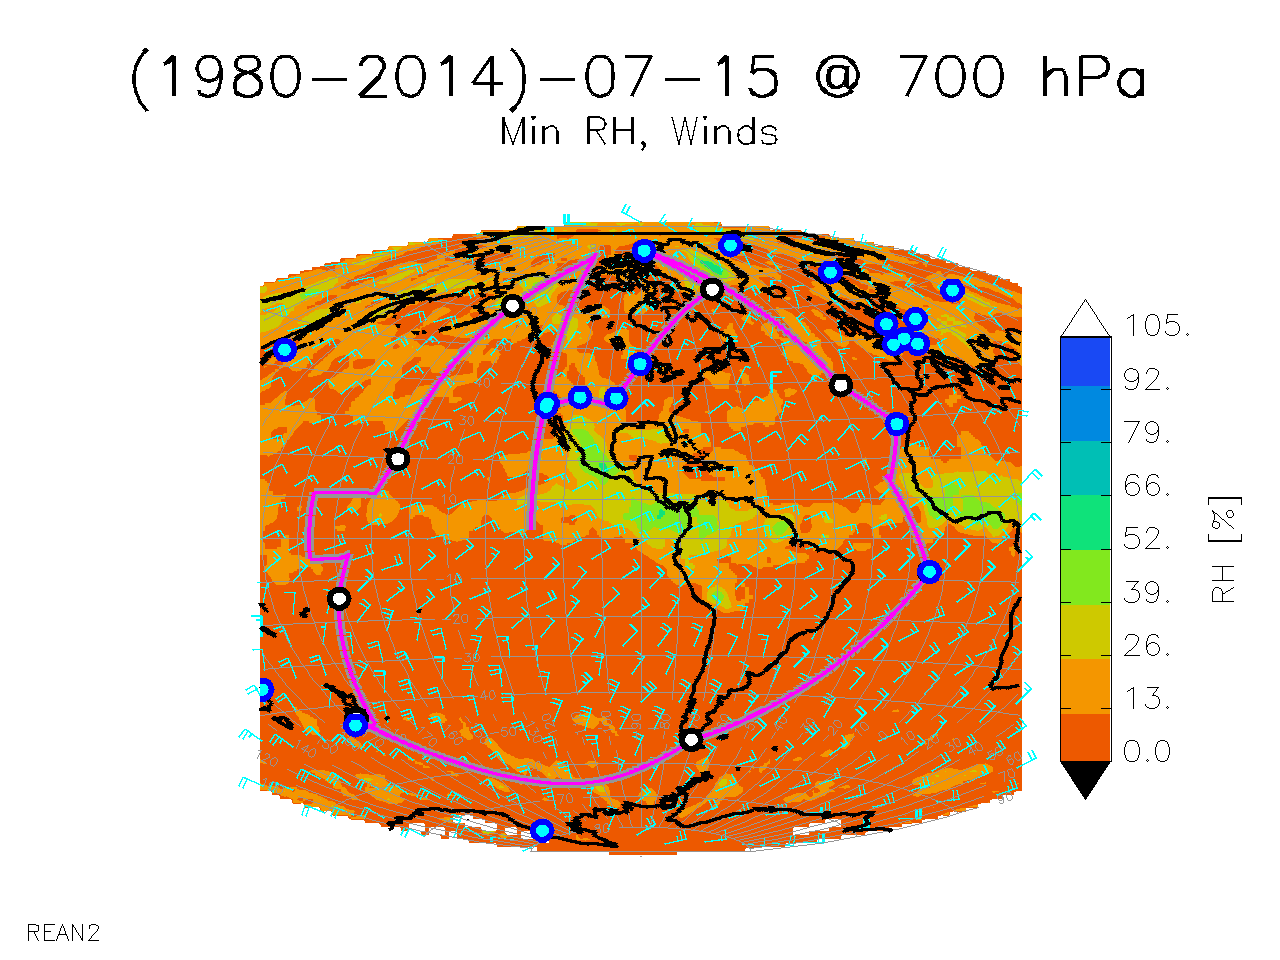
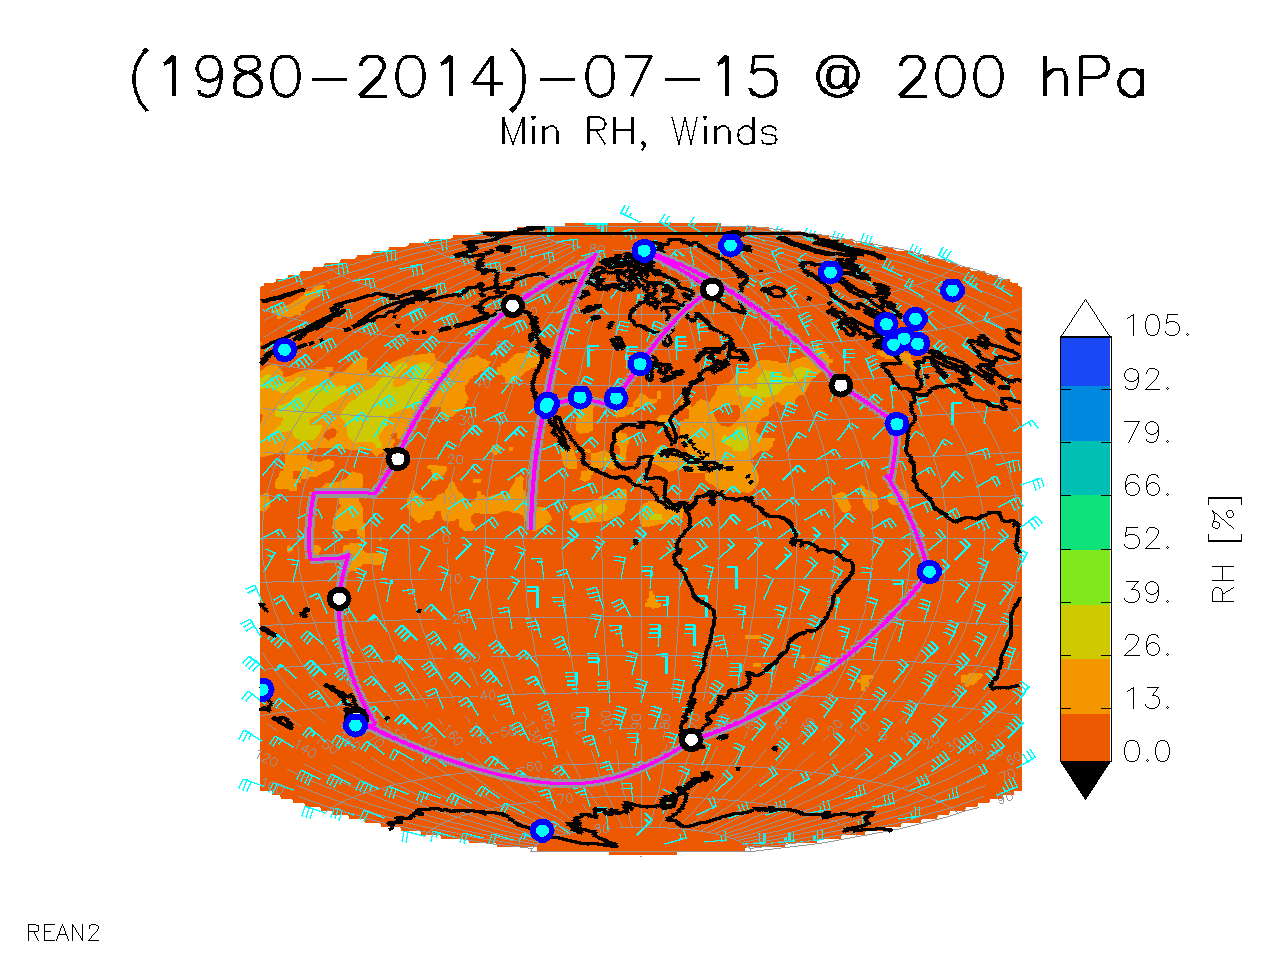
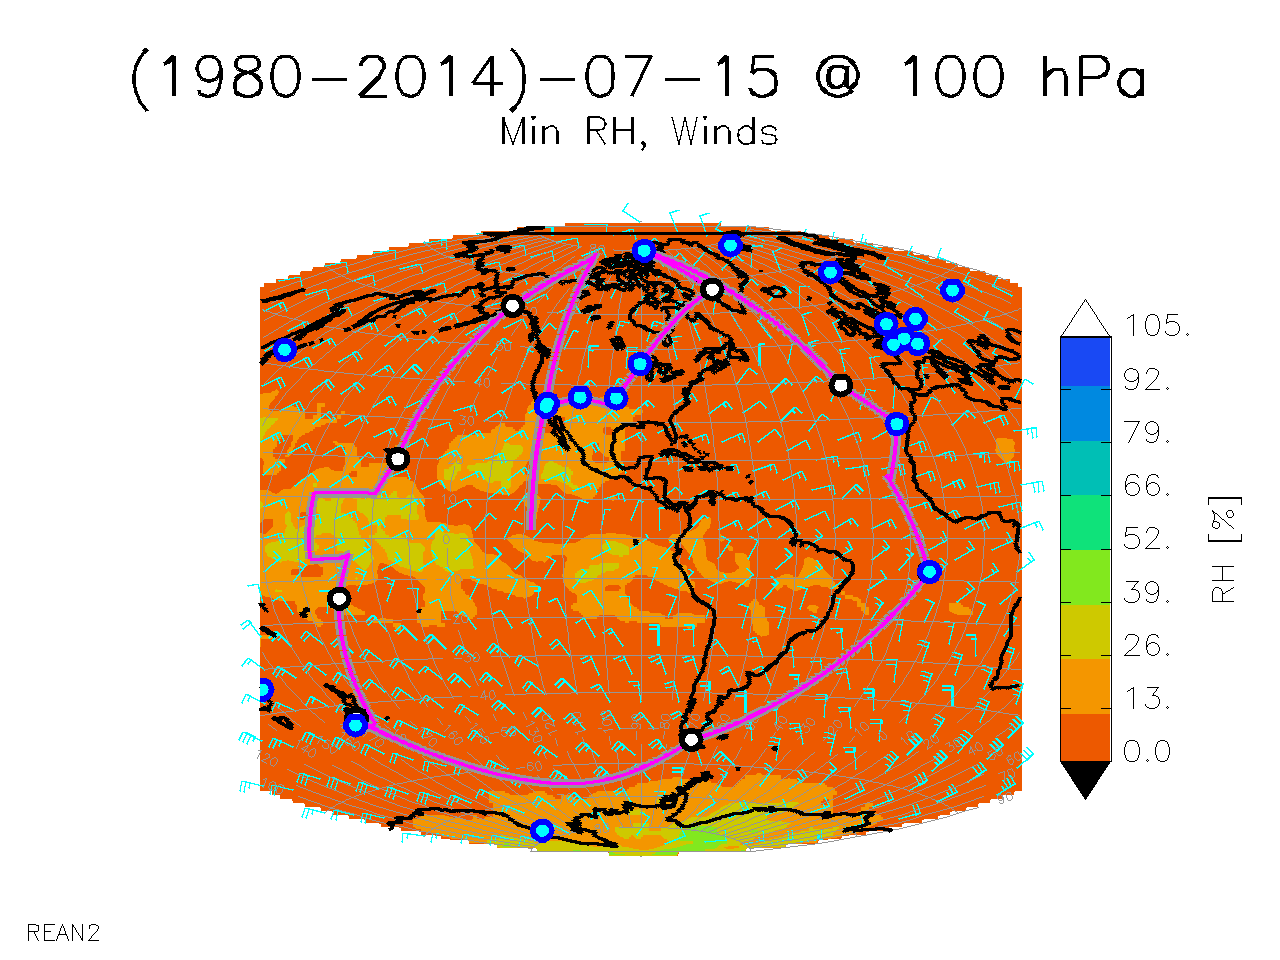
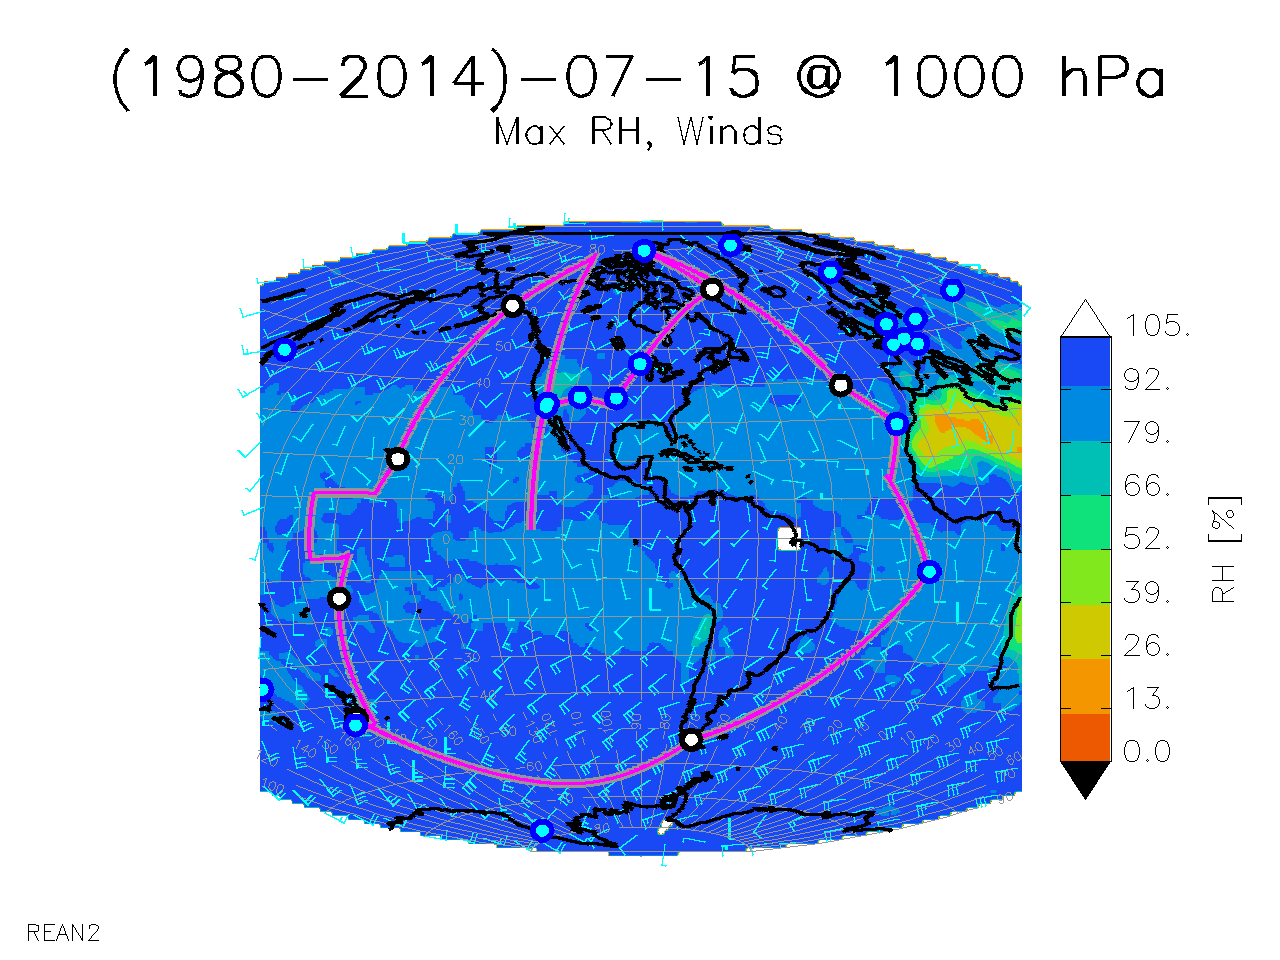
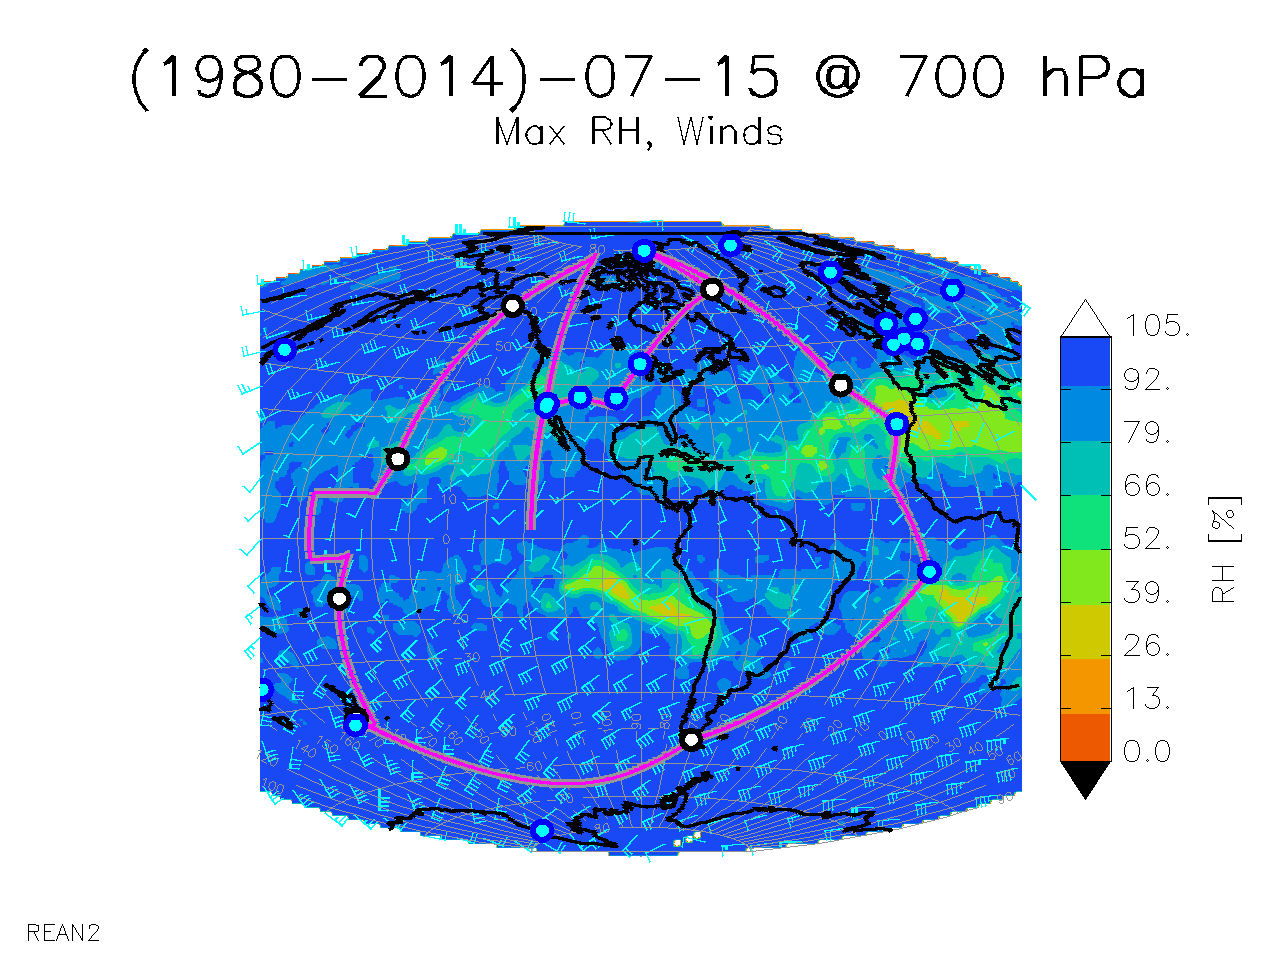
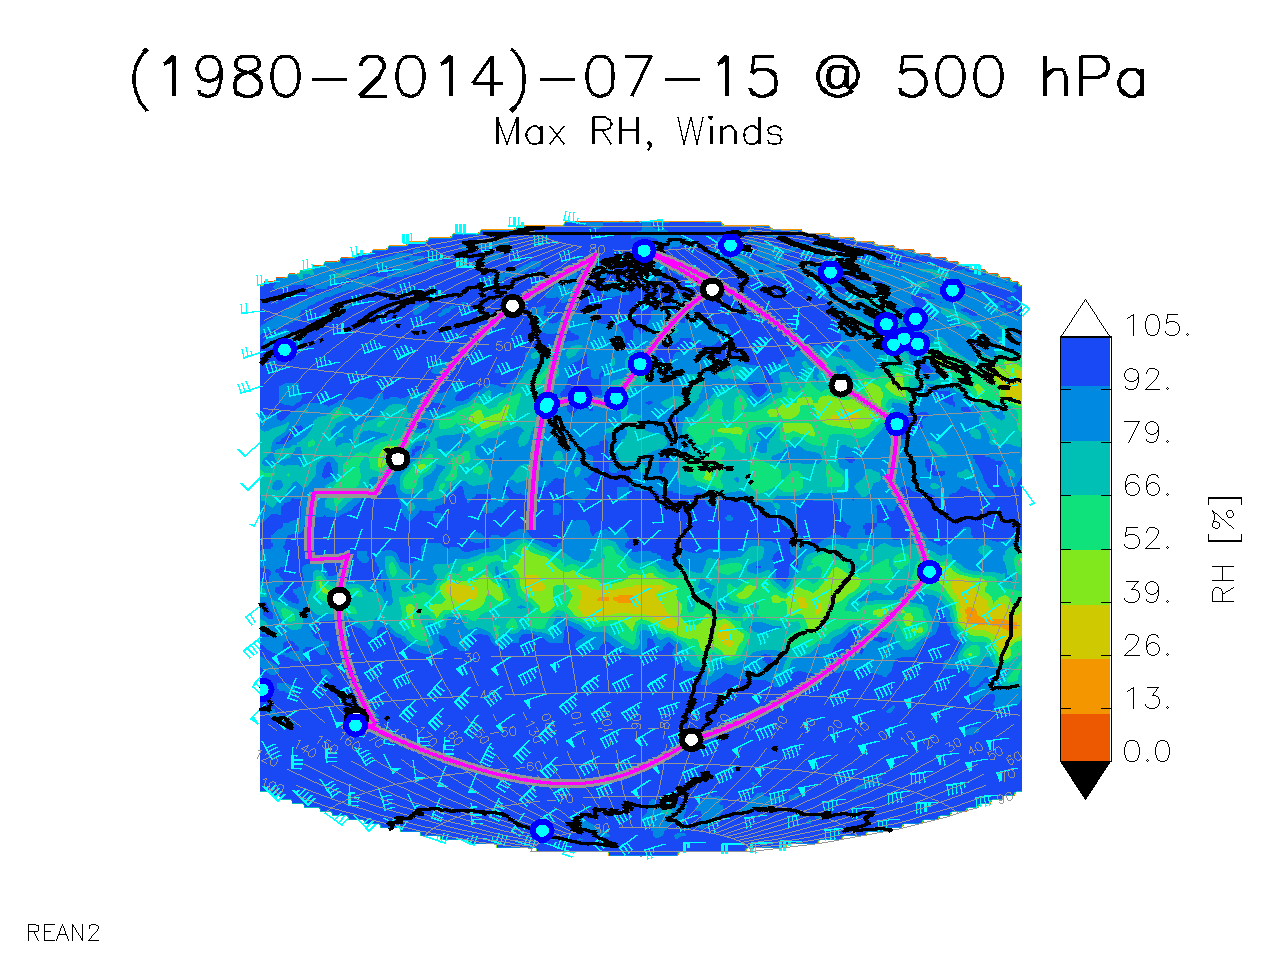
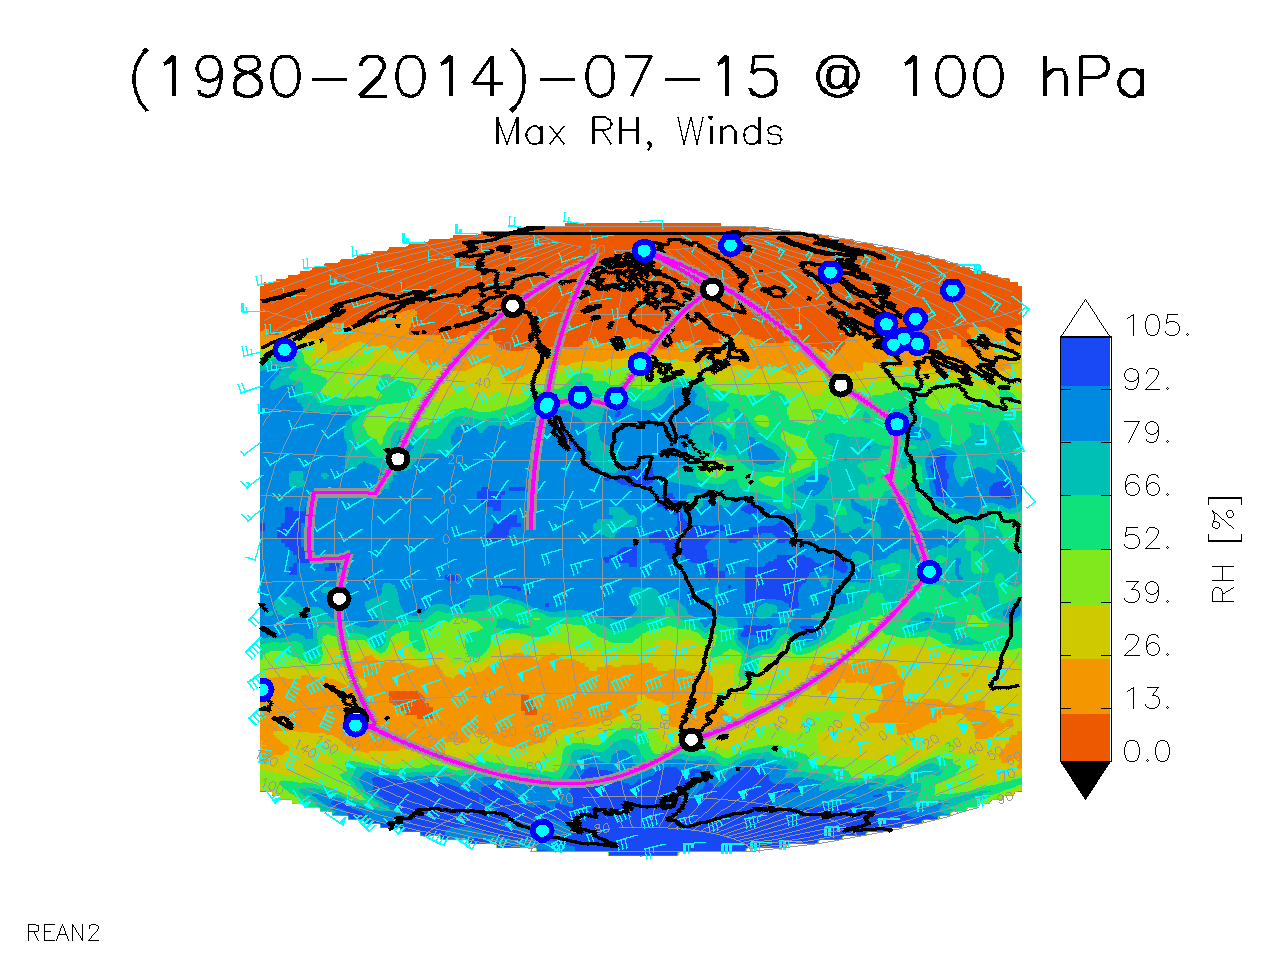
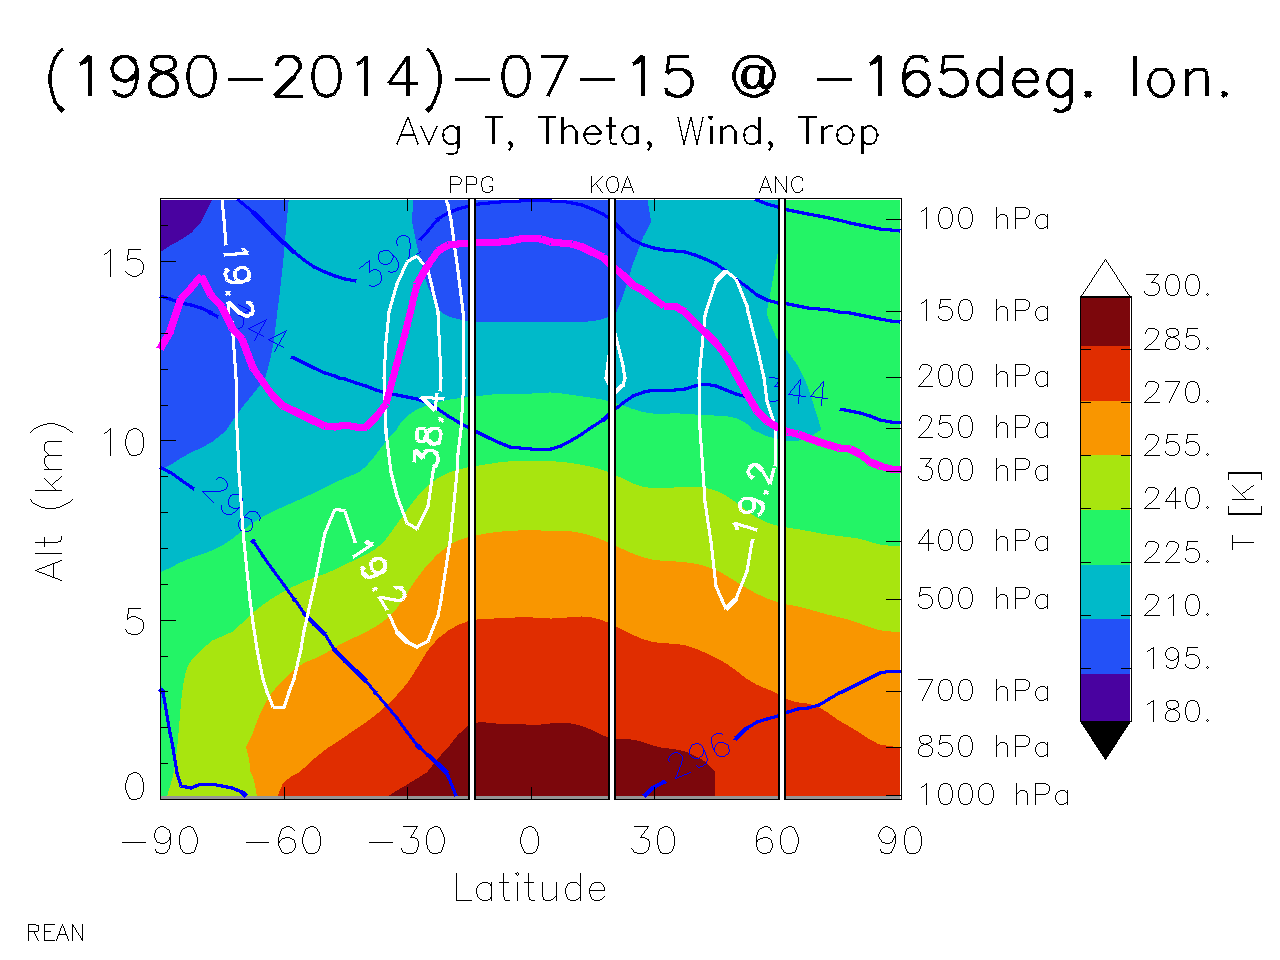
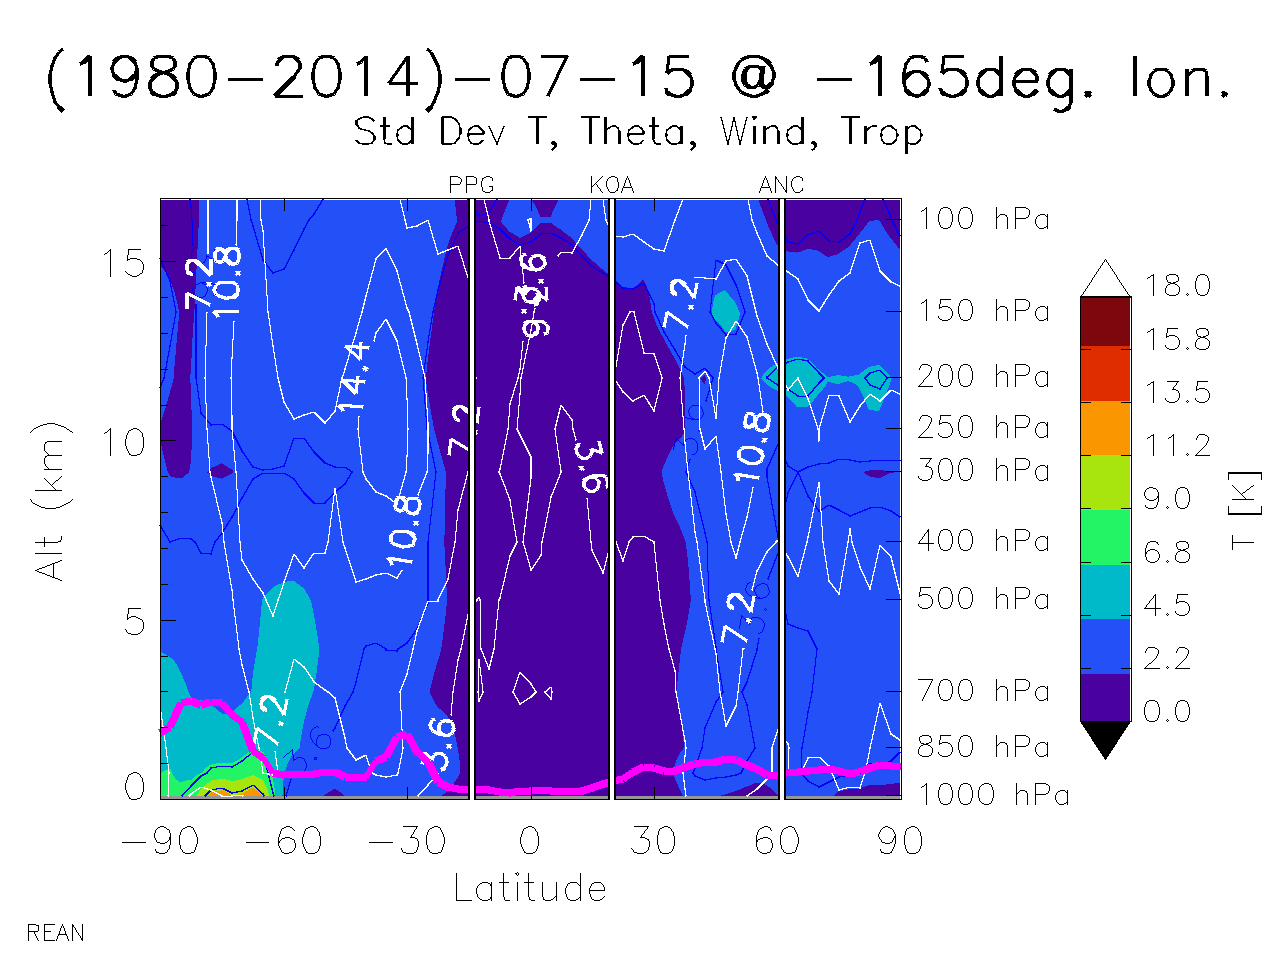
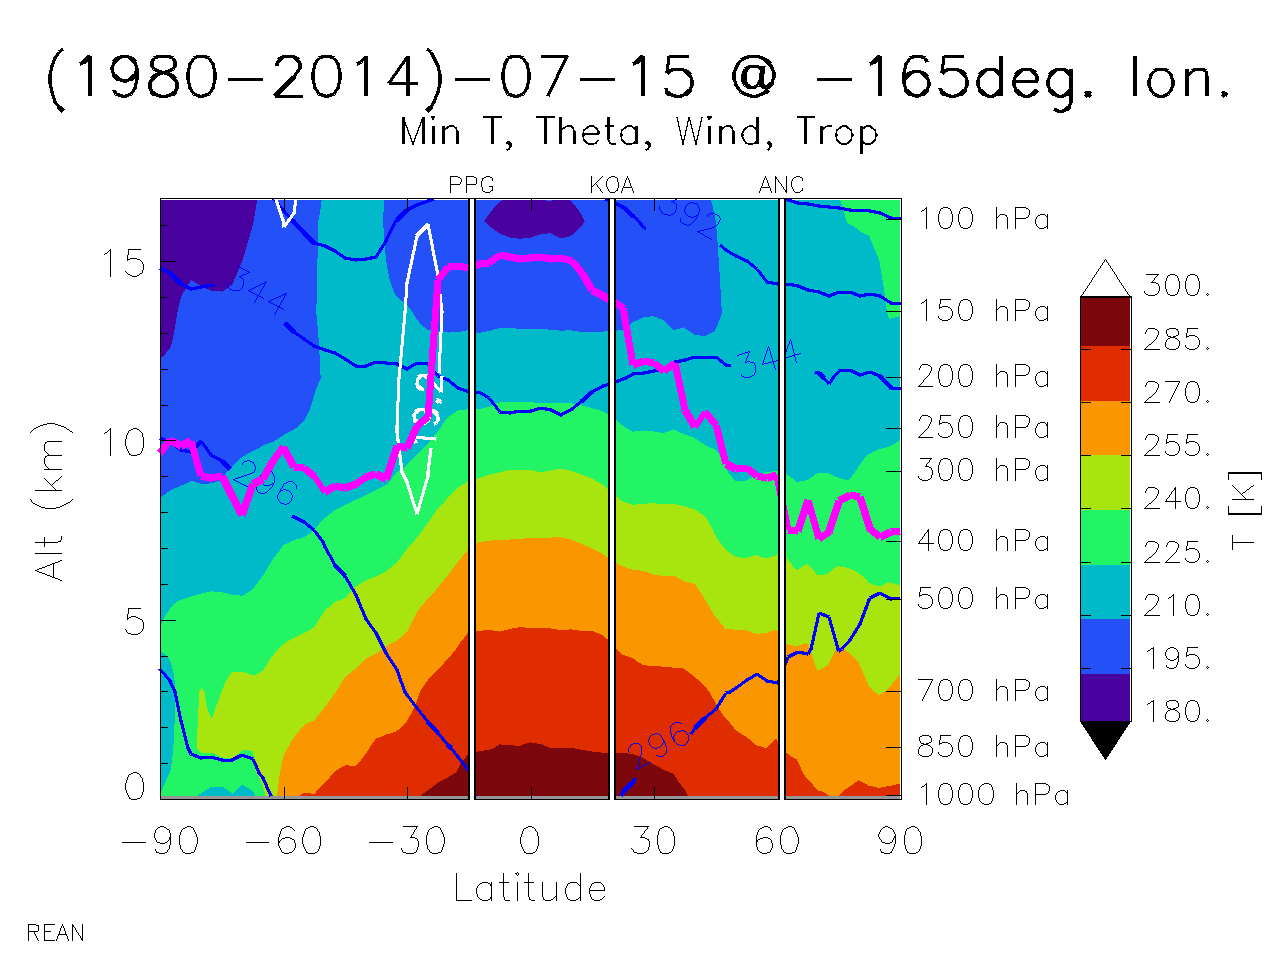
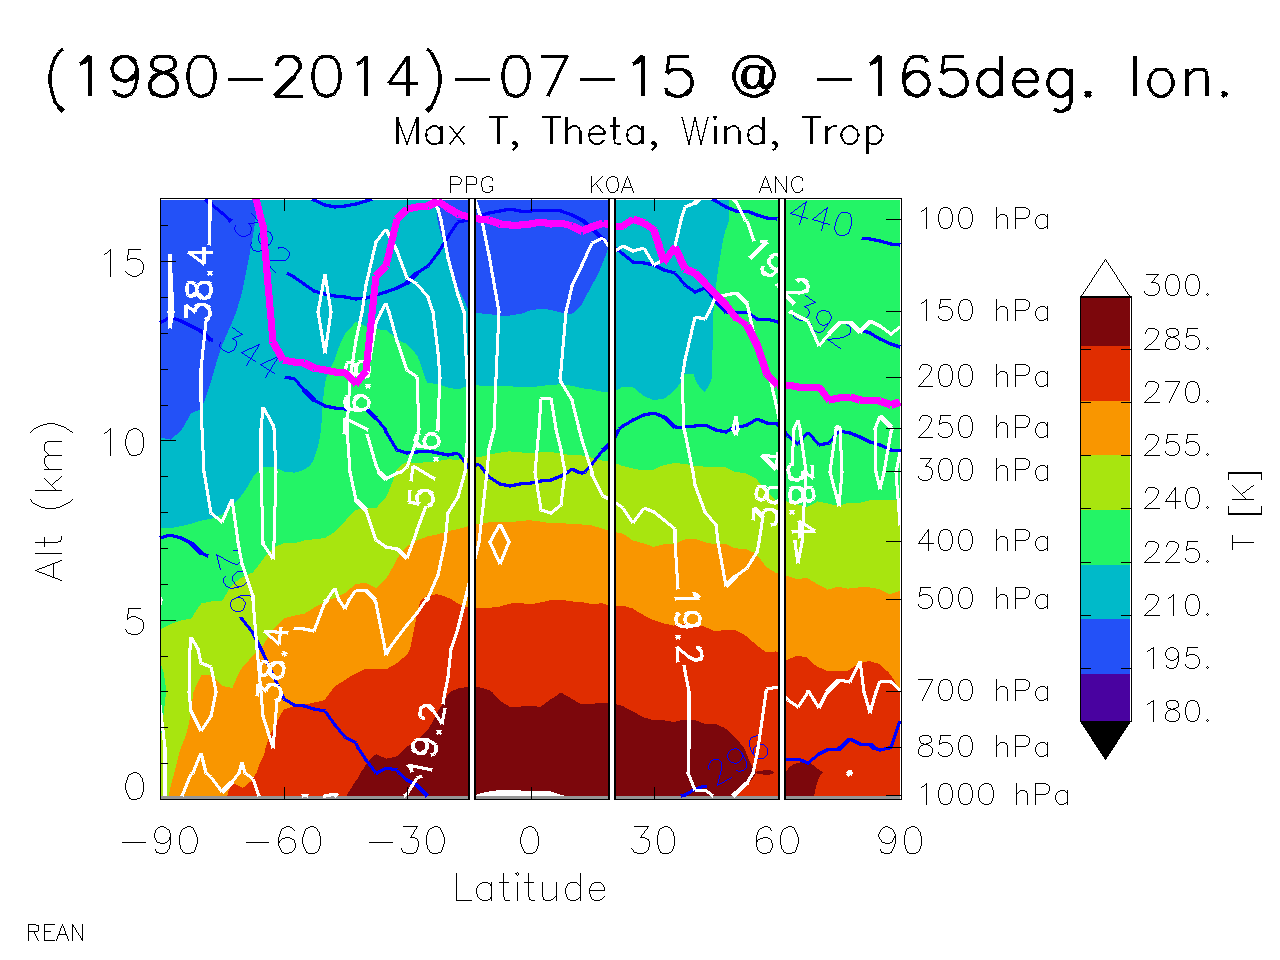
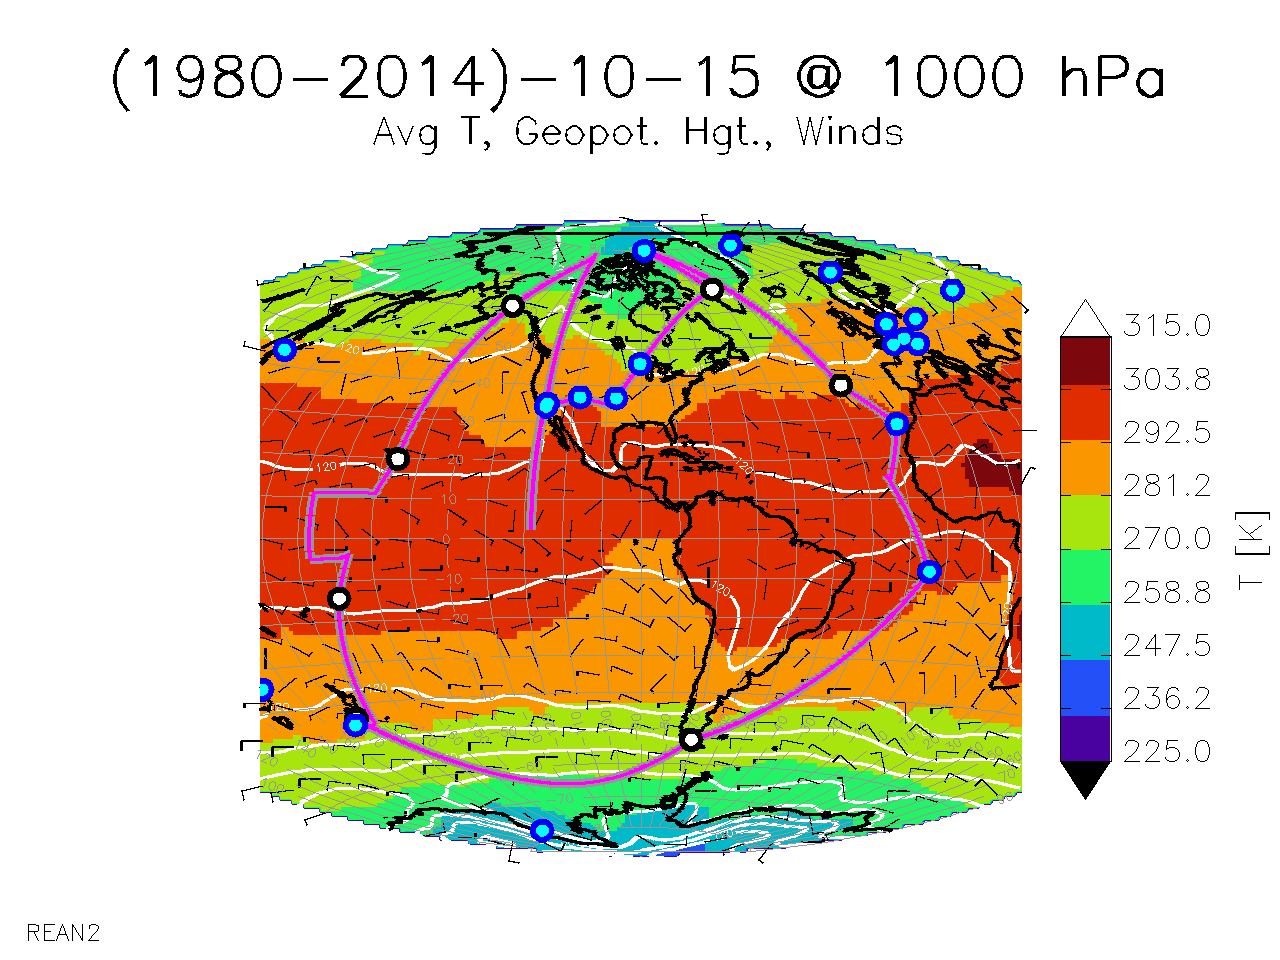
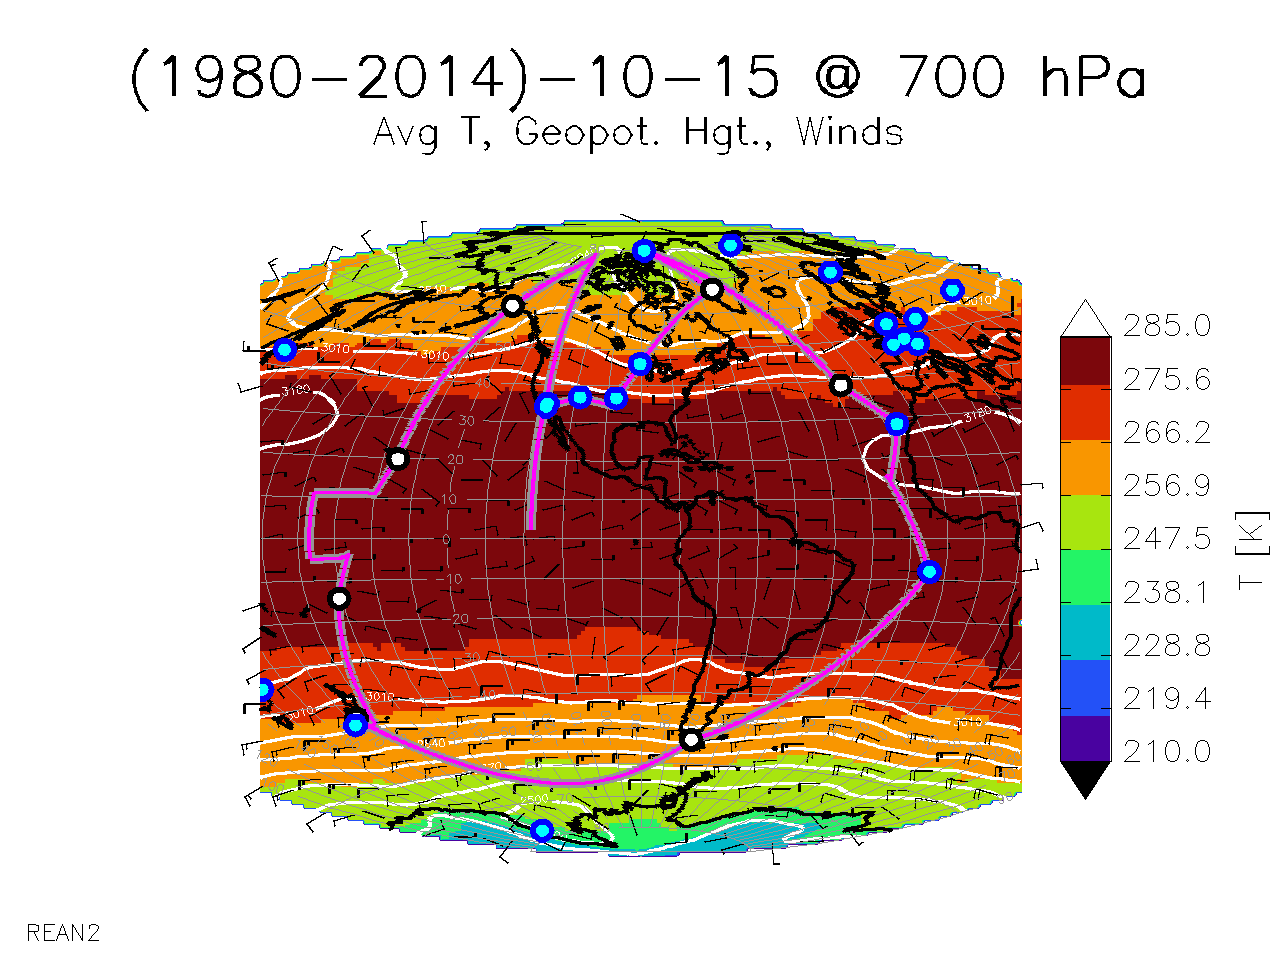
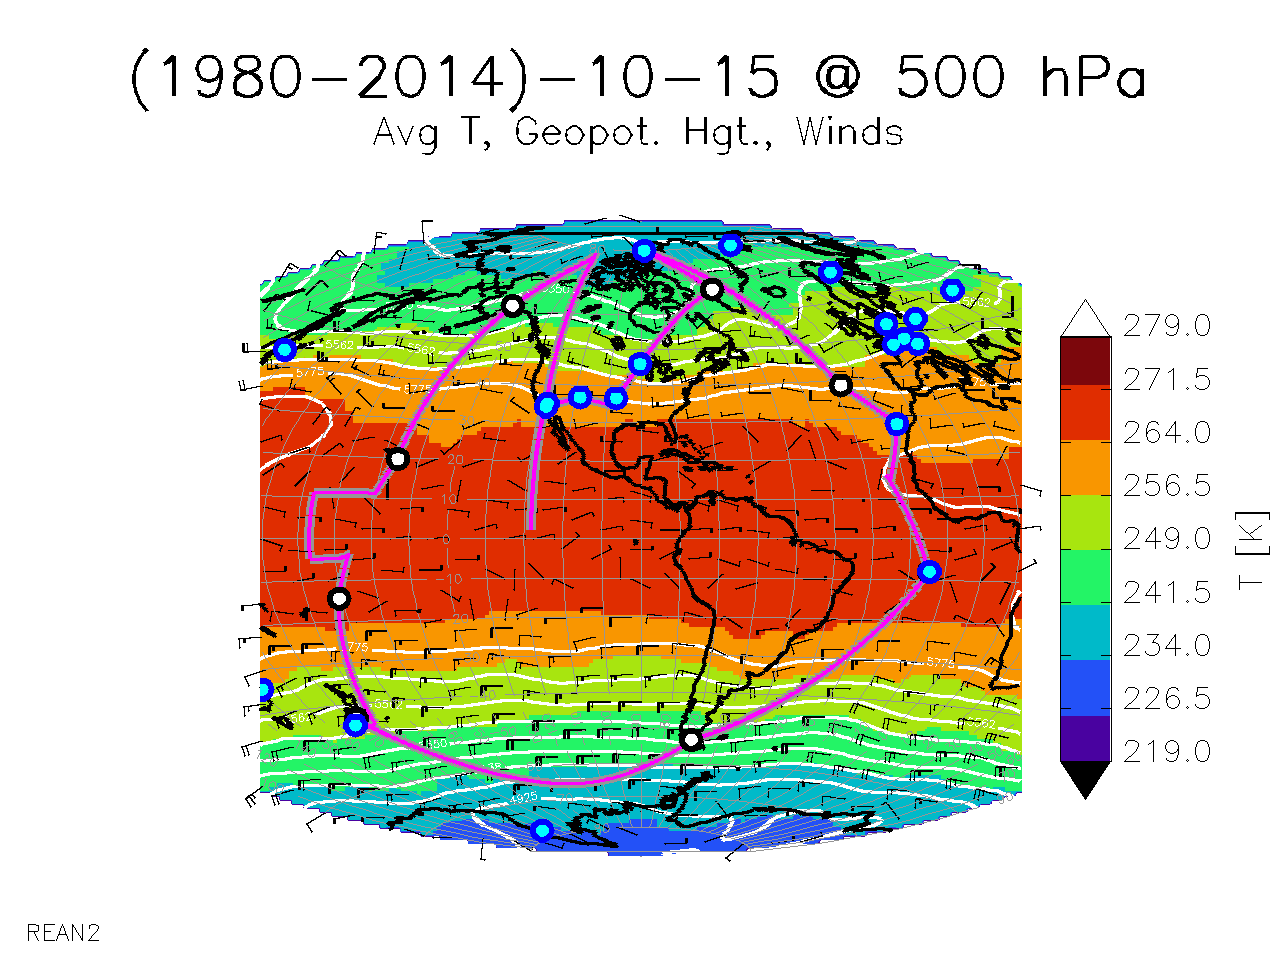
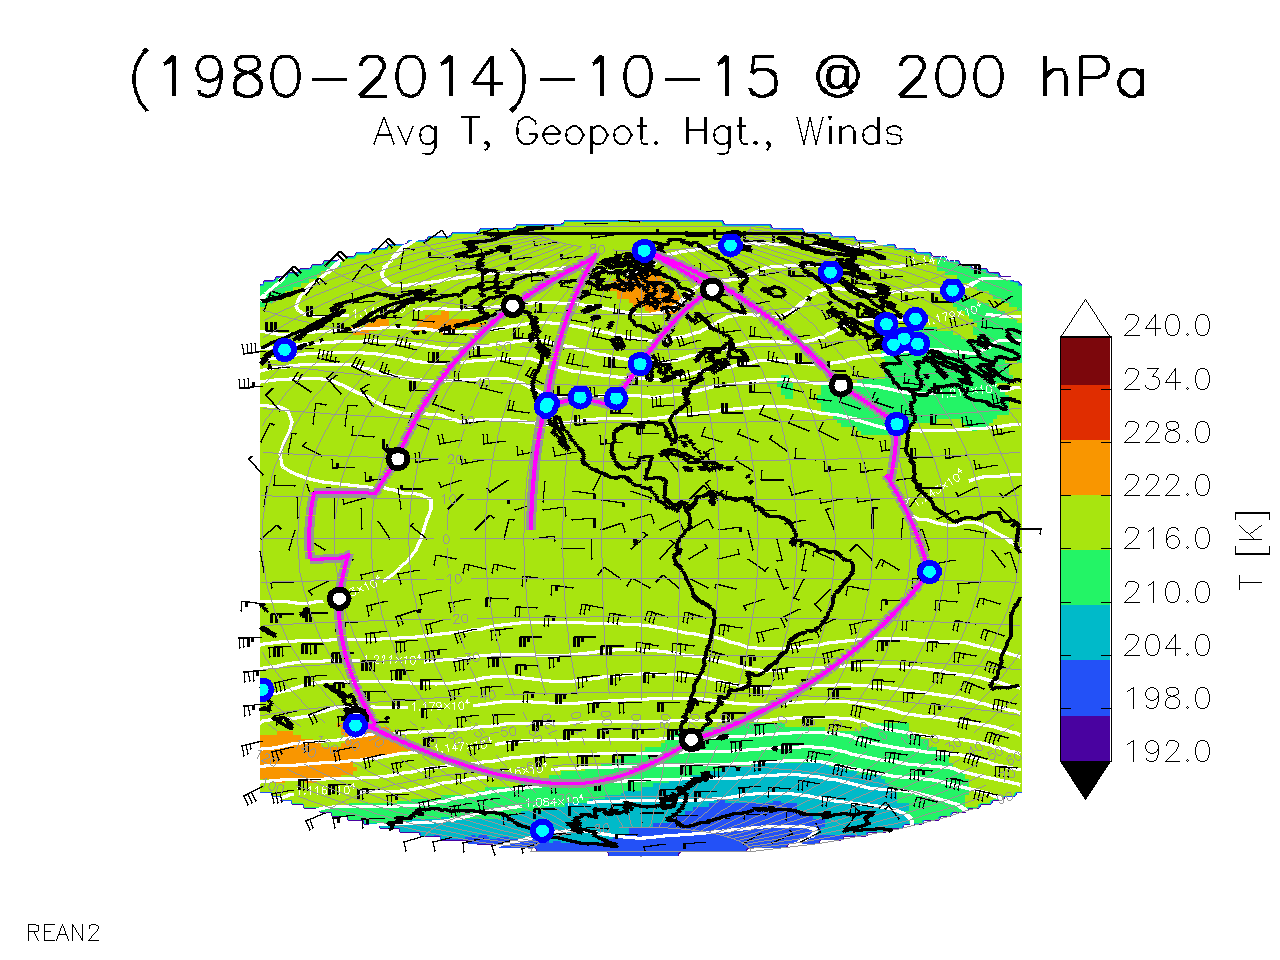
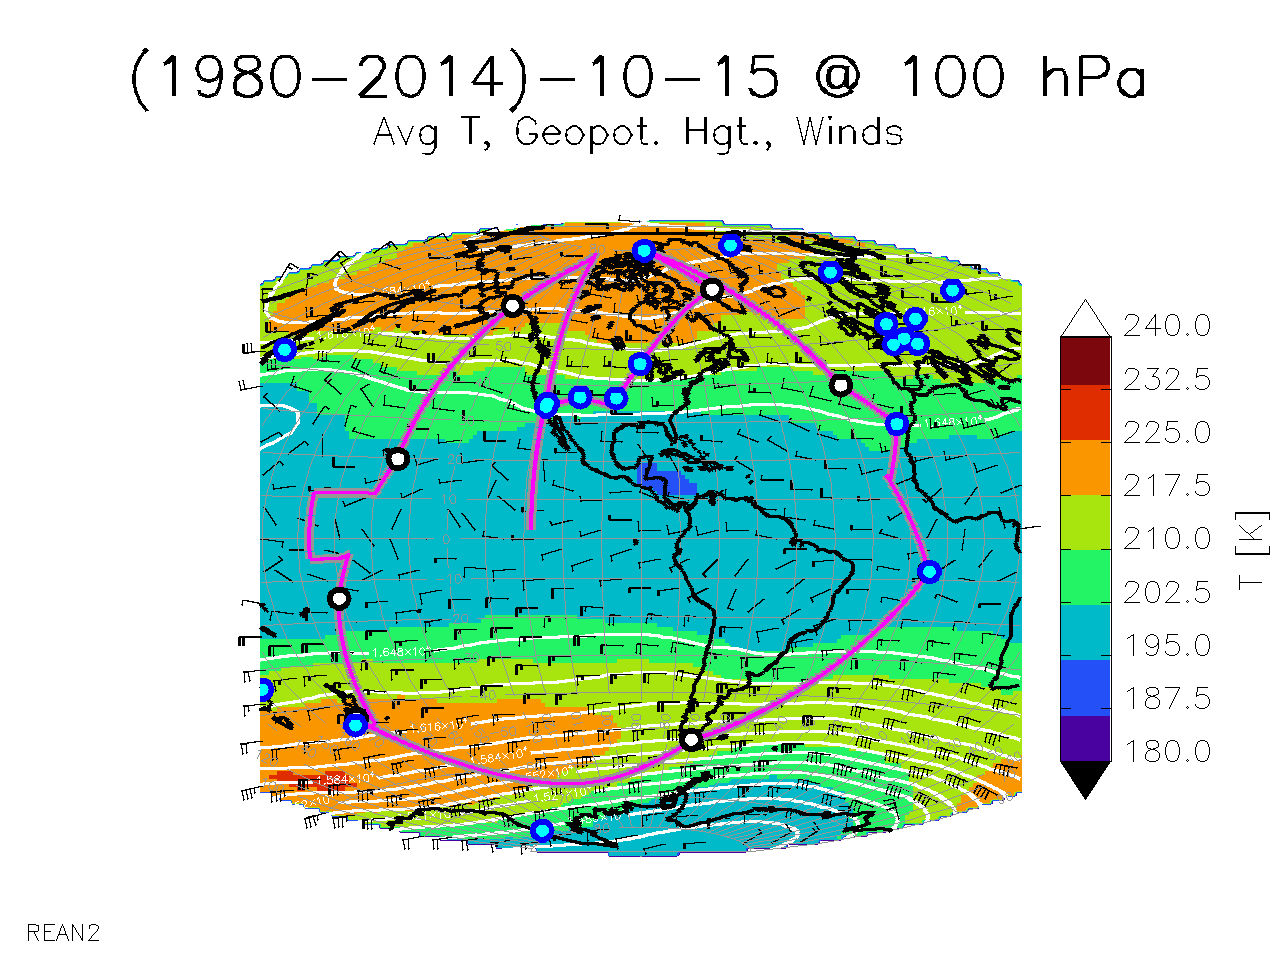
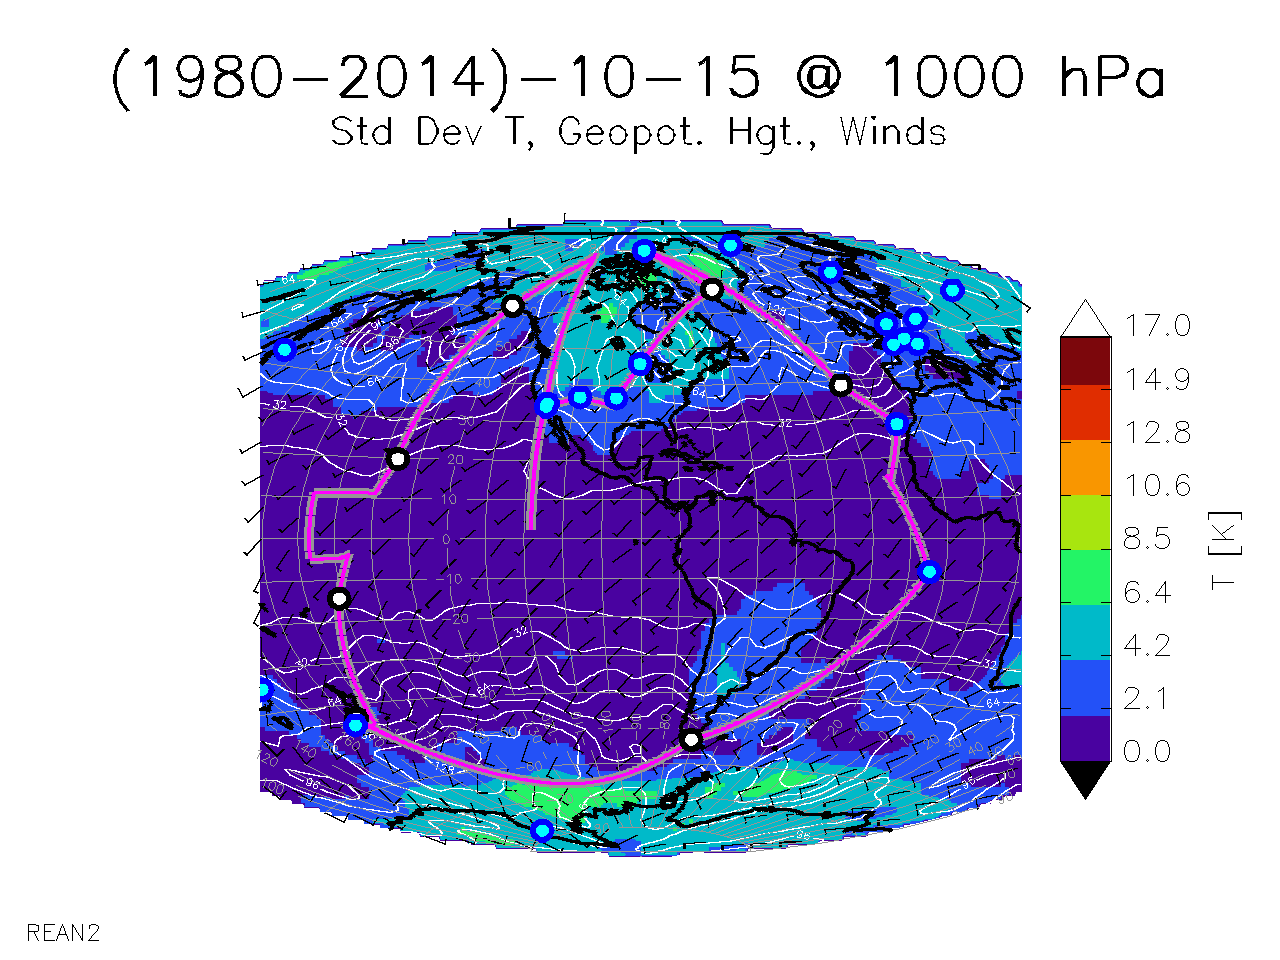
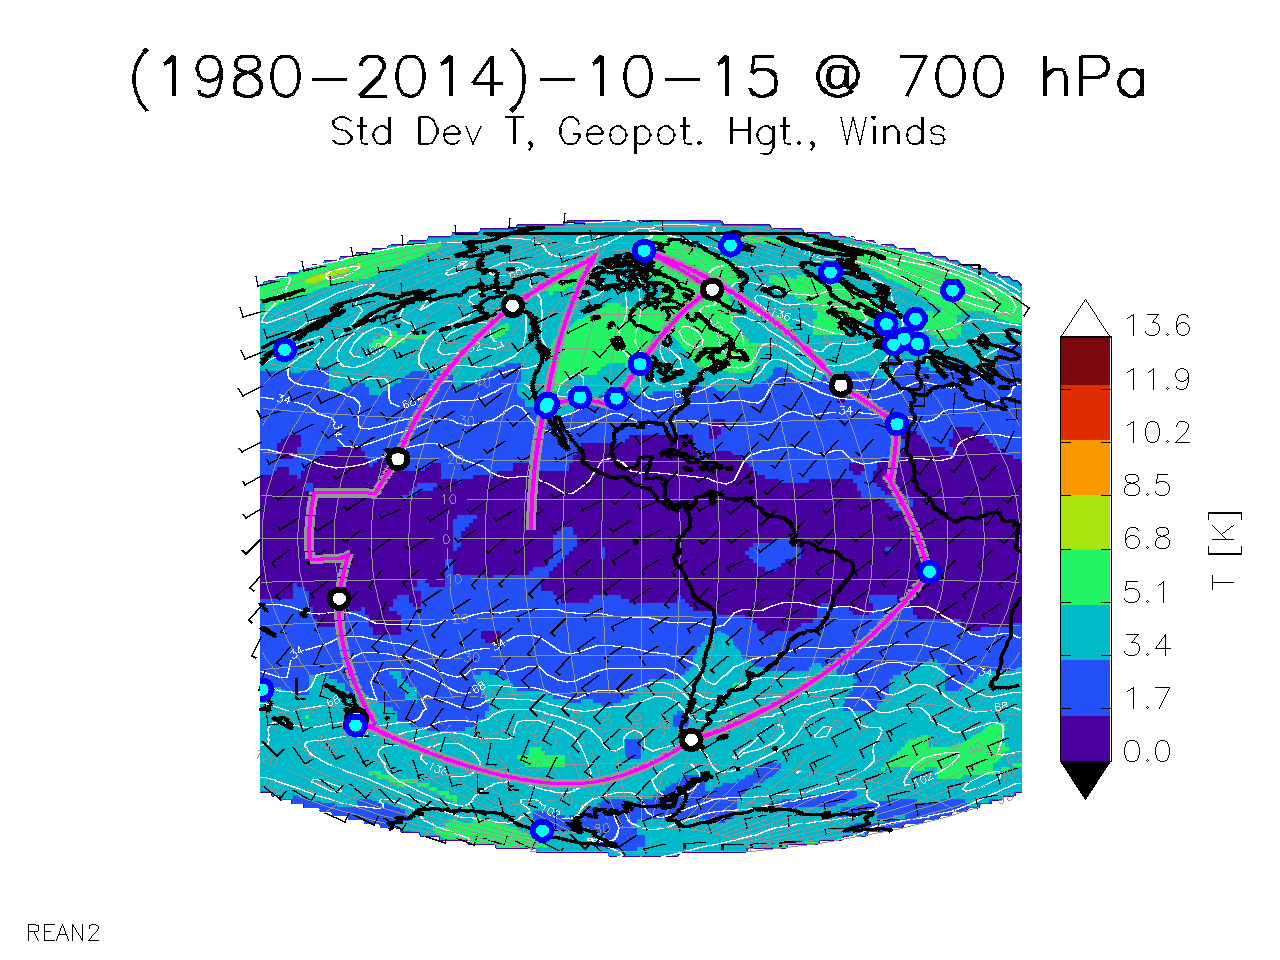
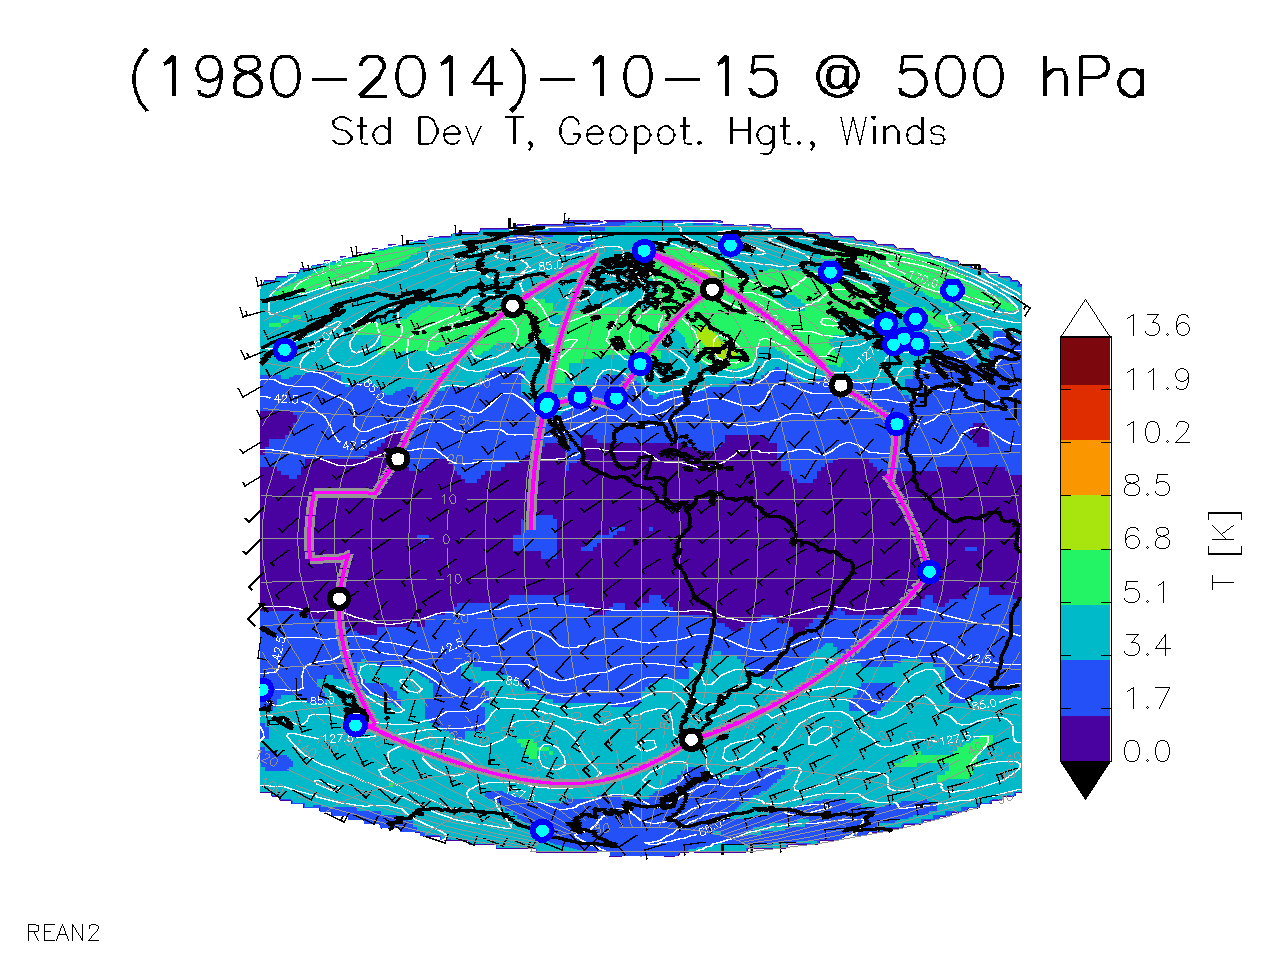
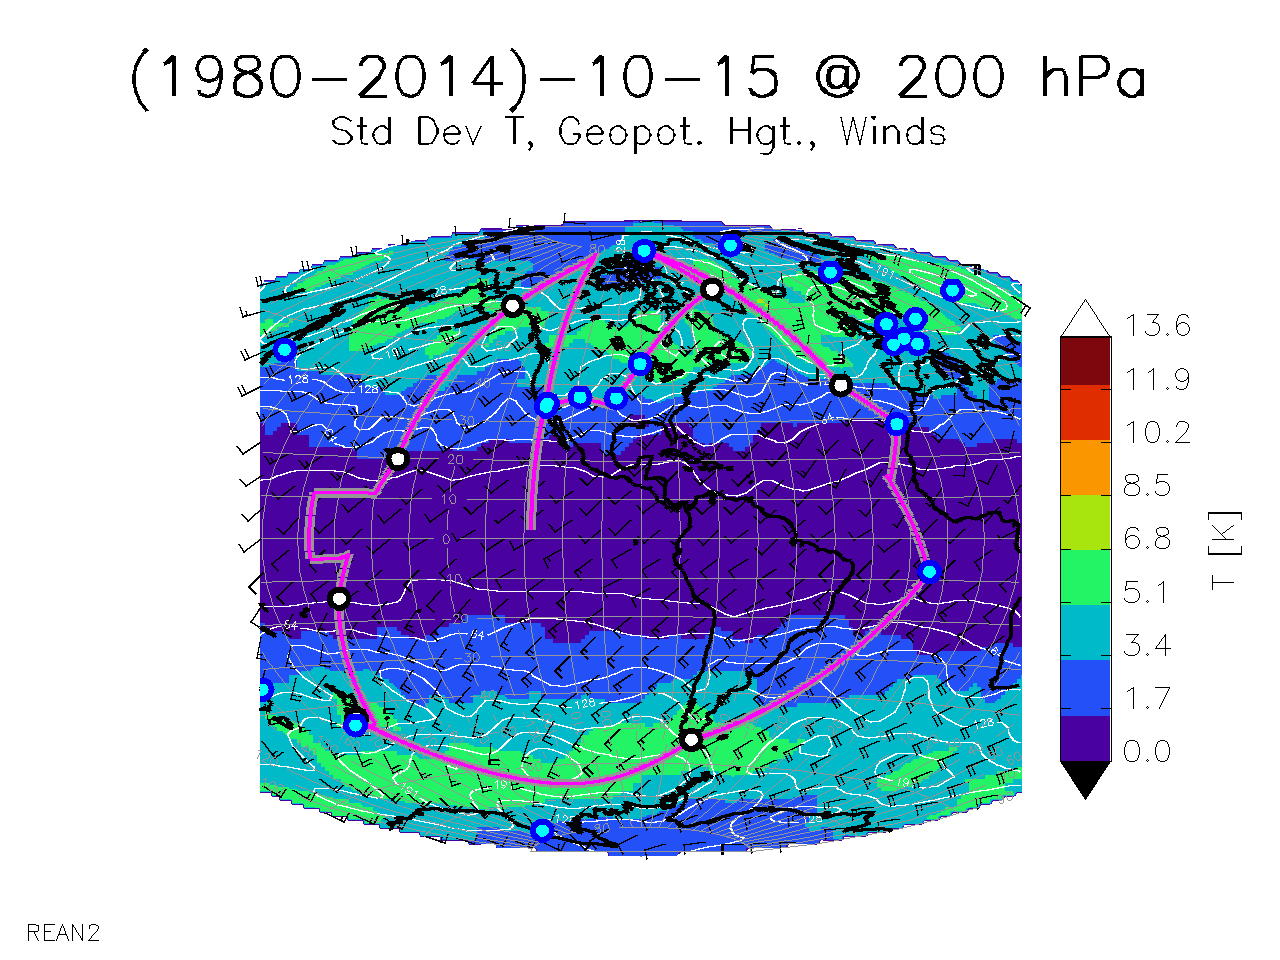
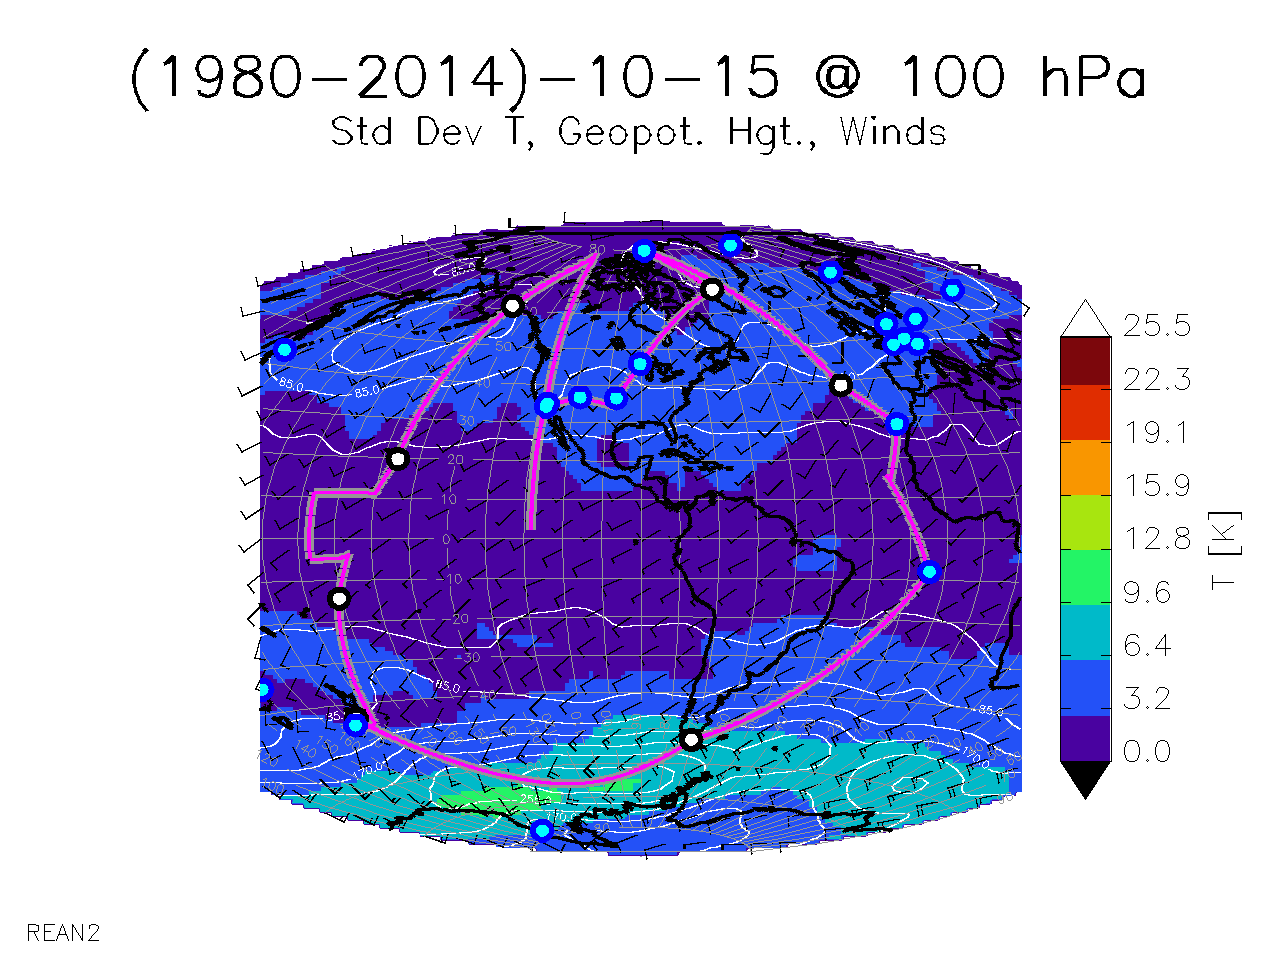
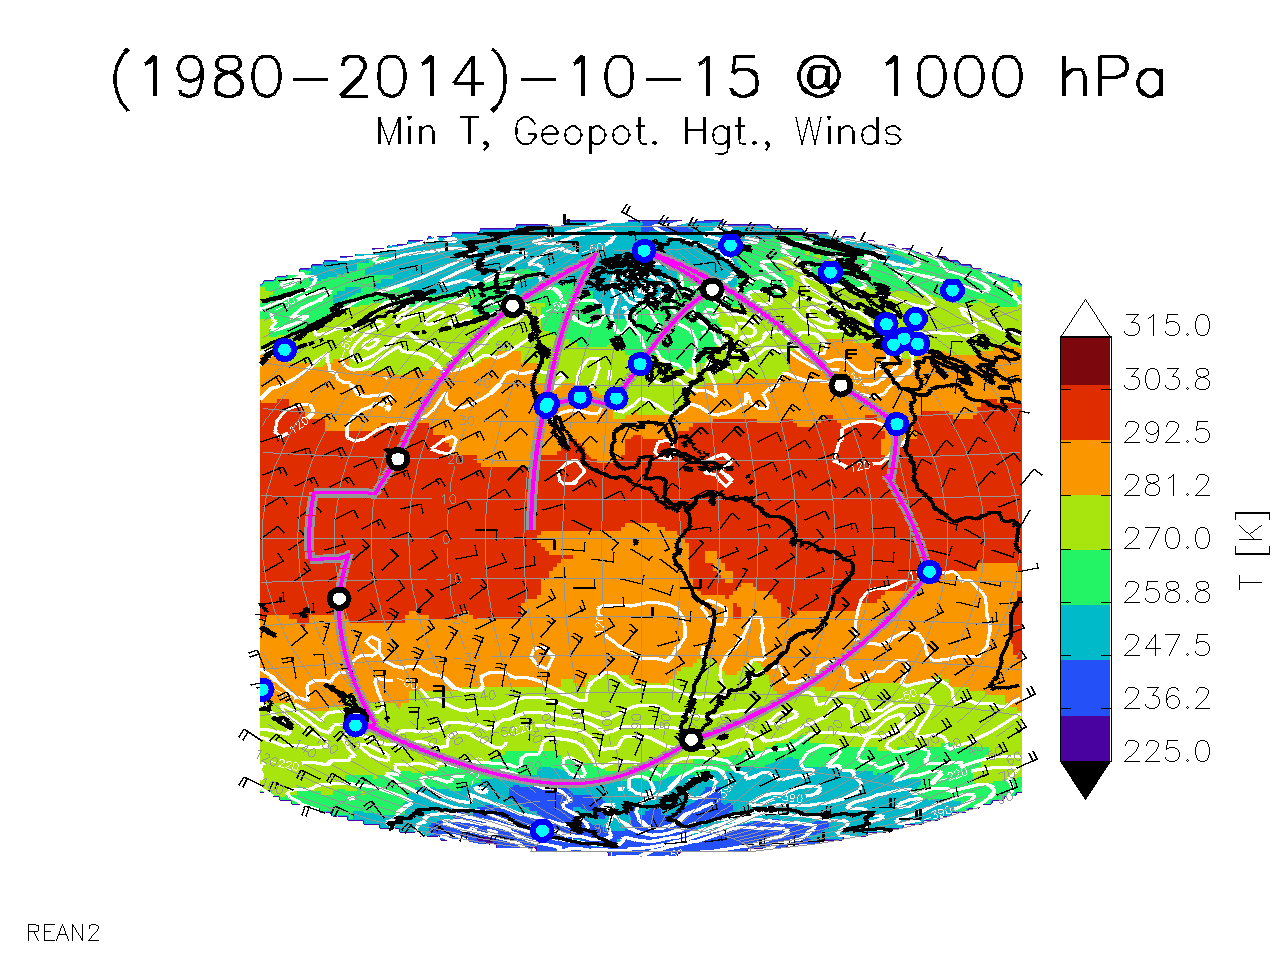
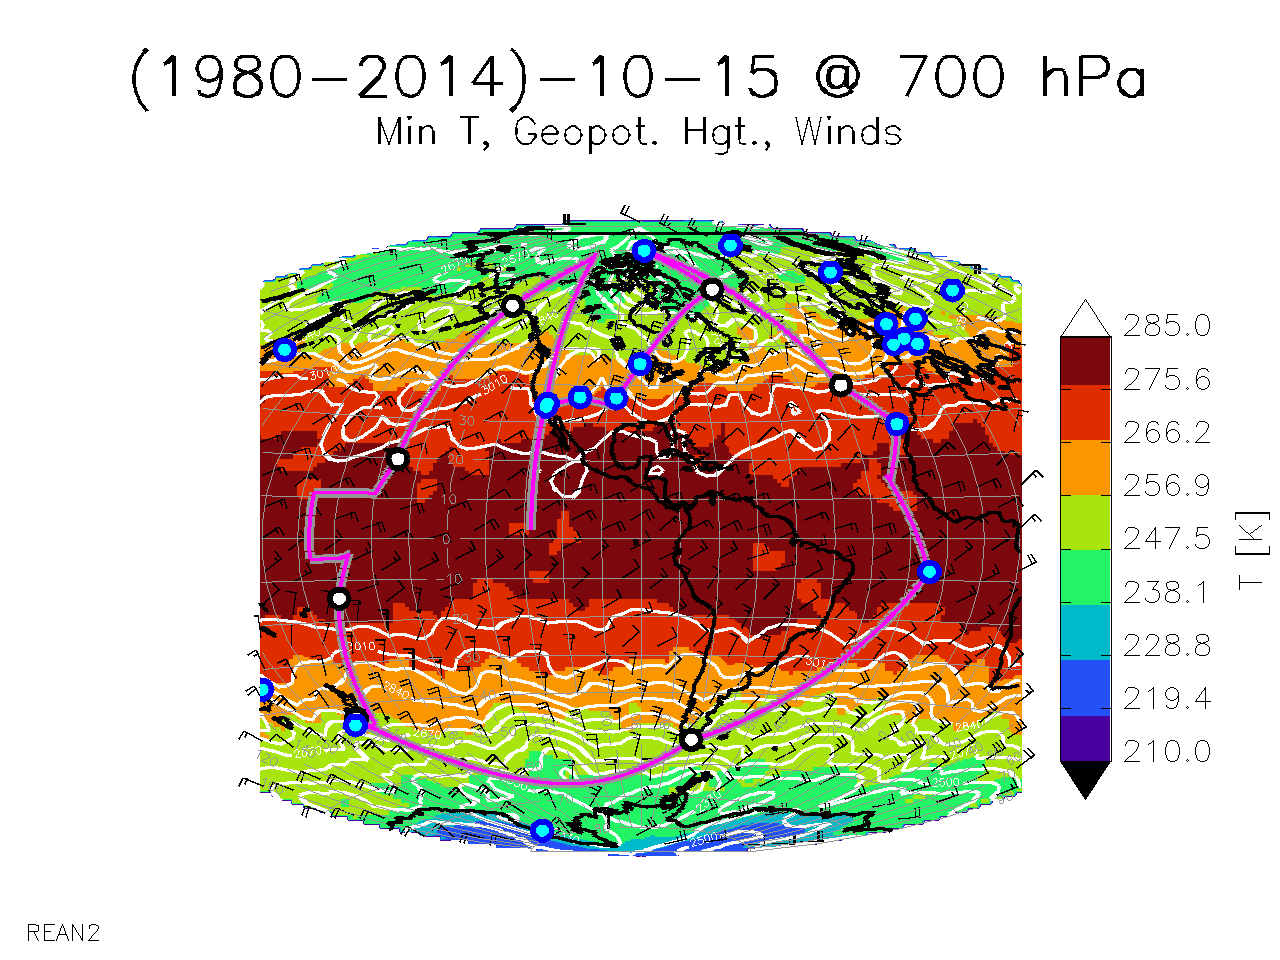
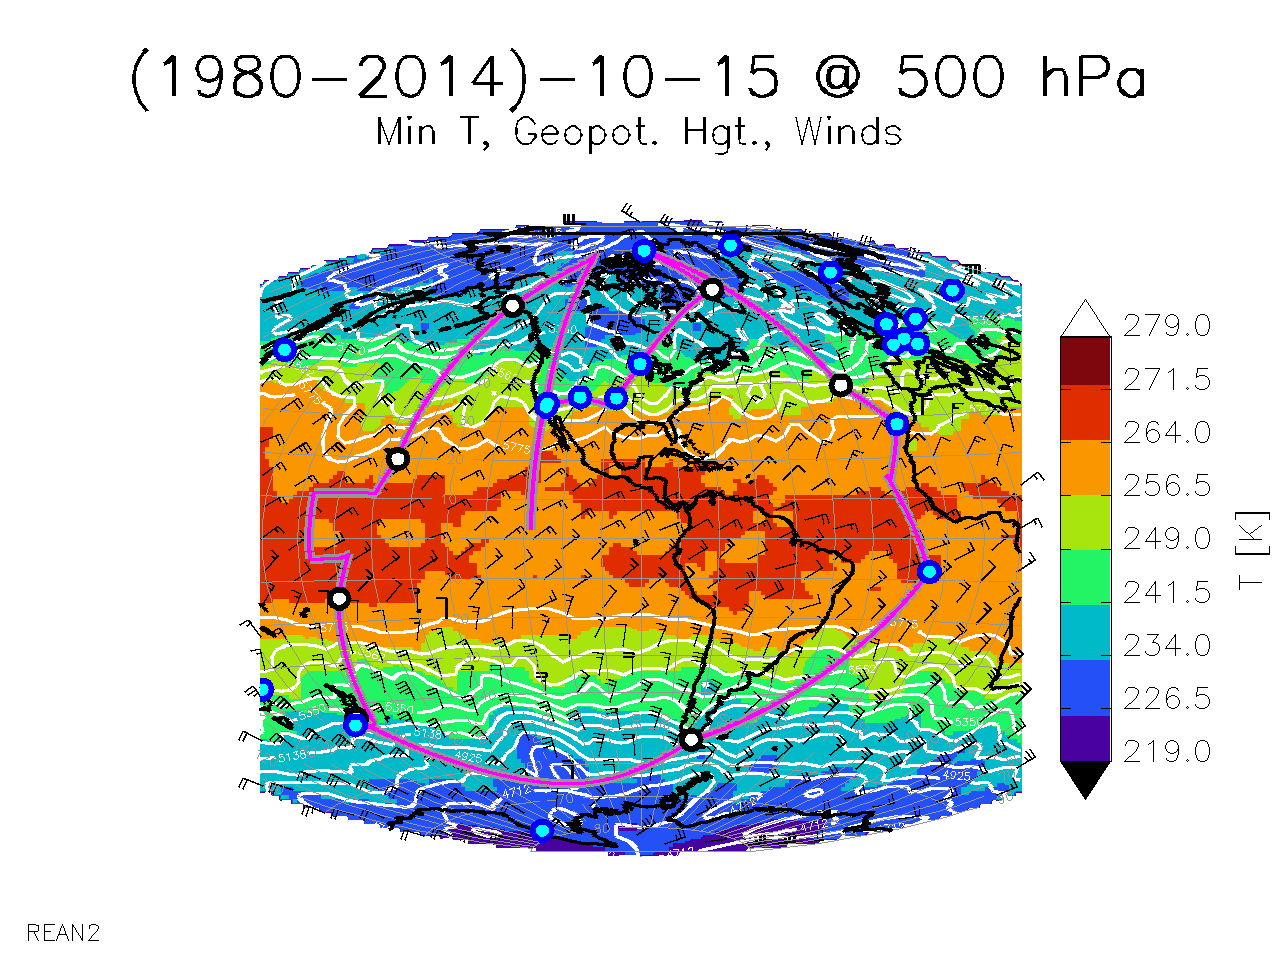
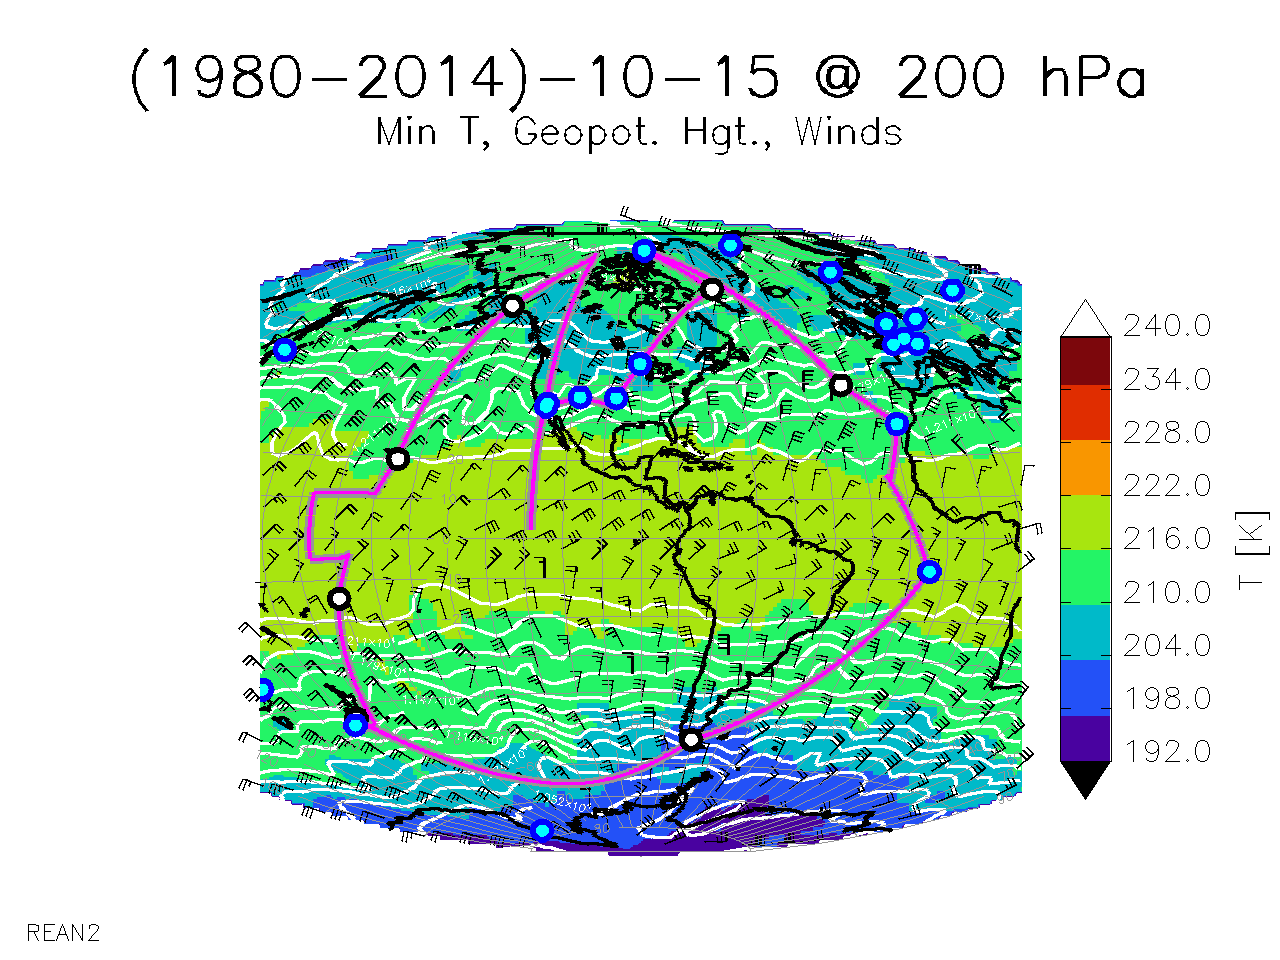
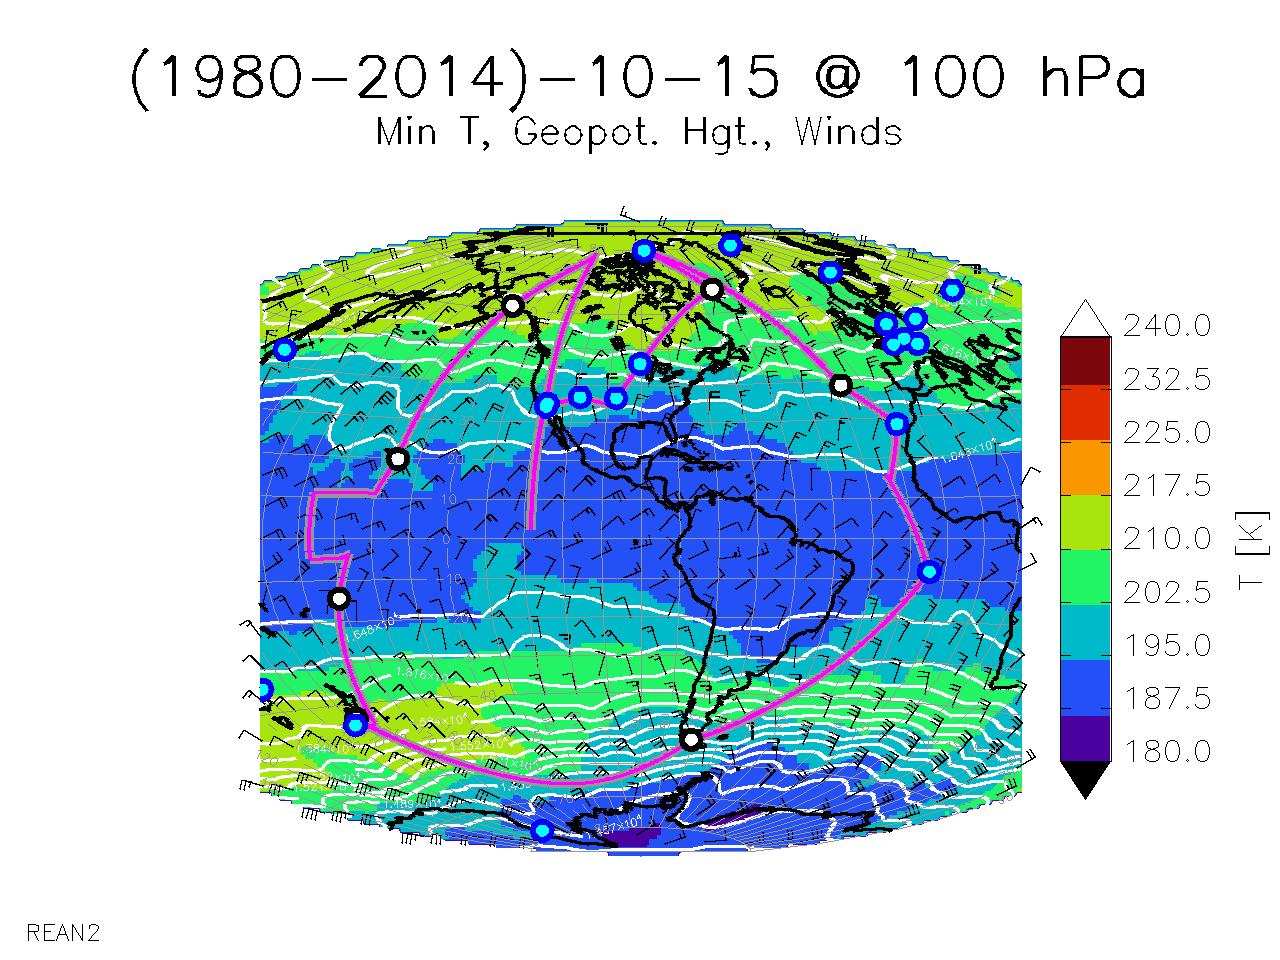
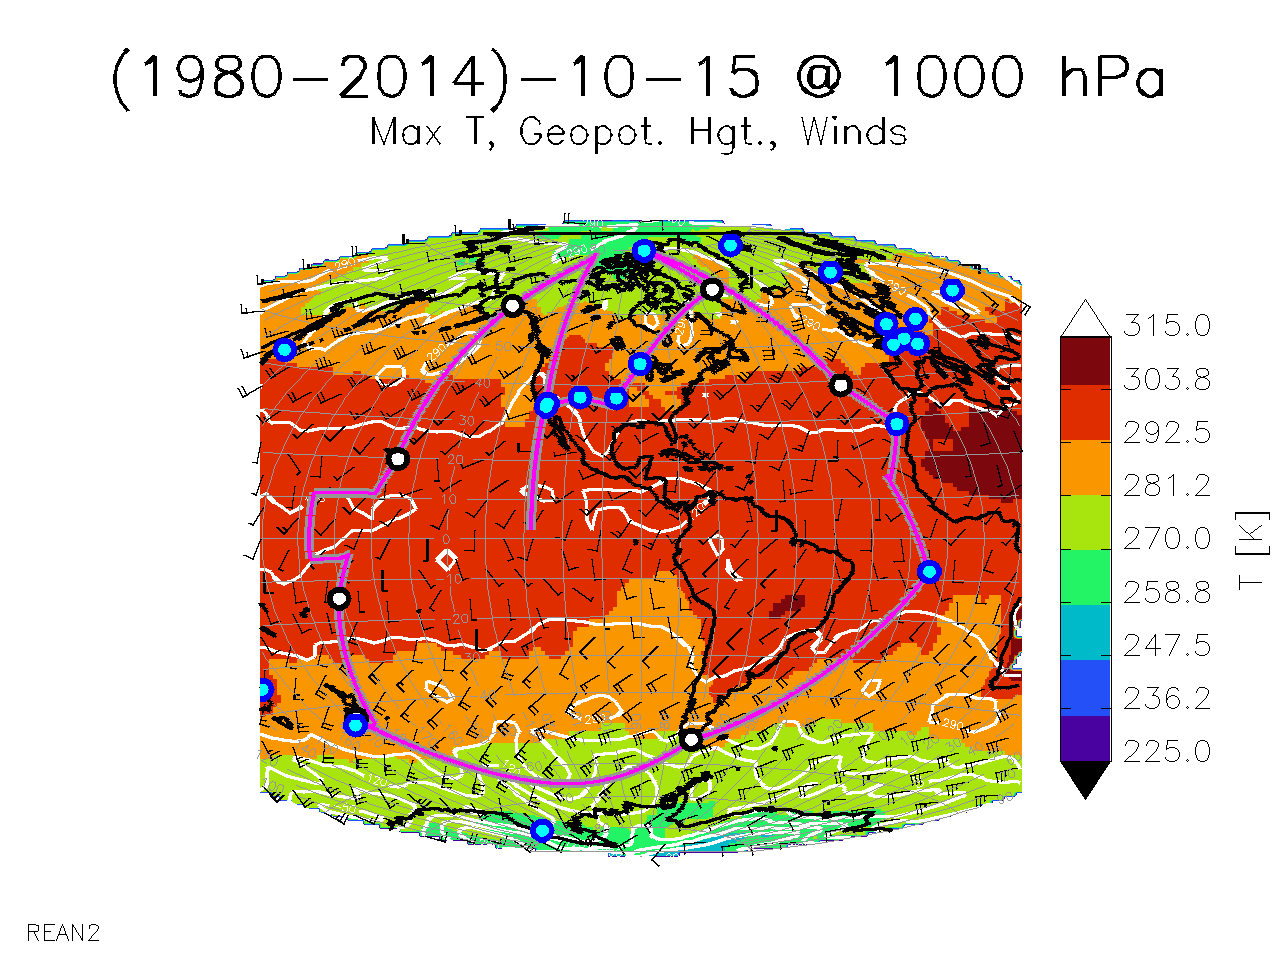
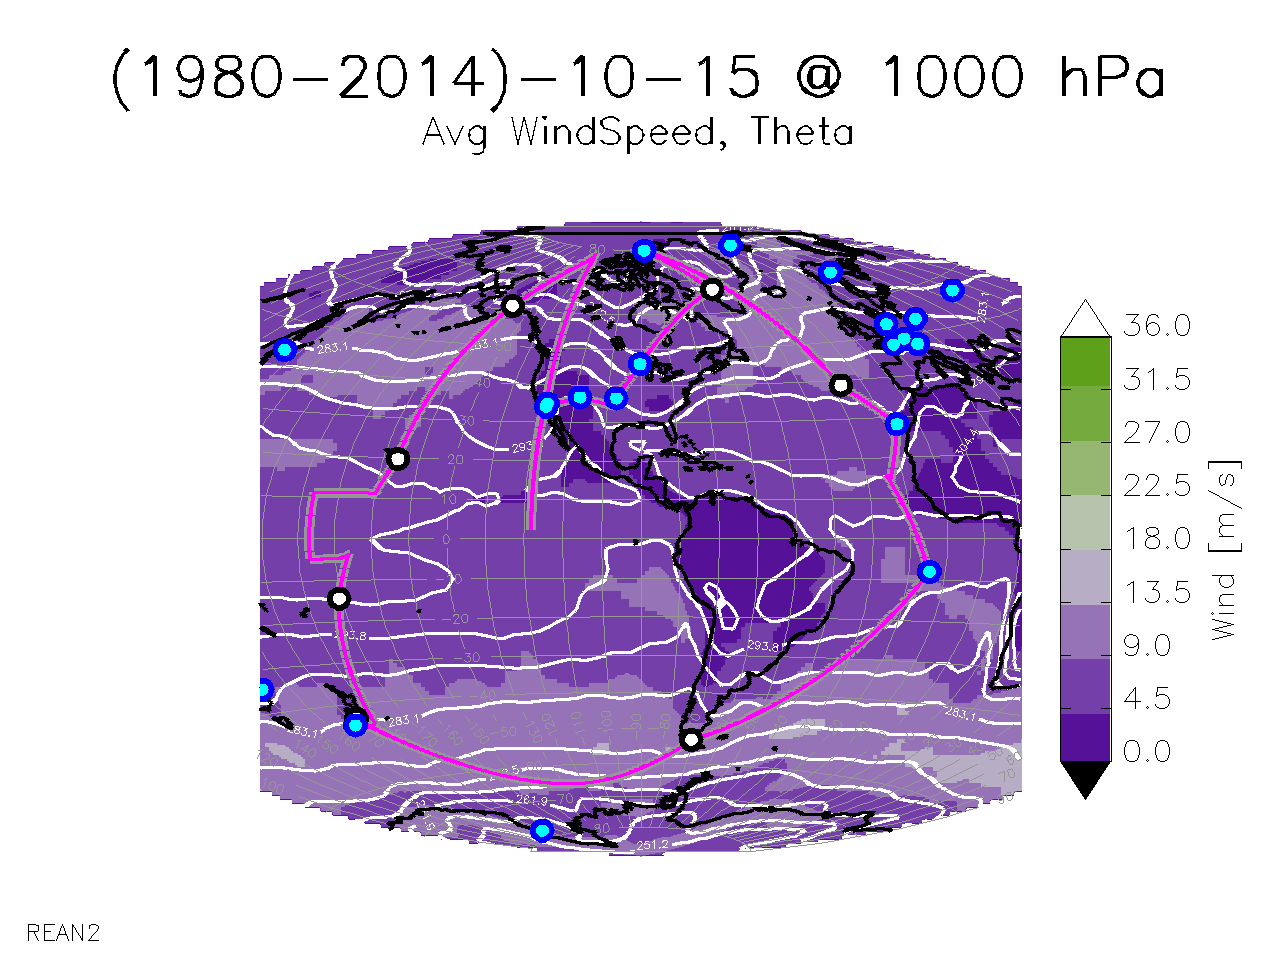
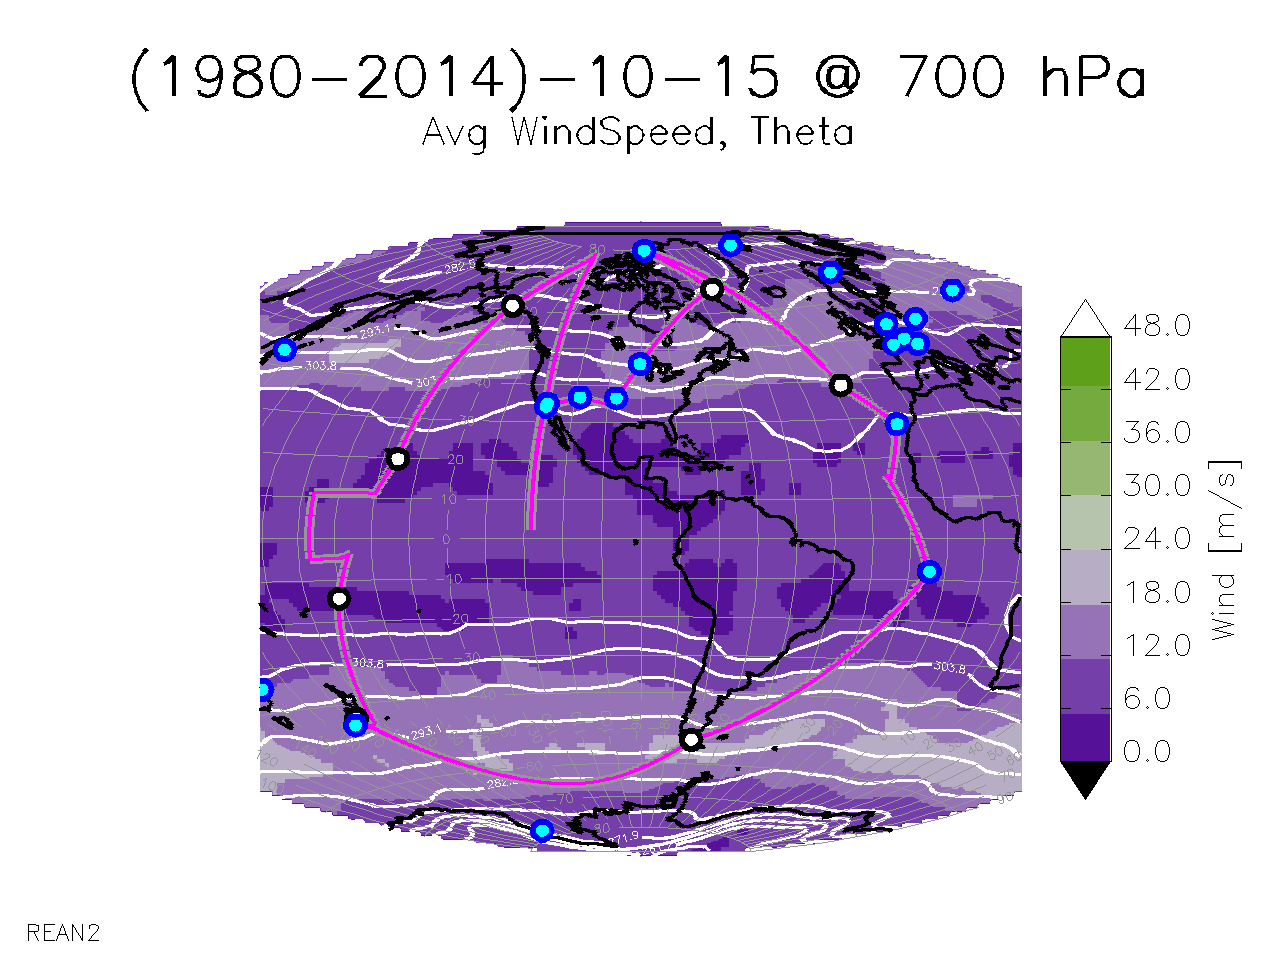
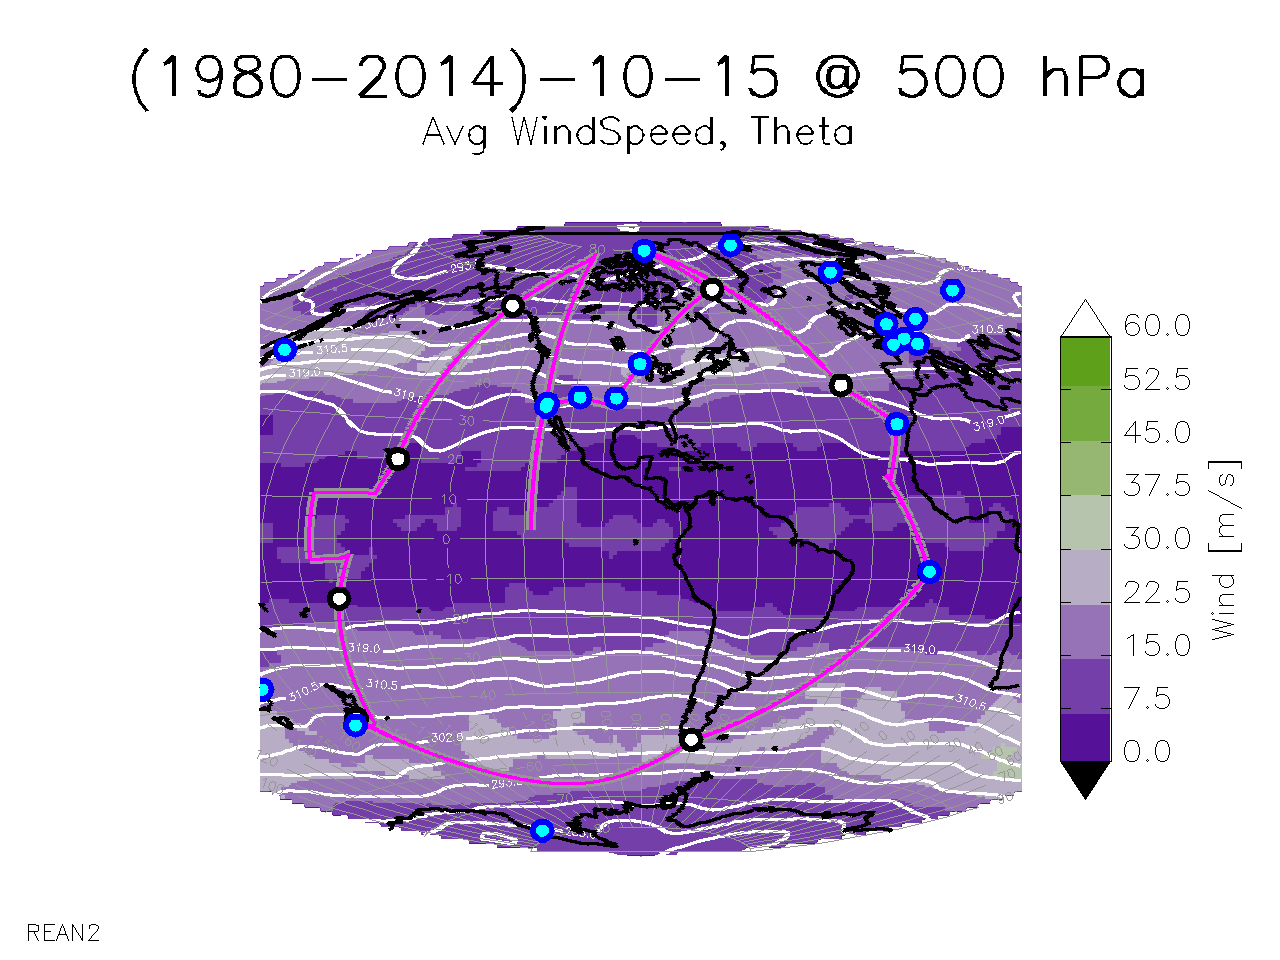
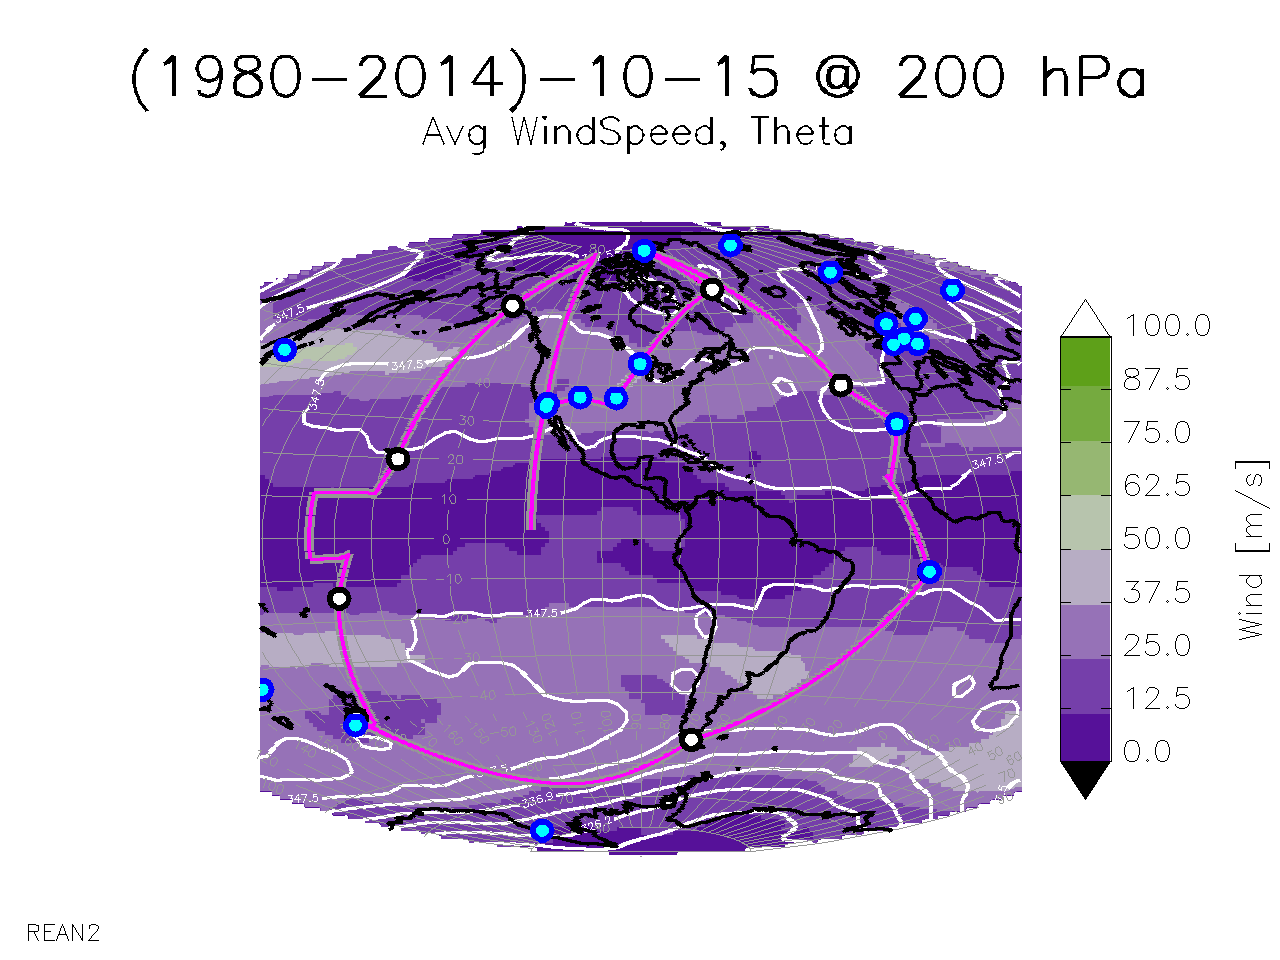
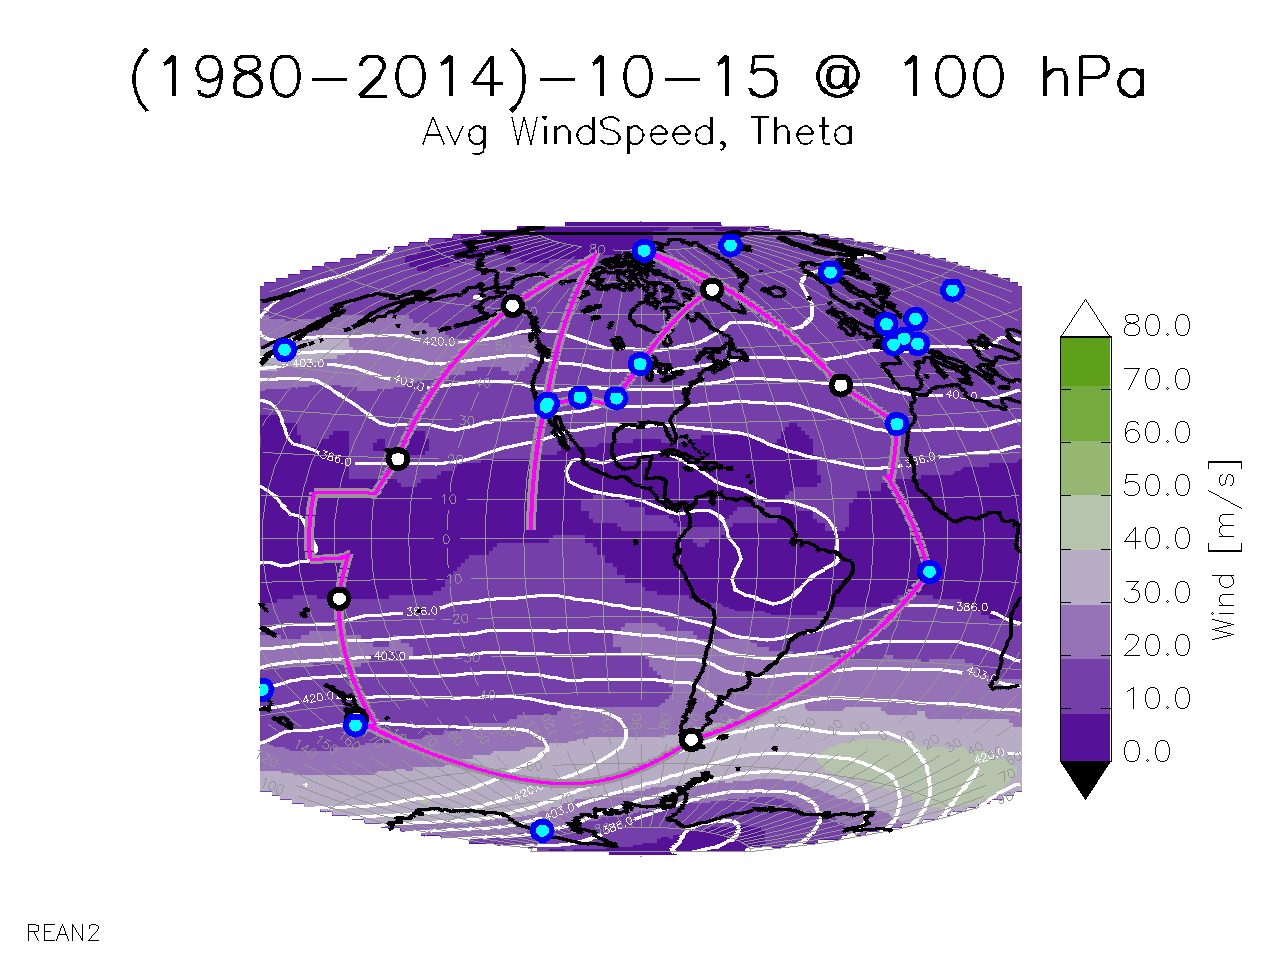
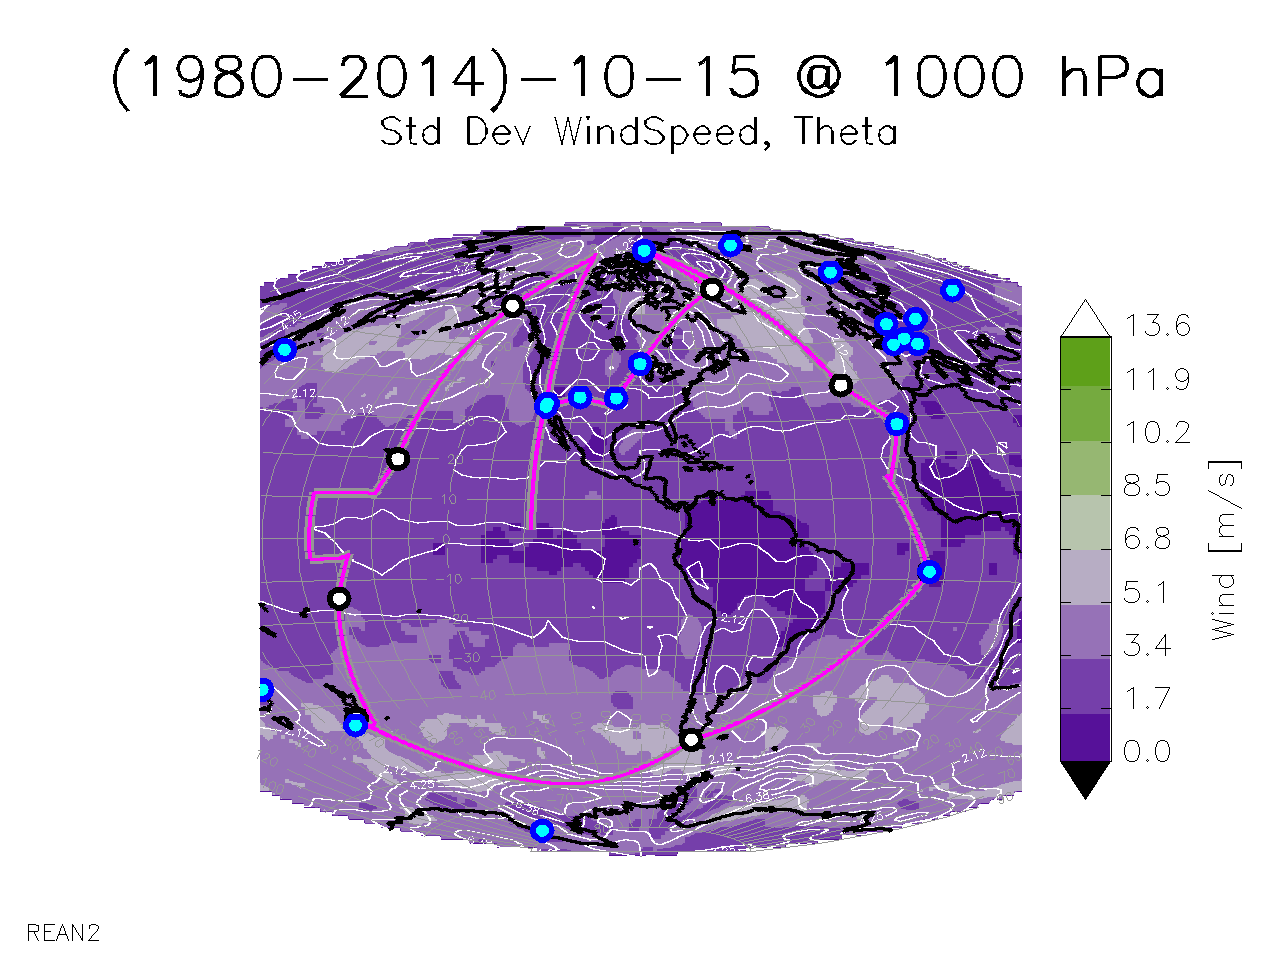
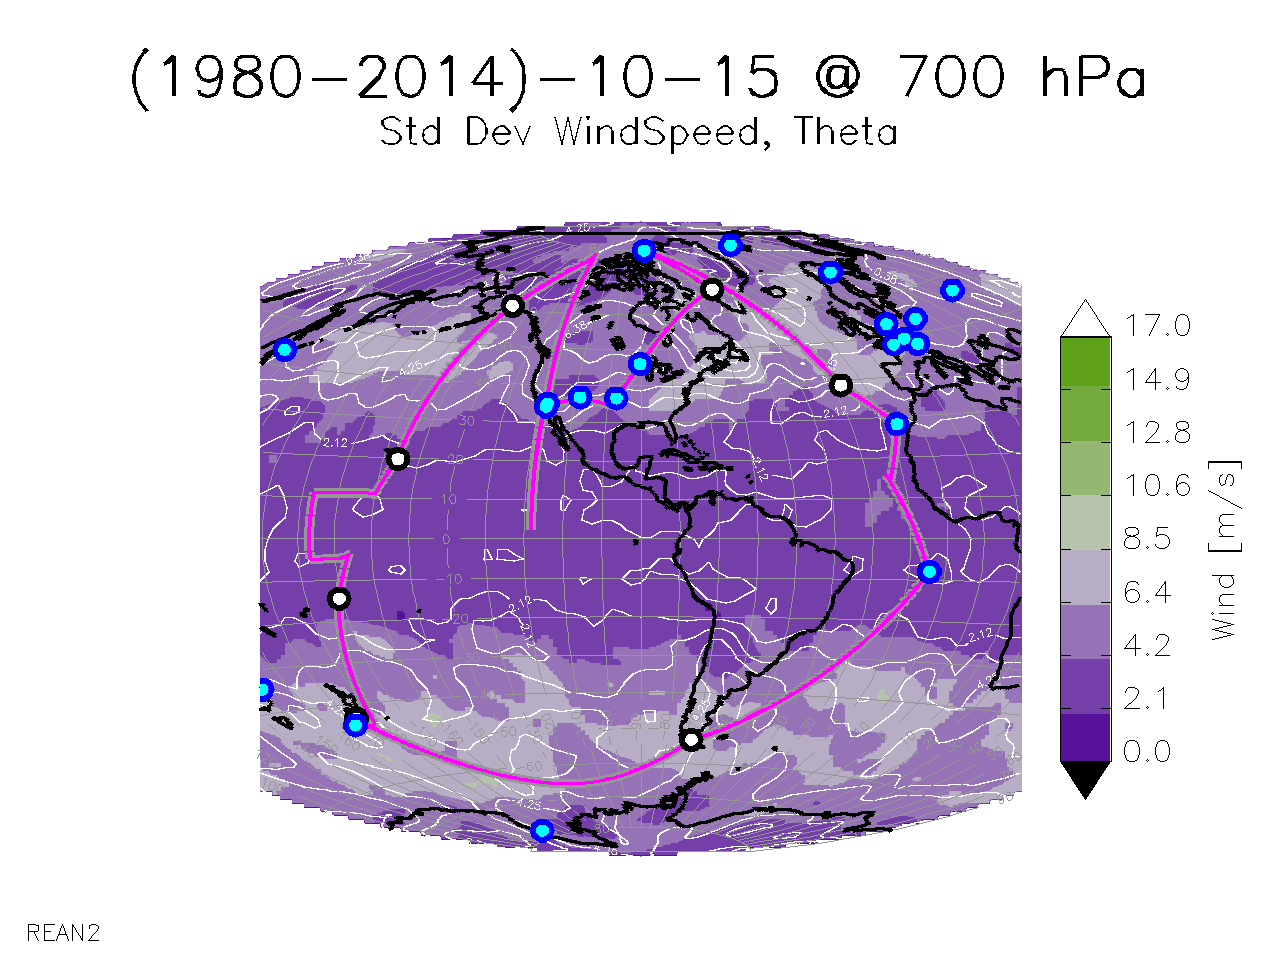
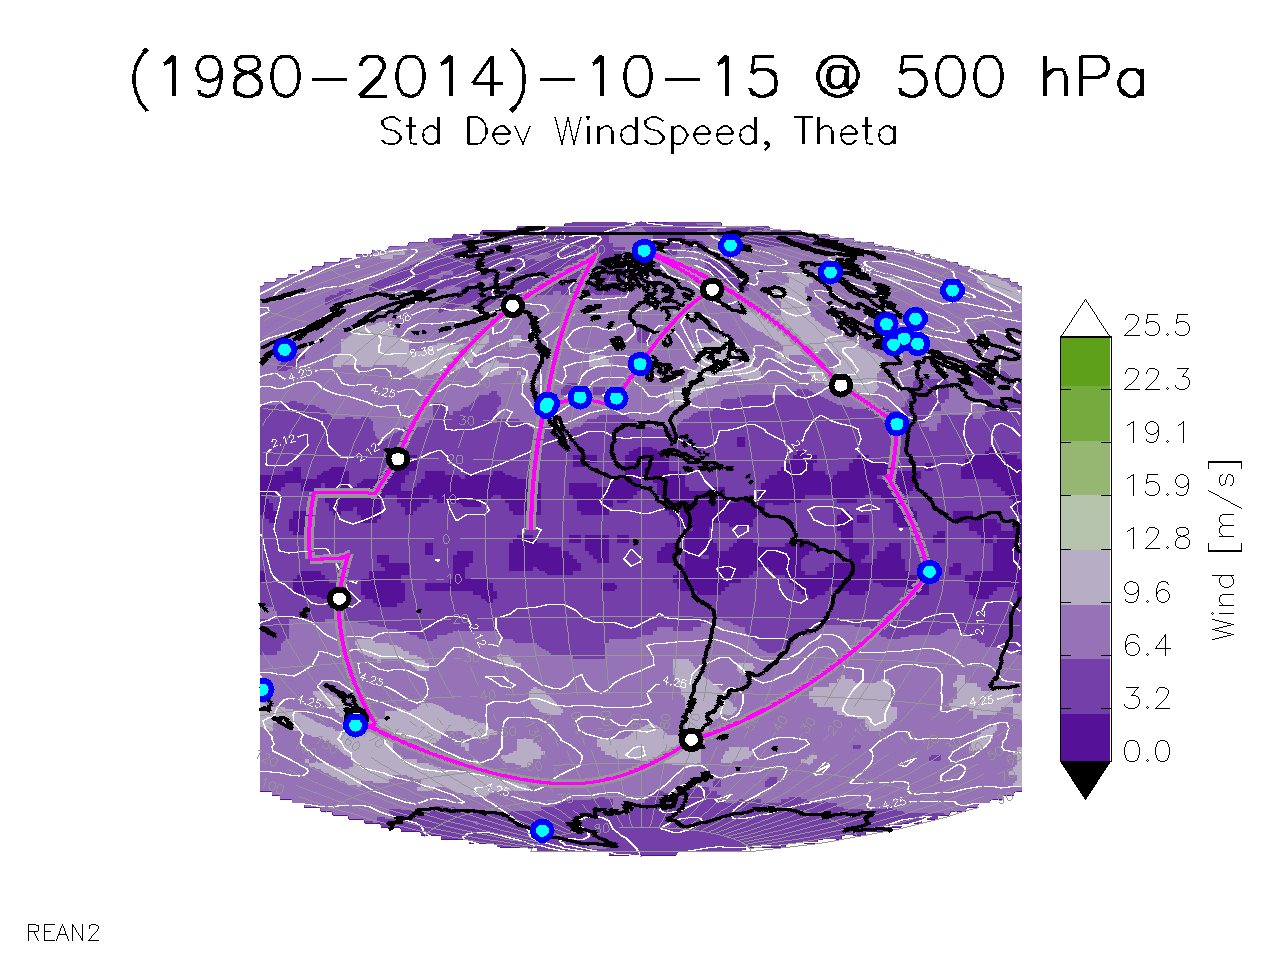
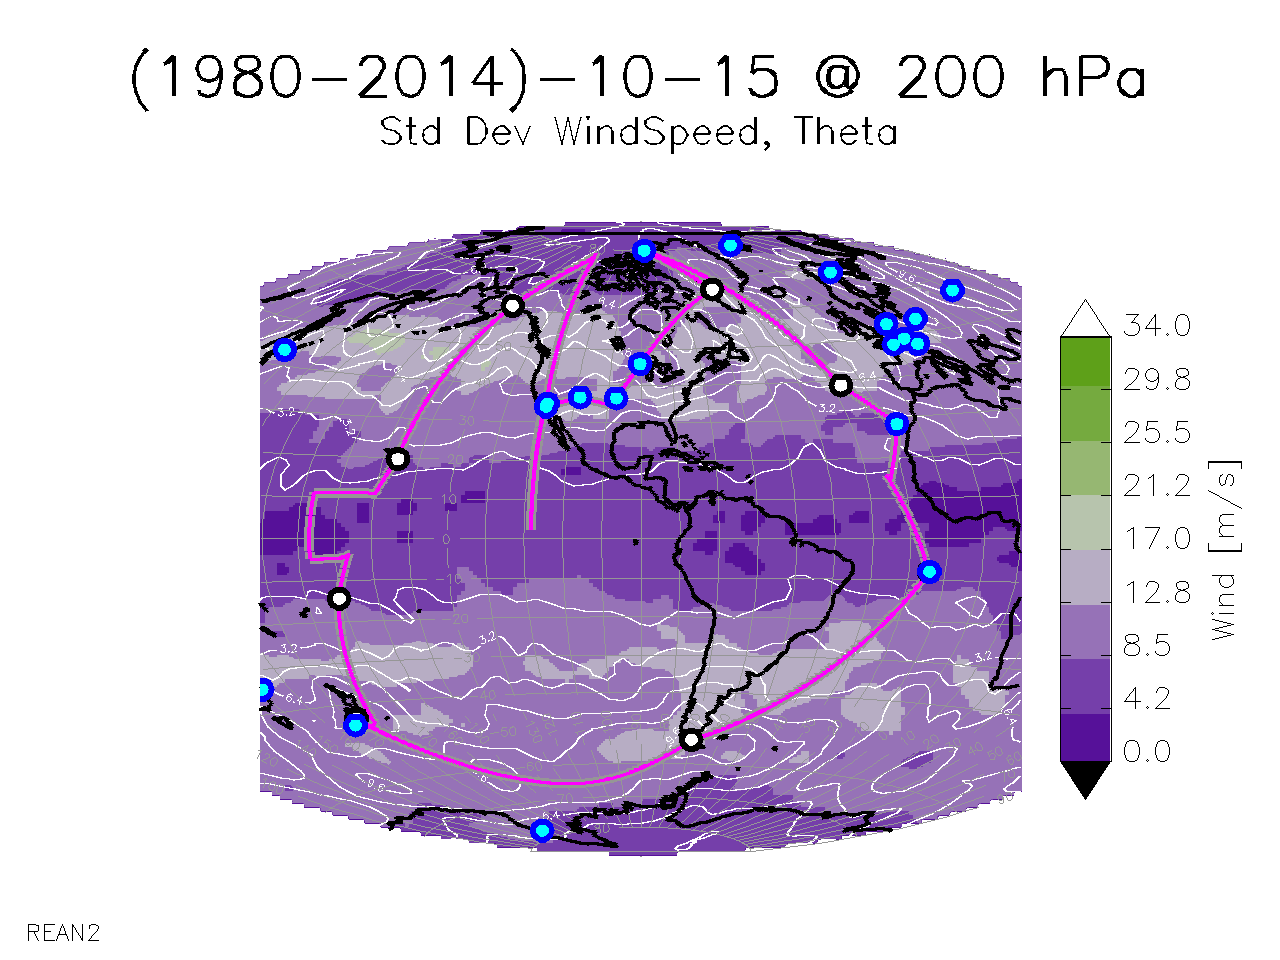
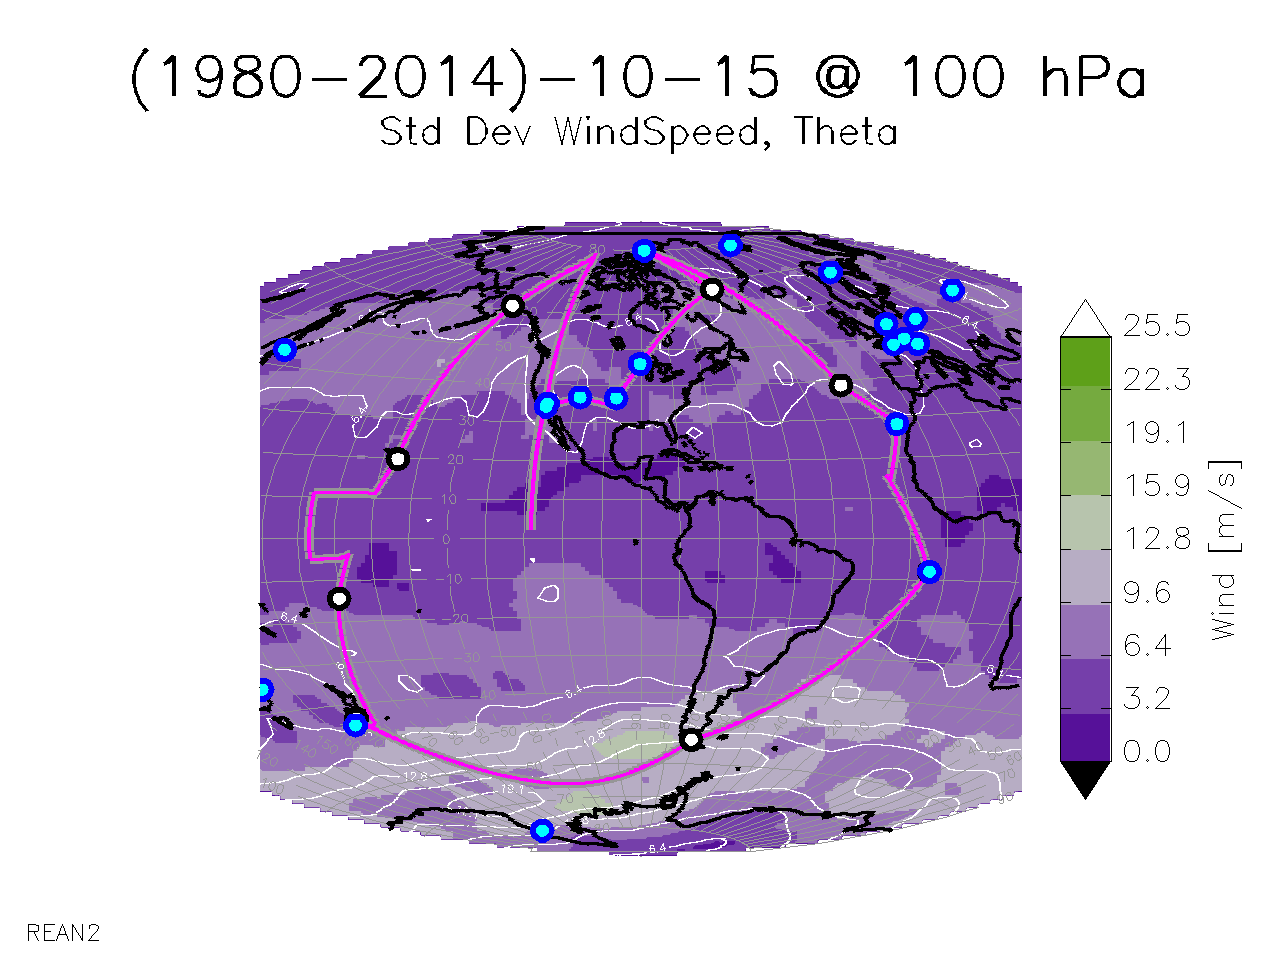
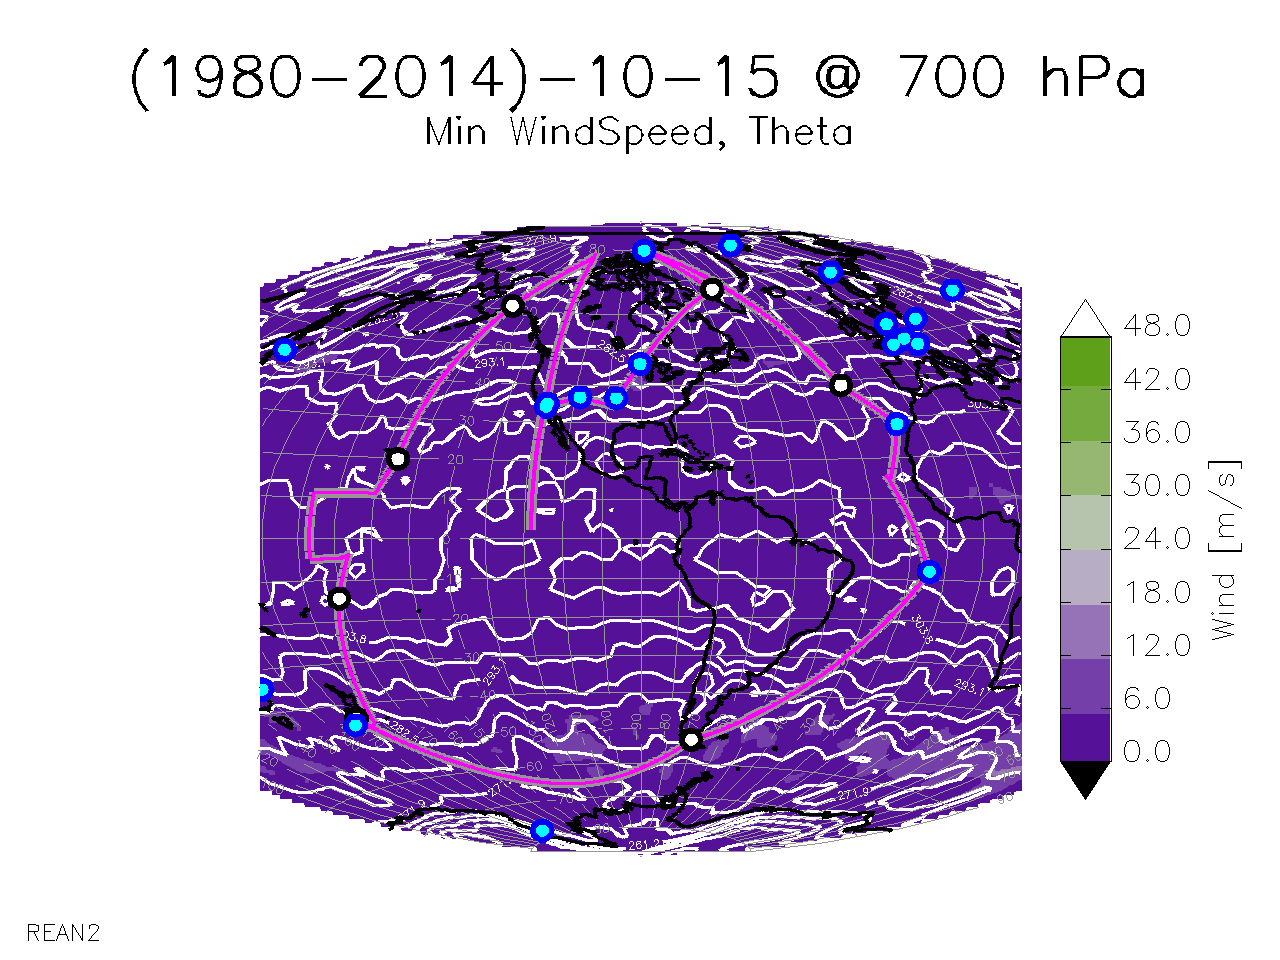
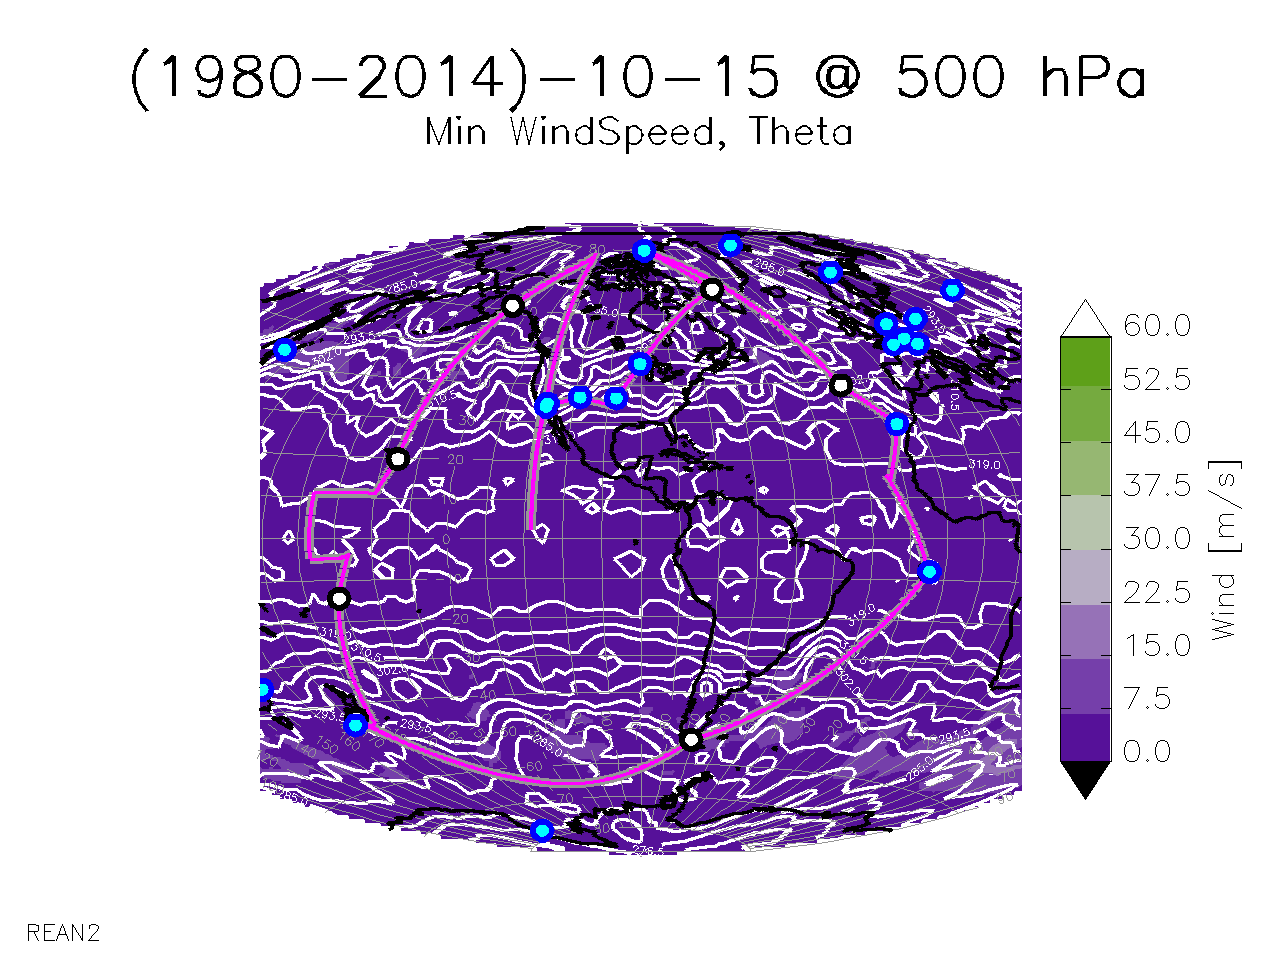
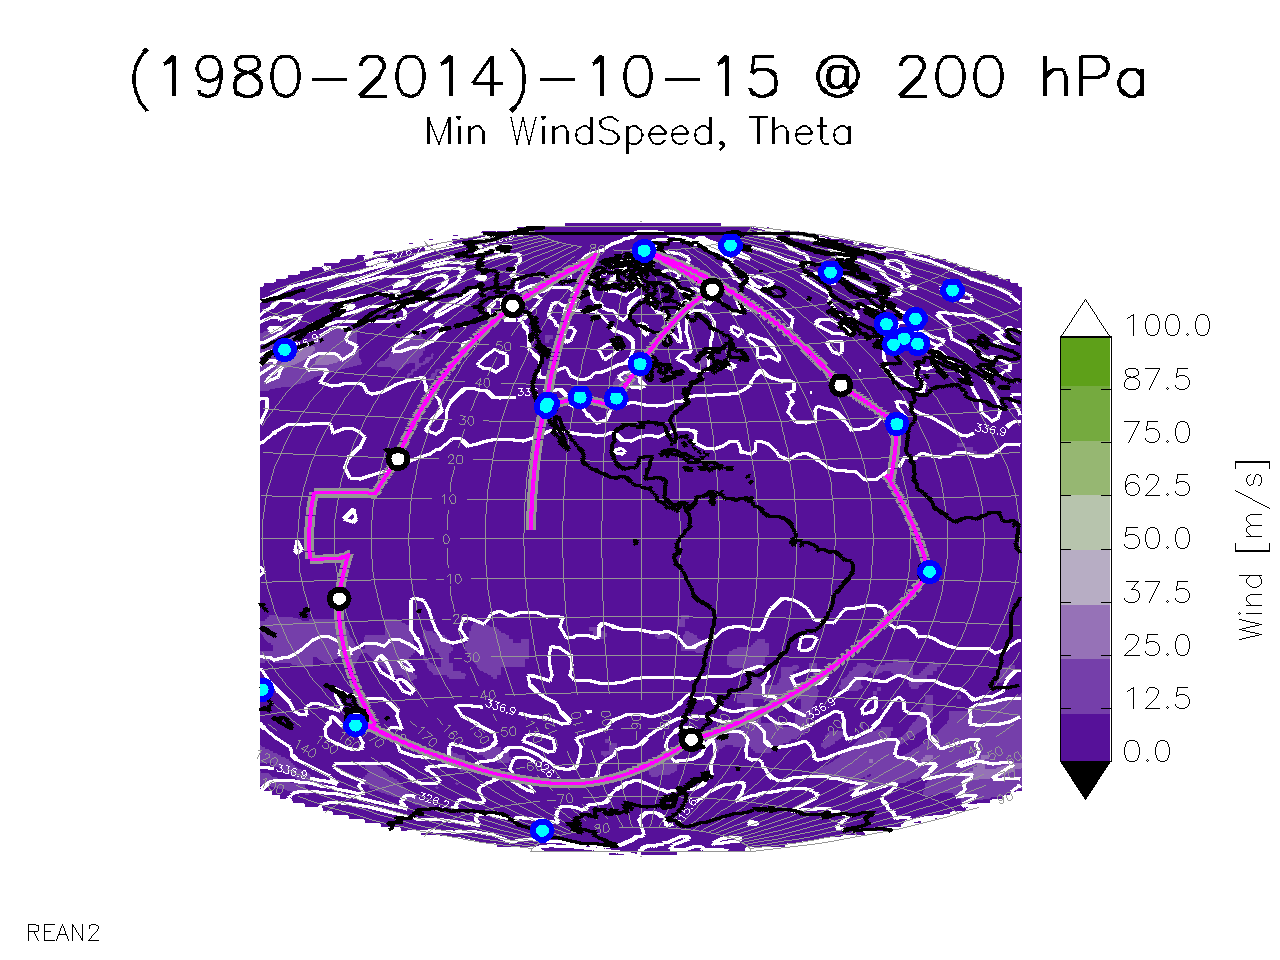
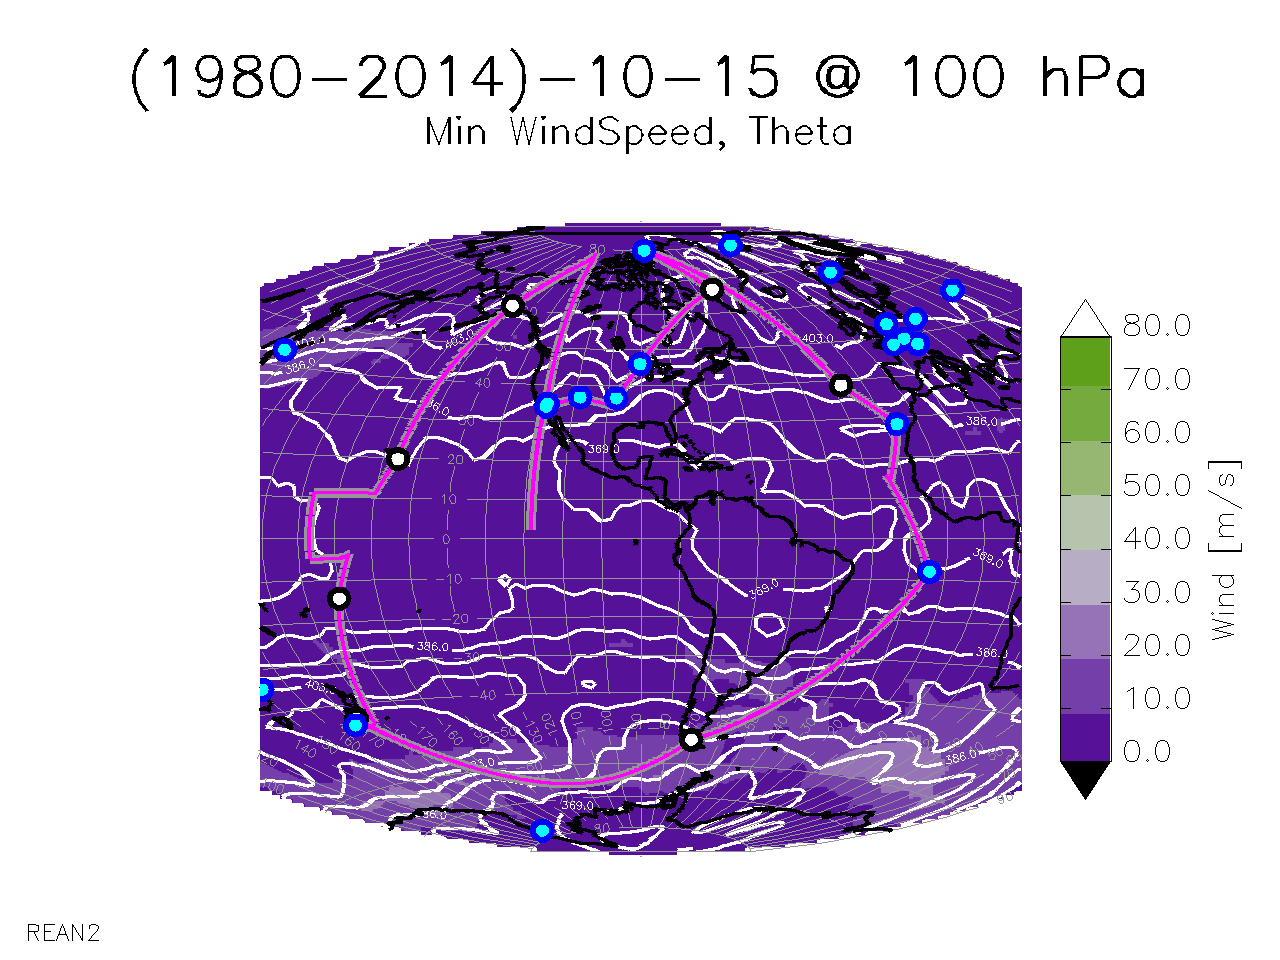
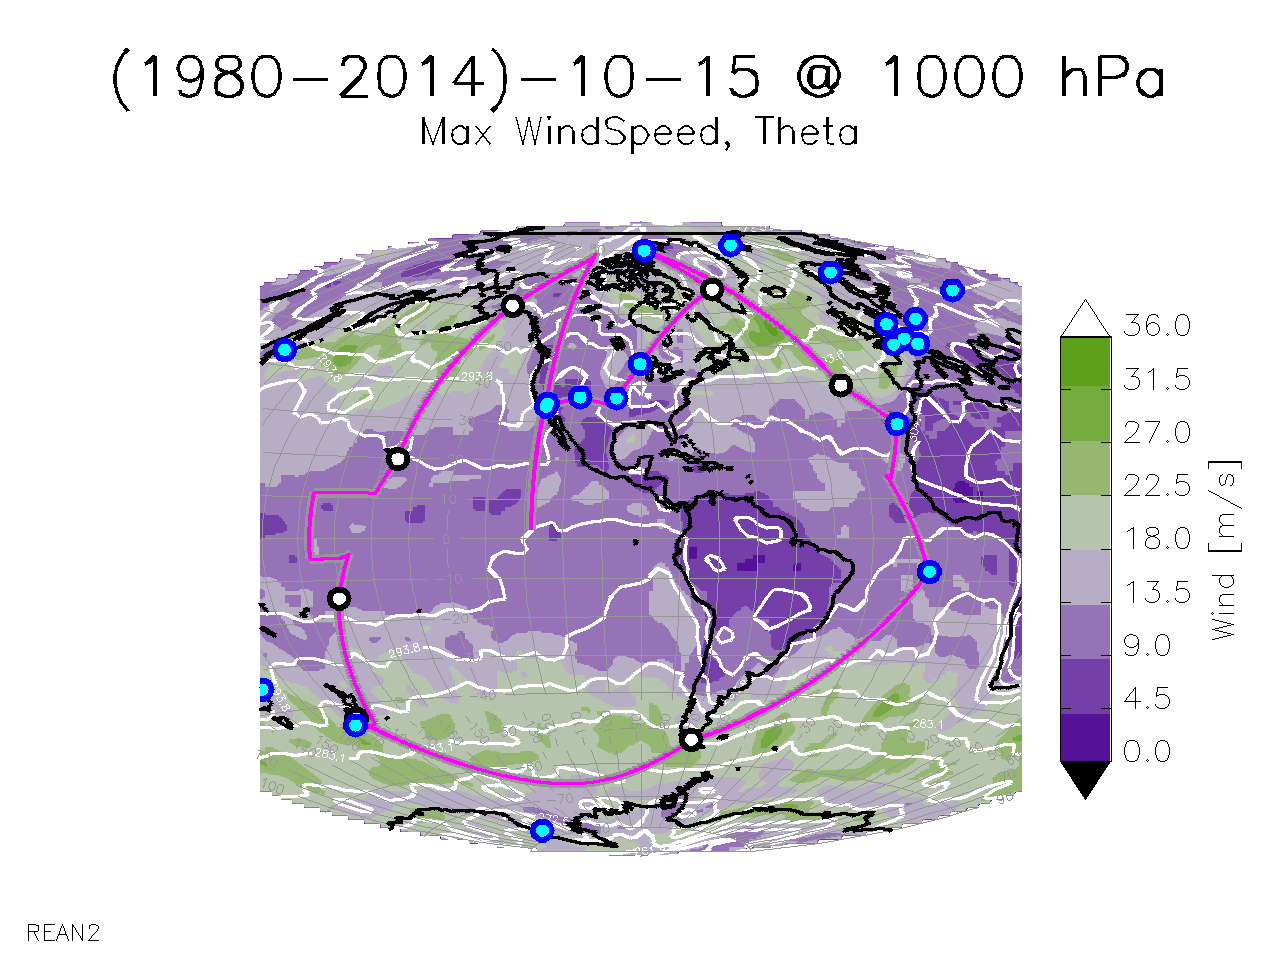
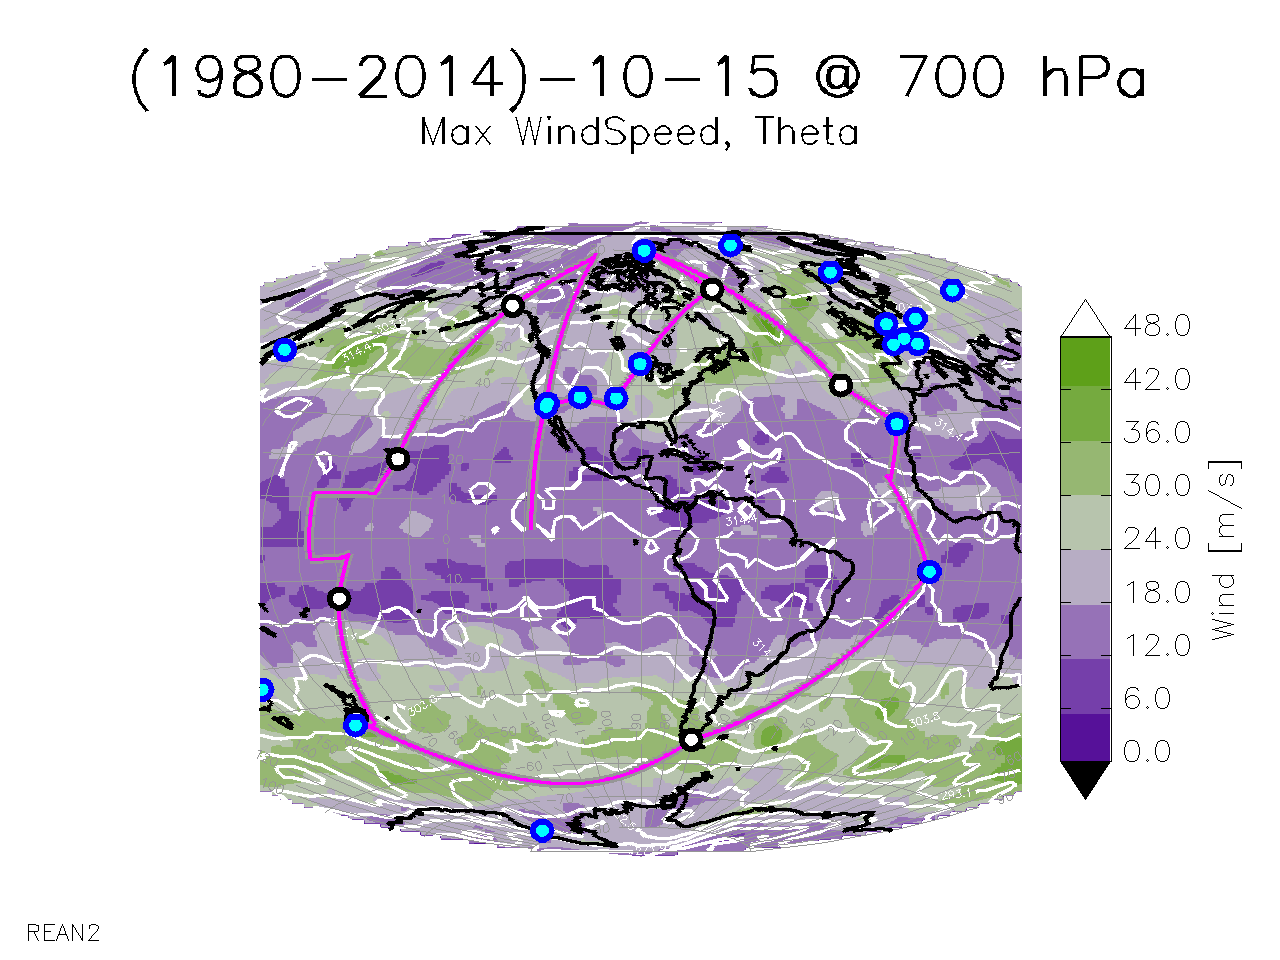
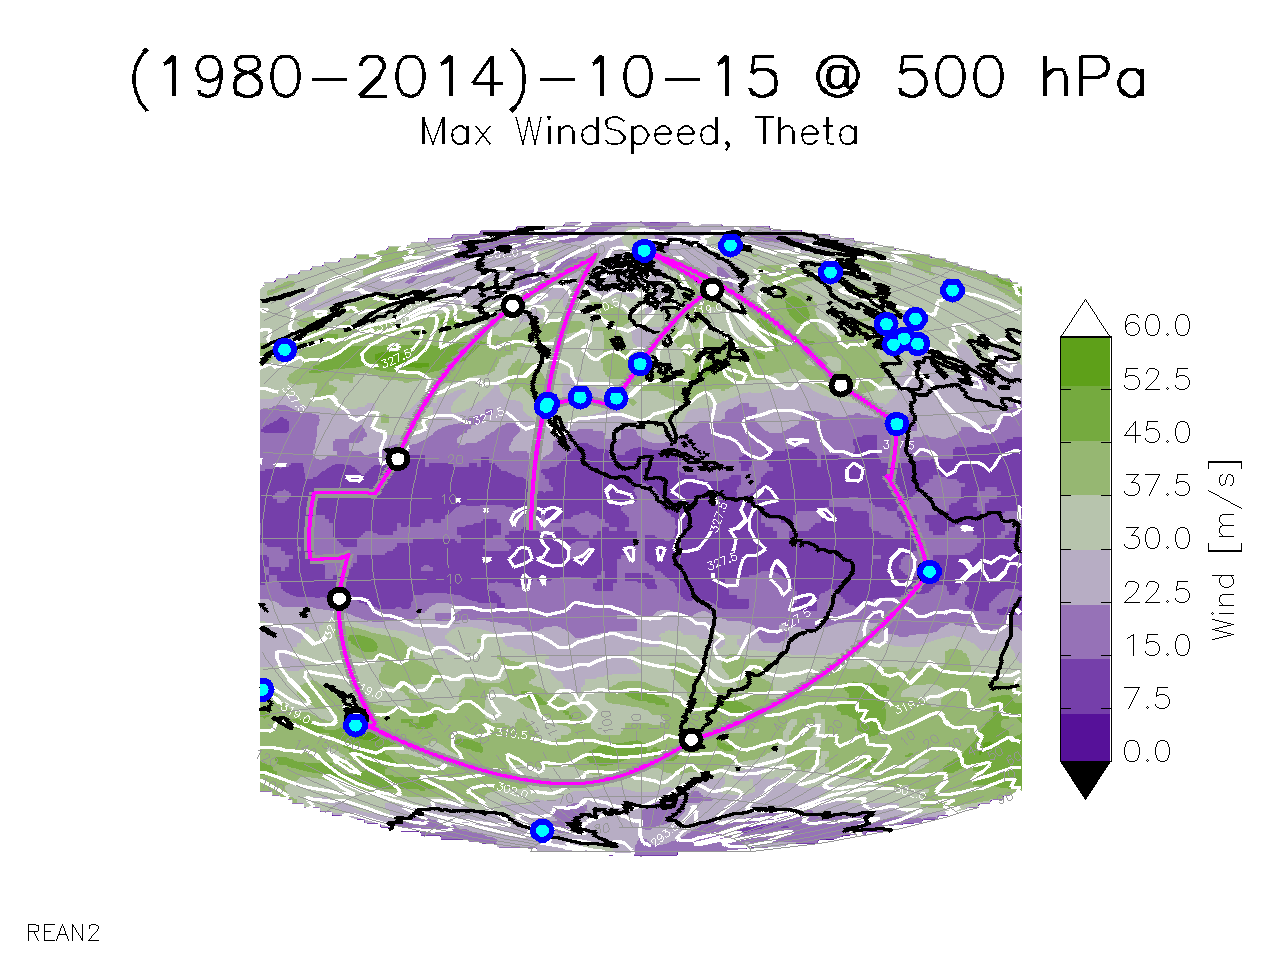
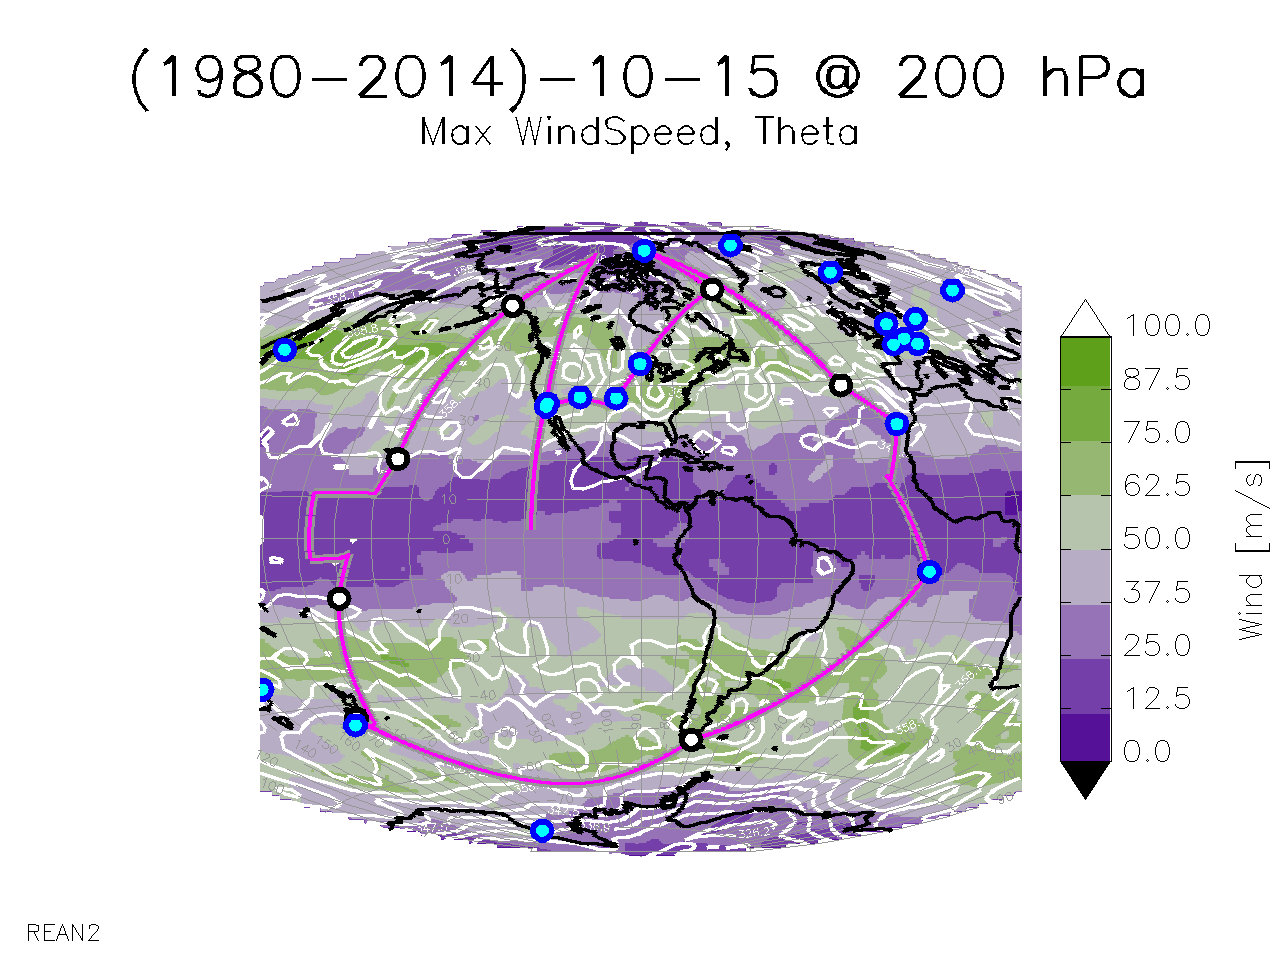
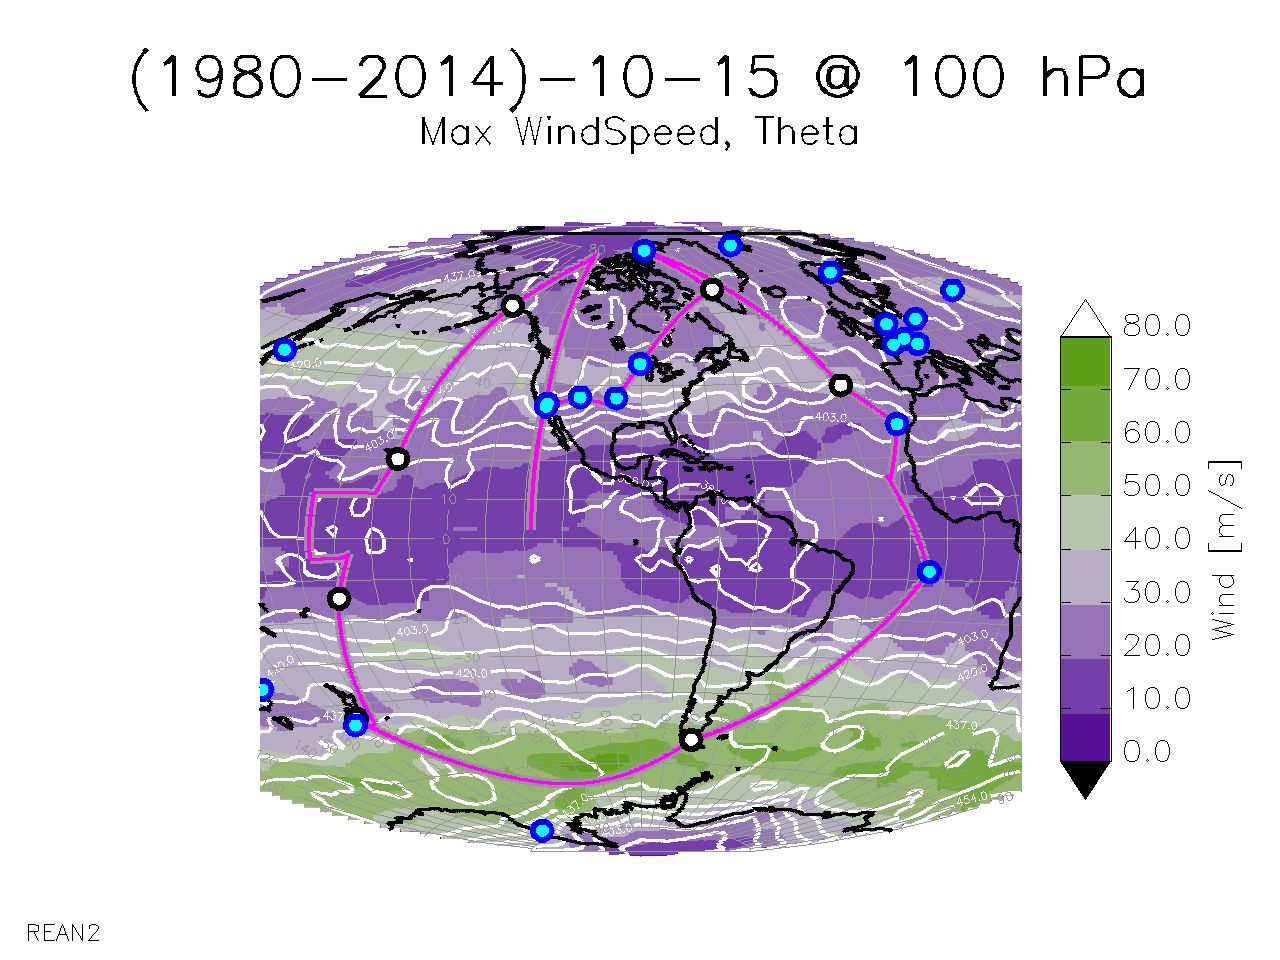
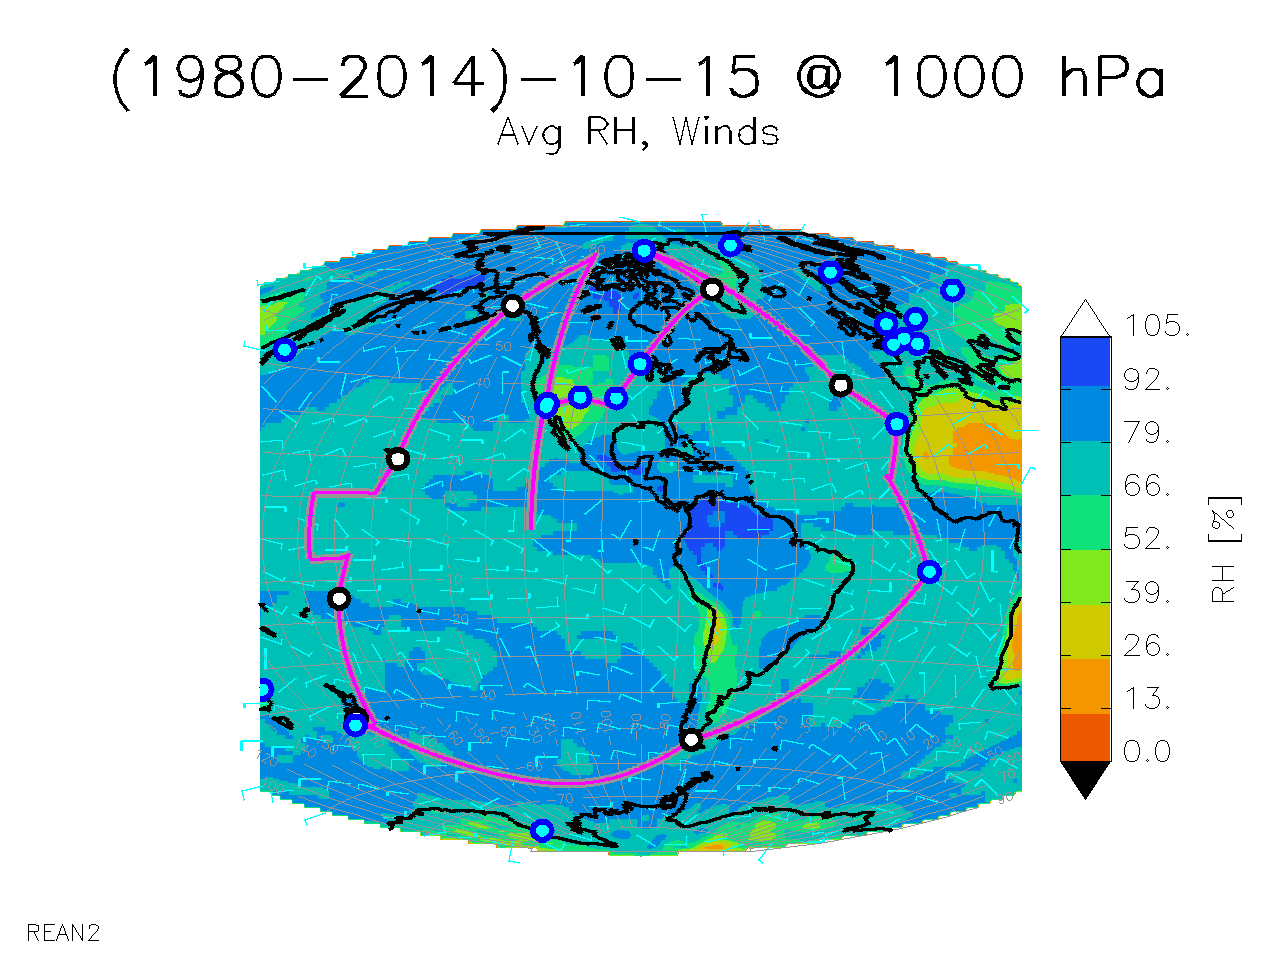
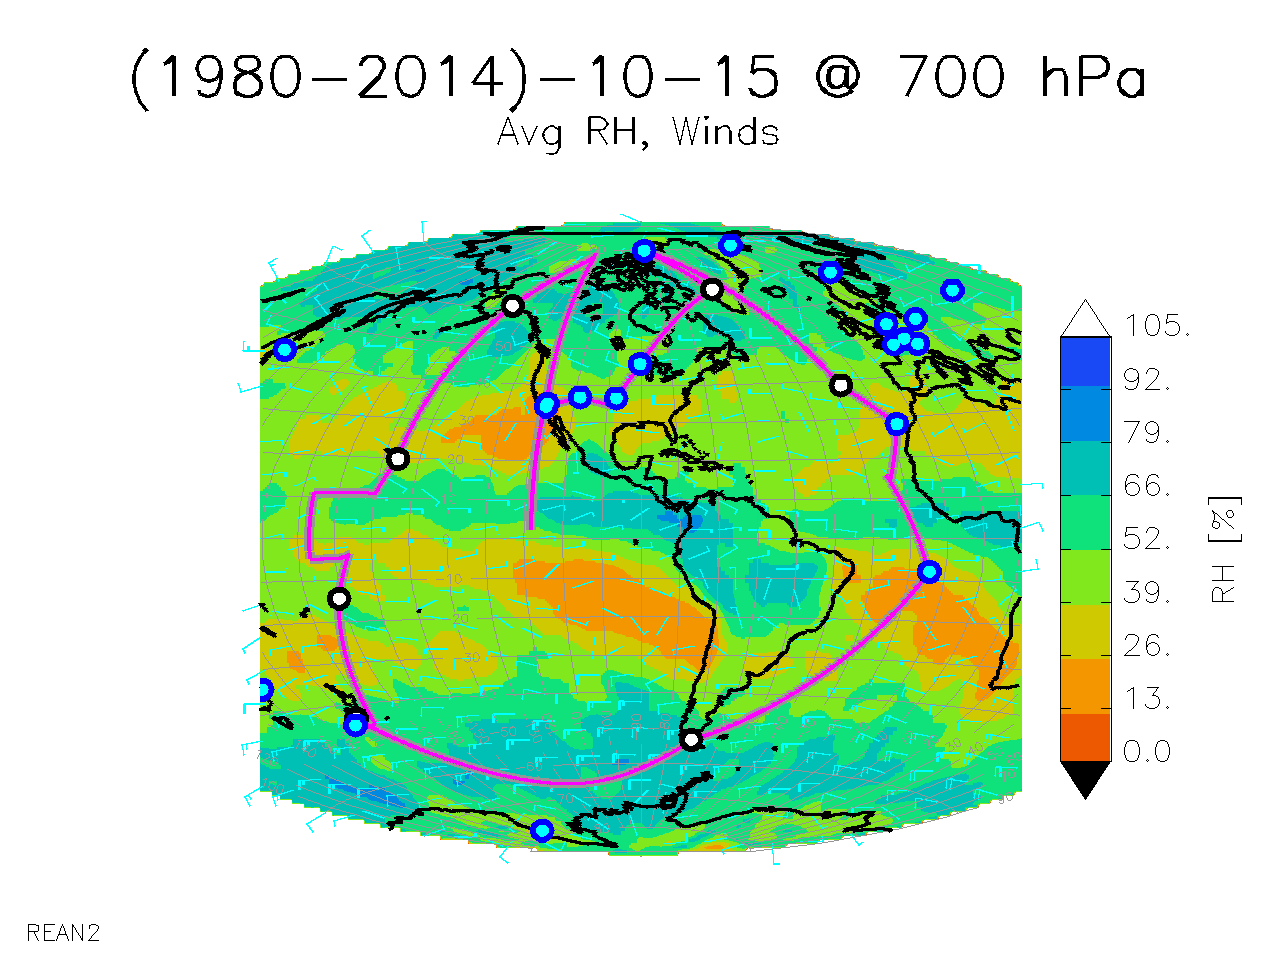
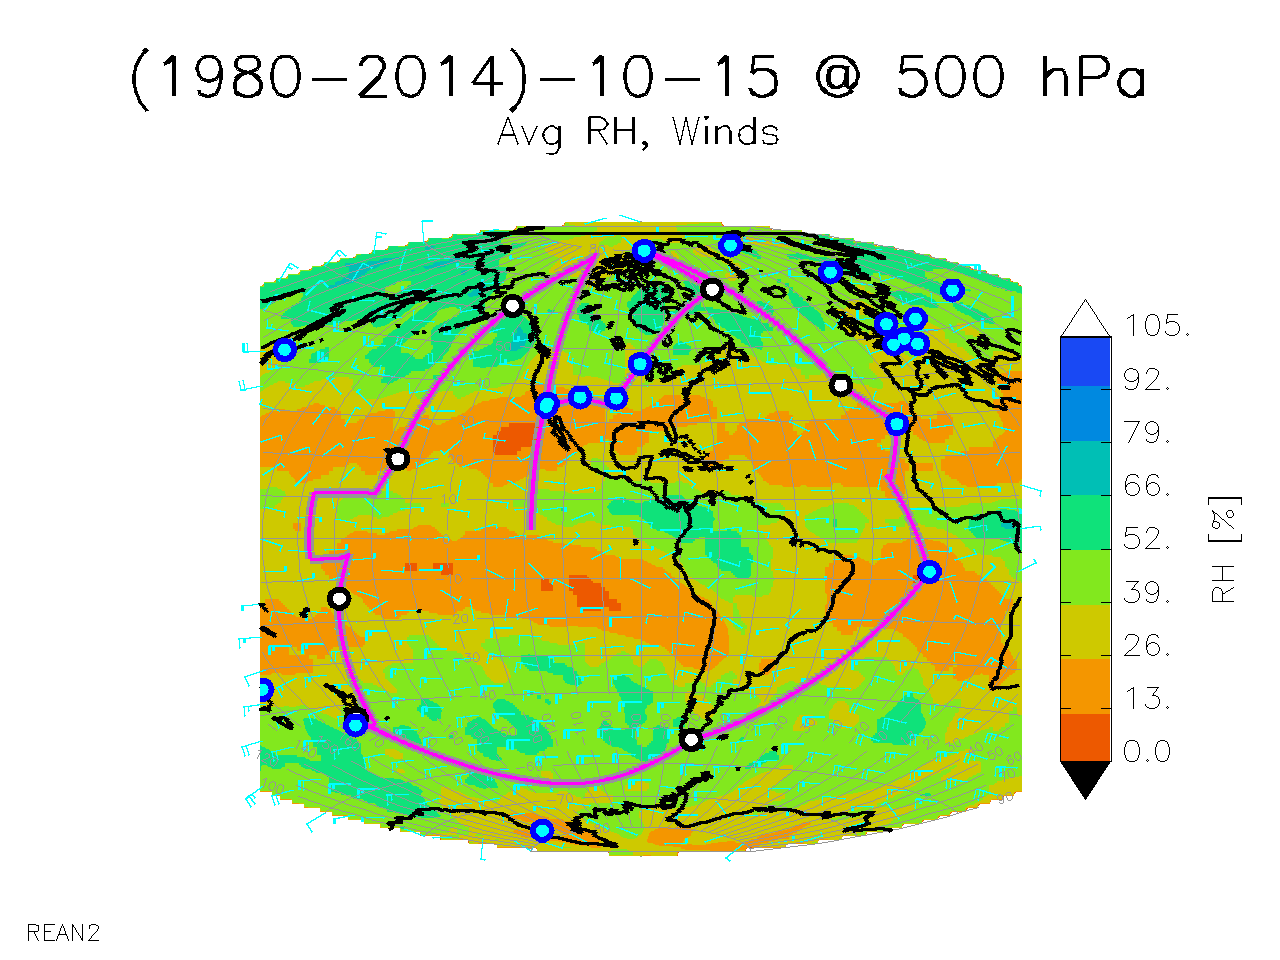
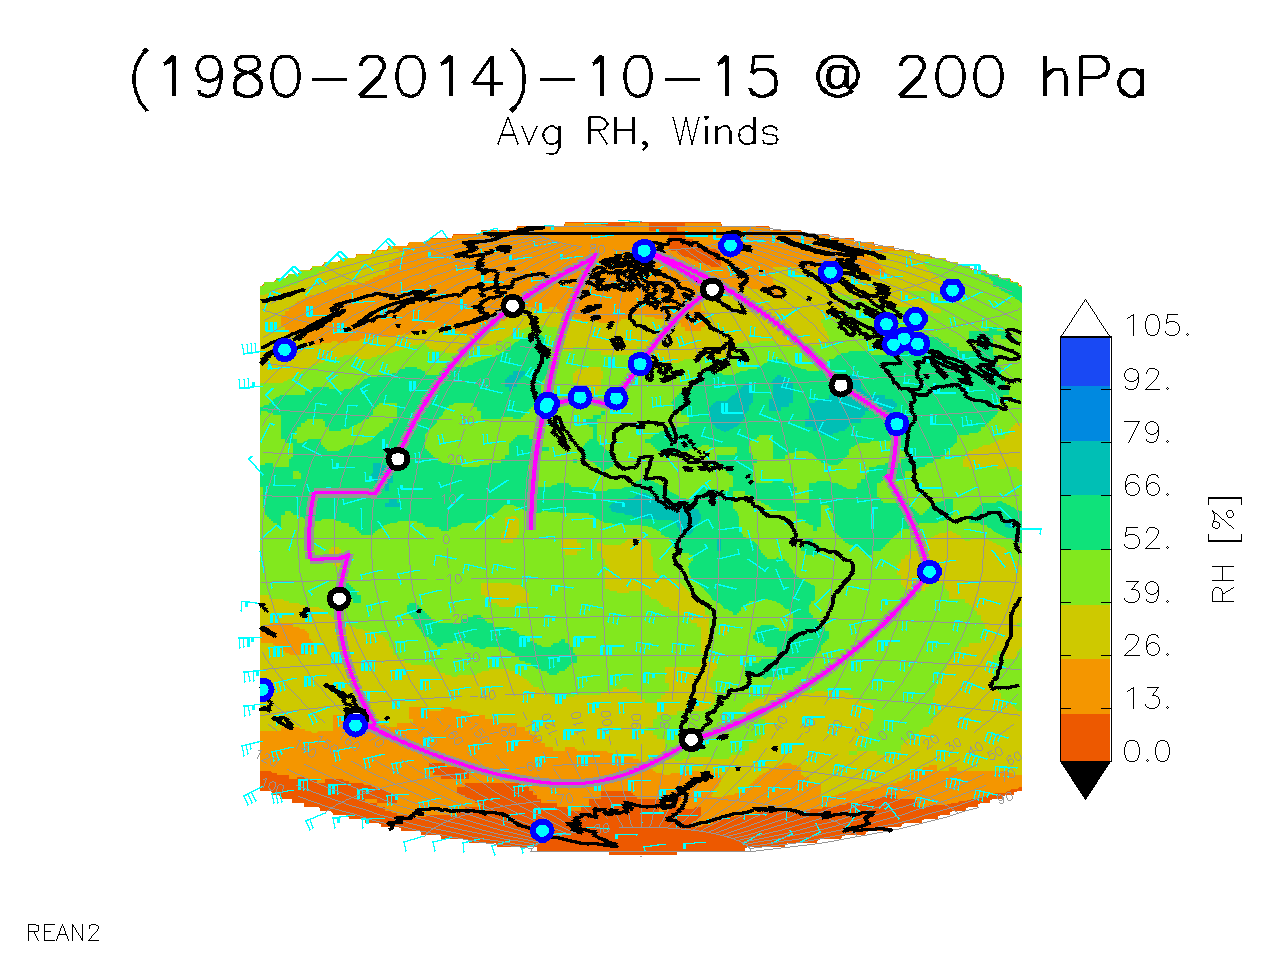
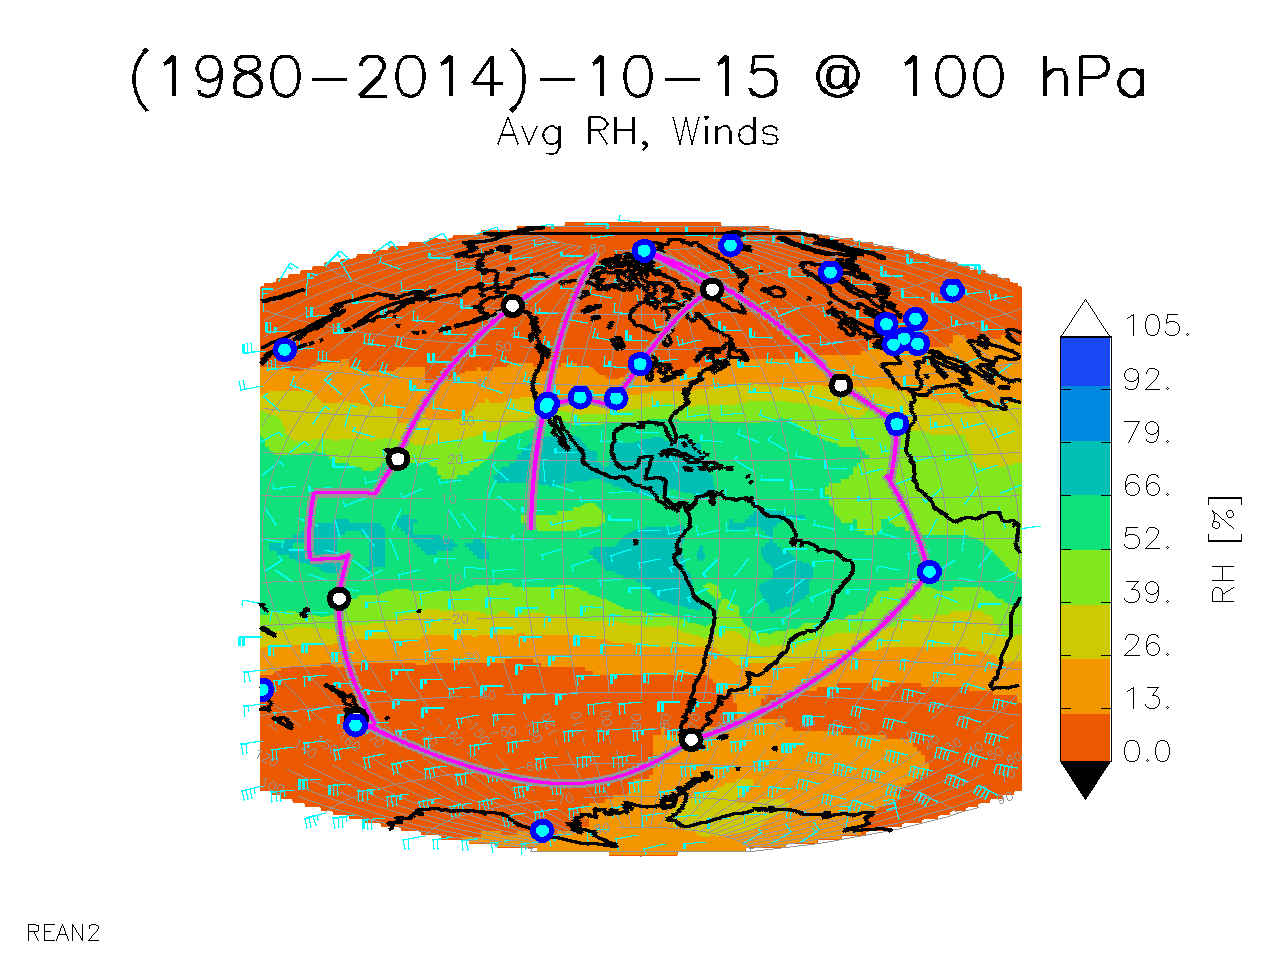
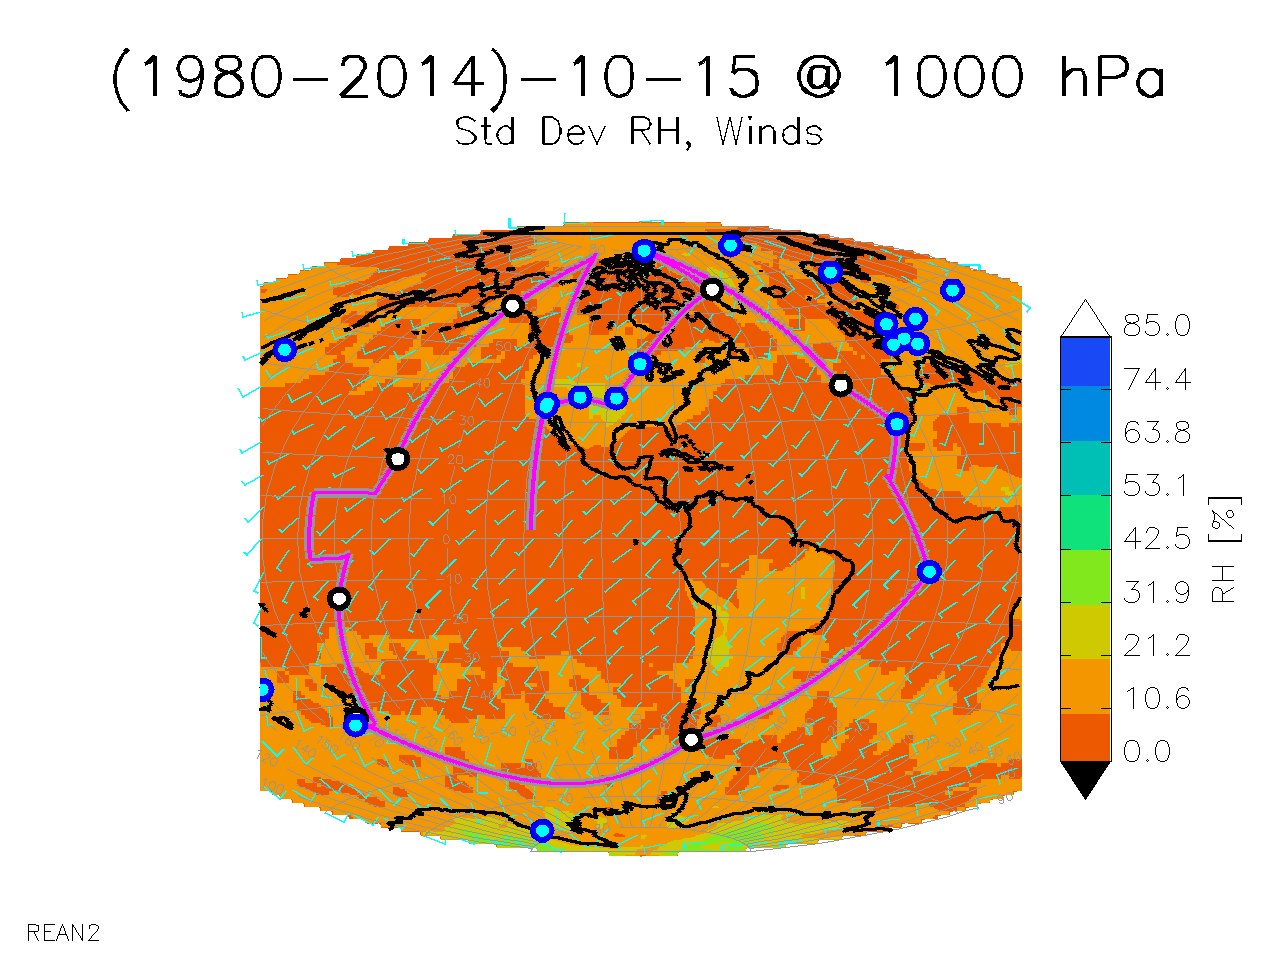
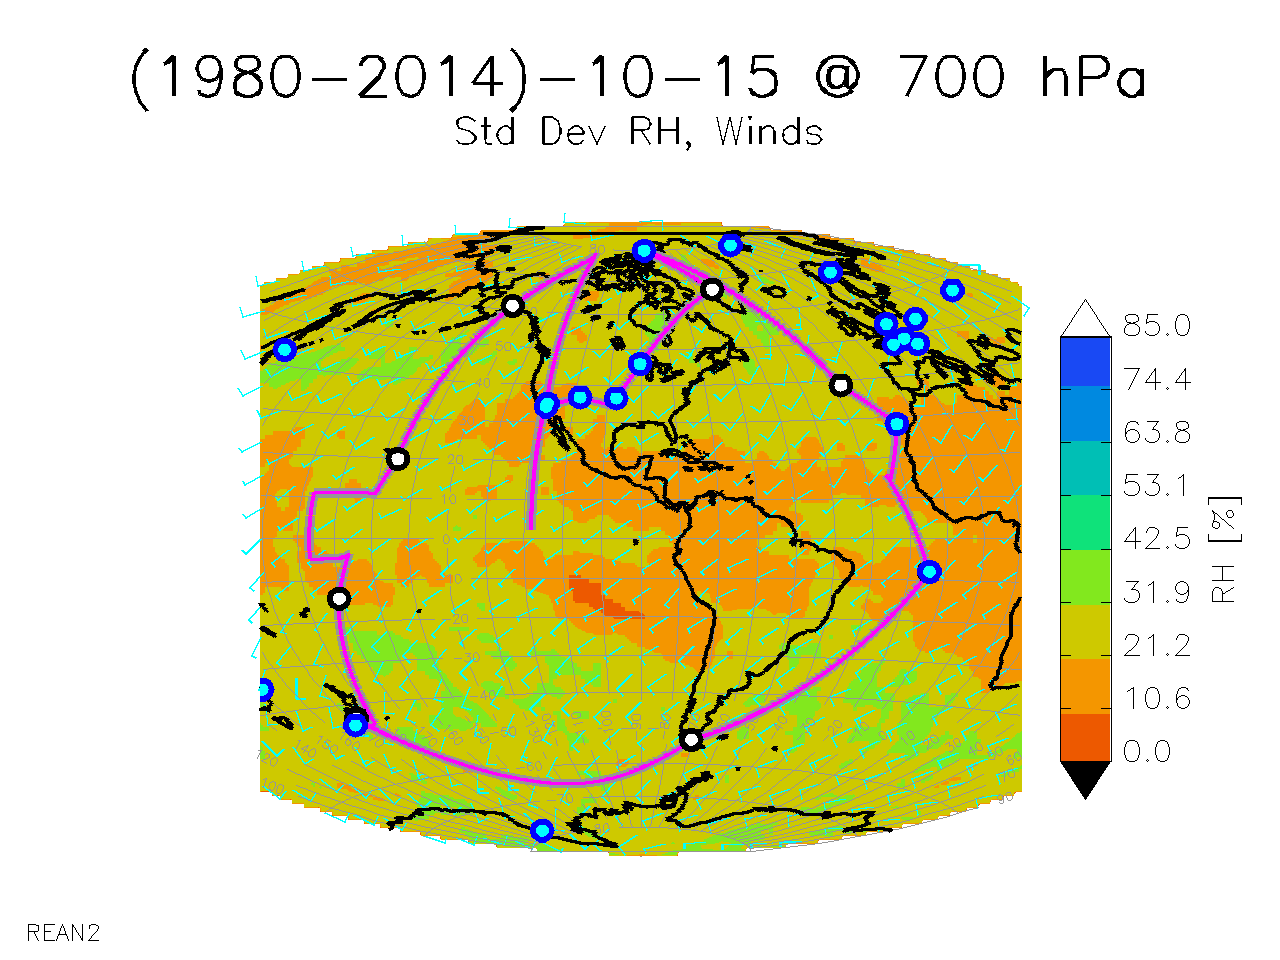
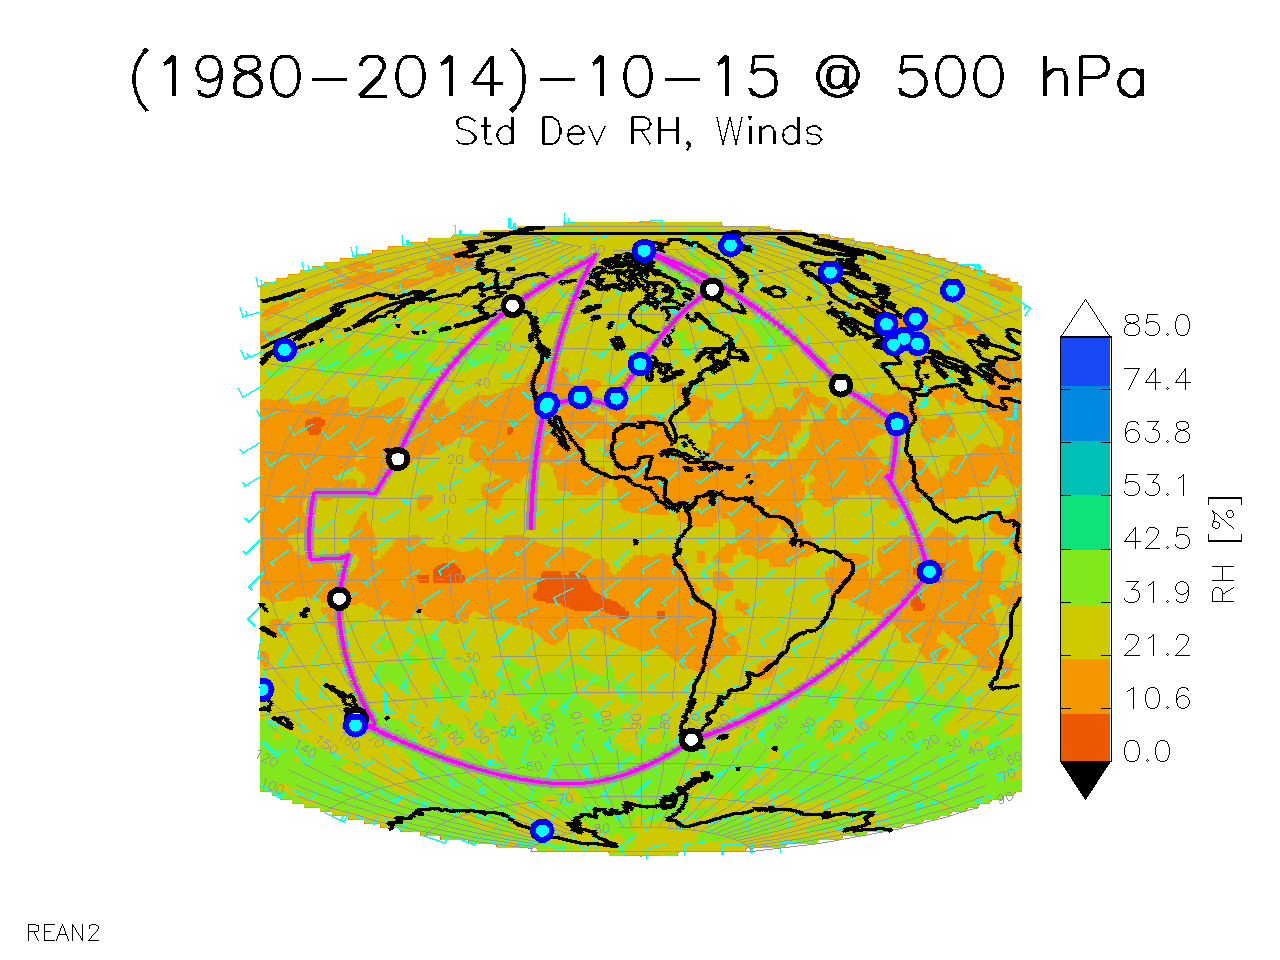
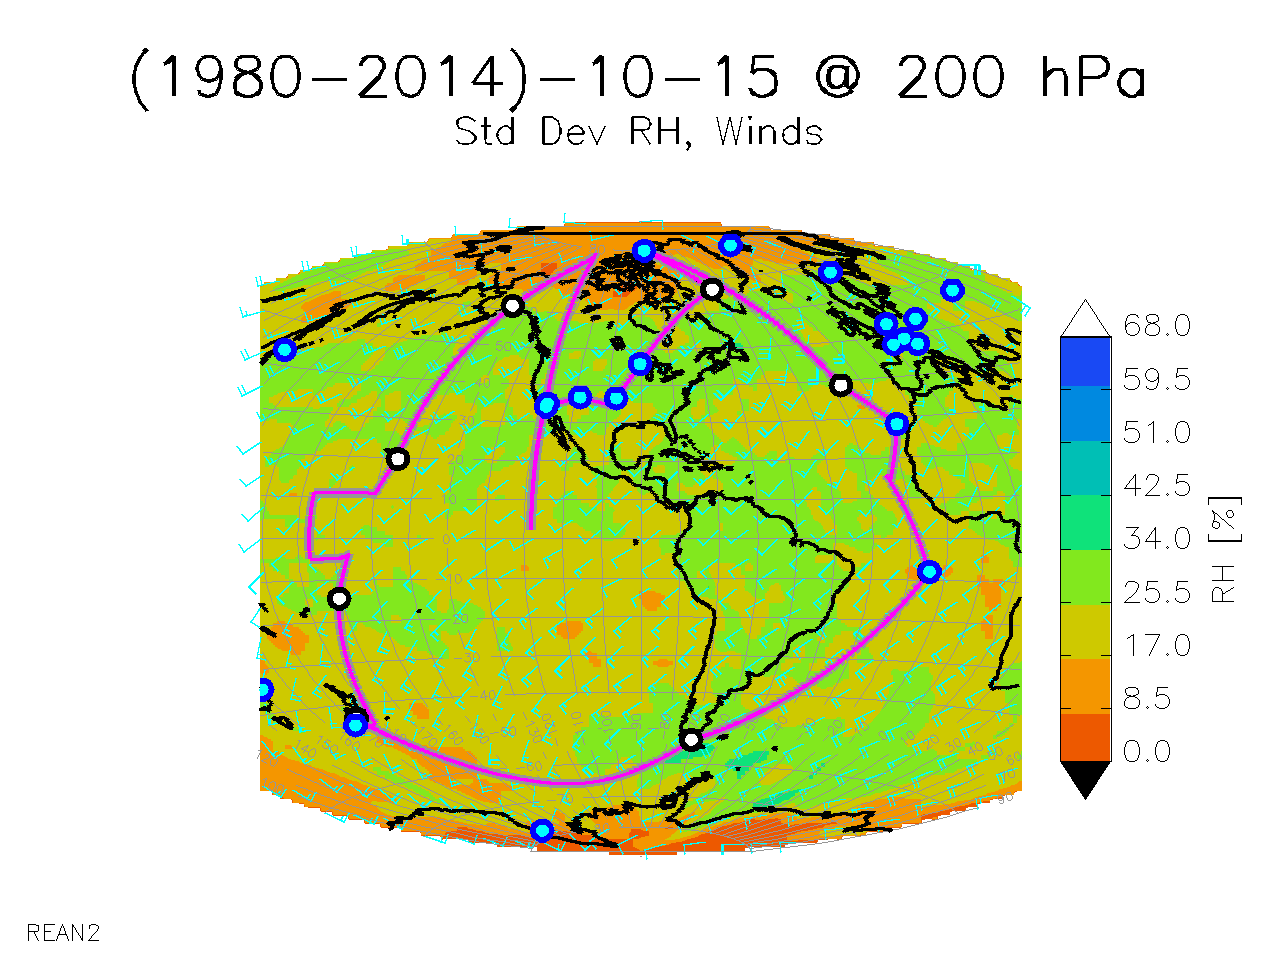
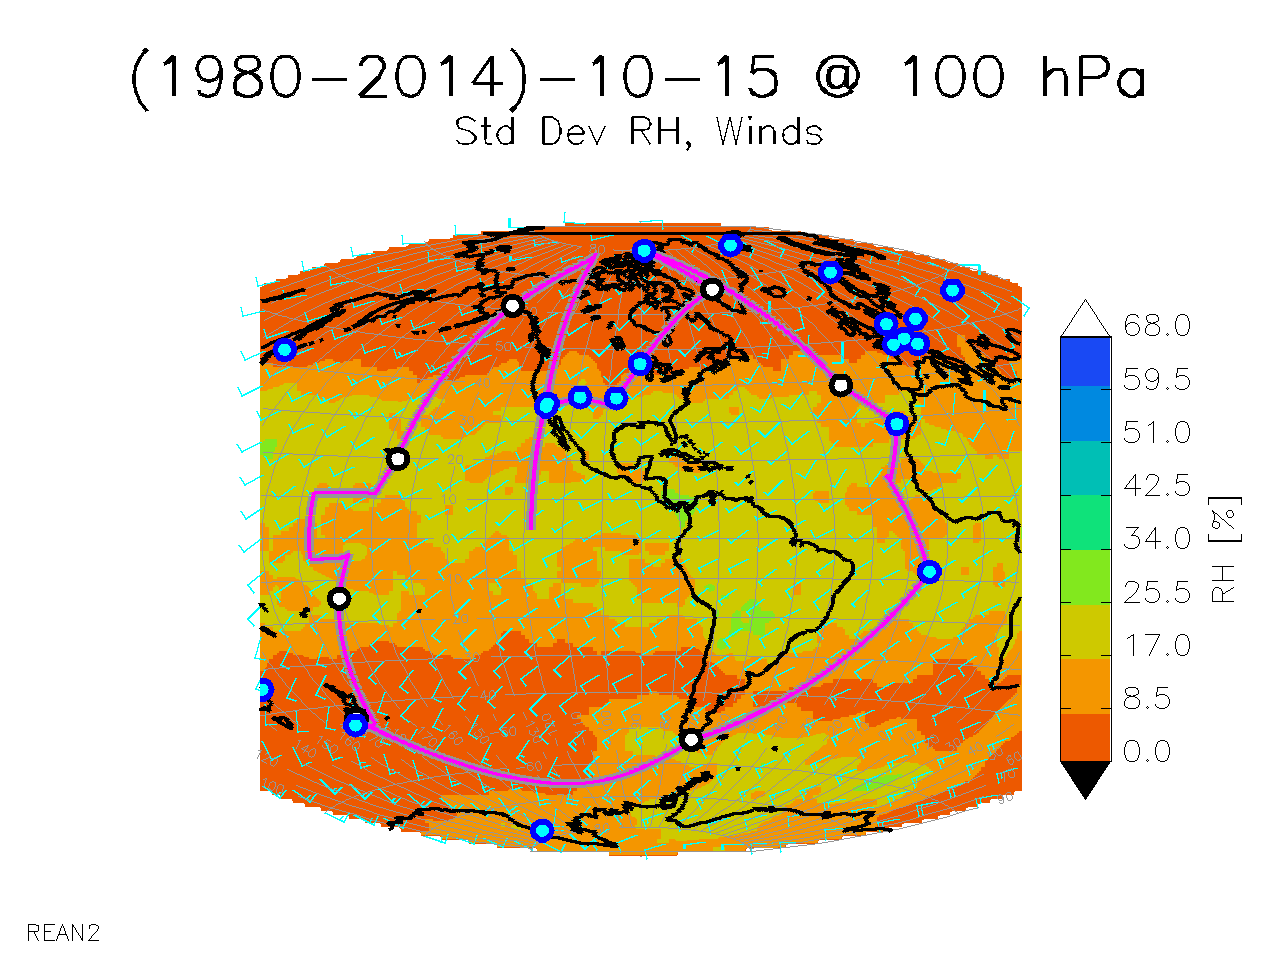
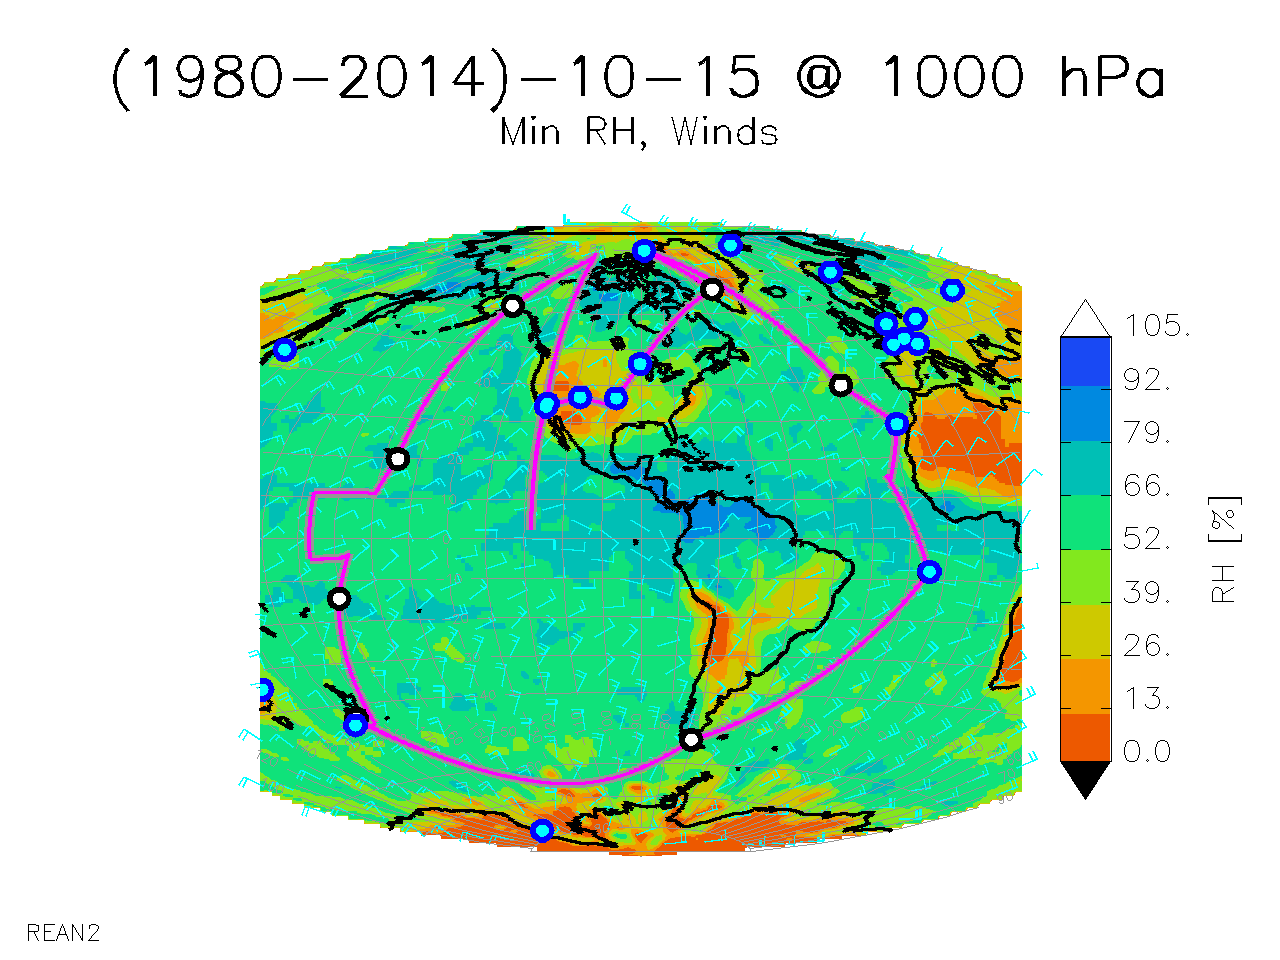
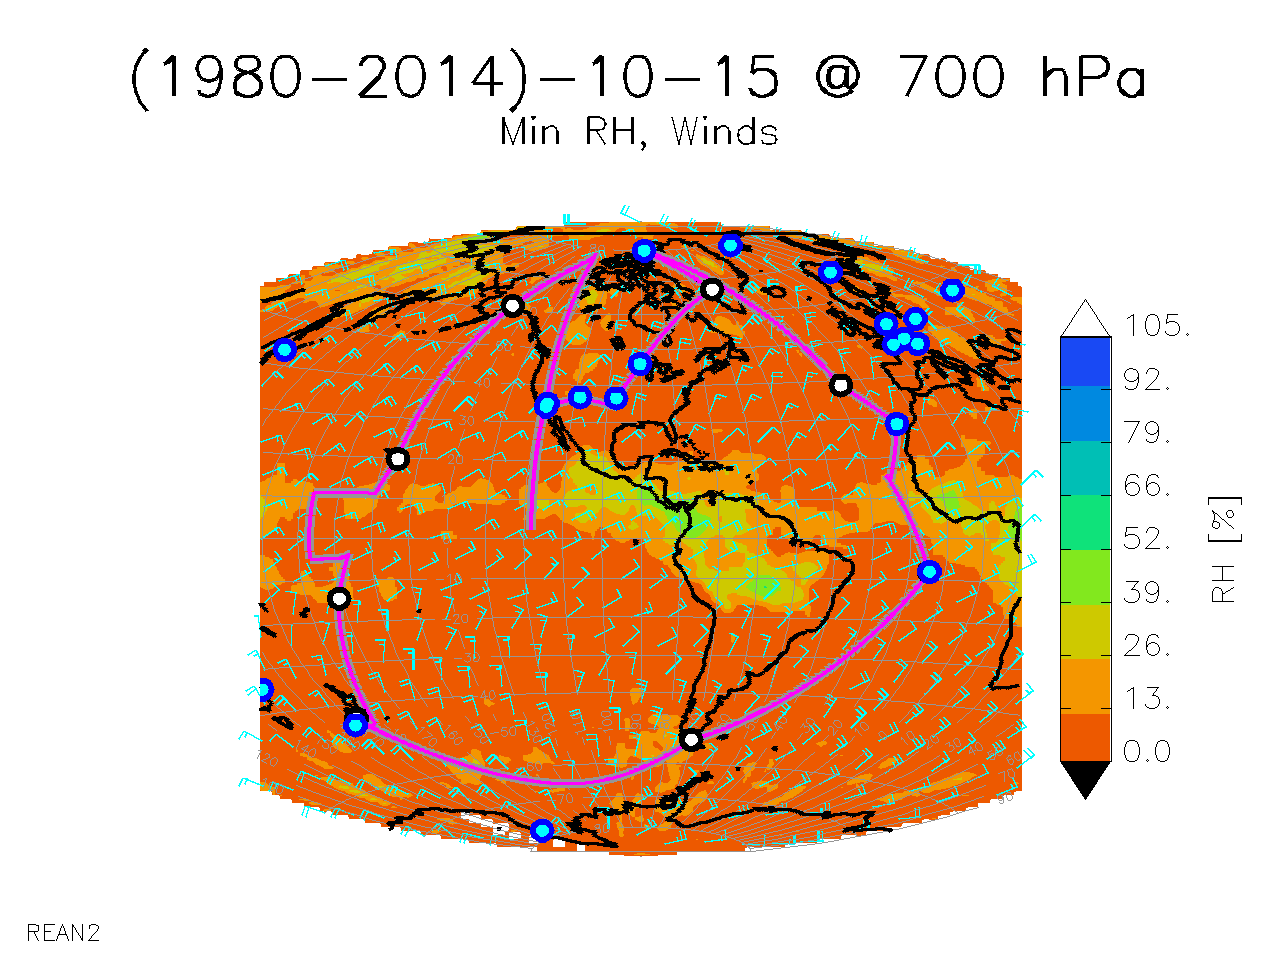
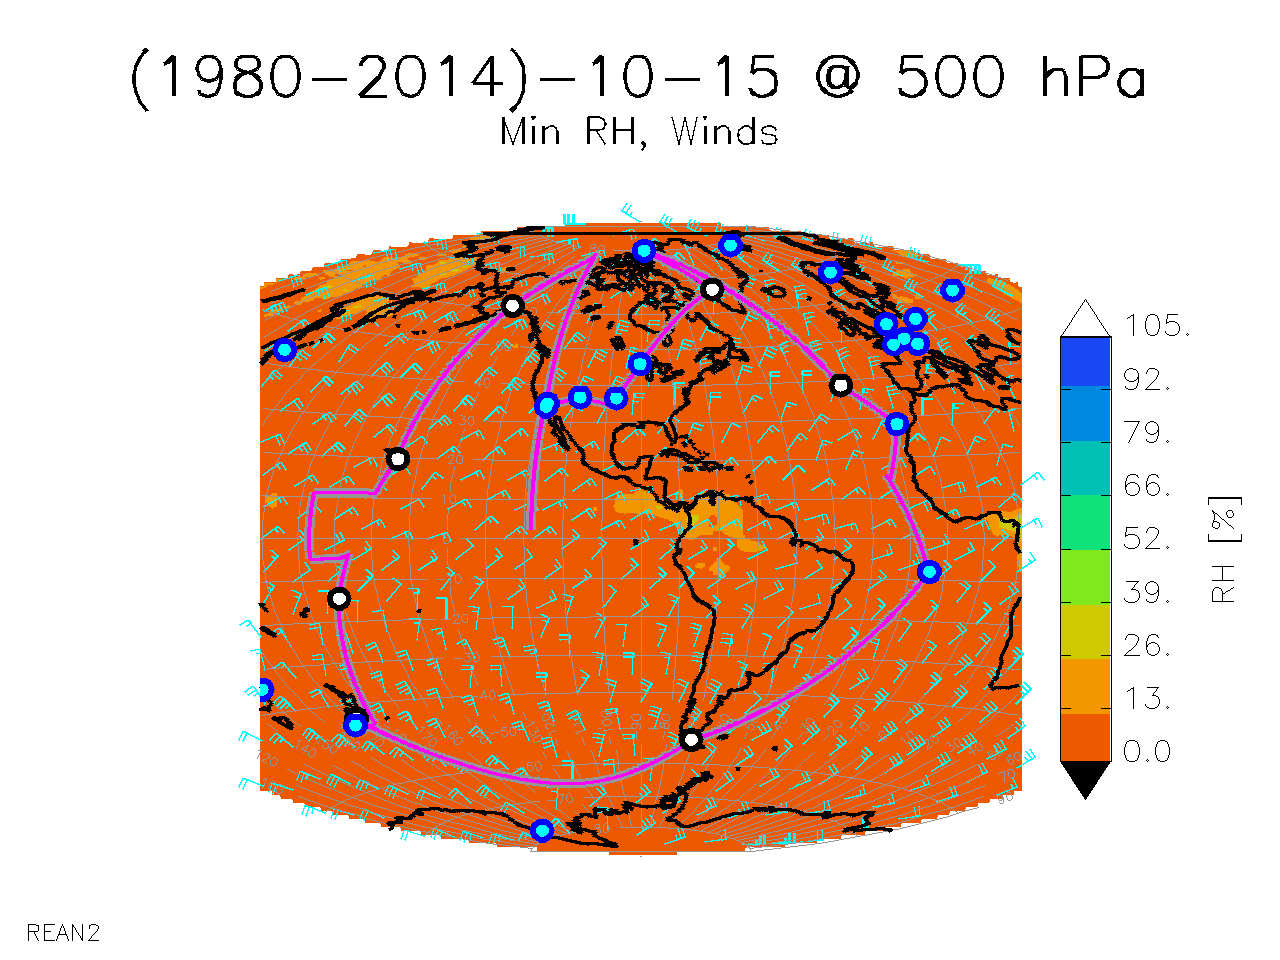
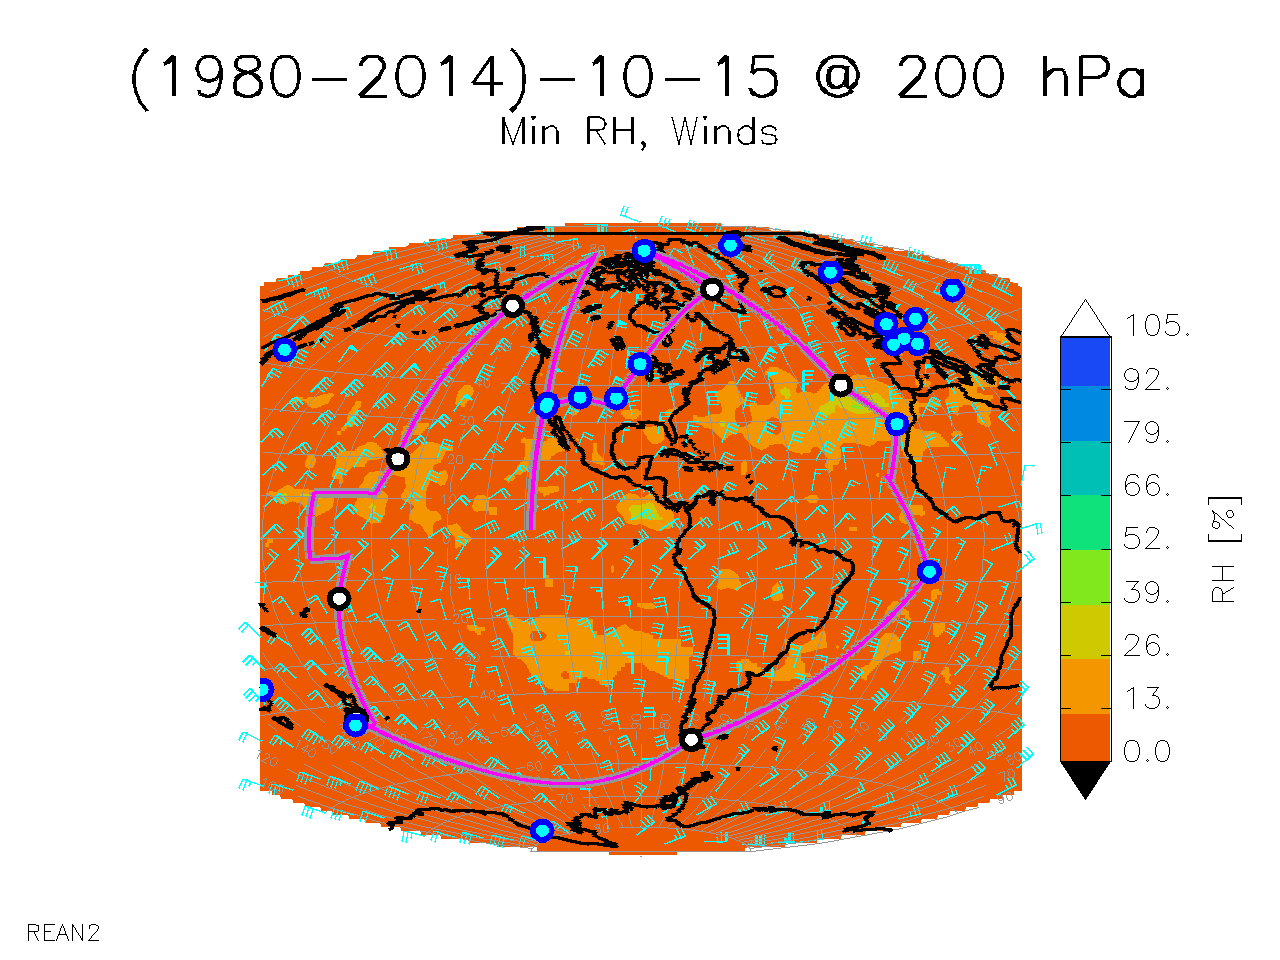
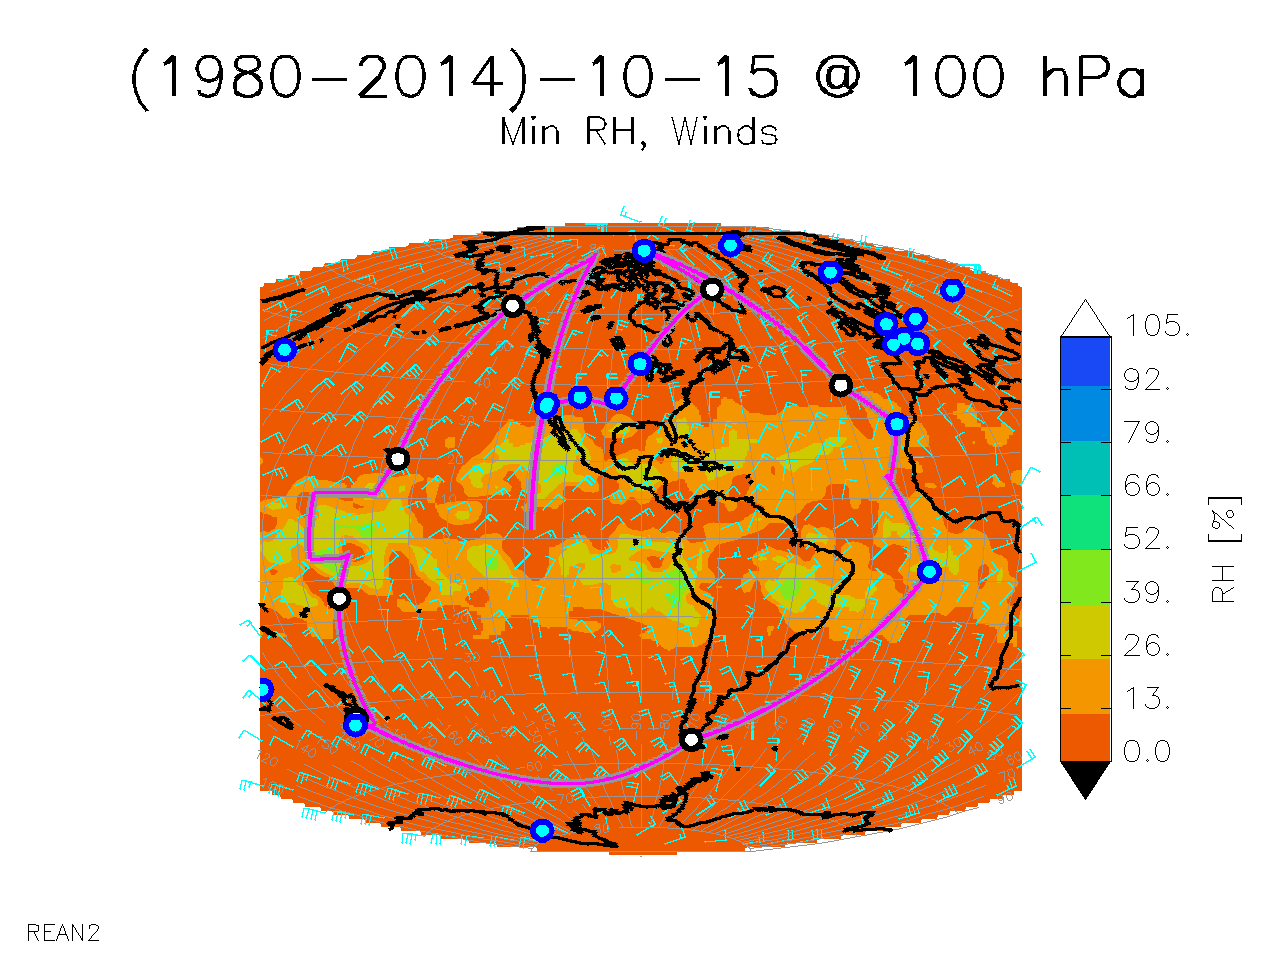
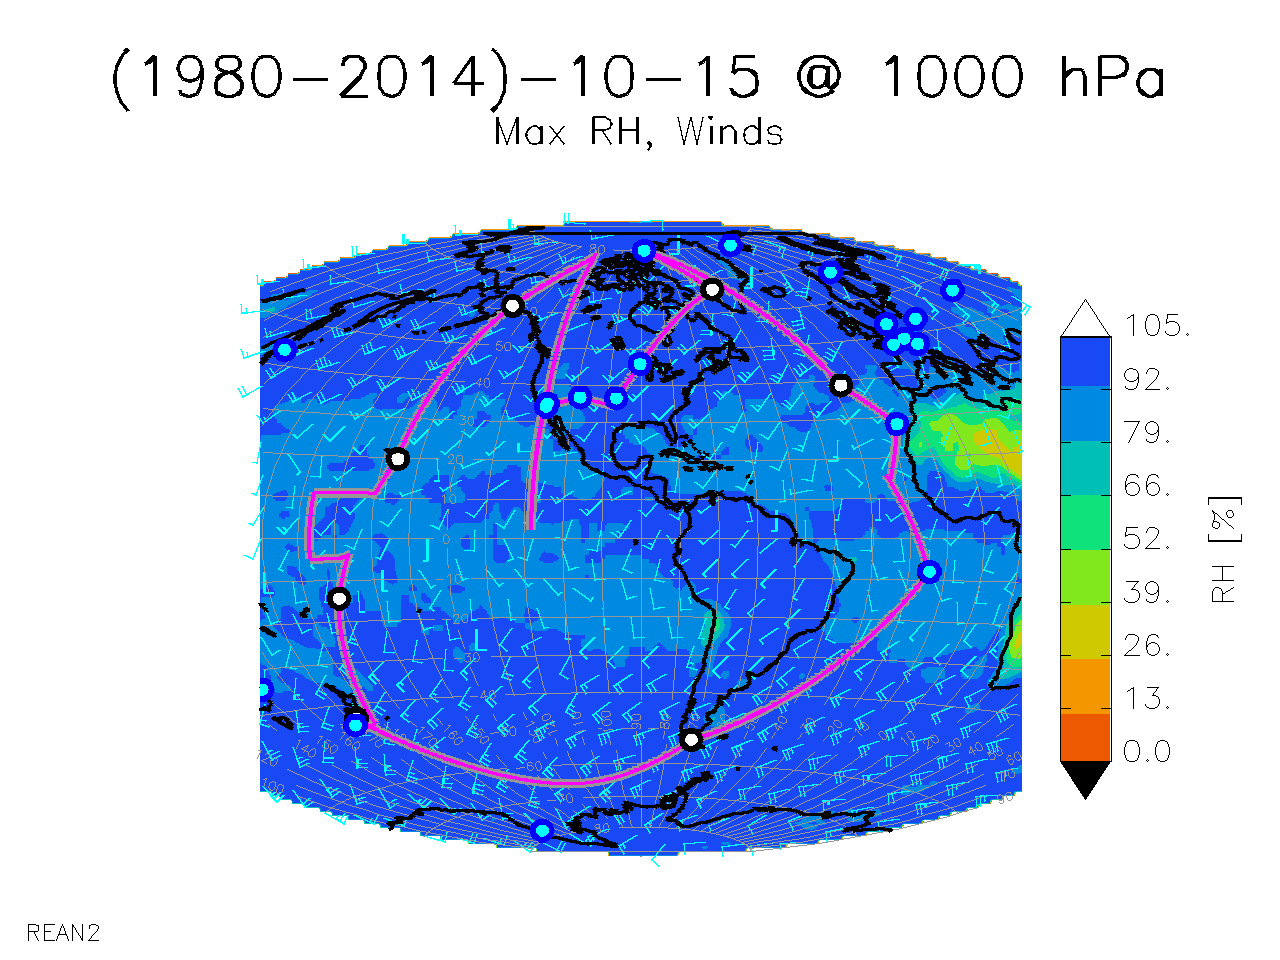
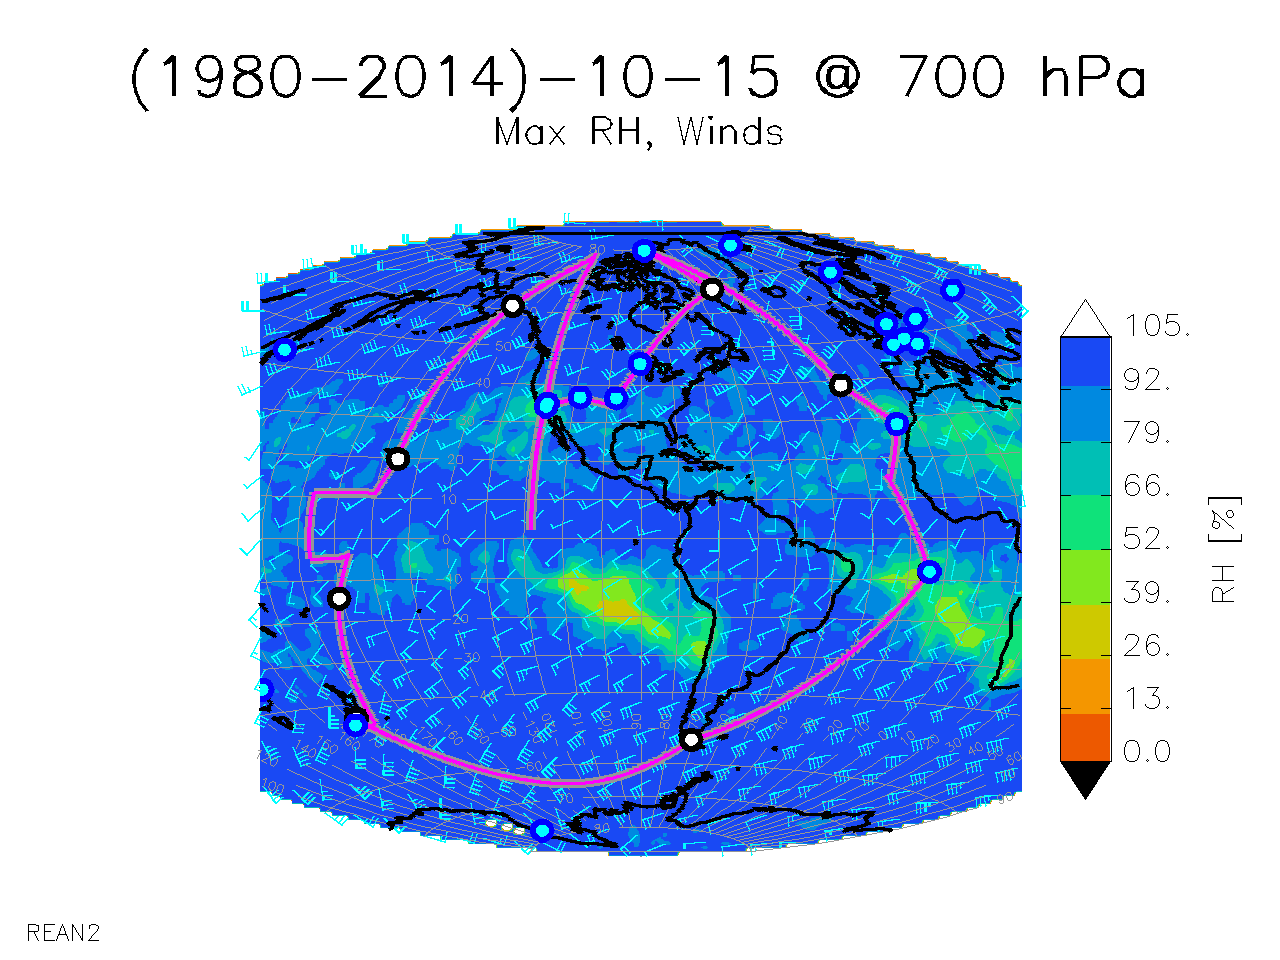
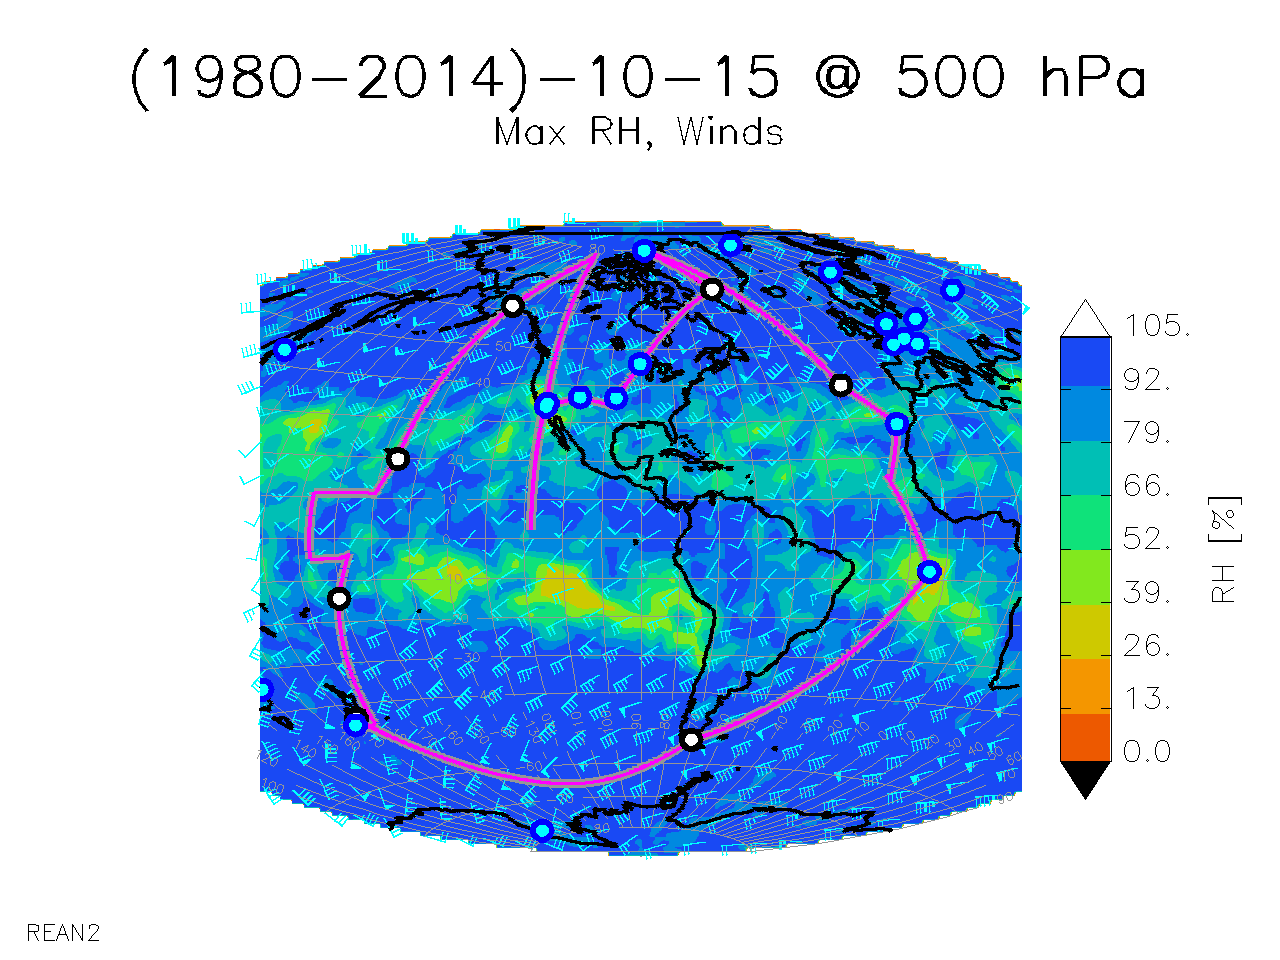
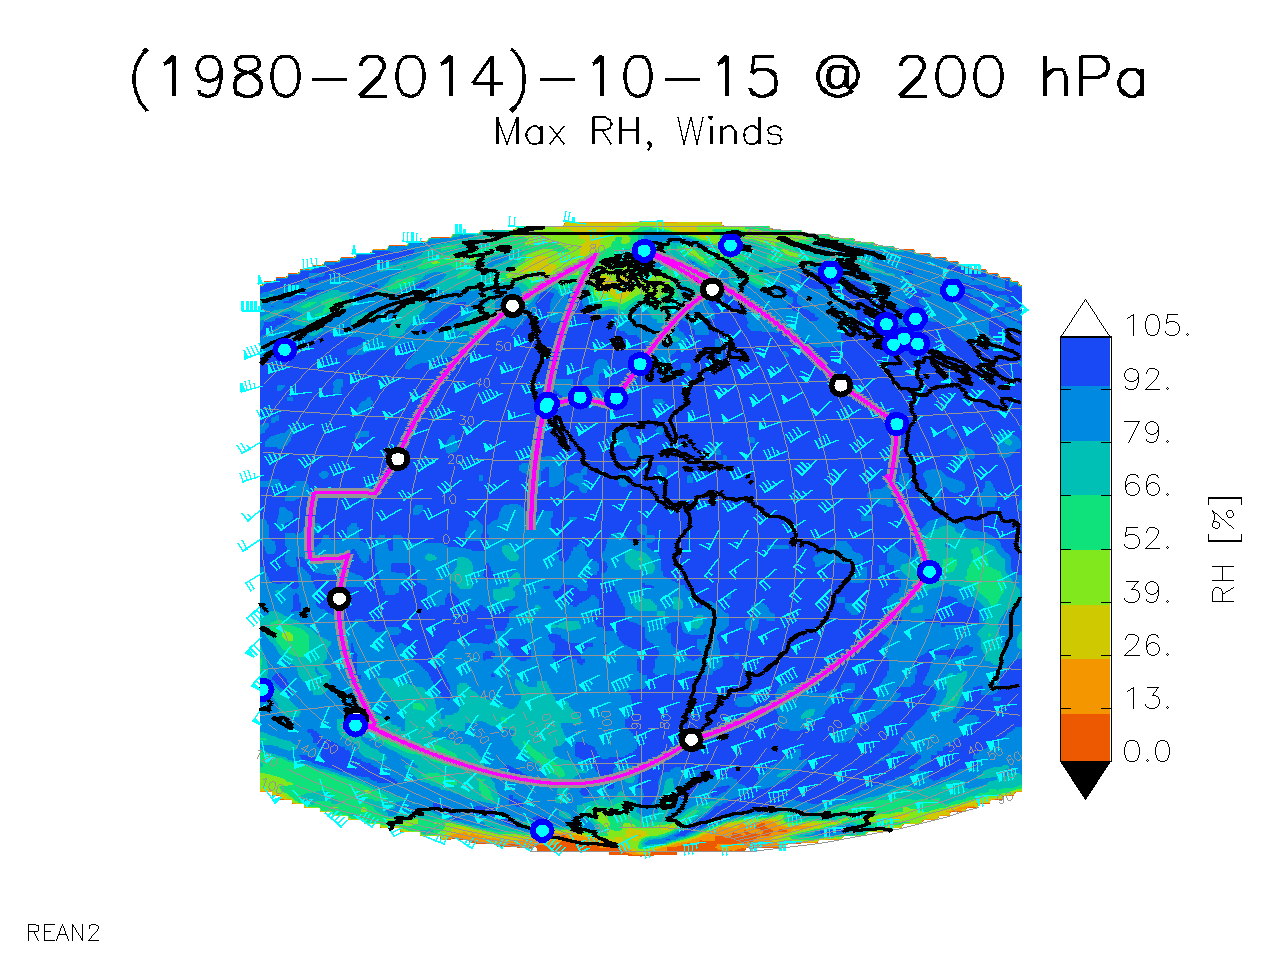
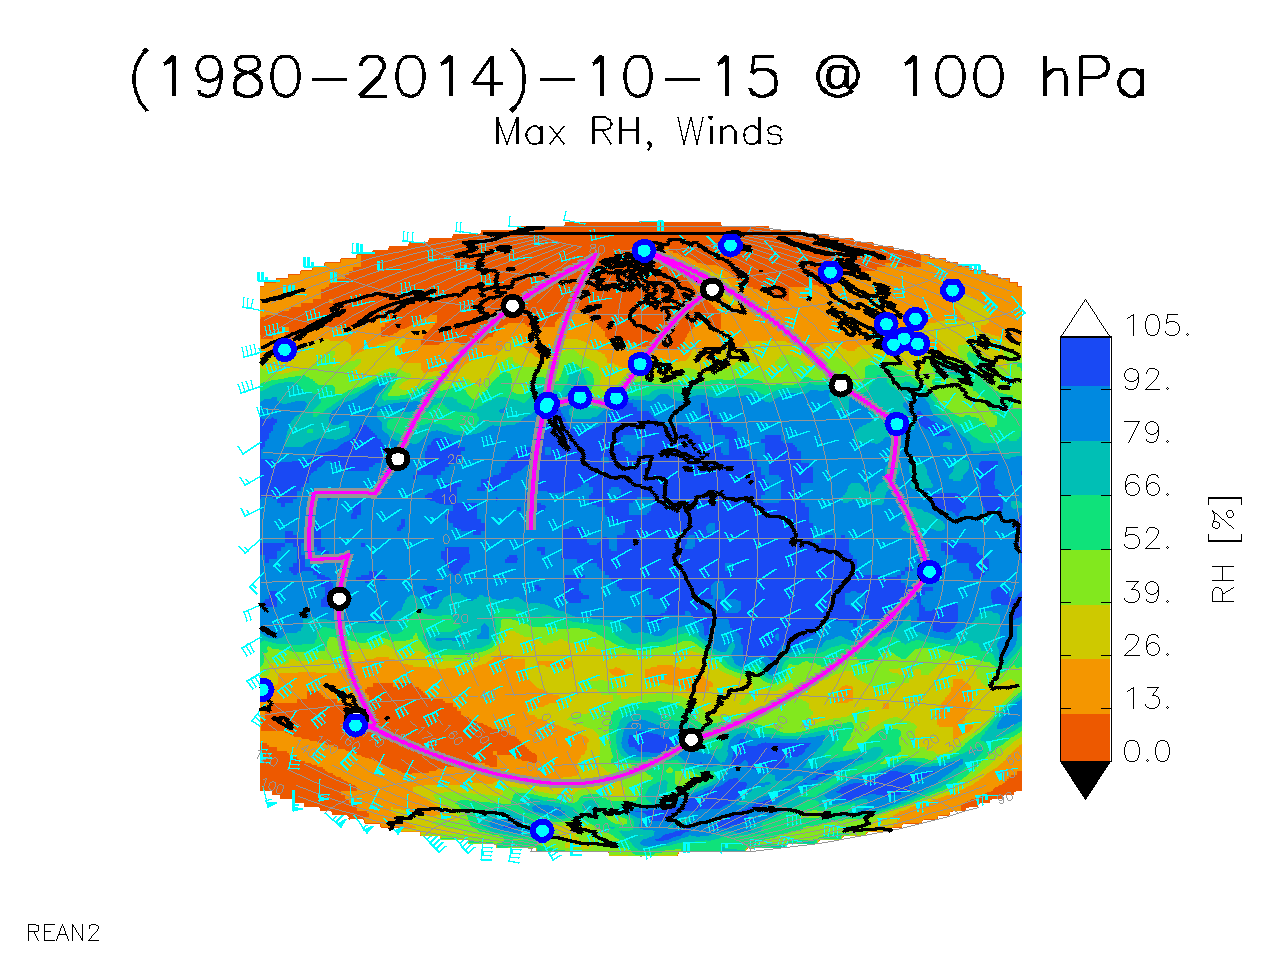
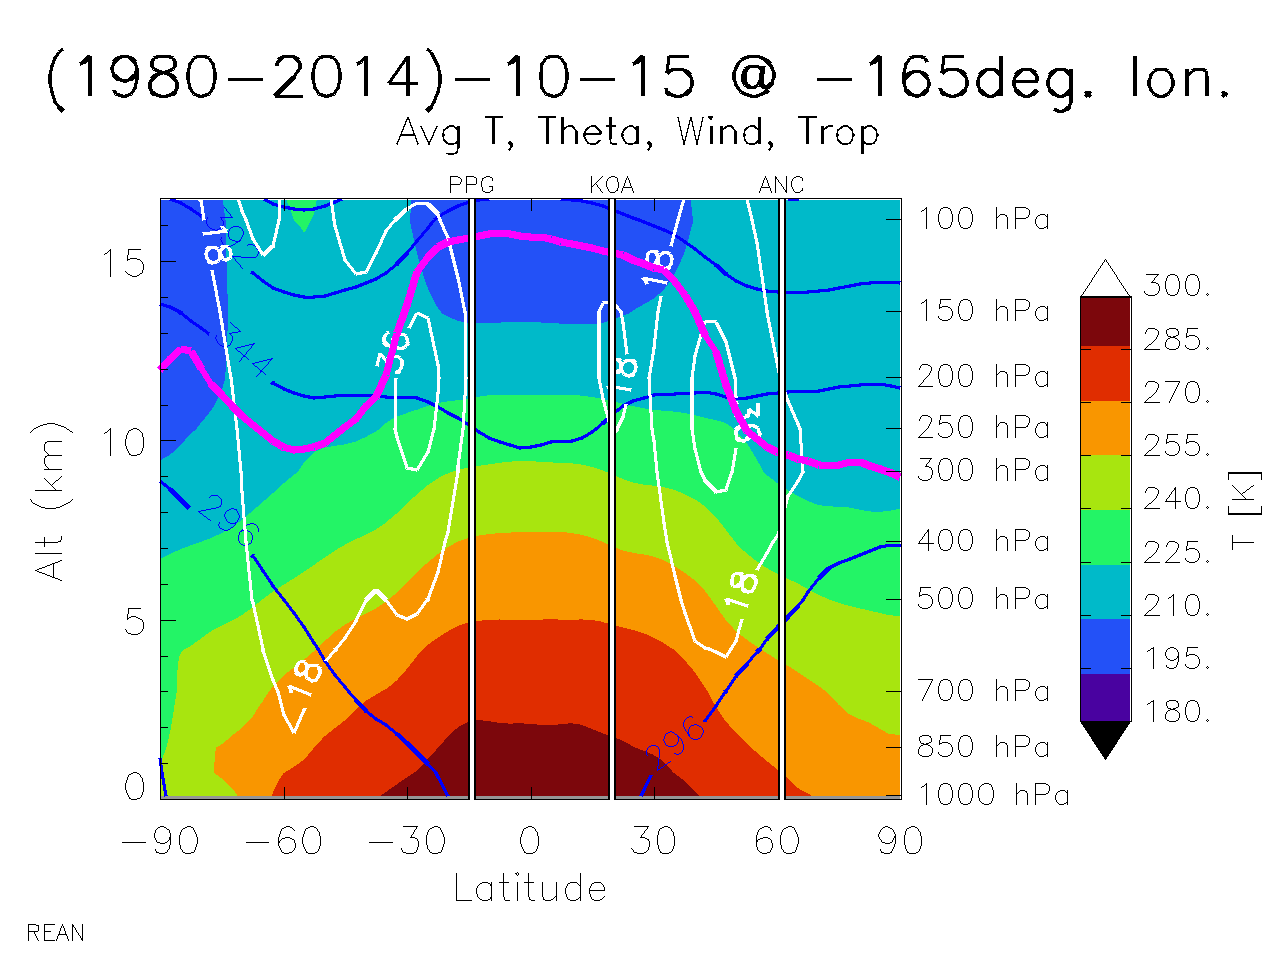
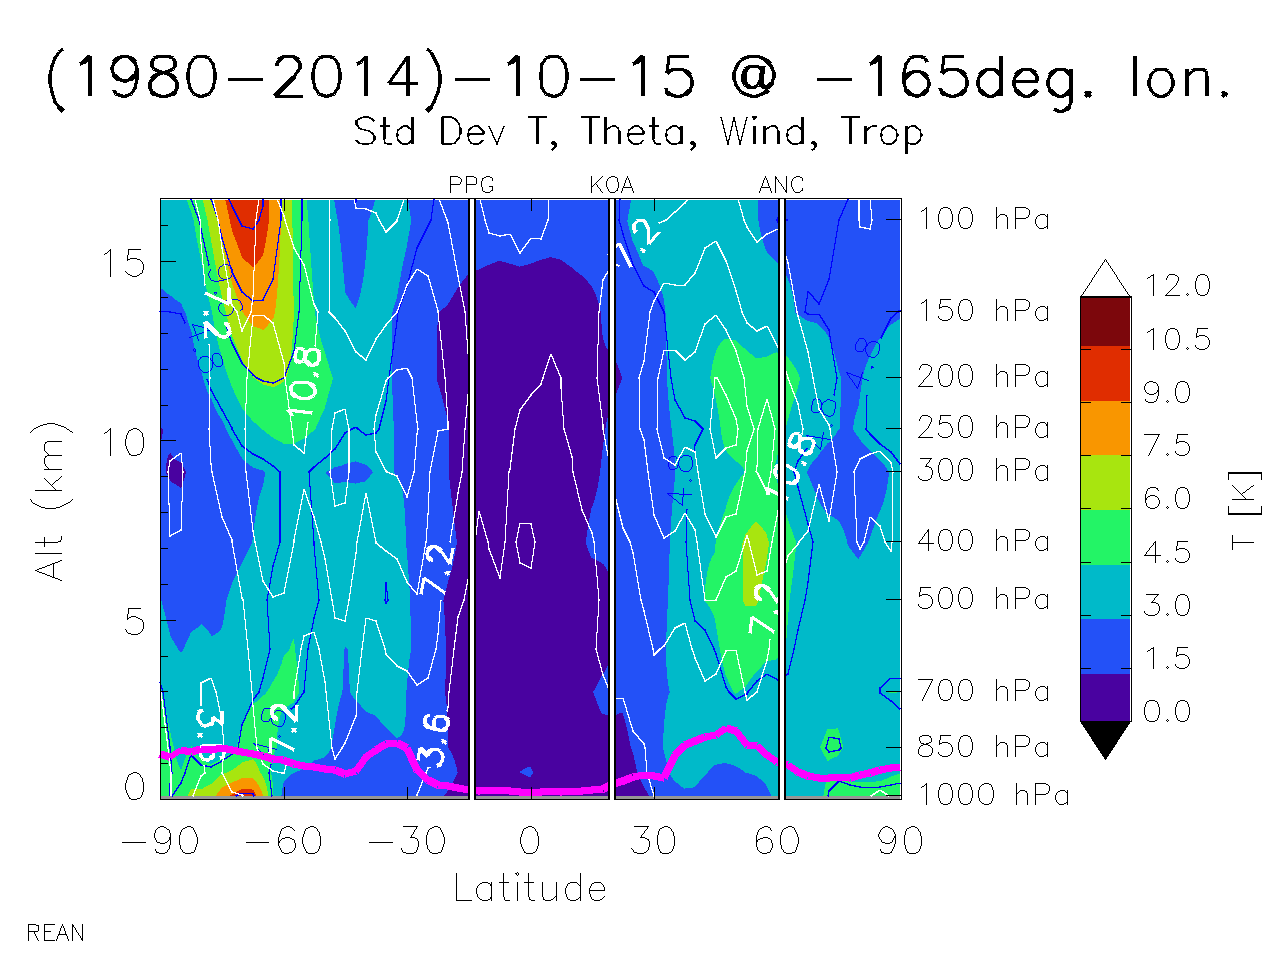
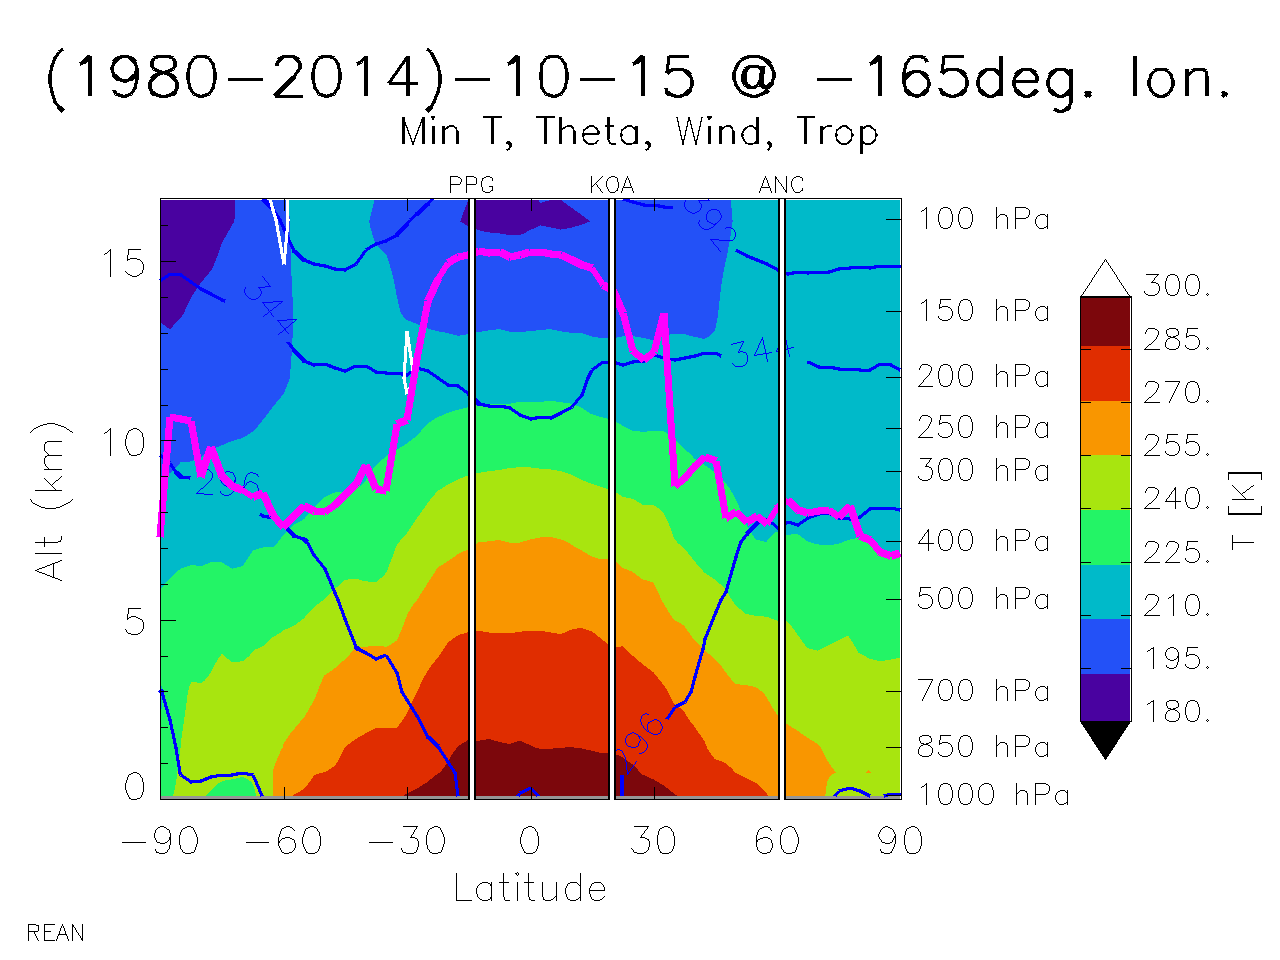
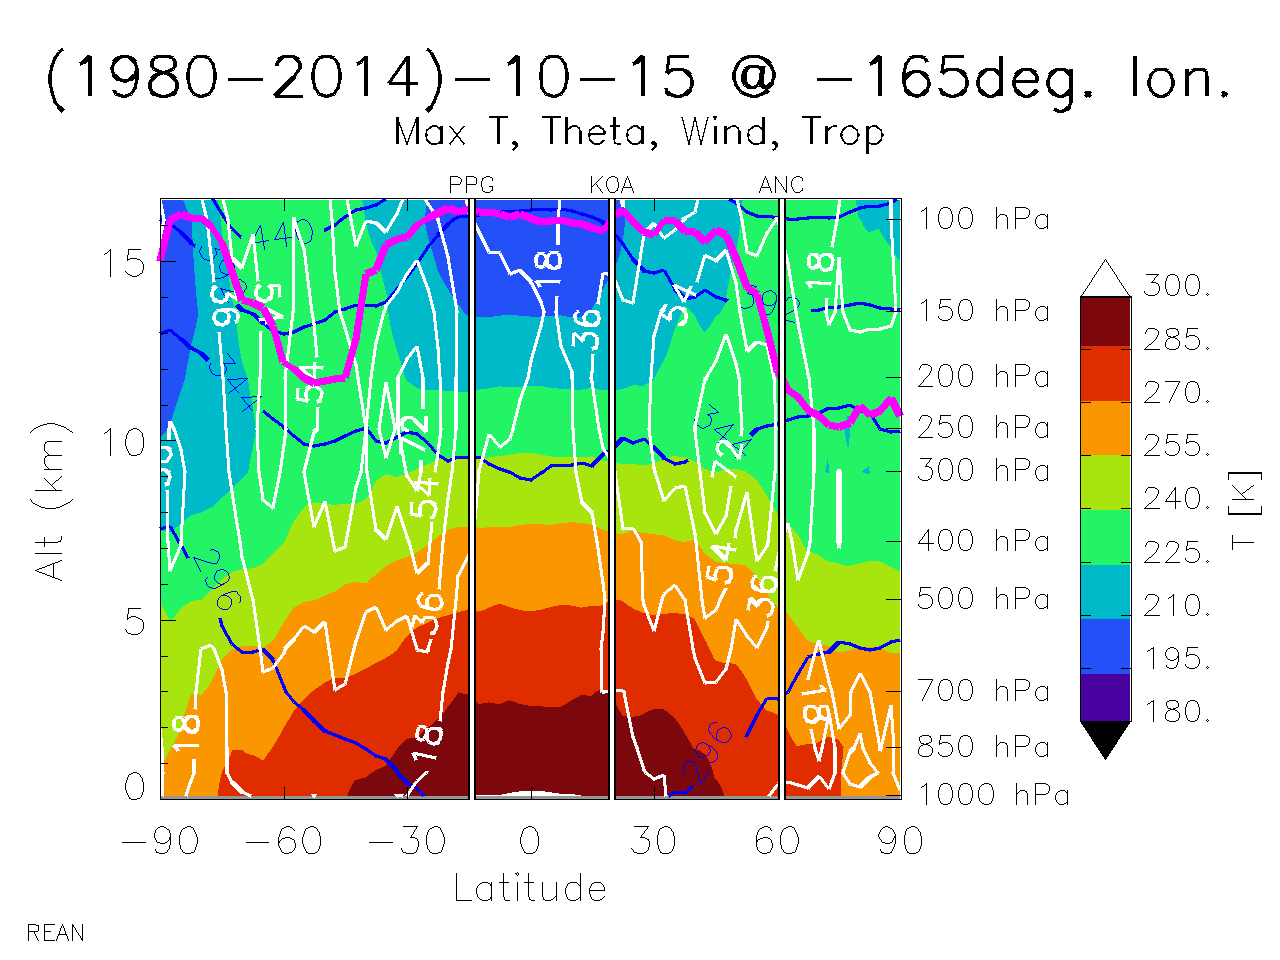
The plots show meteorological field values from 1980 through 2014. At each gridpoint, all the values for a single day in each year are collected and their population statistics examined. By looking at a plot of a single statistic for all the gridpoints, you can get an idea of the spatial distribution of typical fields and the variability of those values. Each plot shows values of grid points in meteorological fields taken from 1980 through 2014. The first column shows the average values at each gridpoint. The second column shows the standard deviation of the values at each gridpoint. The third and fourth columns show the minimum and maximum values, respectively, at each gridpoint.
| Plot | Average | Std. Dev. | Min | Max |
|---|---|---|---|---|
| Temperature, Geopotential Height, Winds |
|
|
|
|
| Windspeed, Potential Temperature |
|
|
|
|
| Relative Humidity, Winds |
|
|
|
|
| Temperature, Potential Temperature, Windspeed |
|
|
|
|
| Plot | Average | Std. Dev. | Min | Max |
|---|---|---|---|---|
| Temperature, Geopotential Height, Winds |
|
|
|
|
| Windspeed, Potential Temperature |
|
|
|
|
| Relative Humidity, Winds |
|
|
|
|
| Temperature, Potential Temperature, Windspeed |
|
|
|
|
| Plot | Average | Std. Dev. | Min | Max |
|---|---|---|---|---|
| Temperature, Geopotential Height, Winds |
|
|
|
|
| Windspeed, Potential Temperature |
|
|
|
|
| Relative Humidity, Winds |
|
|
|
|
| Temperature, Potential Temperature, Windspeed |
|
|
|
|
| Plot | Average | Std. Dev. | Min | Max |
|---|---|---|---|---|
| Temperature, Geopotential Height, Winds |
|
|
|
|
| Windspeed, Potential Temperature |
|
|
|
|
| Relative Humidity, Winds |
|
|

|
|
| Temperature, Potential Temperature, Windspeed |
|
|
|
|
For other views, see: