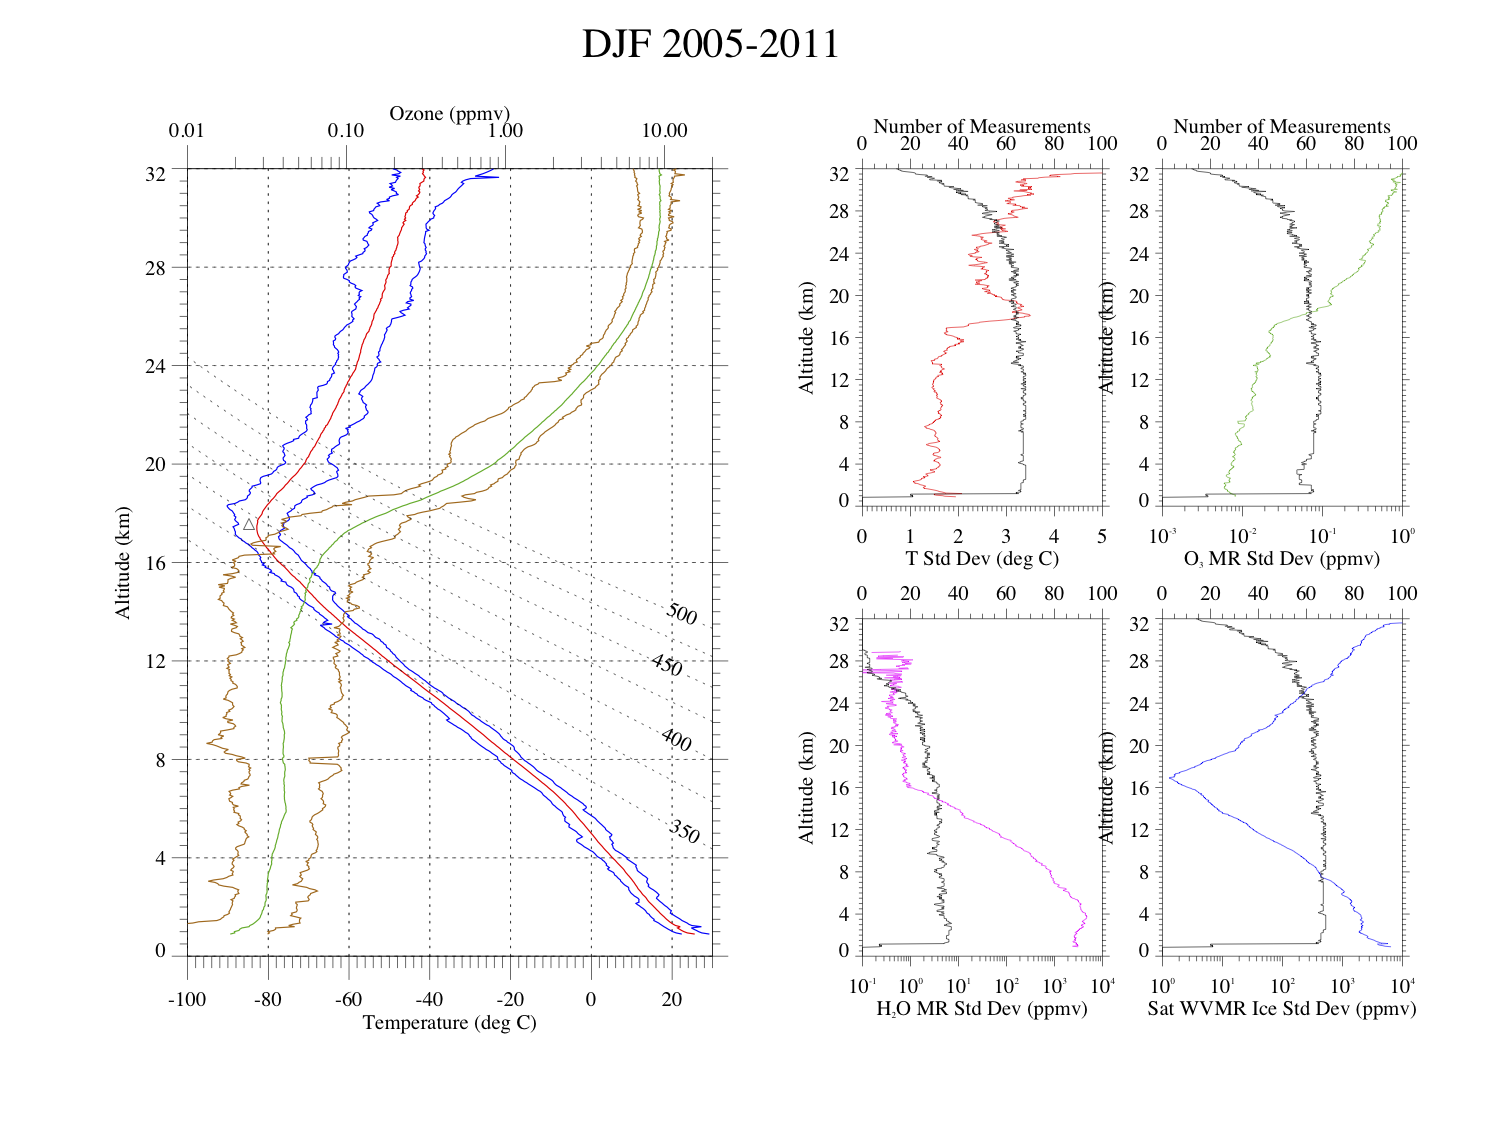
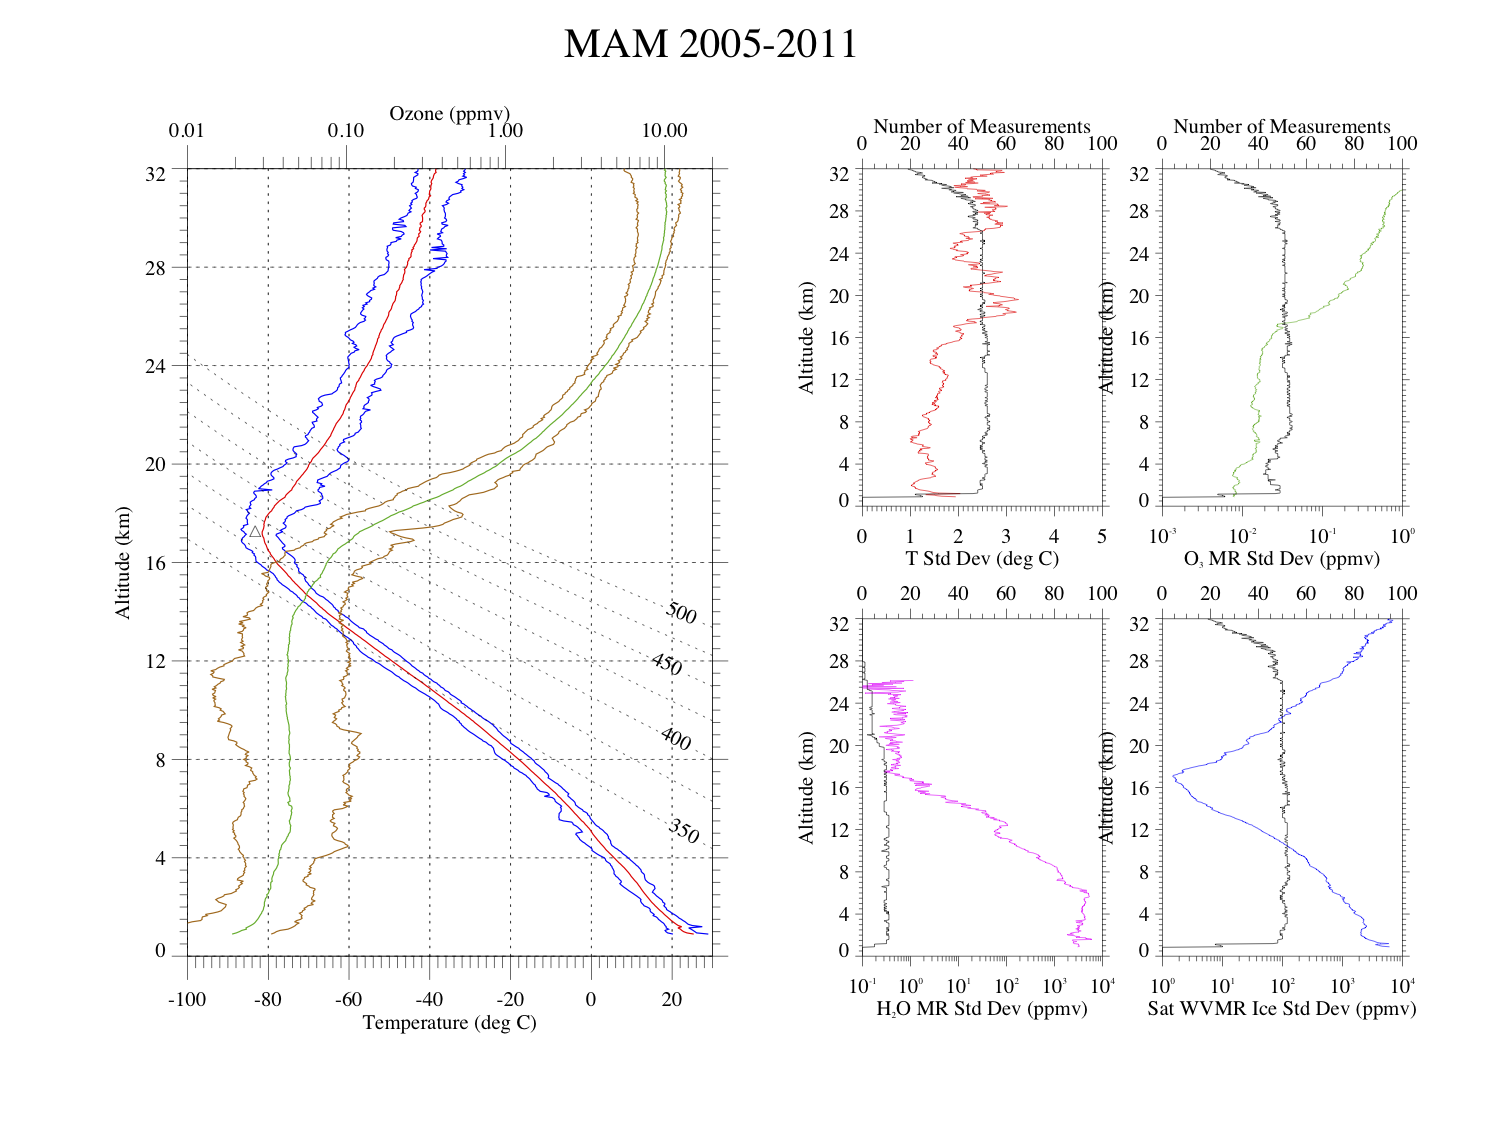
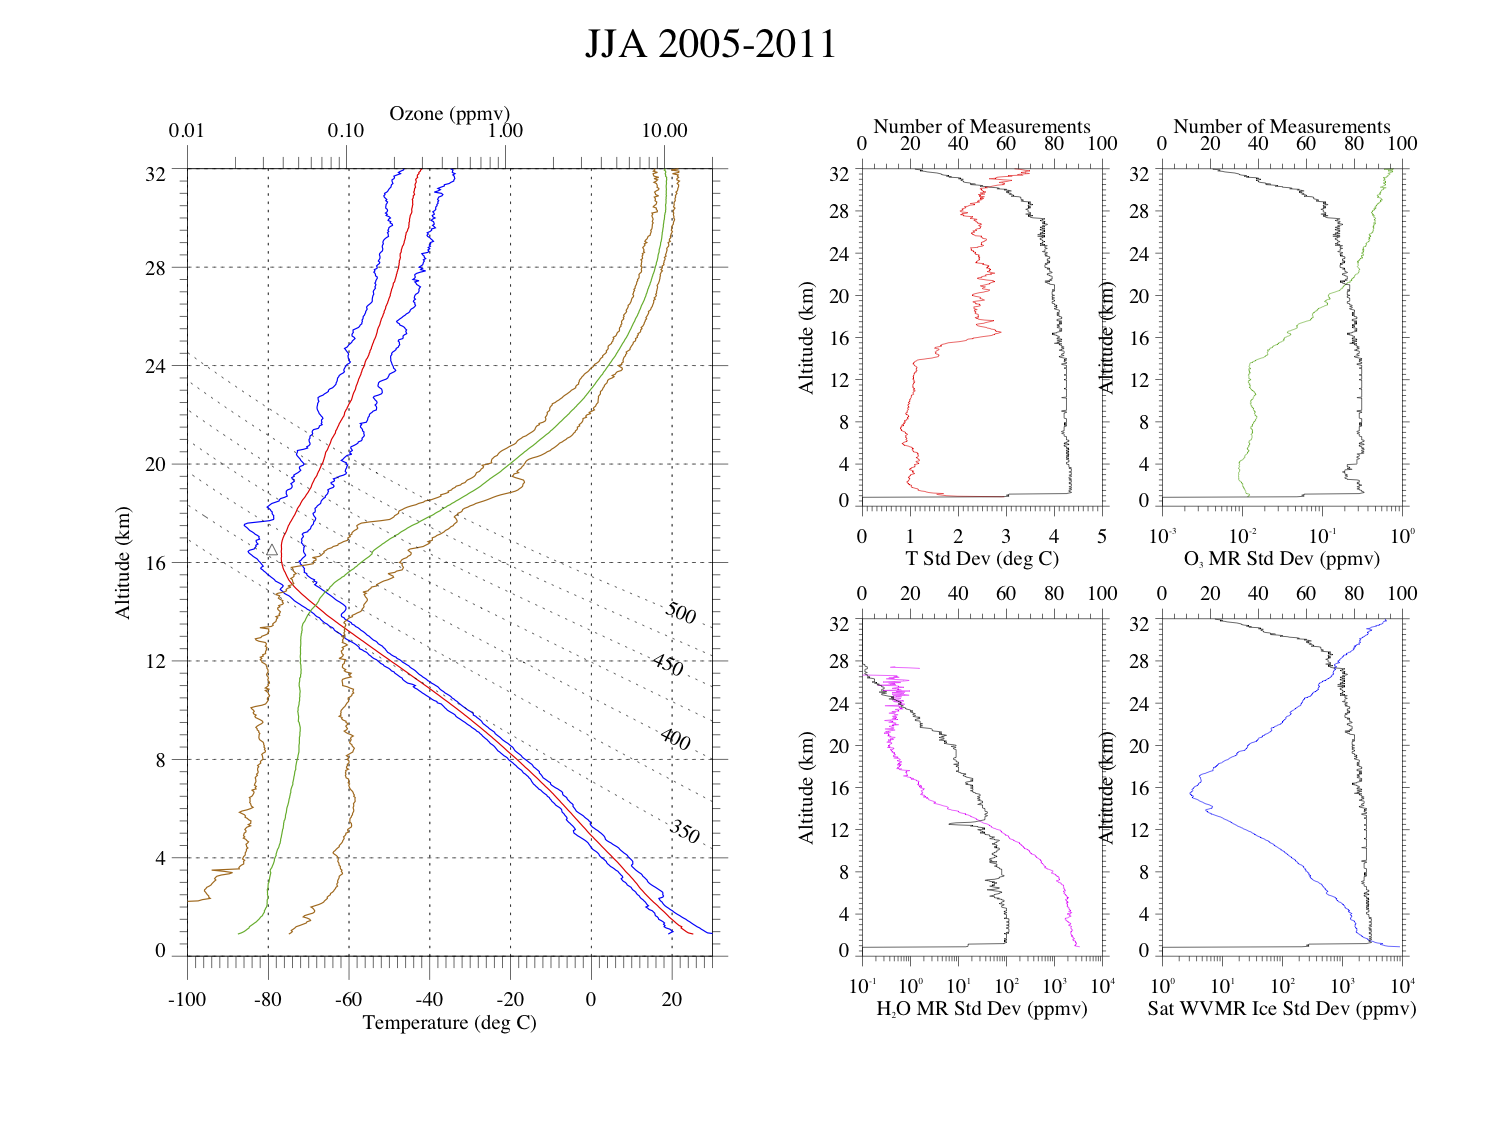
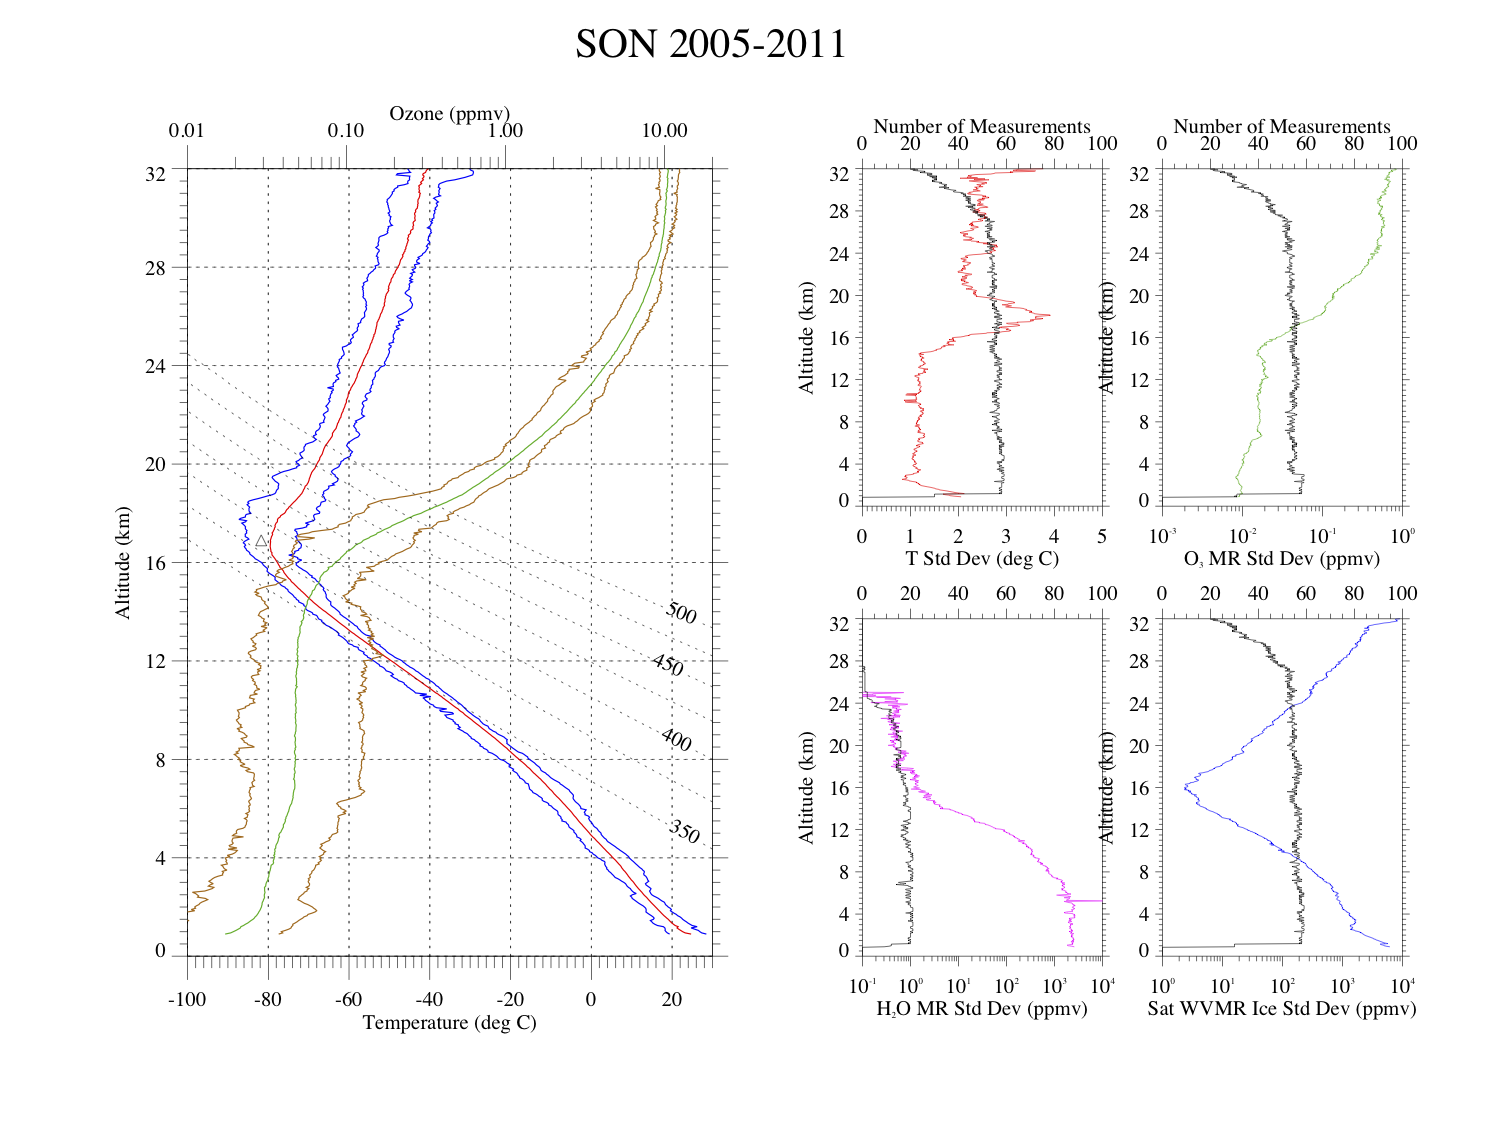
Ticosonde seasonal 50-m gridded profiles of temperature (red) with max and min at each level (blue) and ozone (green) with max and min (brown). At right are profiles of standard deveiations (color) for temperature, ozone, water vapor and saturation mixing ratio and sample size at each 50-m level. The mean coldpoint tropopause is indicated by a triangle. [Launches made at Alajuela and Heredia, Costa Rica - 10N, 84.2W]
|
|
|
|