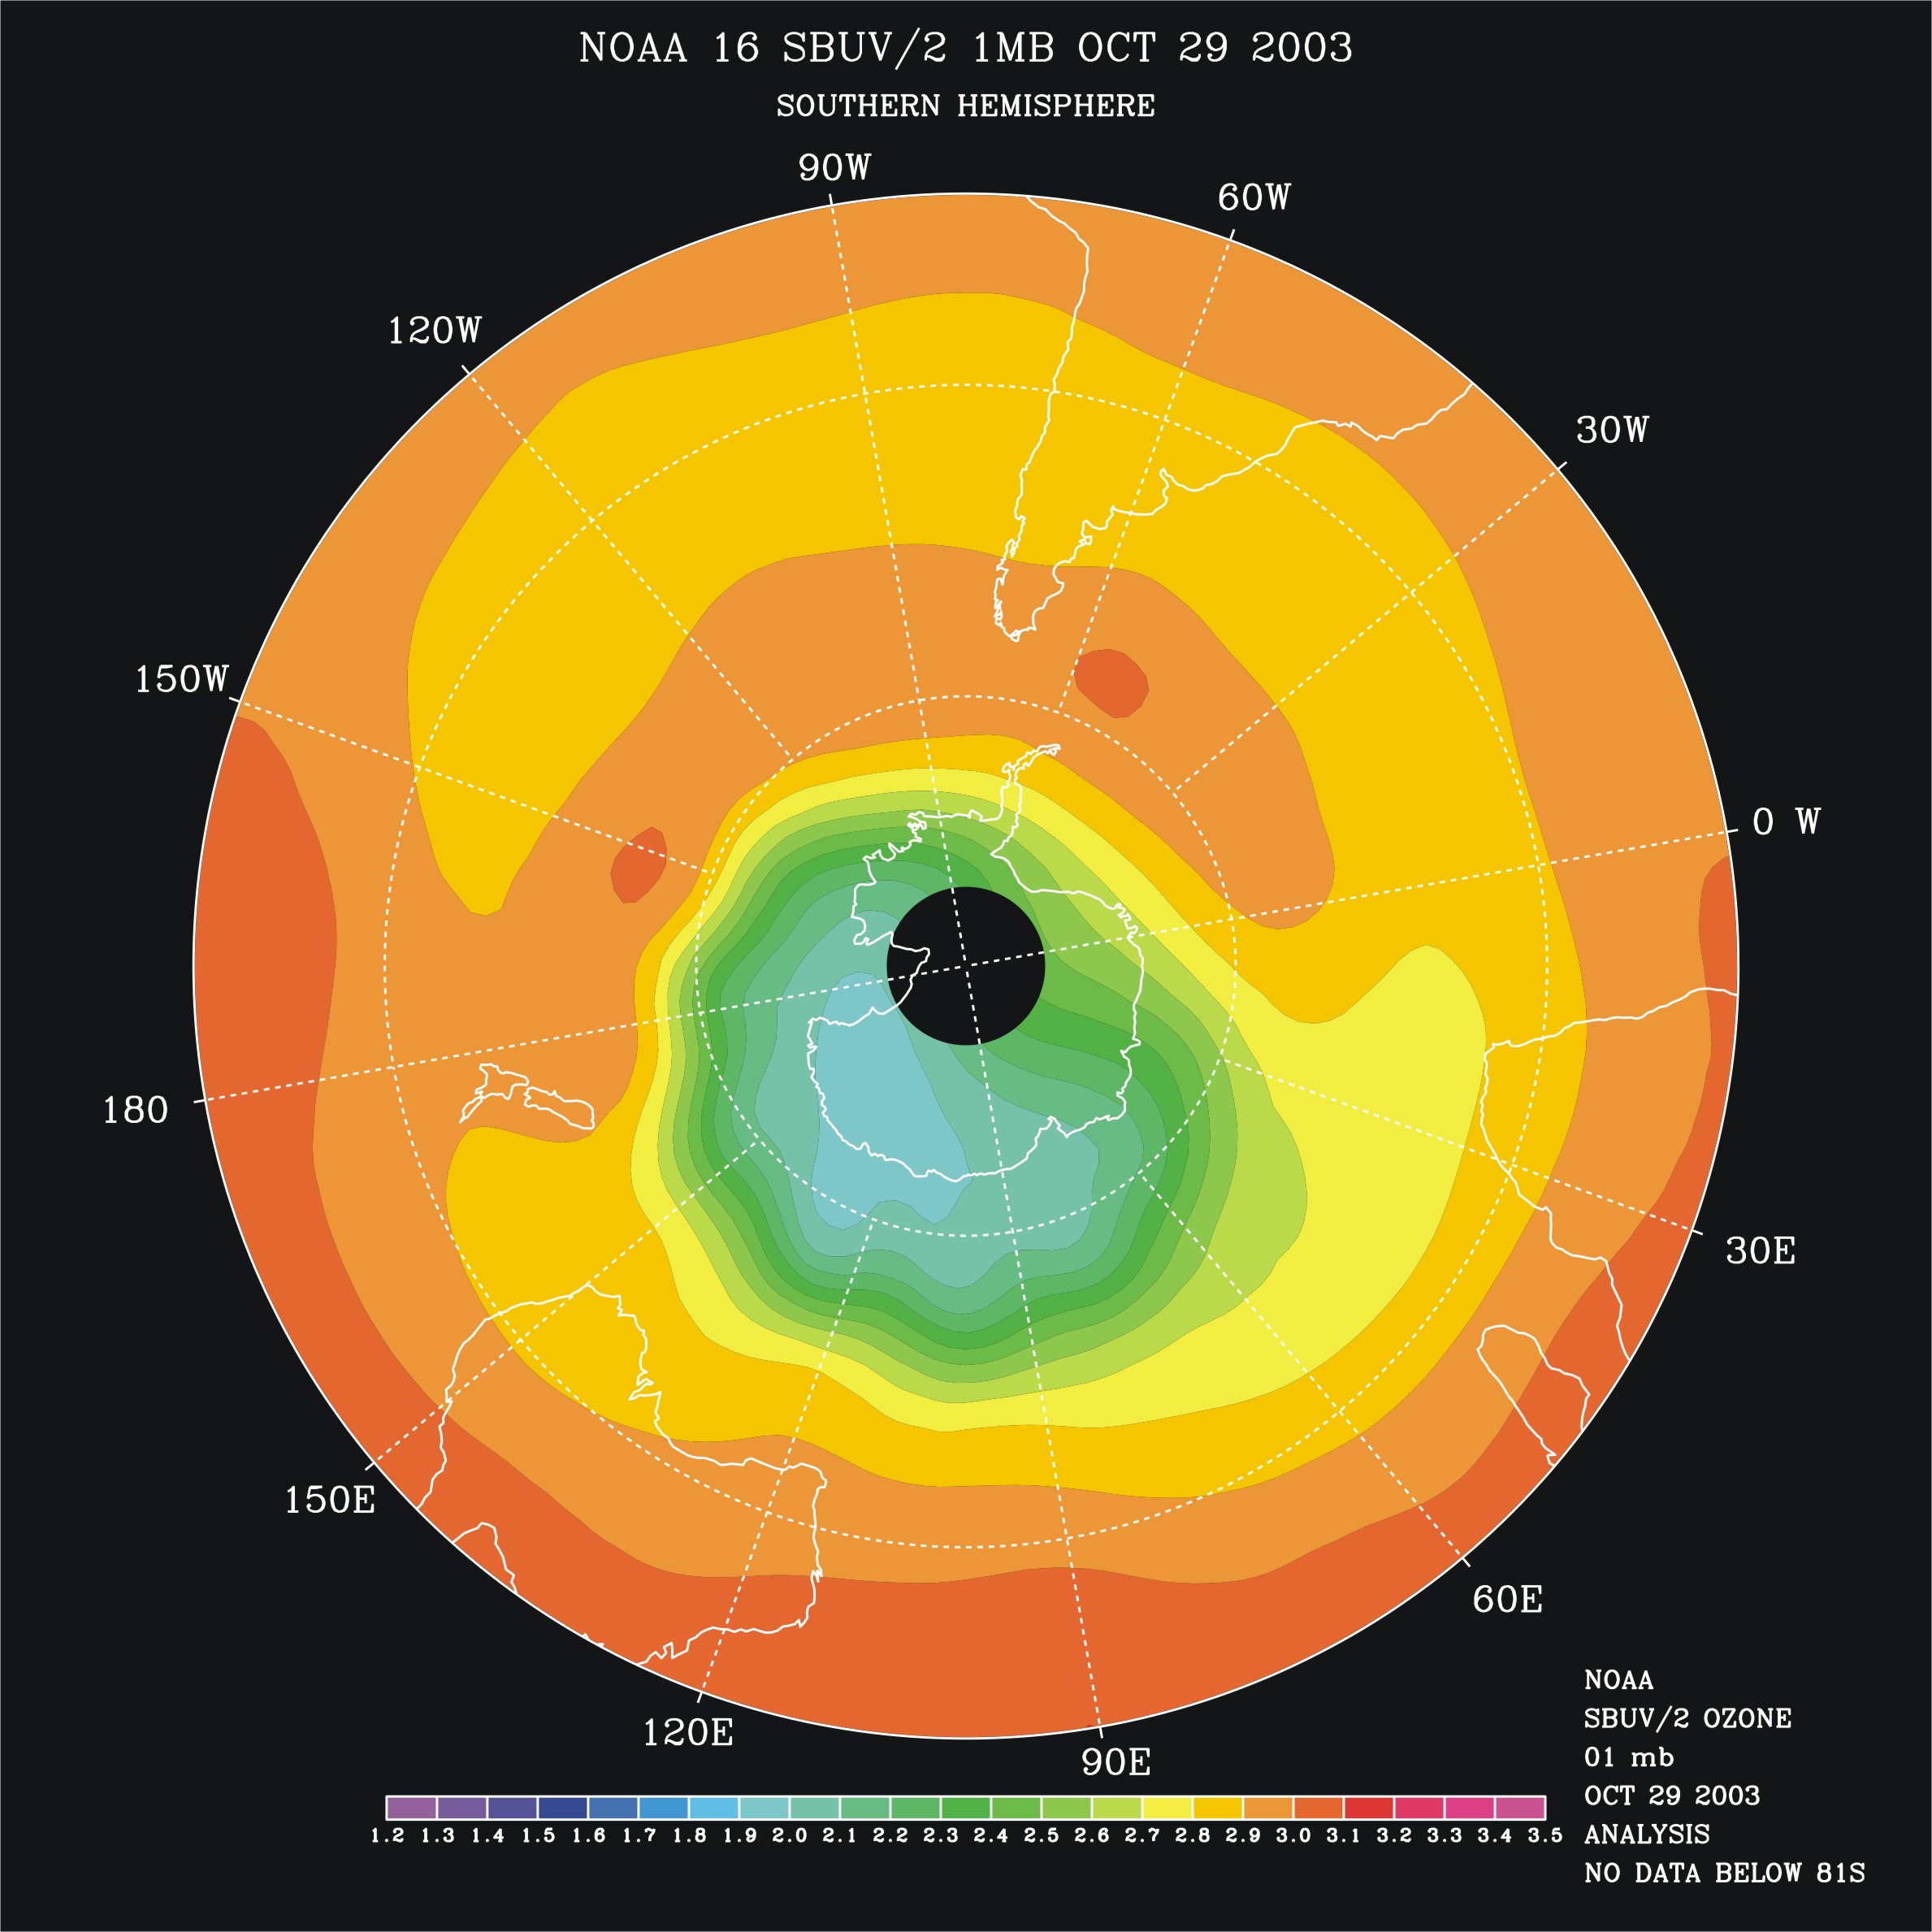
This is a false color contour map of the atmospheric ozone mixing ratio at 1 mbar for October 29, 2003 with a view of the Southern Hemisphere centered at the South Pole. This is a full effect” picture for the October 29, 2003 solar particle event relative to Figures 102703_1mb.jpg and 102803_1mb.jpg. It shows a large quasi-circular region almost as large as the Antarctic Circle, but shifted 10 degrees off the pole toward Australia, with highly perturbed ozone concentrations below 2.3 ppmv. The 1 mbar ozone values show the full effects of interactions between atmospheric ozone and particles from a major solar event. Outside of this region, concentrations are in the normal 2.7 to 2.3 ppmv range.