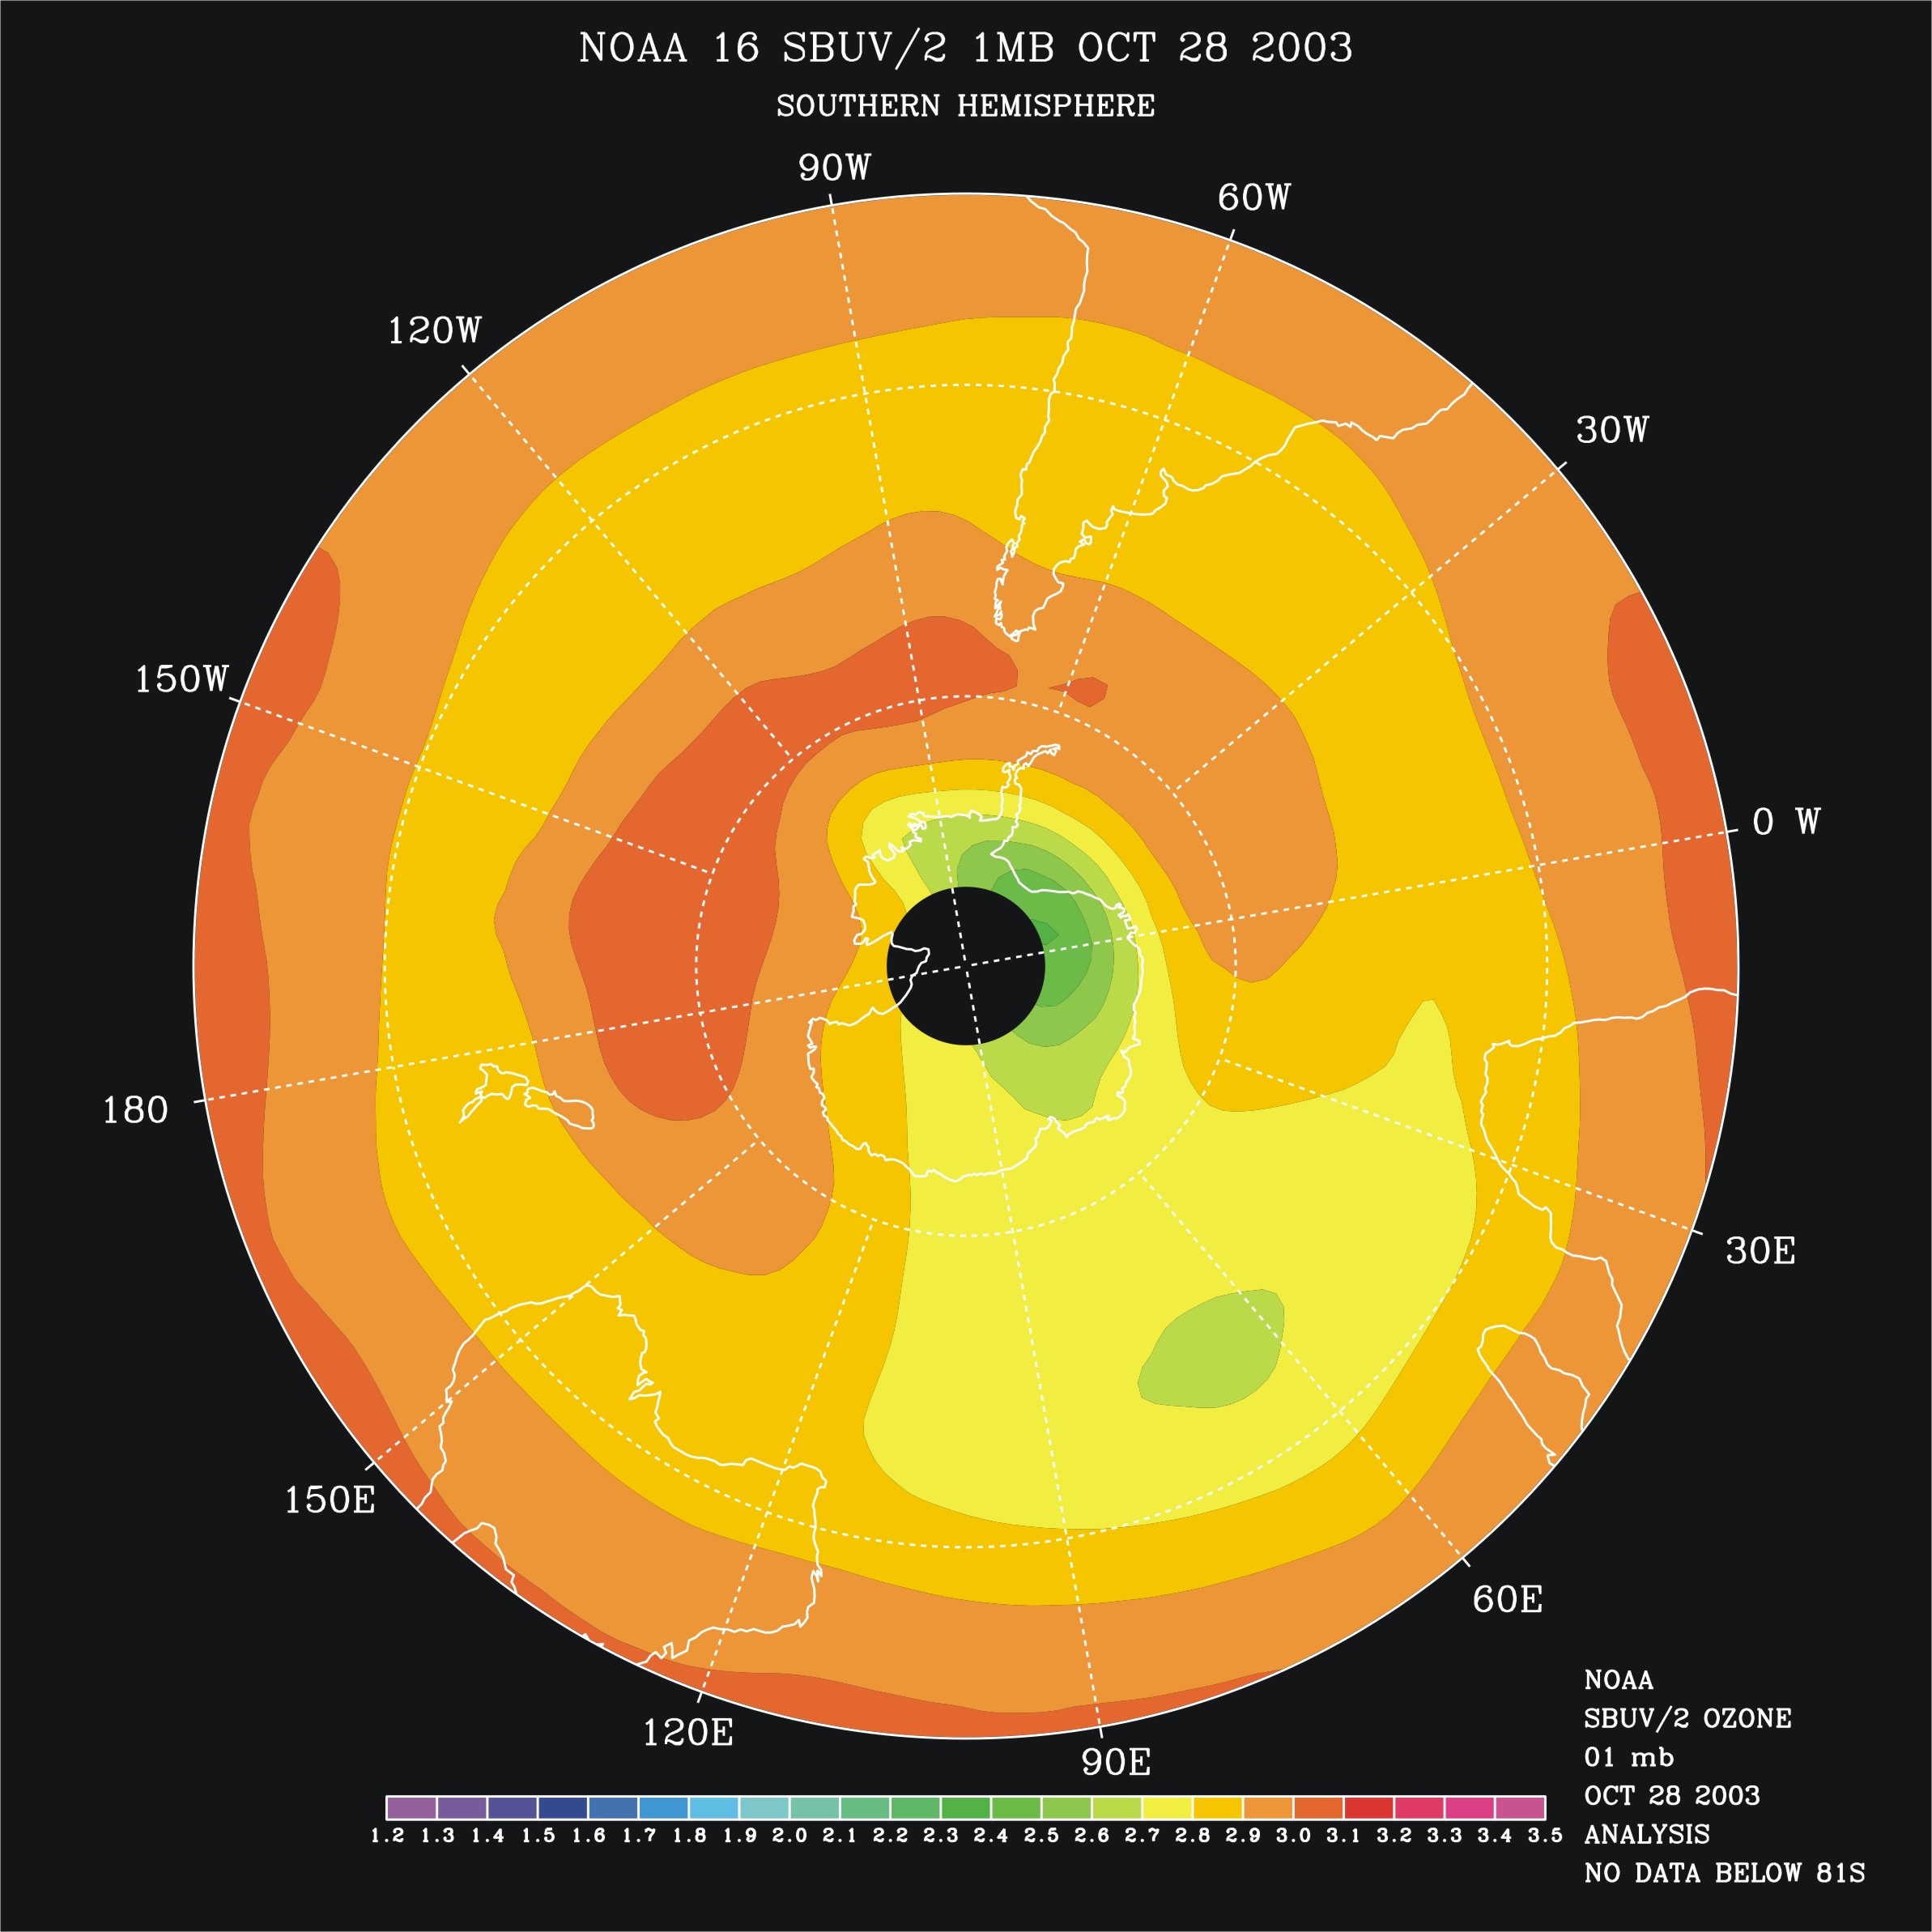
This is a false color contour map of the atmospheric ozone mixing ratio at 1 mbar for October 28, 2003 with a view of the Southern Hemisphere centered at the South Pole. This is an onset picture for the October 29, 2003 solar particle event relative to Figures 102703_1mb.jpg and 102903_1mb.jpg. It shows slightly perturbed ozone values with most values between 2.7 and 3.2 ppmv, but with a region over Antarctica and the southern Indian Ocean with concentrations as low as 2.3 ppmv. The 1 mbar ozone values are just beginning to show the effects of interactions with particles from a major solar event.