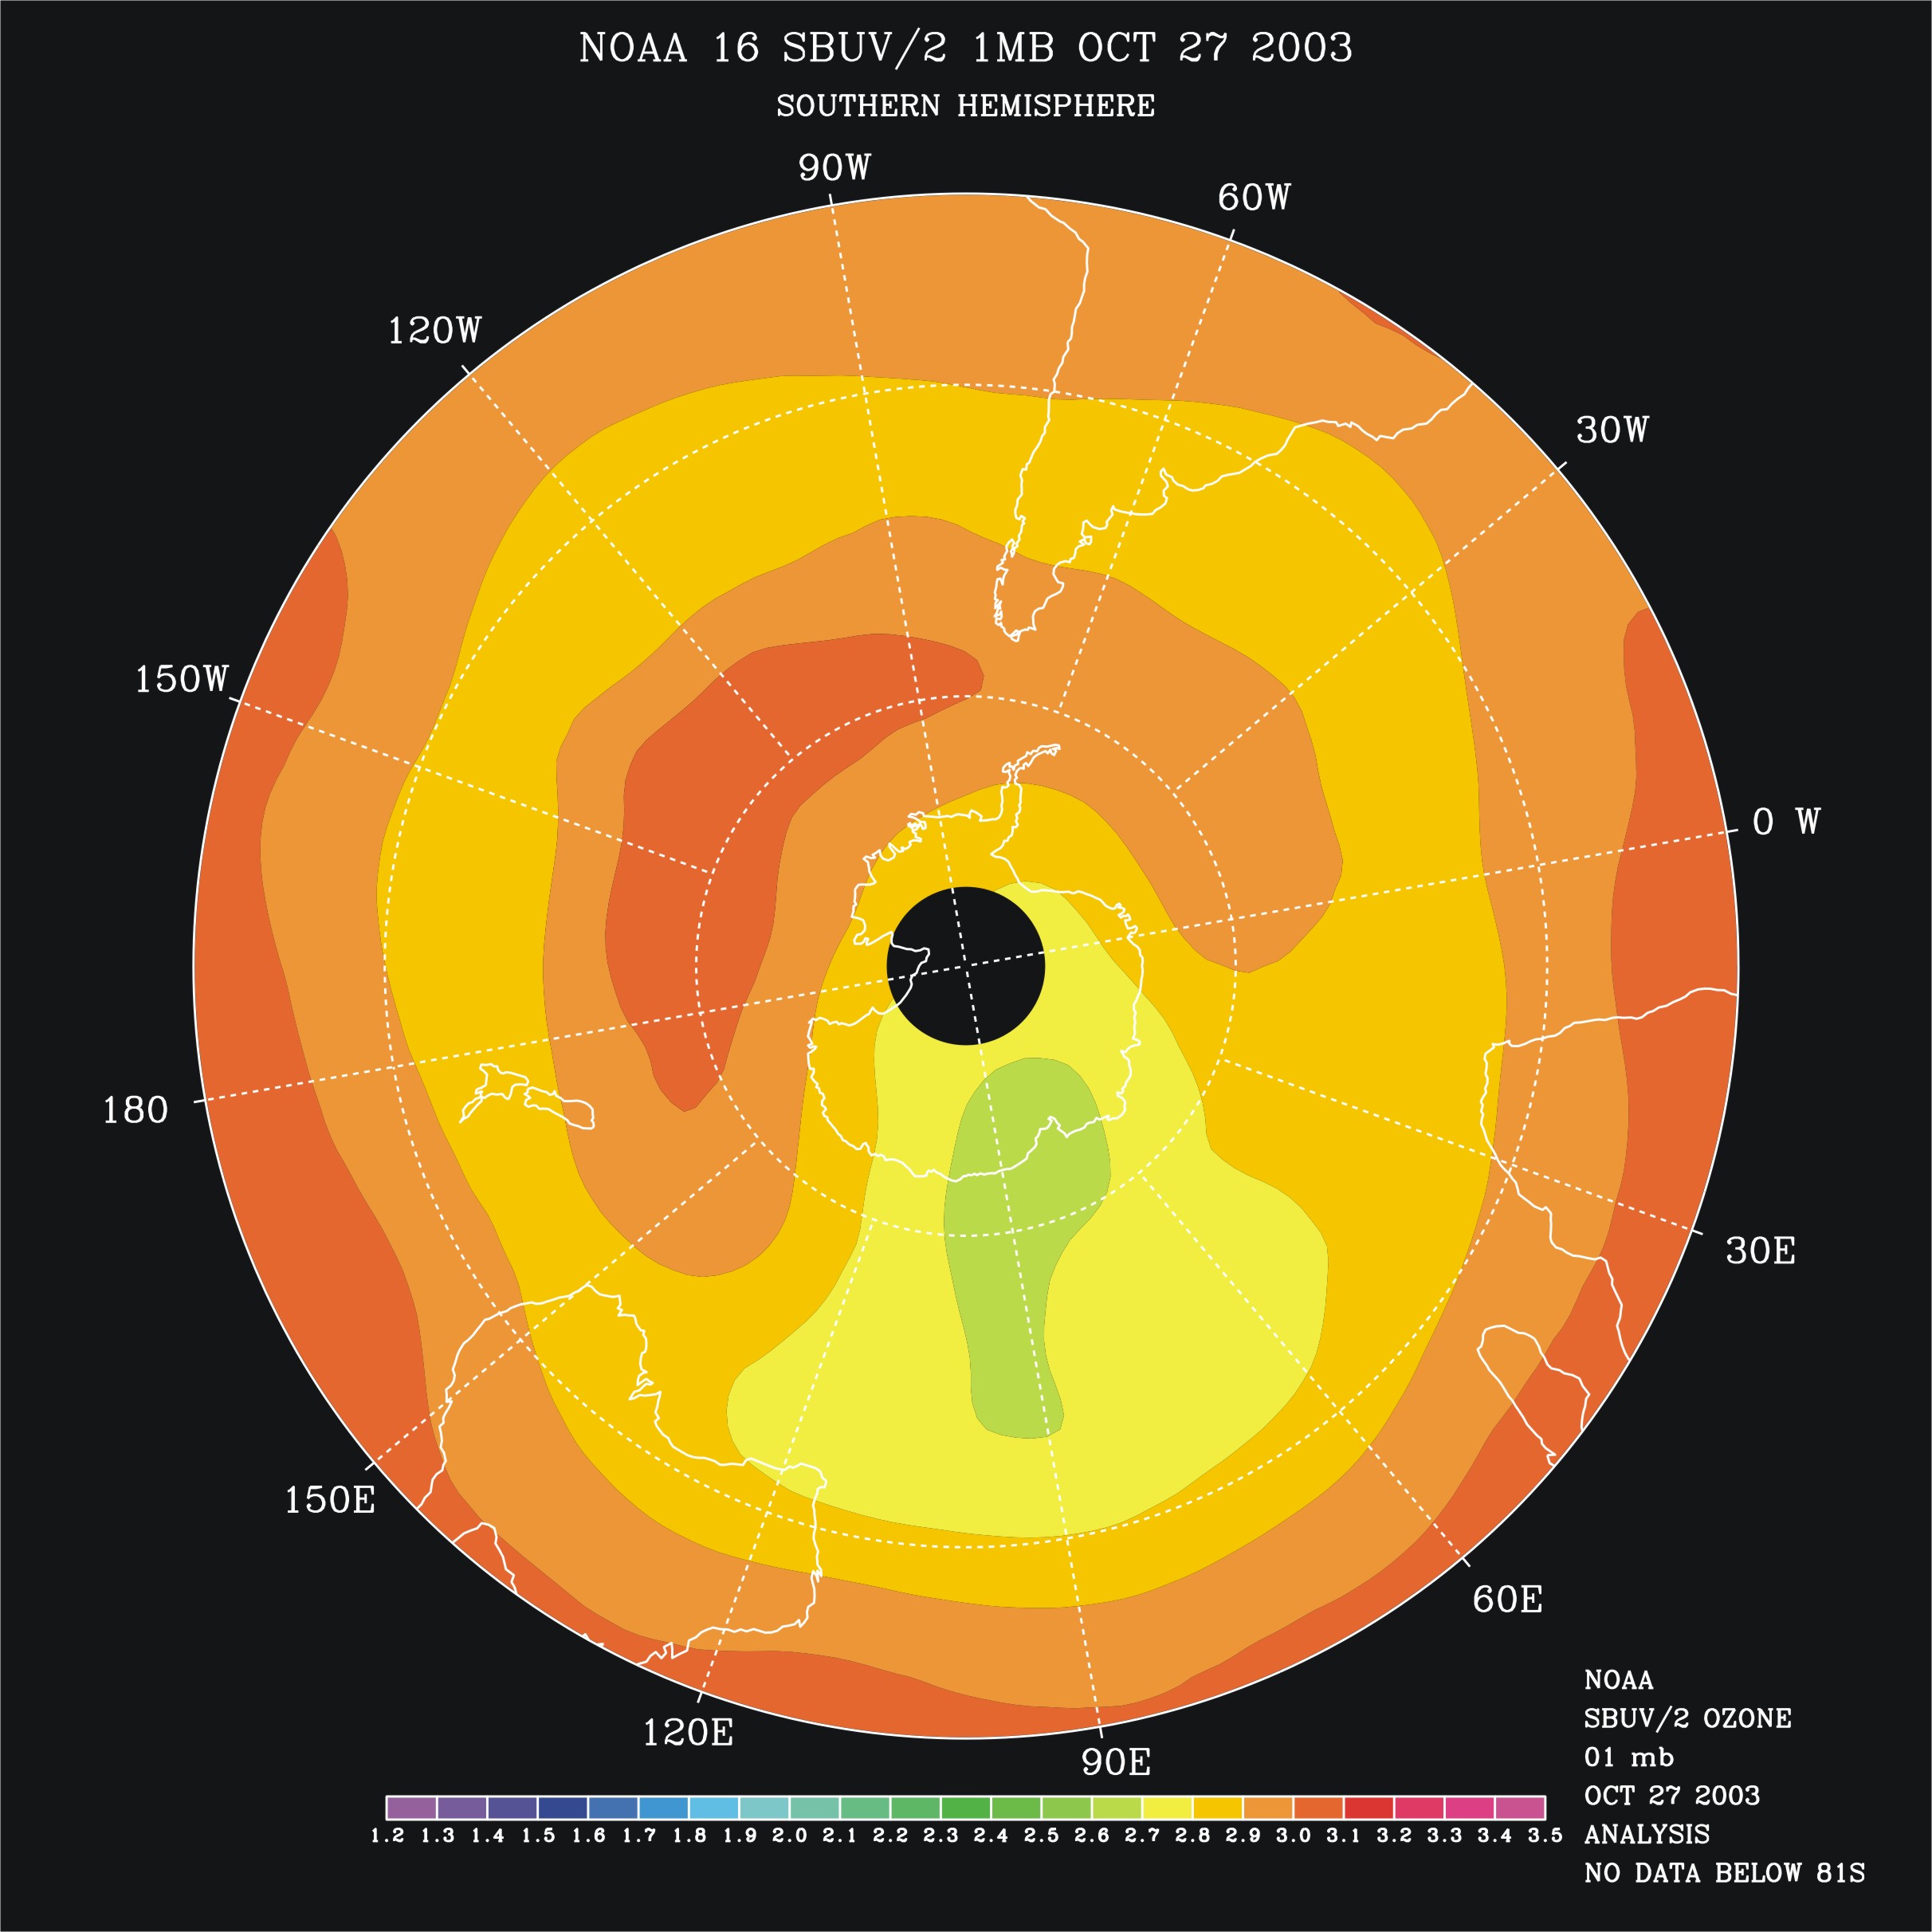
This is a false color contour map of the atmospheric ozone mixing ratio at 1 mbar for October 28, 2003 with a view of the Southern Hemisphere centered at the South Pole. This is a before” picture for the October 29, 2003 solar particle event relative to Figures 102803_1mb.jpg and 102903_1mb.jpg. It shows unperturbed ozone mixing ratio values of from 2.7 to 3.2 ppmv over much of the Southern Hemisphere.