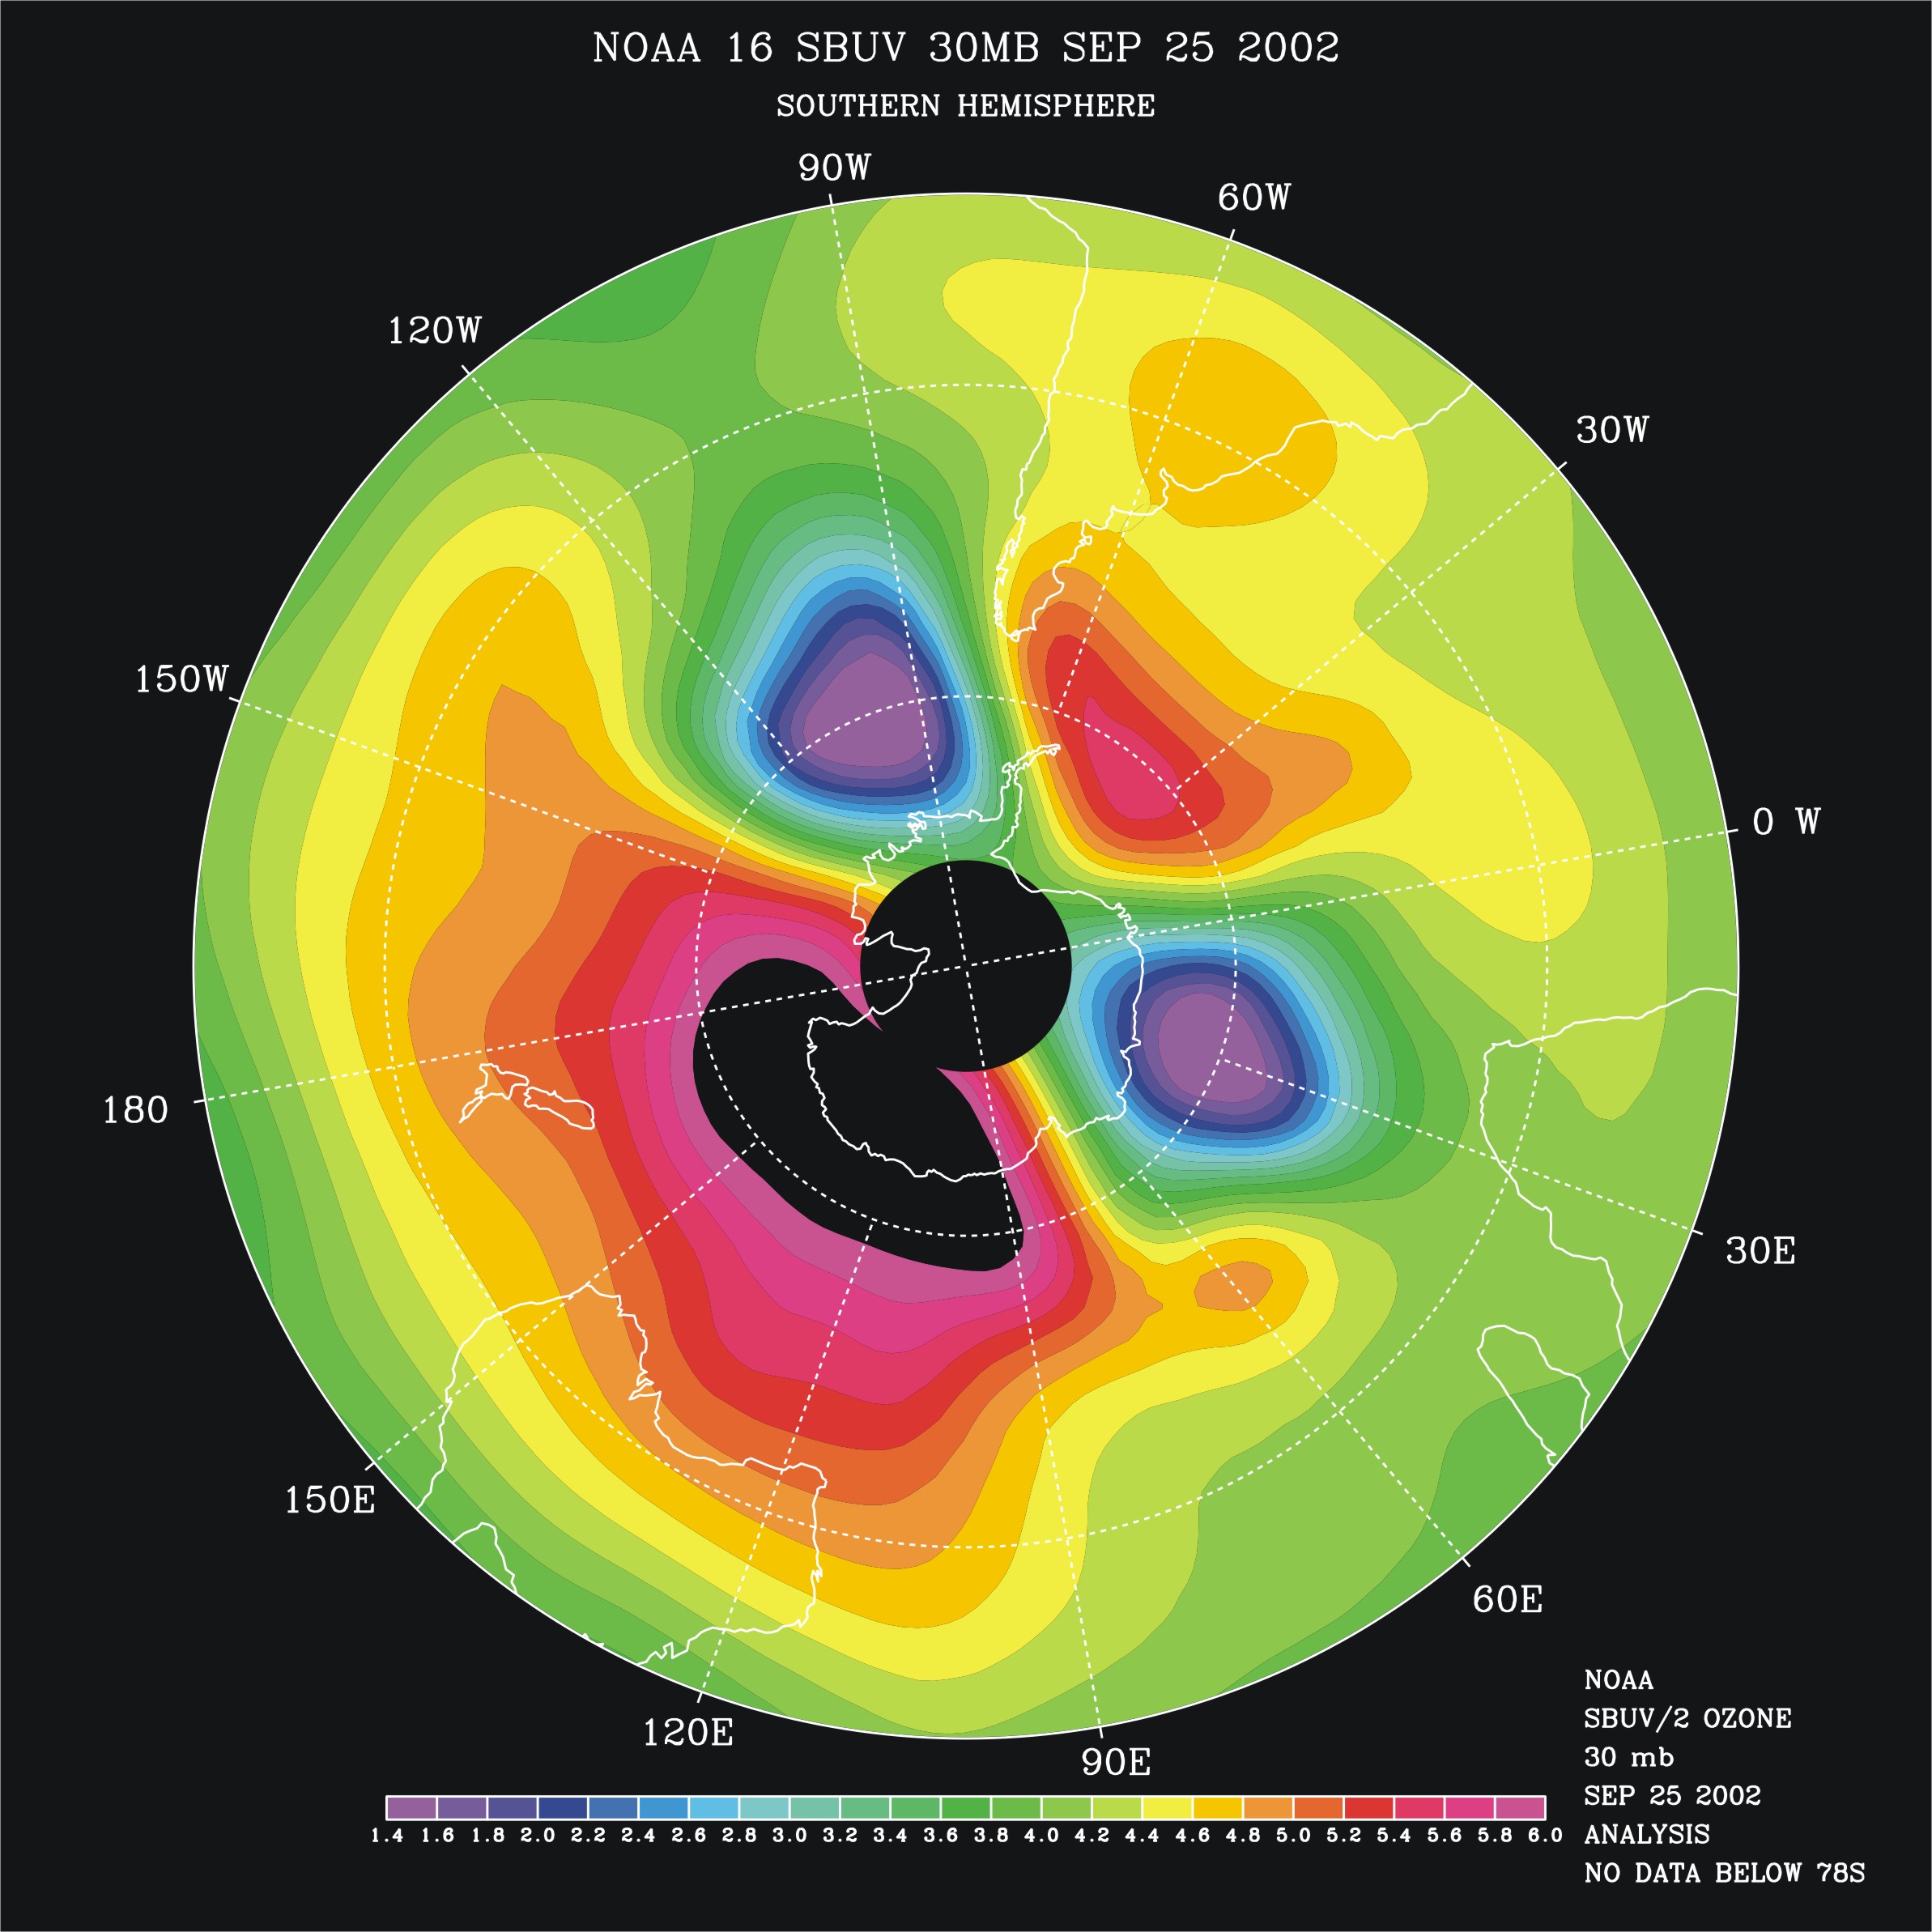
This is a false color contour map of the atmospheric ozone mixing ratio at 30 mbar for September, 2002 with a view of the Southern Hemisphere centered at the South Pole. This gives a horizontal slice of the atmosphere during the unusual splitting of the south polar vortex. It should be compared to Figure 092502_2mb.jpg. It shows a clown face” composed of two low ozone eyes of low ozone one south of Africa and the other in the southeastern Pacific, both with values as low as 1.4 ppmv, and a large mouth” of high ozone south of Australia with values as high as 6.2 ppmv. The ozone eyes are formed by the ozone values within the two lobes of the split ozone hole.