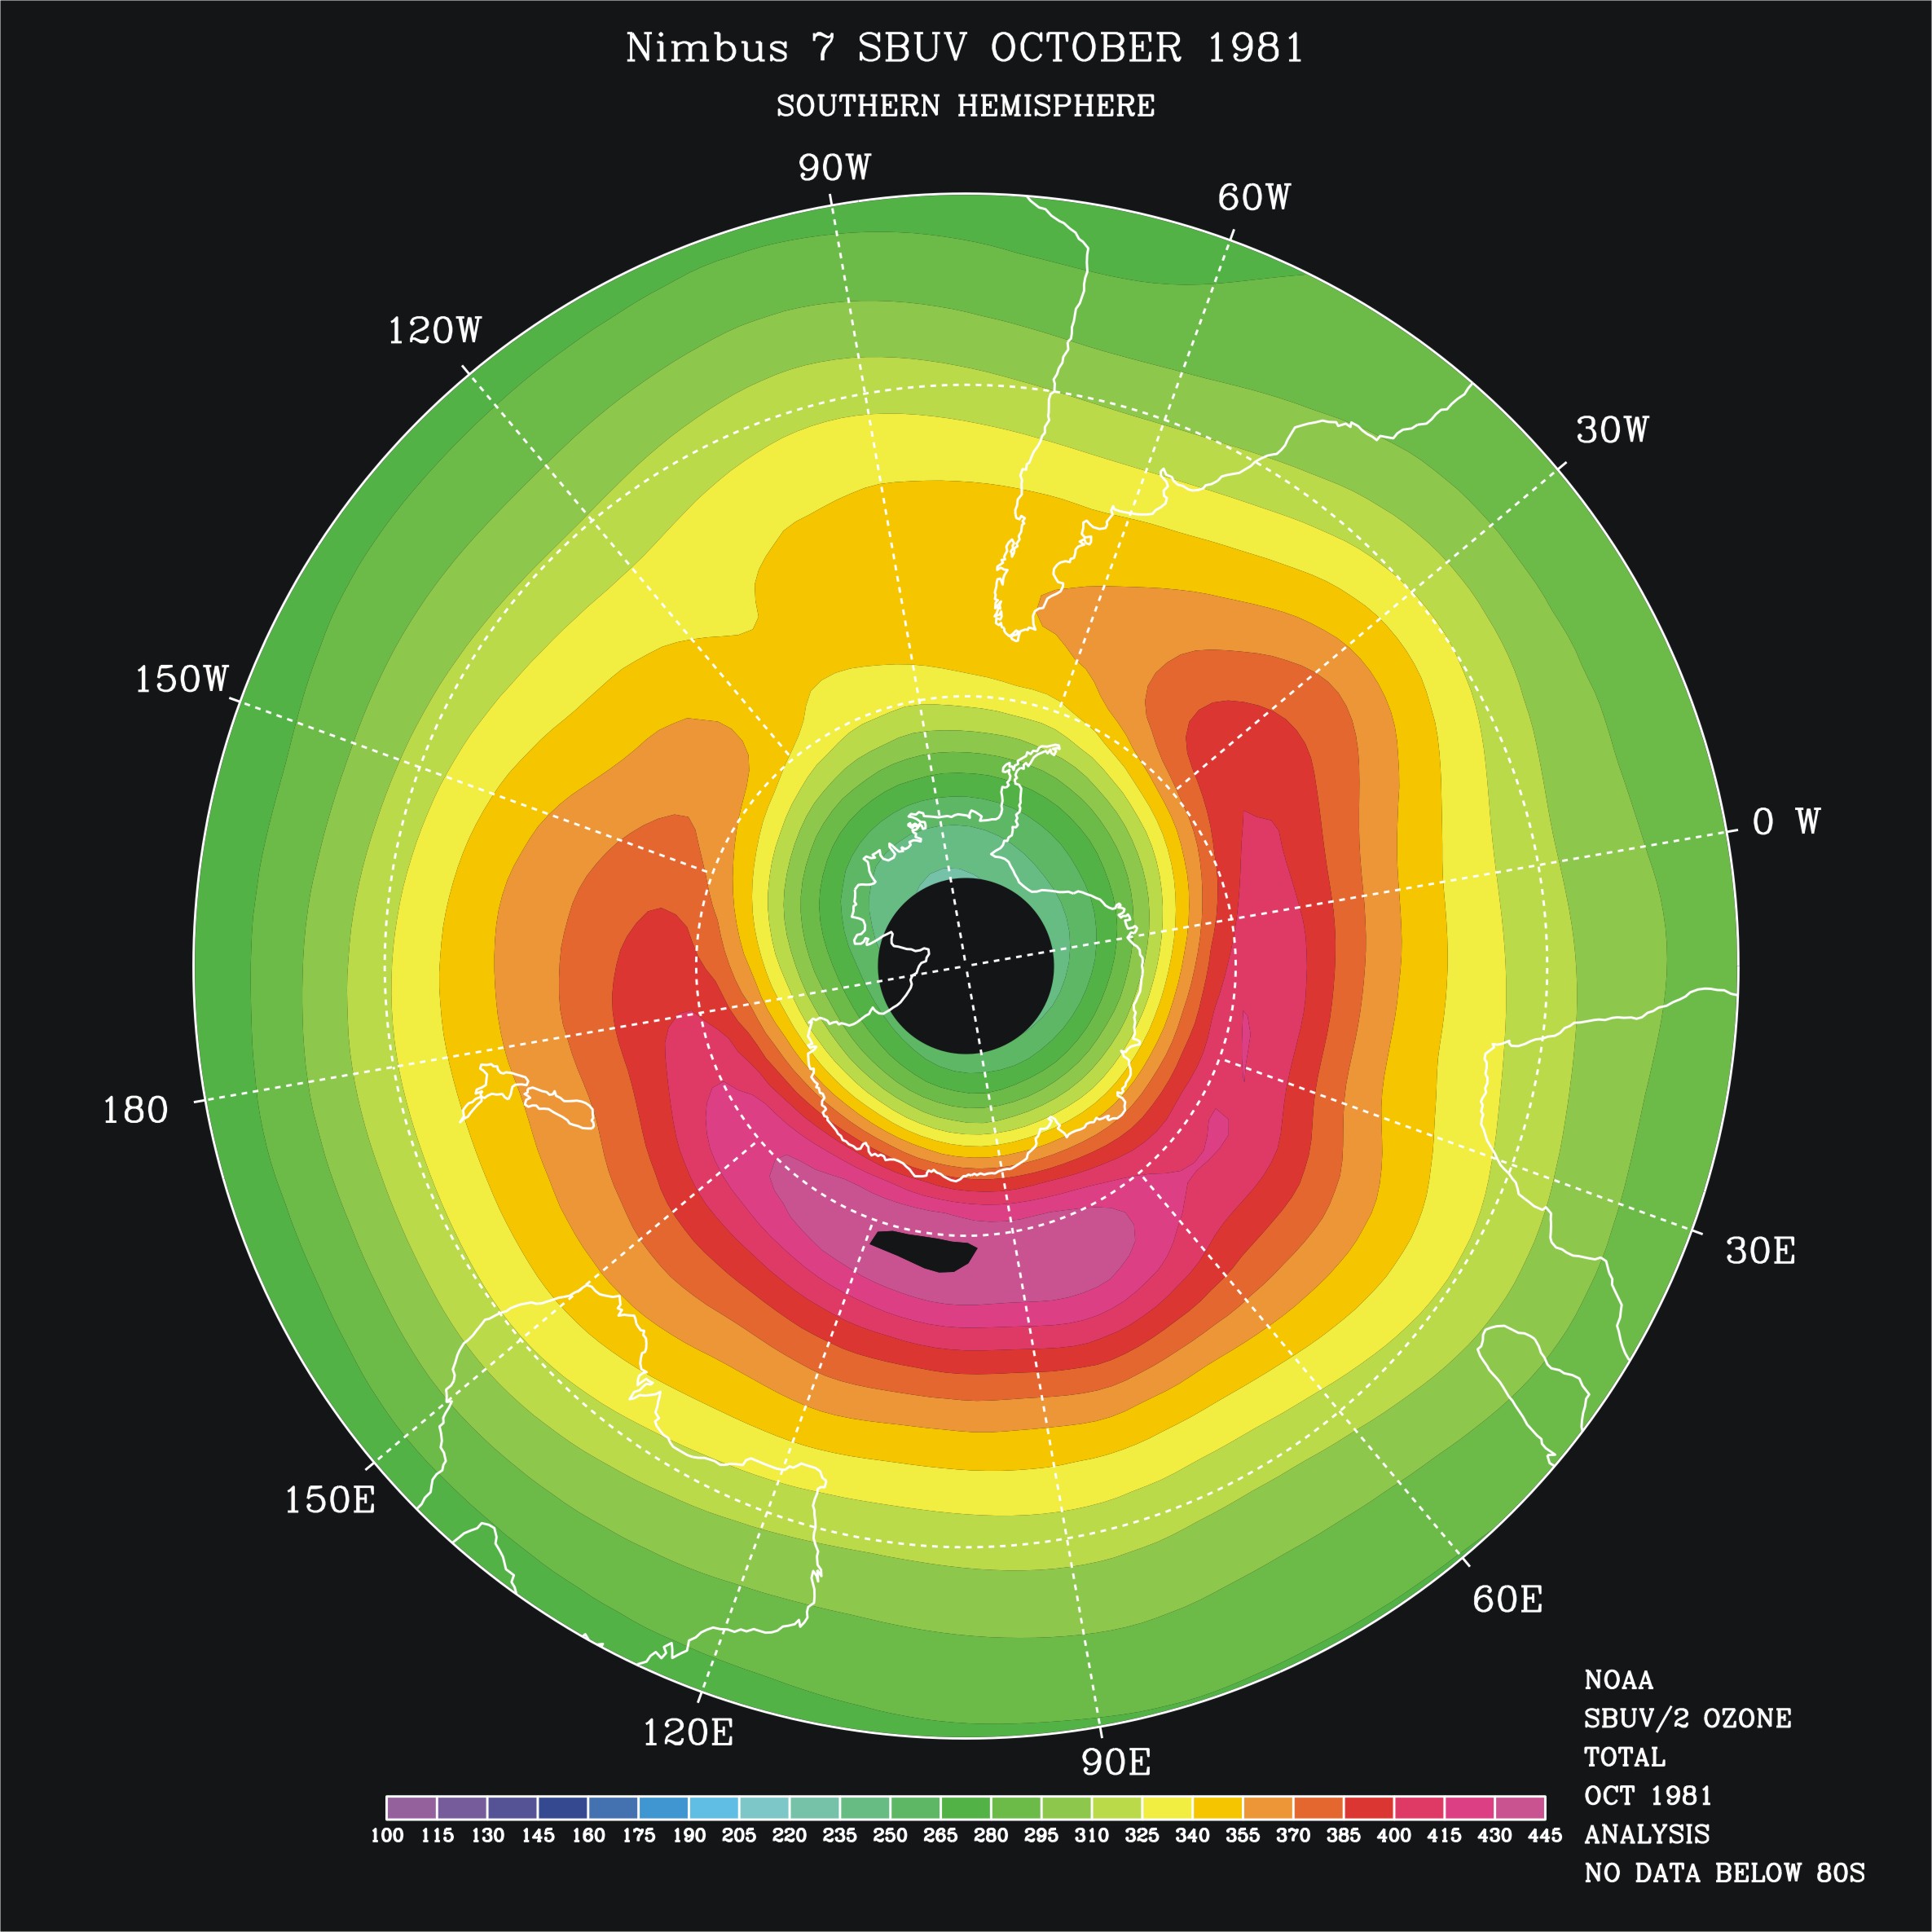
This is a false color contour map of the total atmospheric ozone. The map shows the mean total ozone for the month of October 1981 over the southern hemisphere as measured by the Nimbus-7 SBUV instrument. The ozone amounts vary from a quasi-circular region over the Antarctic continent with lows down to 220 Dobson Units to a broad collar region from 50 to 70 S extending from the South Atlantic eastward beyond New Zealand with values as high as 440 Dobson Units. The values drop off toward lows of 250 DU as one moves toward the Equator.