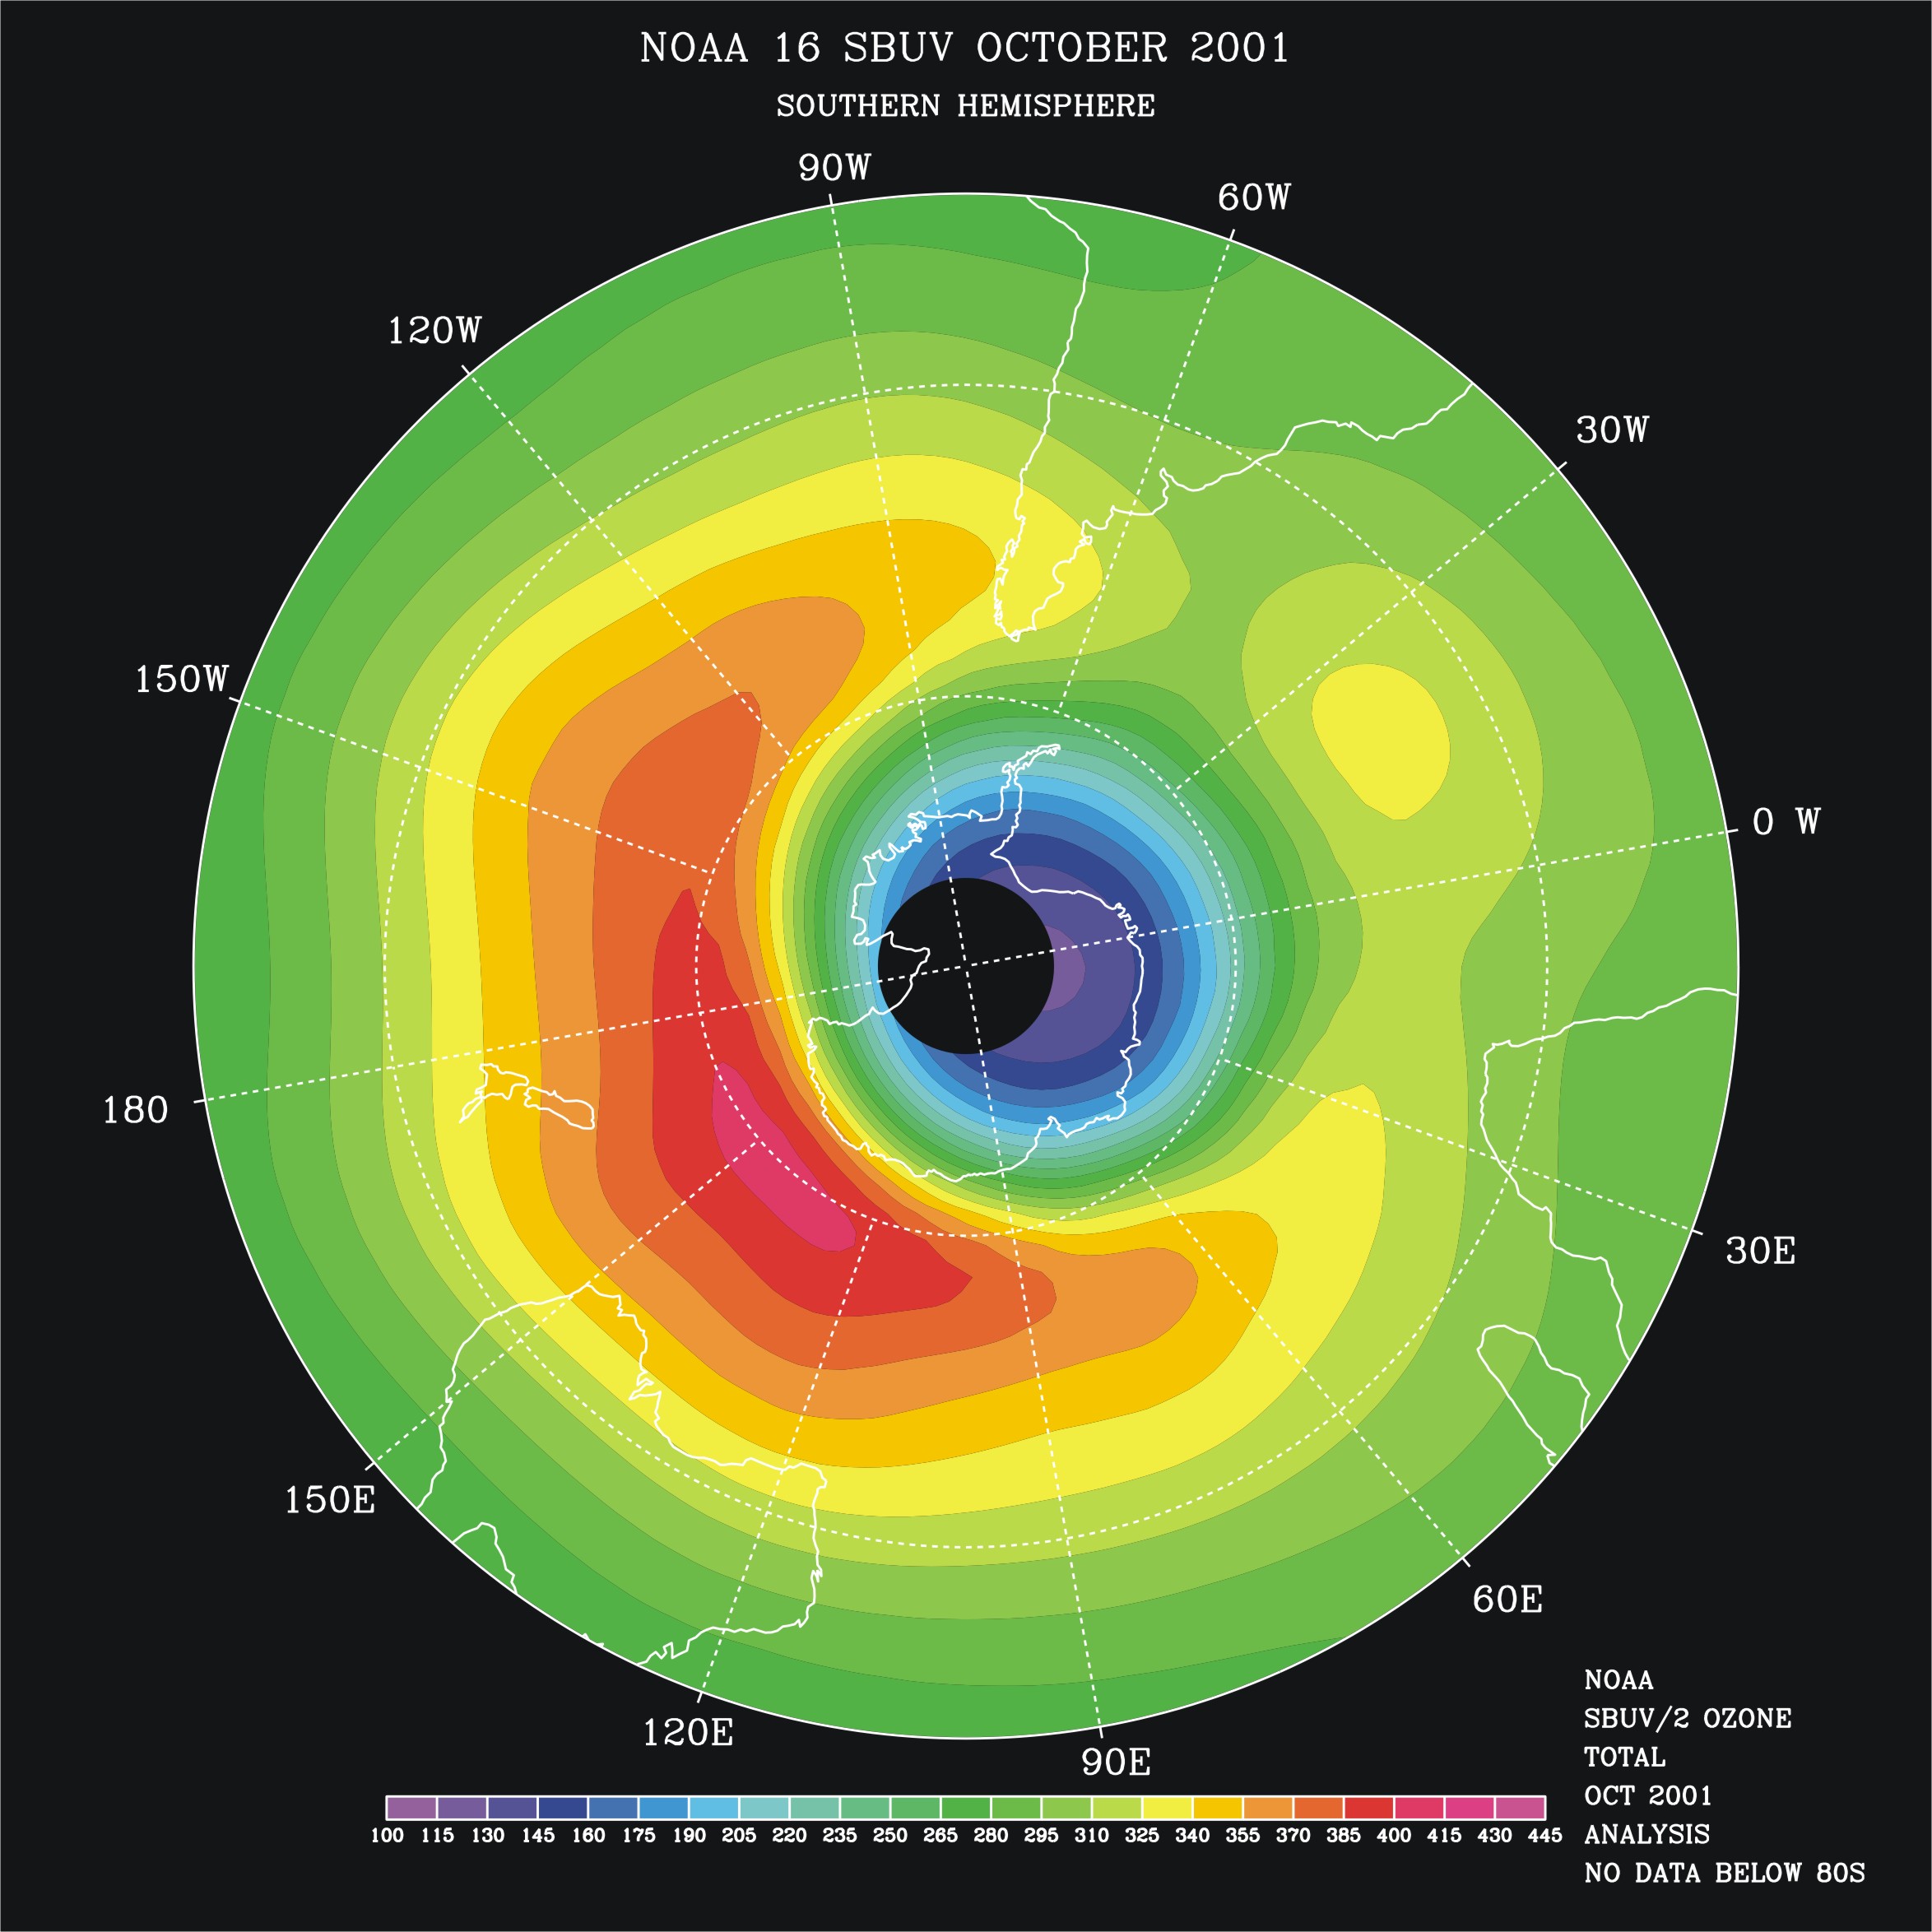
This is another false color contour map of the total atmospheric ozone. It should be contrasted to the map in 1081_total.jpg. This map shows the mean ozone for the month of October 2001 (20 years later than 1081_total.jpg) over the southern hemisphere as measured by the NOAA-16 SBUV/2 instrument. The ozone amounts vary from a quasi-circular region over the Antarctic continent with lows down to 115 Dobson Units to a collar region from 60 to 70 S south of Australia with values as high as 410 DU. The low ozone amounts now form the Ozone hole (as defined by values below 220 DU) over much of the Antarctic Circle. The high collar is still present, but the area and maximum values are both reduced. The values drop off toward lows of 250 DU as one moves toward the Equator, similar to the 1981 results.