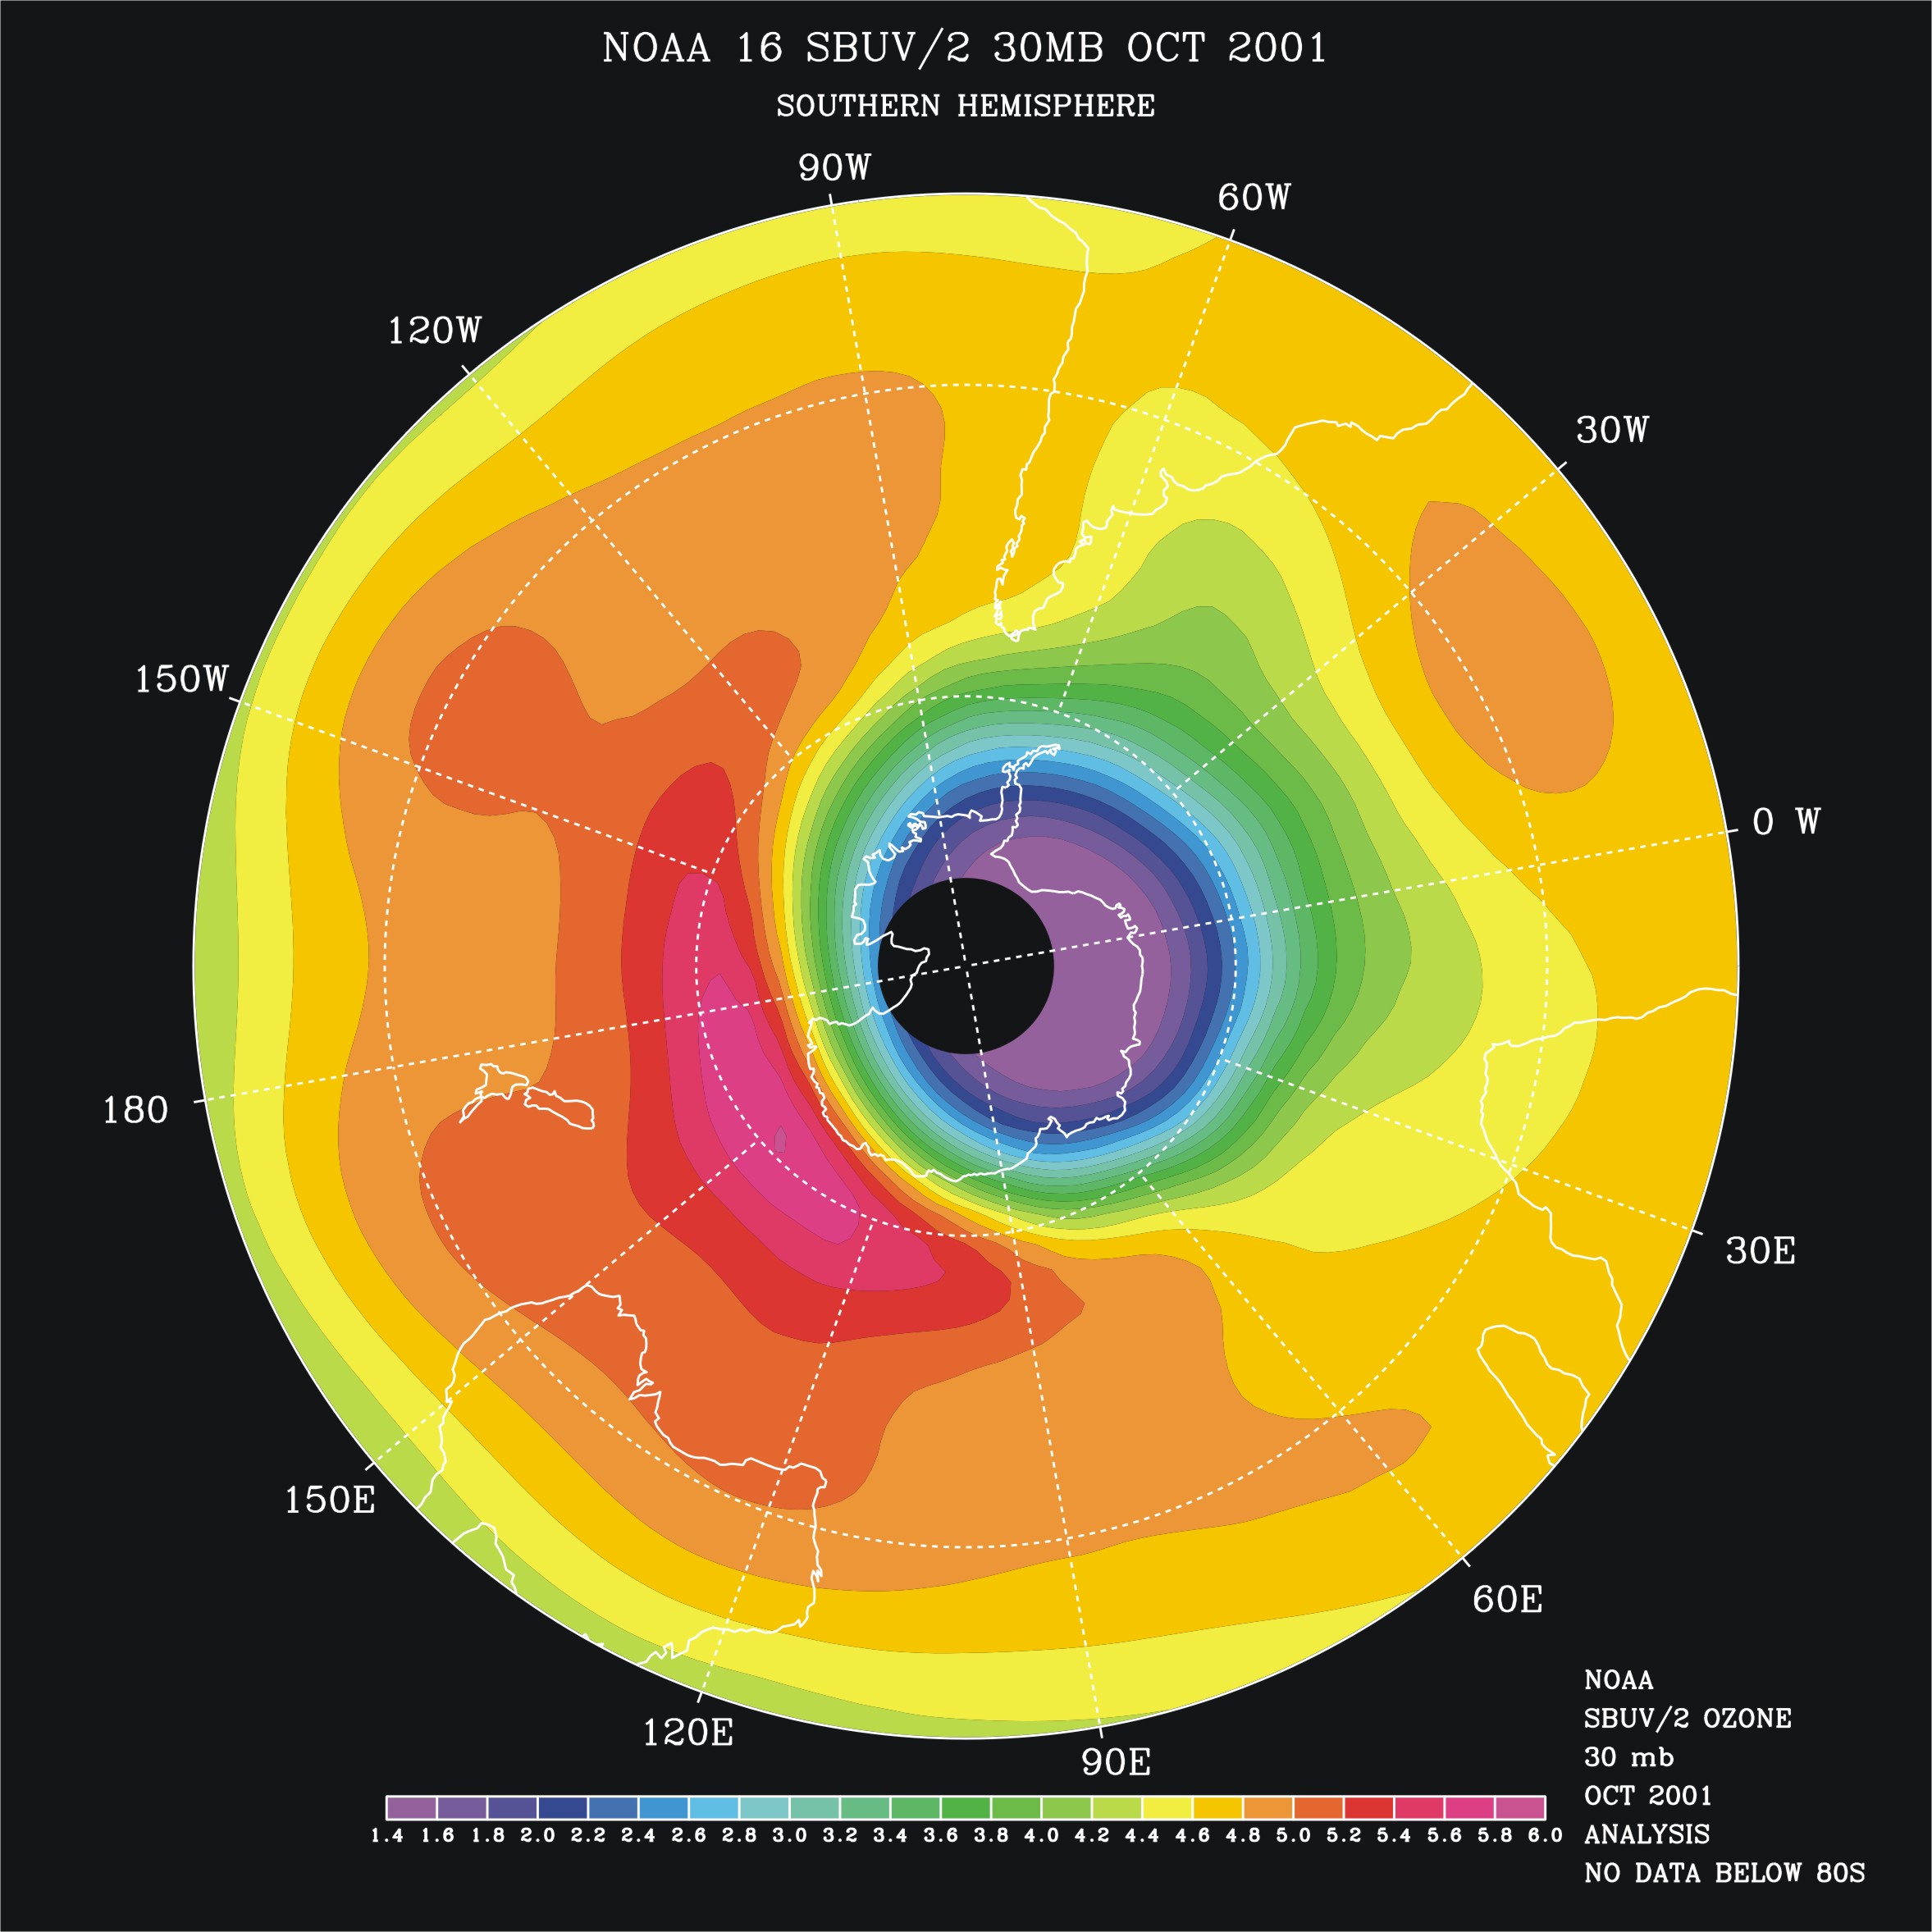
This is another false color contour map of the atmospheric ozone mixing ratio at 30 mbar. It should be contrasted to the map in Figure 1081_30mb.jpg. This map shows the mean ozone for the month of October 2001 (20 years later than 1081_30mb.jpg) over the southern hemisphere as measured by the NOAA-16 SBUV/2 instrument. The ozone amounts vary from a quasi-circular region with lower ozone concentrations from 1.4 to 3.5 ppmv over the Antarctic continent to a collar region from 50 to 70 S from the Southern Indian Ocean eastward beyond New Zealand with higher concentrations up to 6.0 ppmv. The values drop off toward lows of 4 ppmv as one moves toward the Equator, similar to the 1981 results.