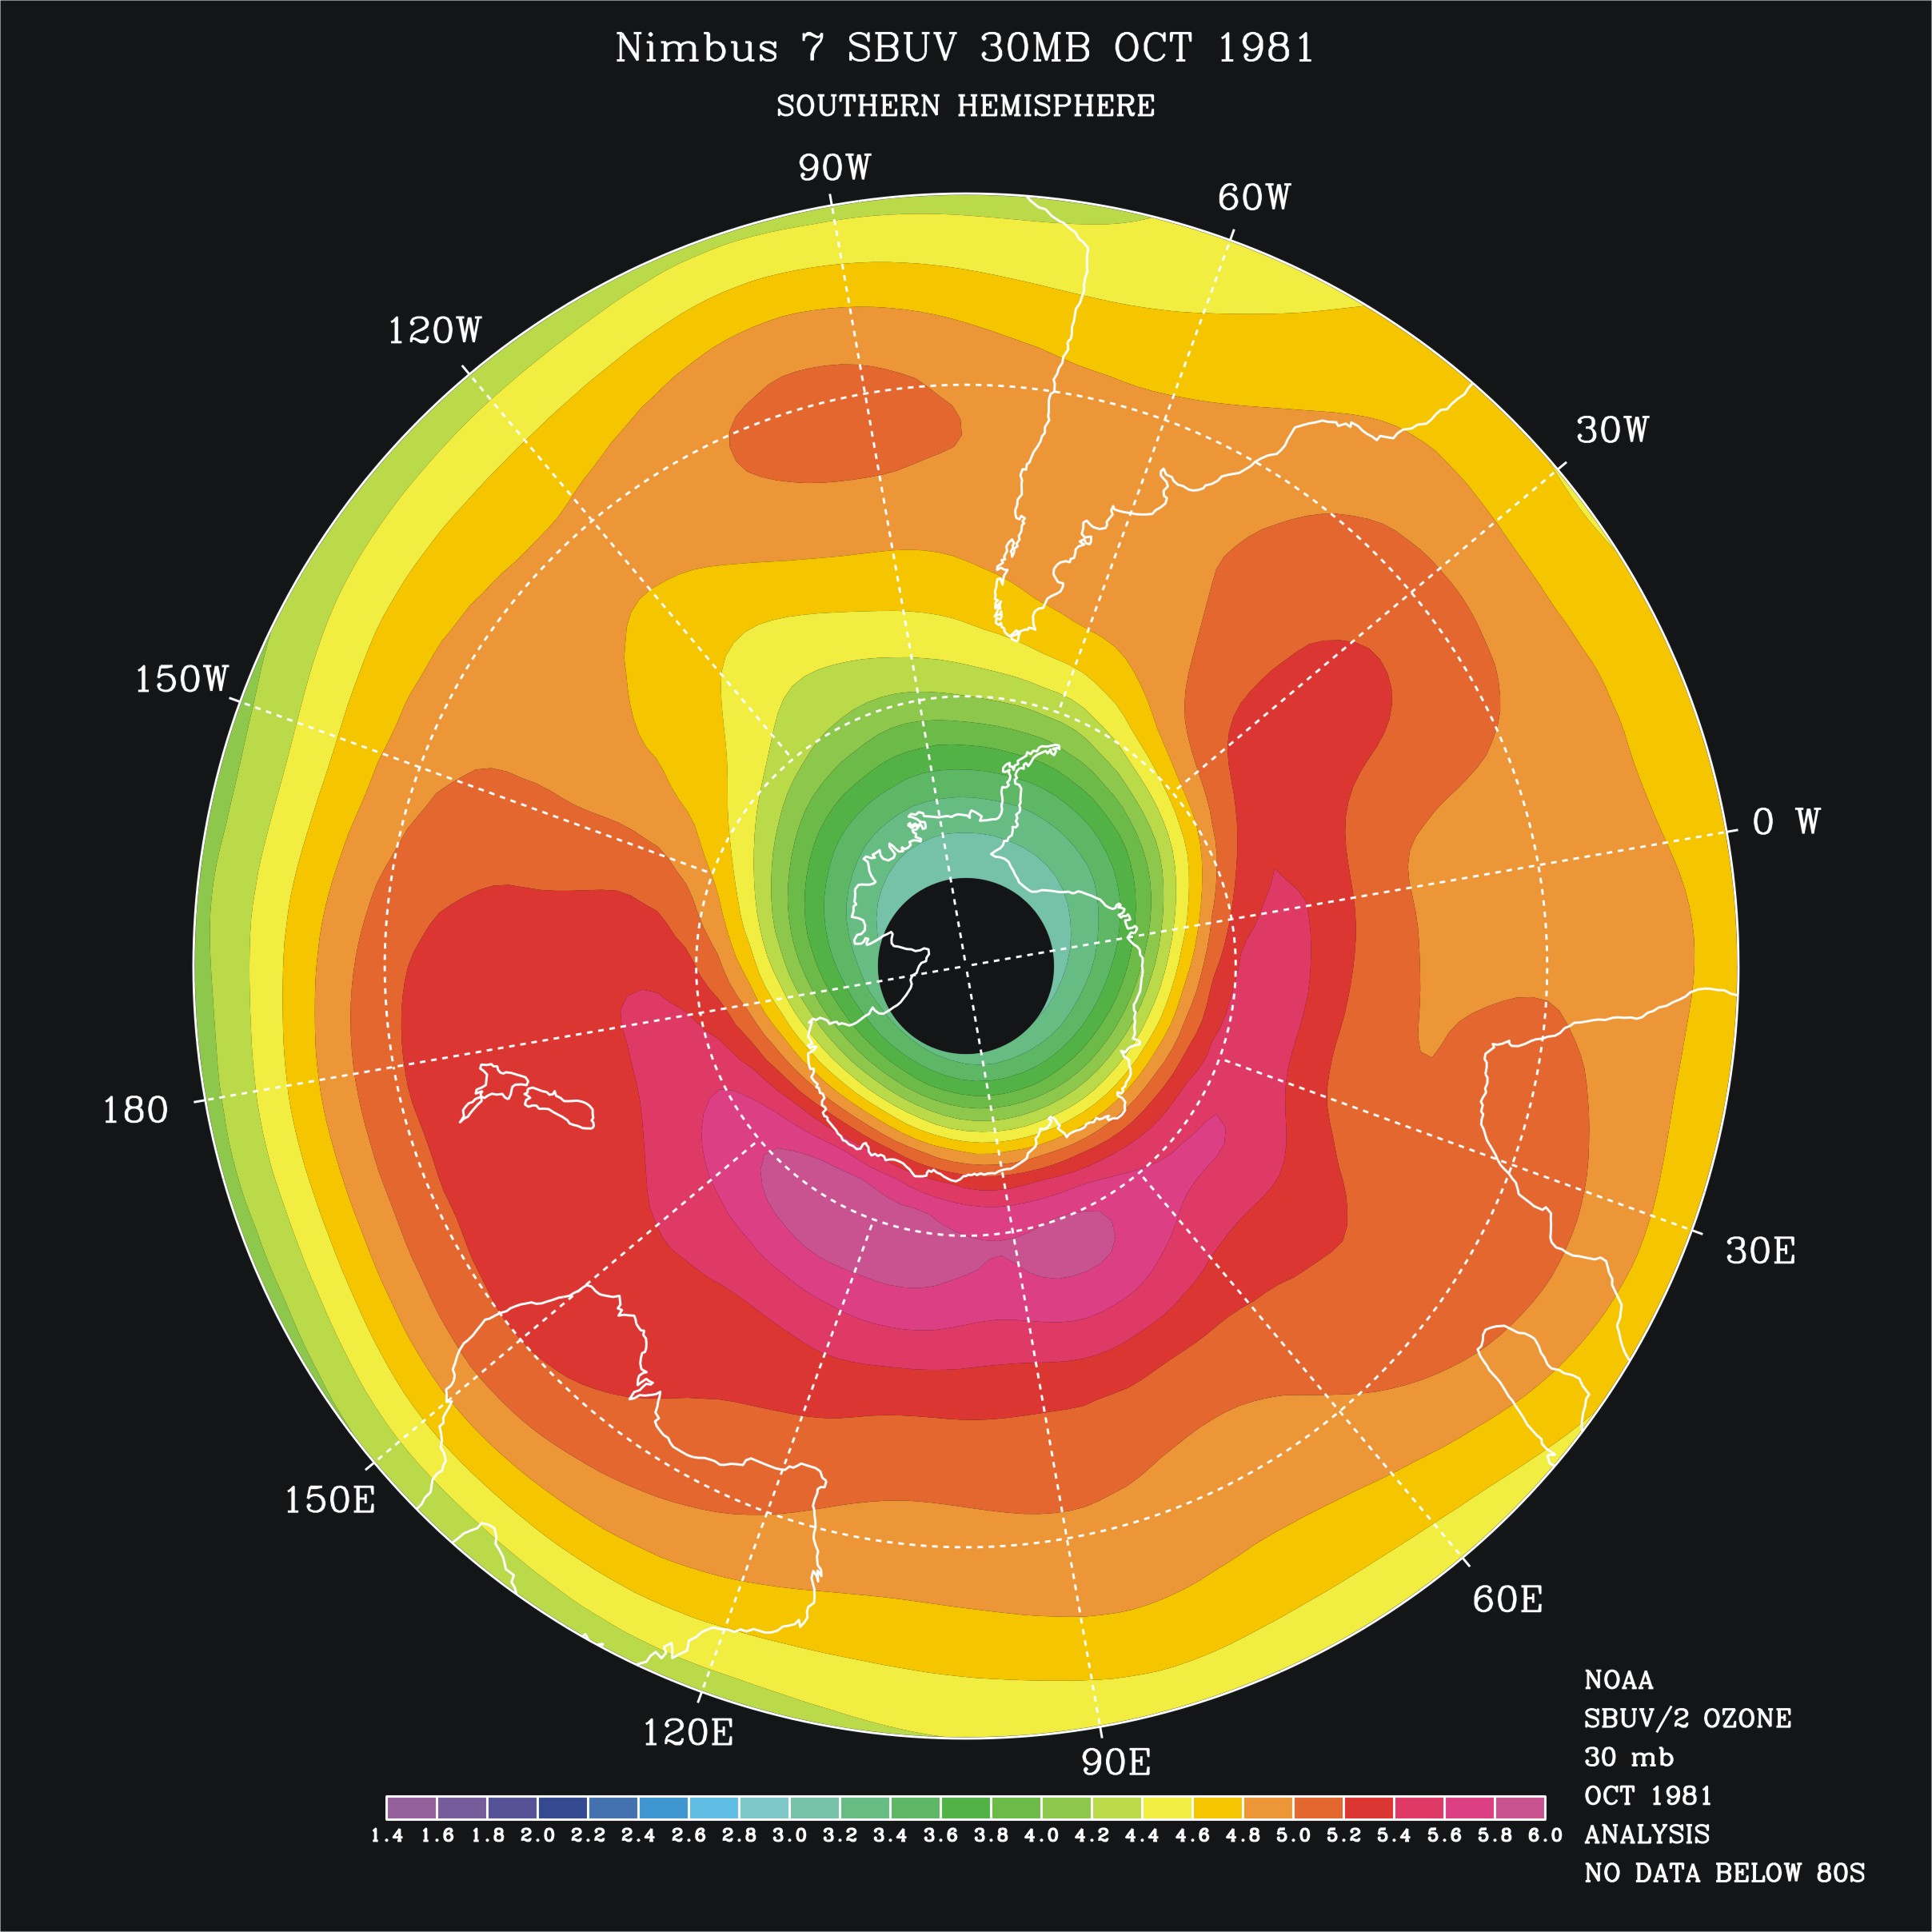
This is a false color contour map of the atmospheric ozone mixing ratio at 30 mbar. The map shows the mean ozone for the month of October 1981 over the southern hemisphere as measured by the Nimbus-7 SBUV instrument. The ozone amounts vary from a quasi-circular region with lower ozone concentrations from 2.8 to 3.8 ppmv over the Antarctic continent and collar region from 40 to 70 S latitude from the South Atlantic eastward beyond New Zealand with higher concentrations up to 6.0 ppmv. The values drop off toward lows of 4.0 ppmv as one moves toward the Equator.