


The table below shows thumbnail images of the plots, so that you can get an overview. To view an individual plot more closely, click on its thumbnail image.
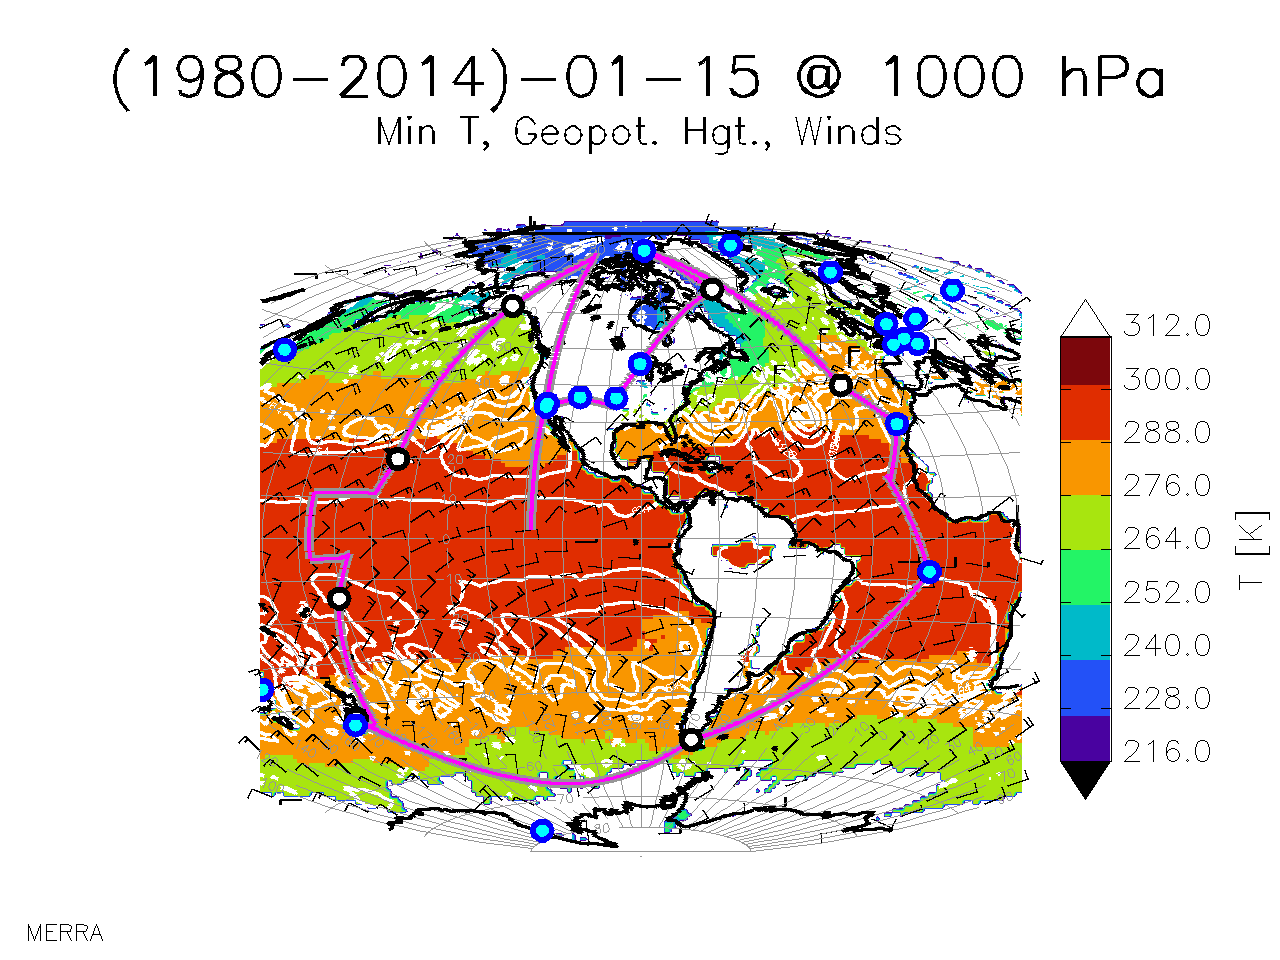
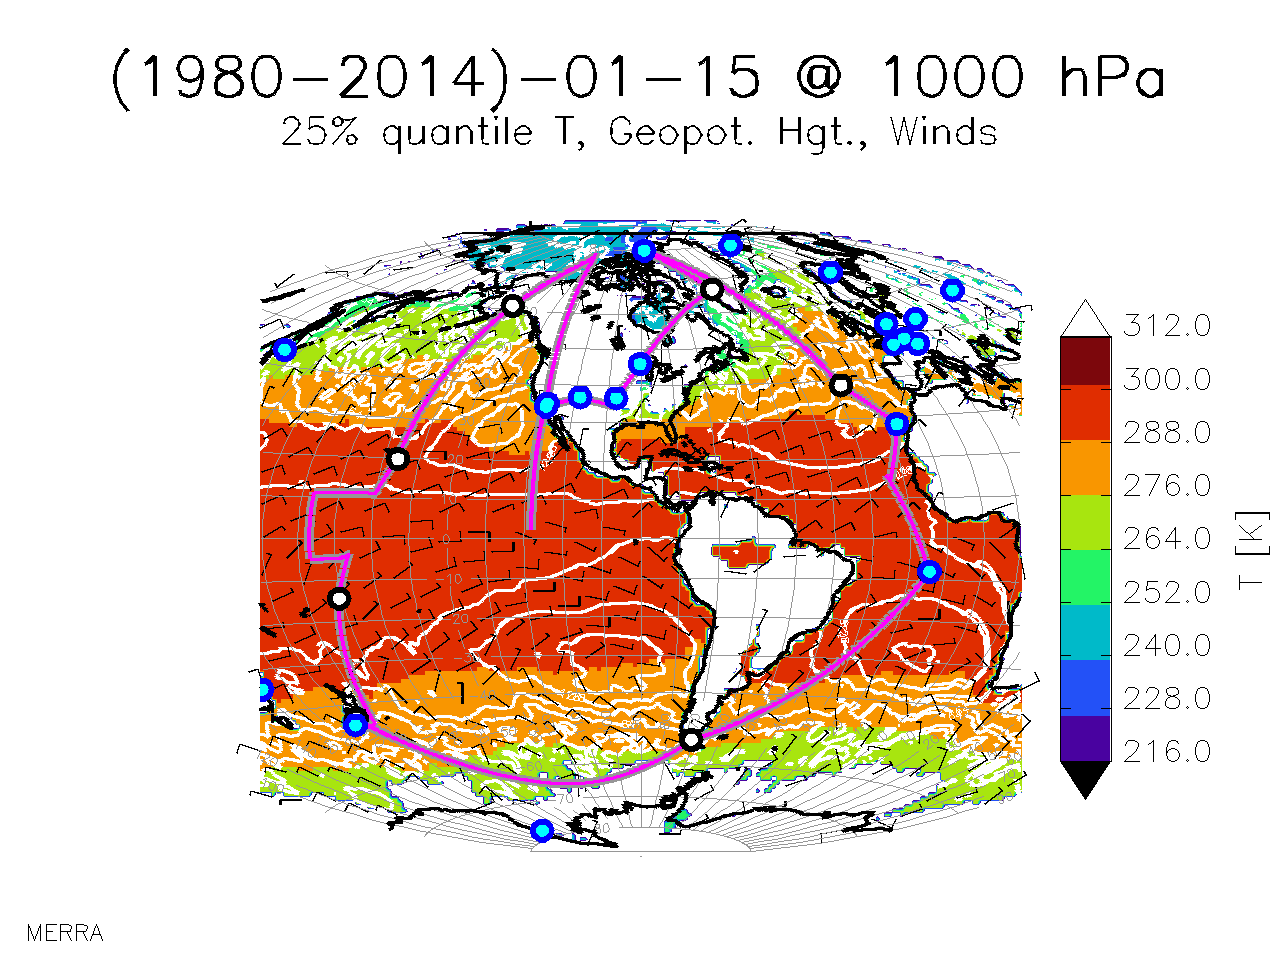
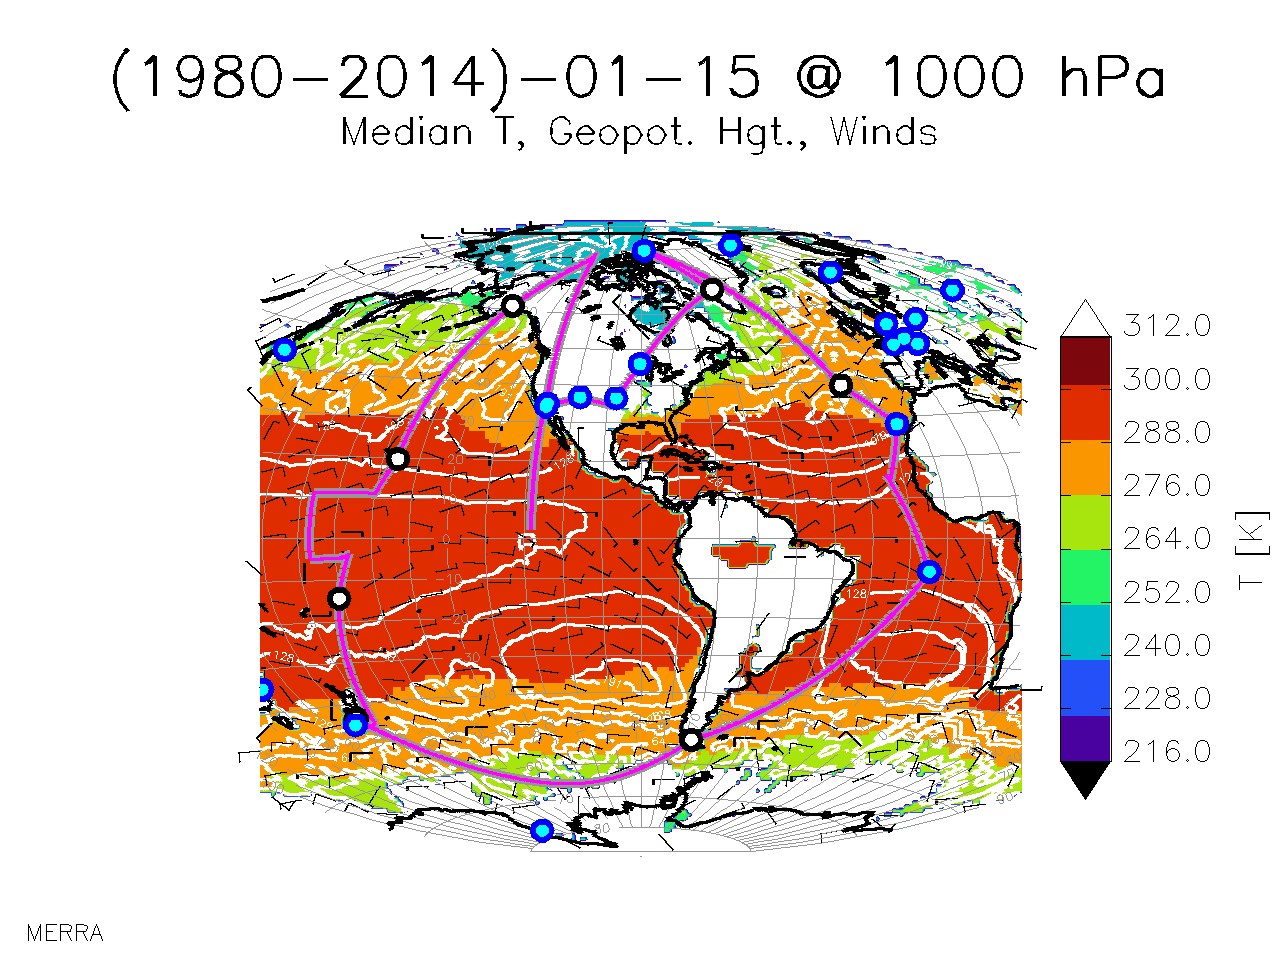
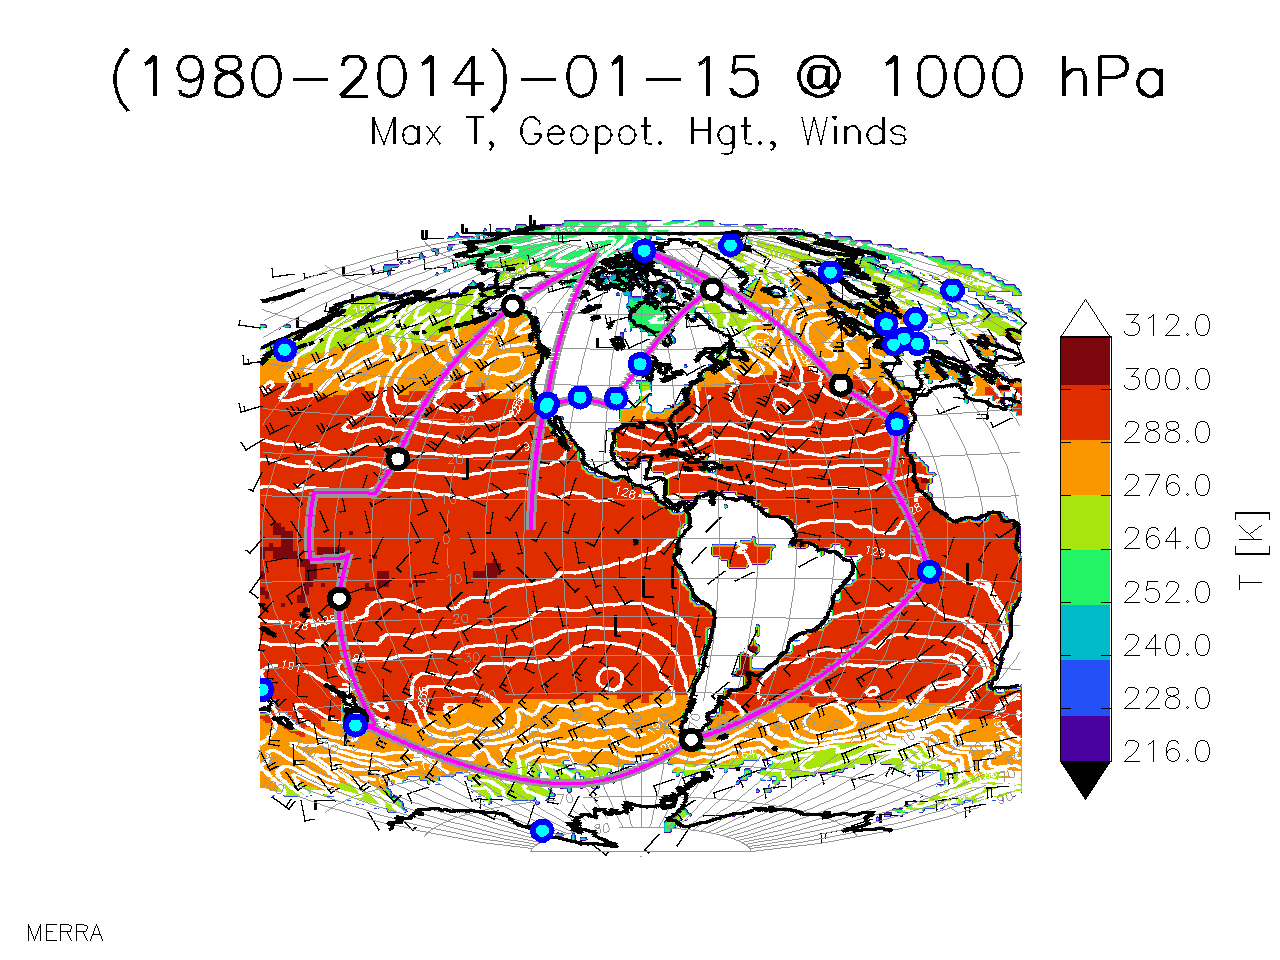
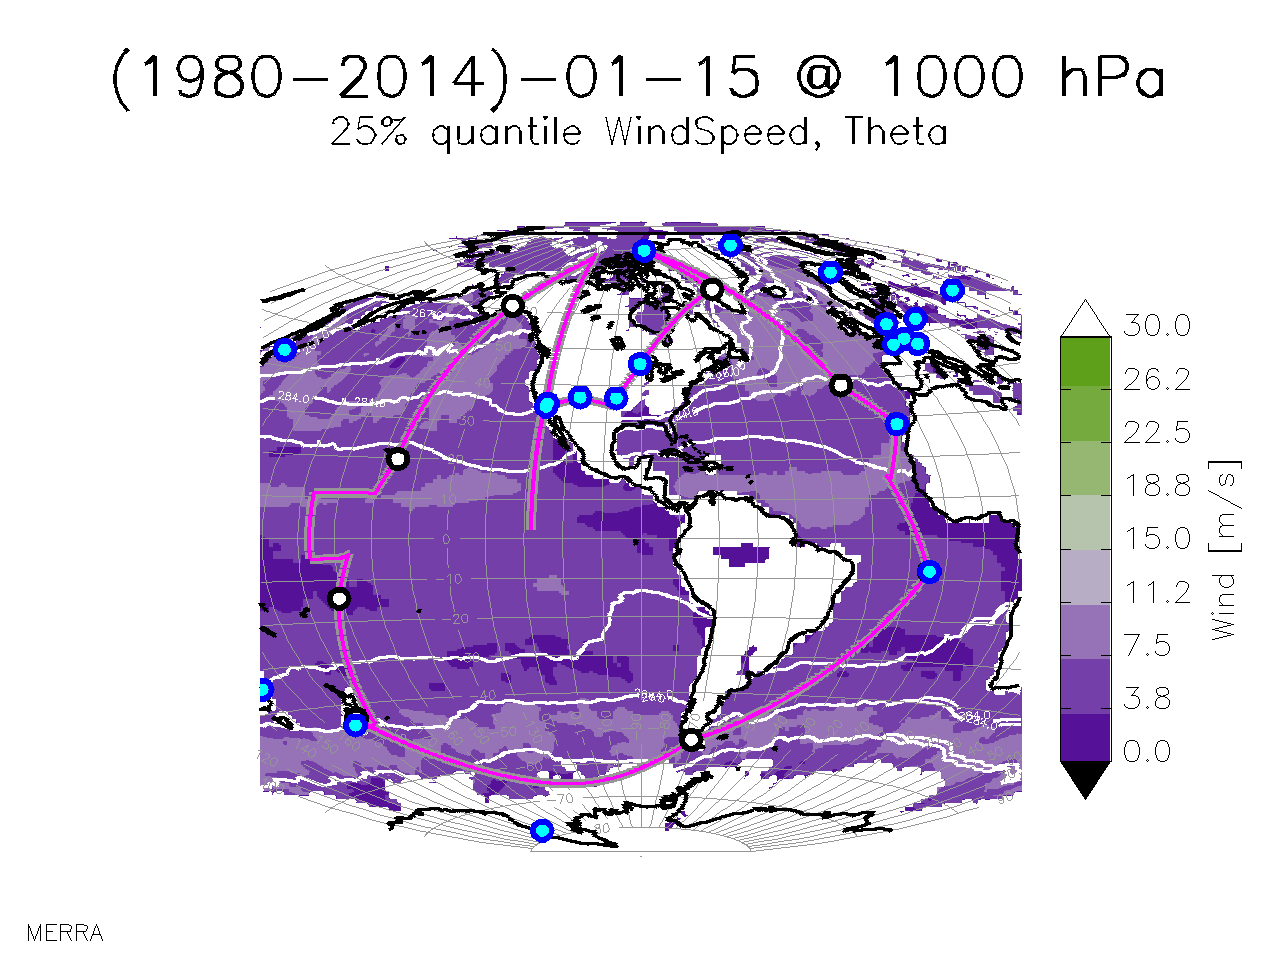
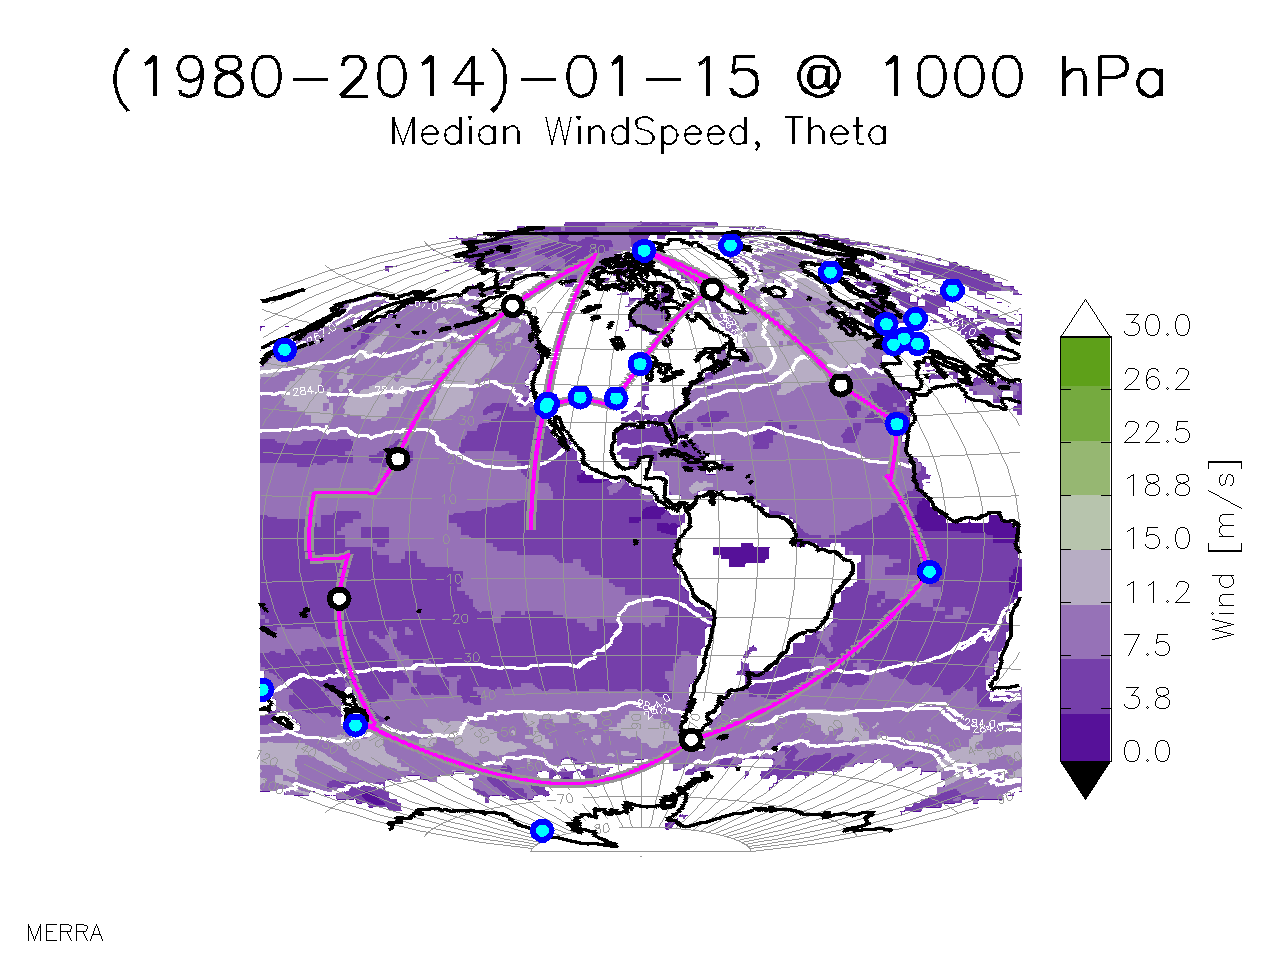
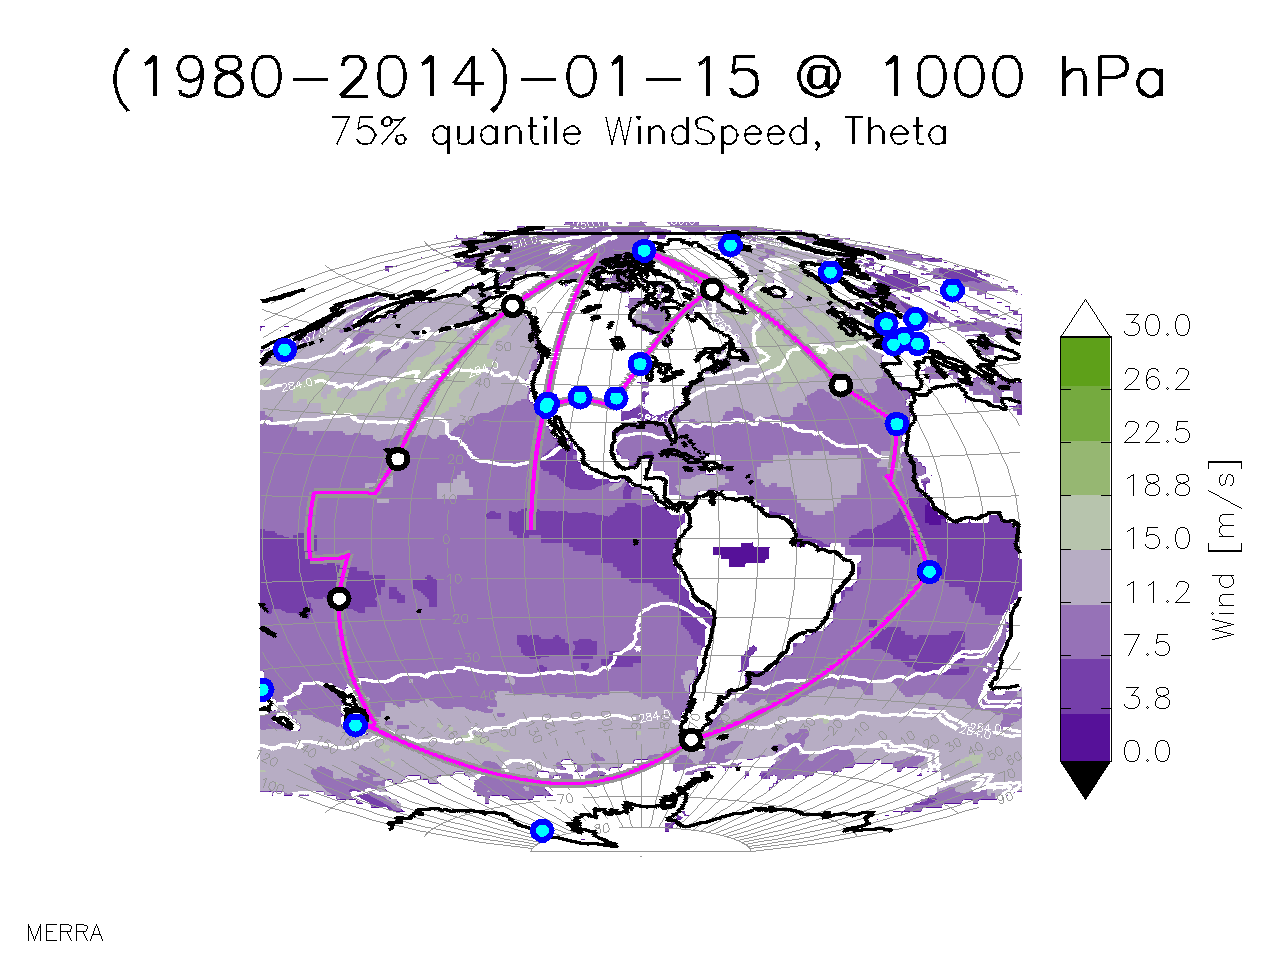
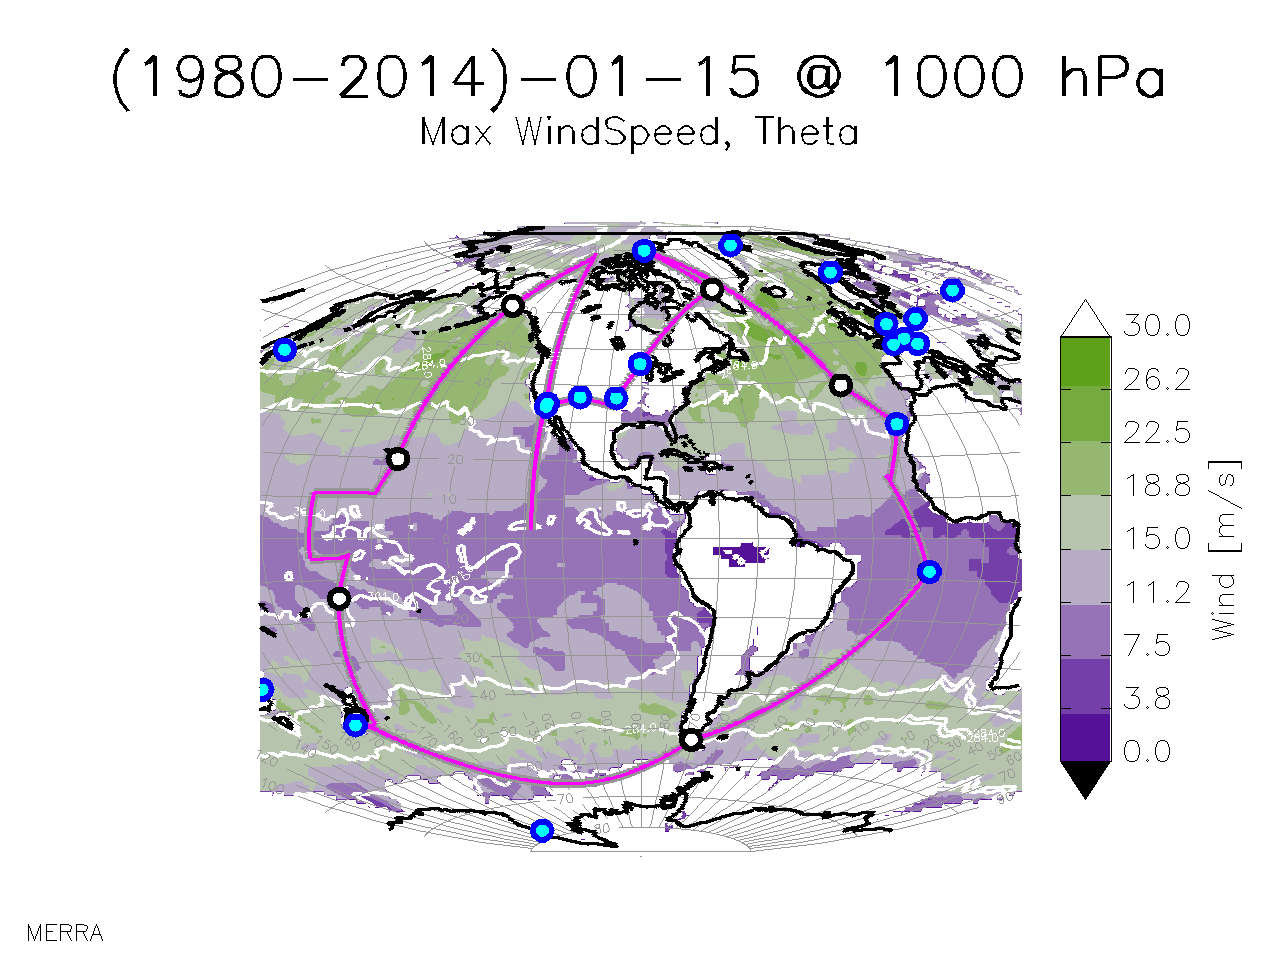
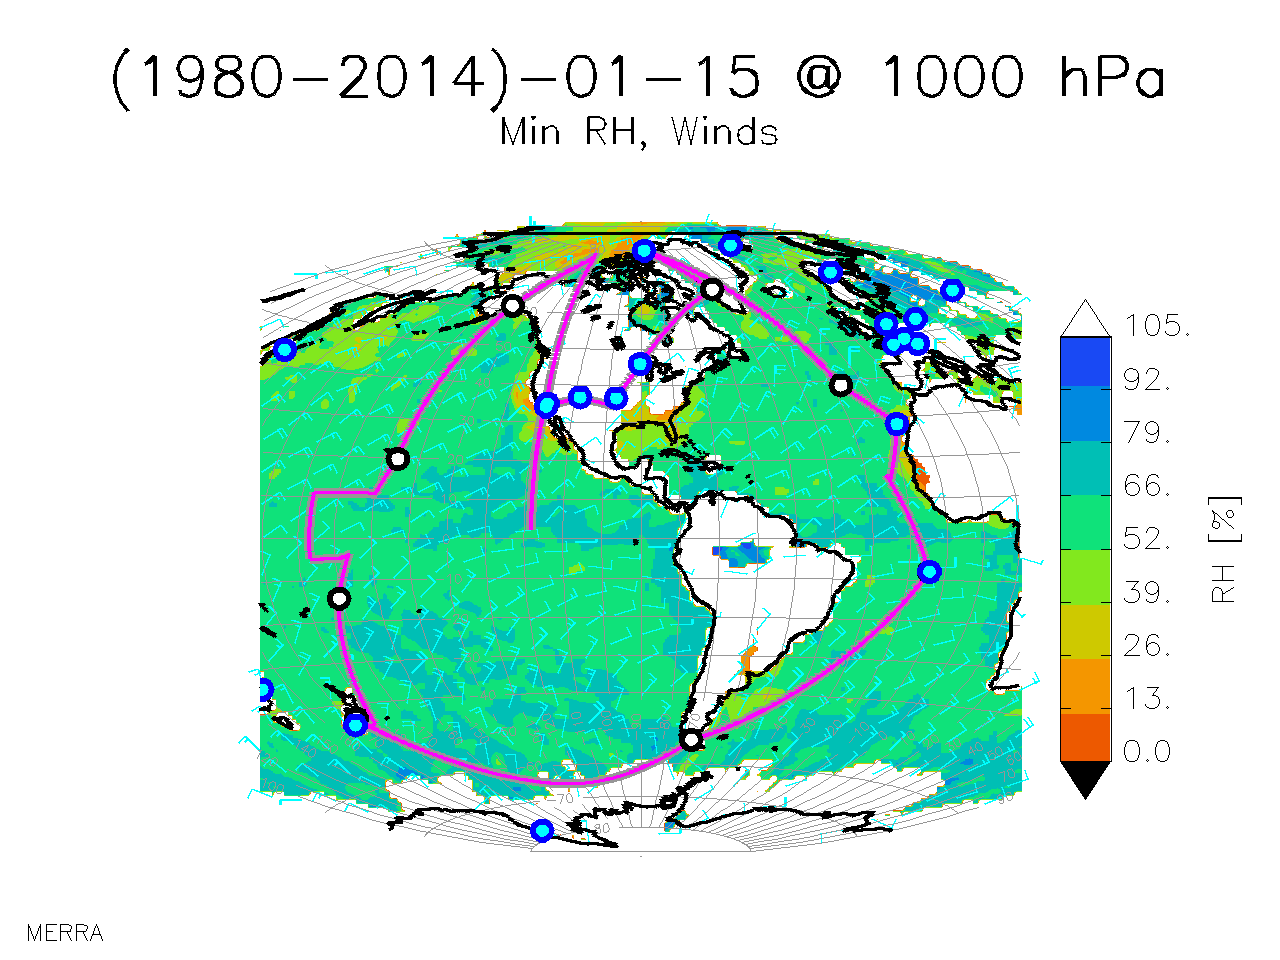
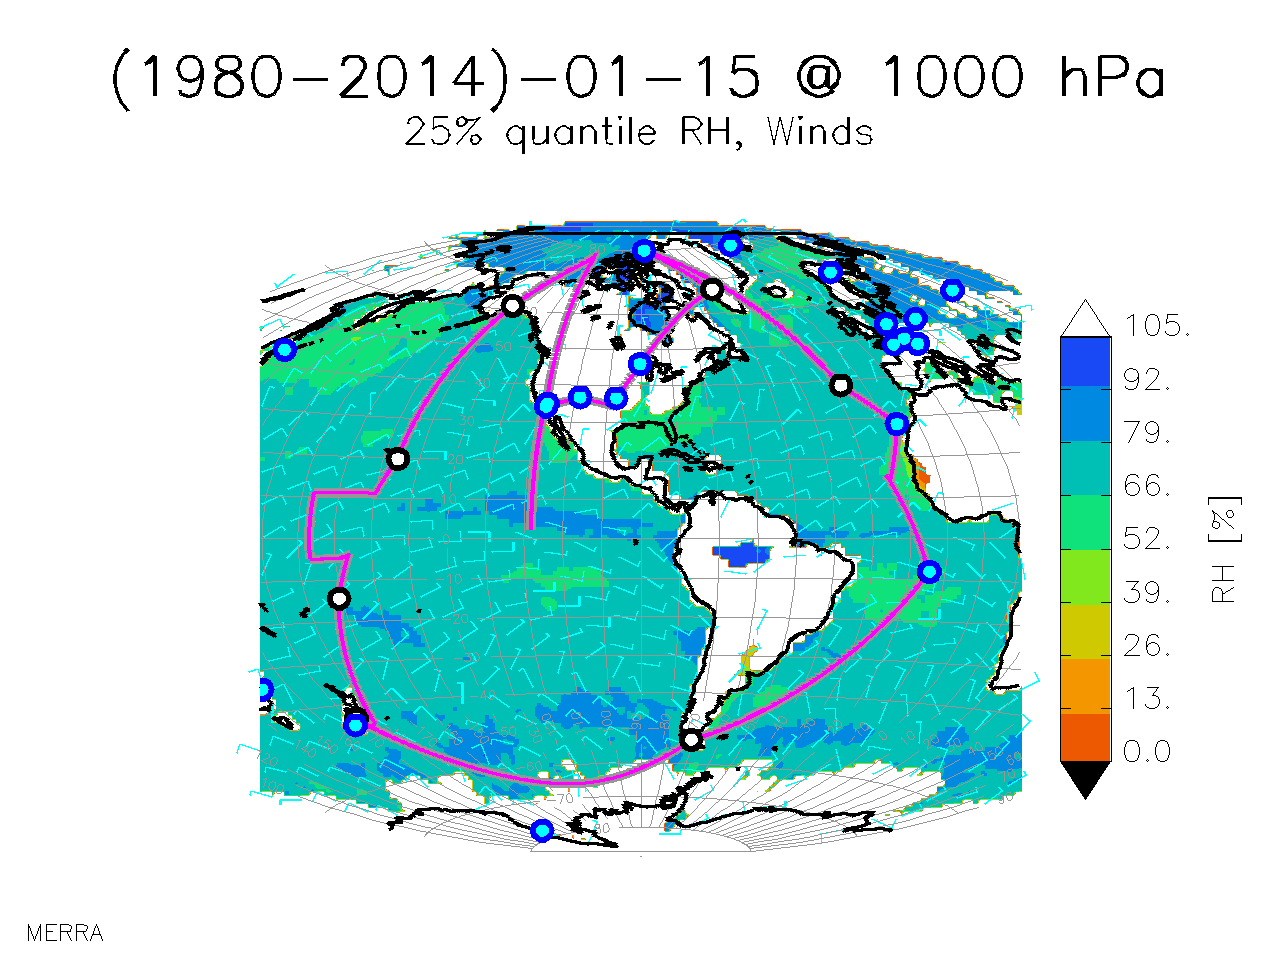
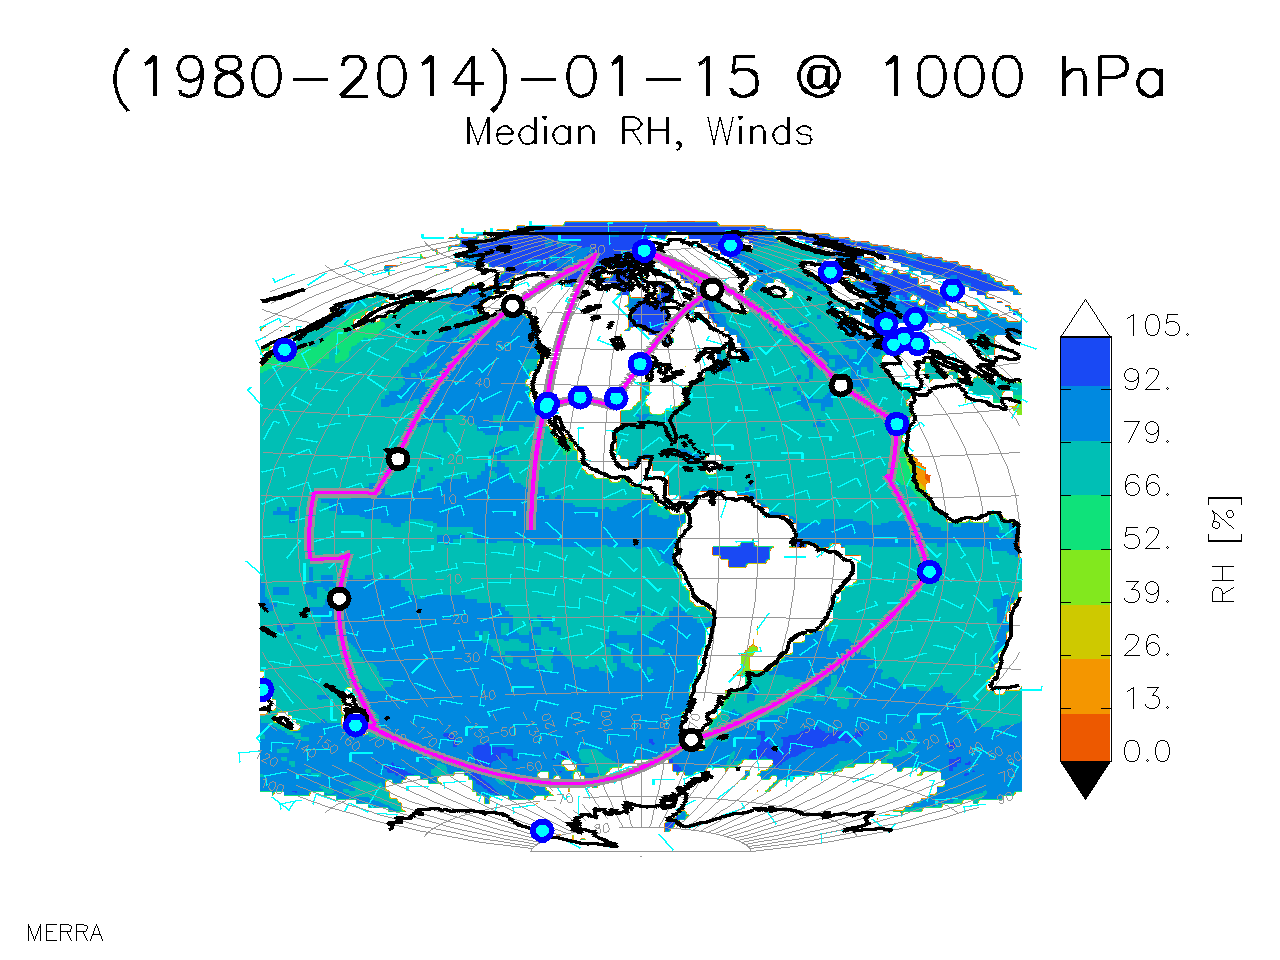
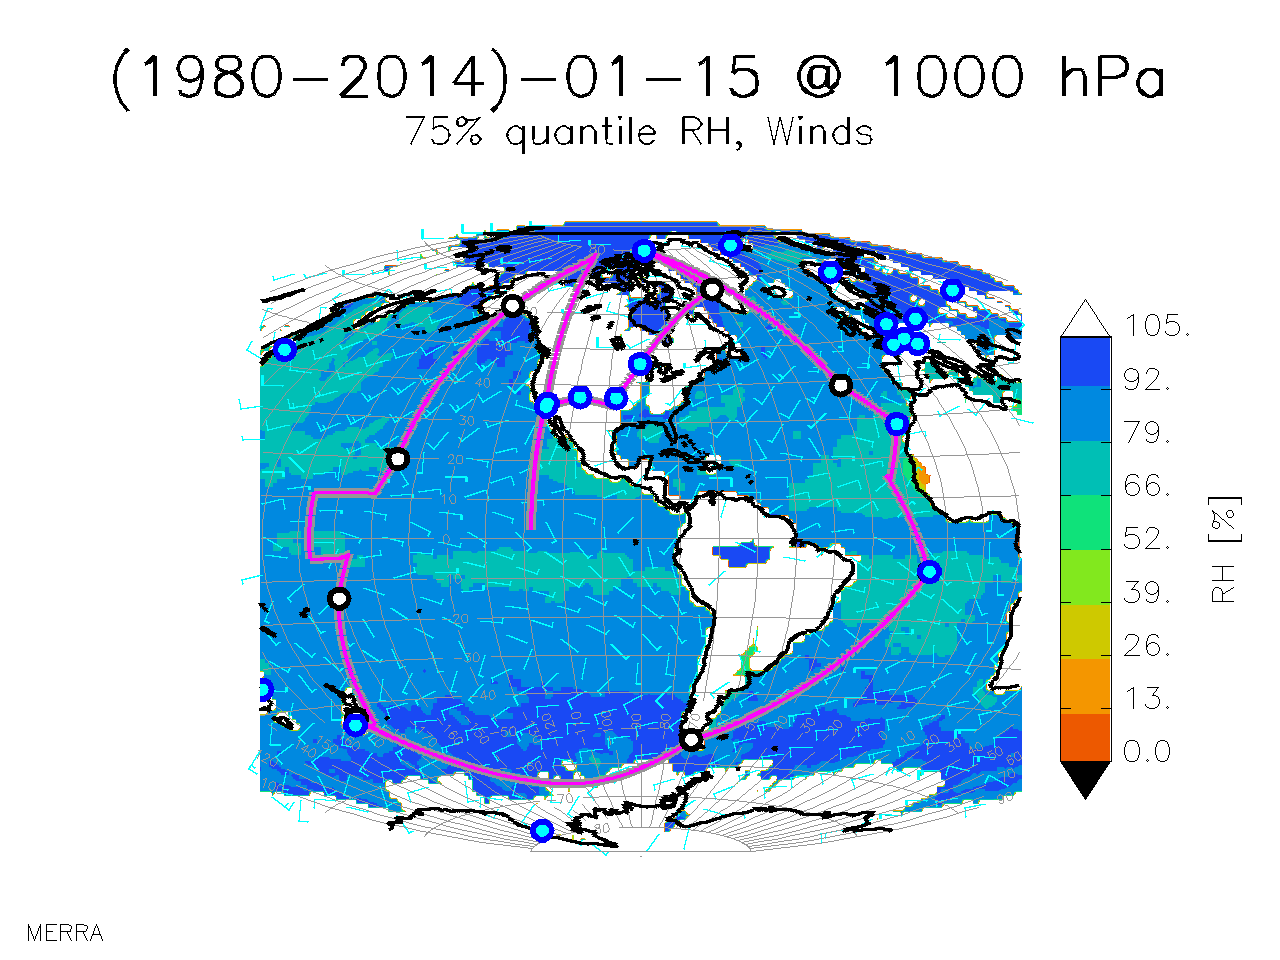
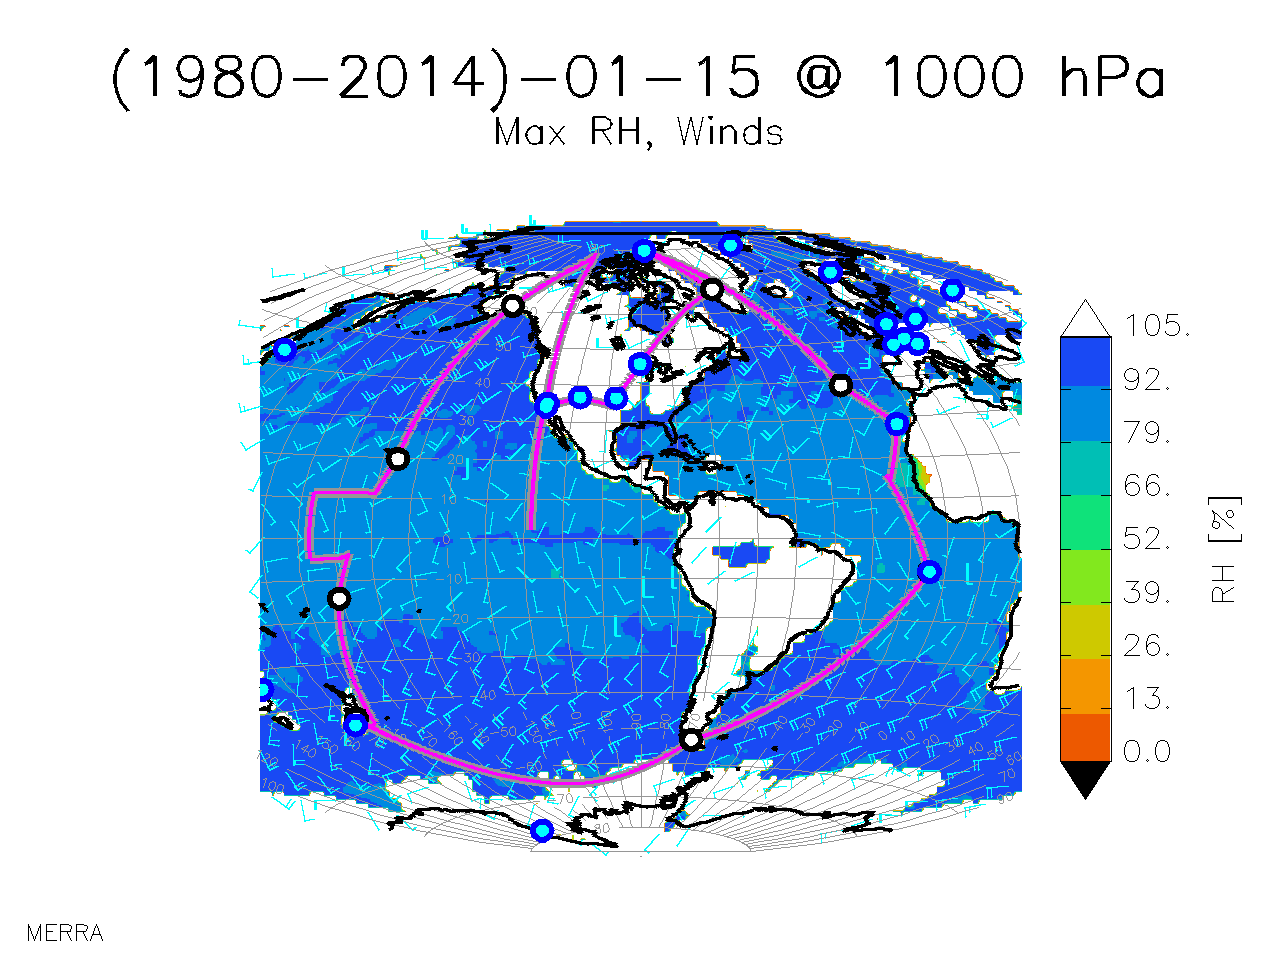
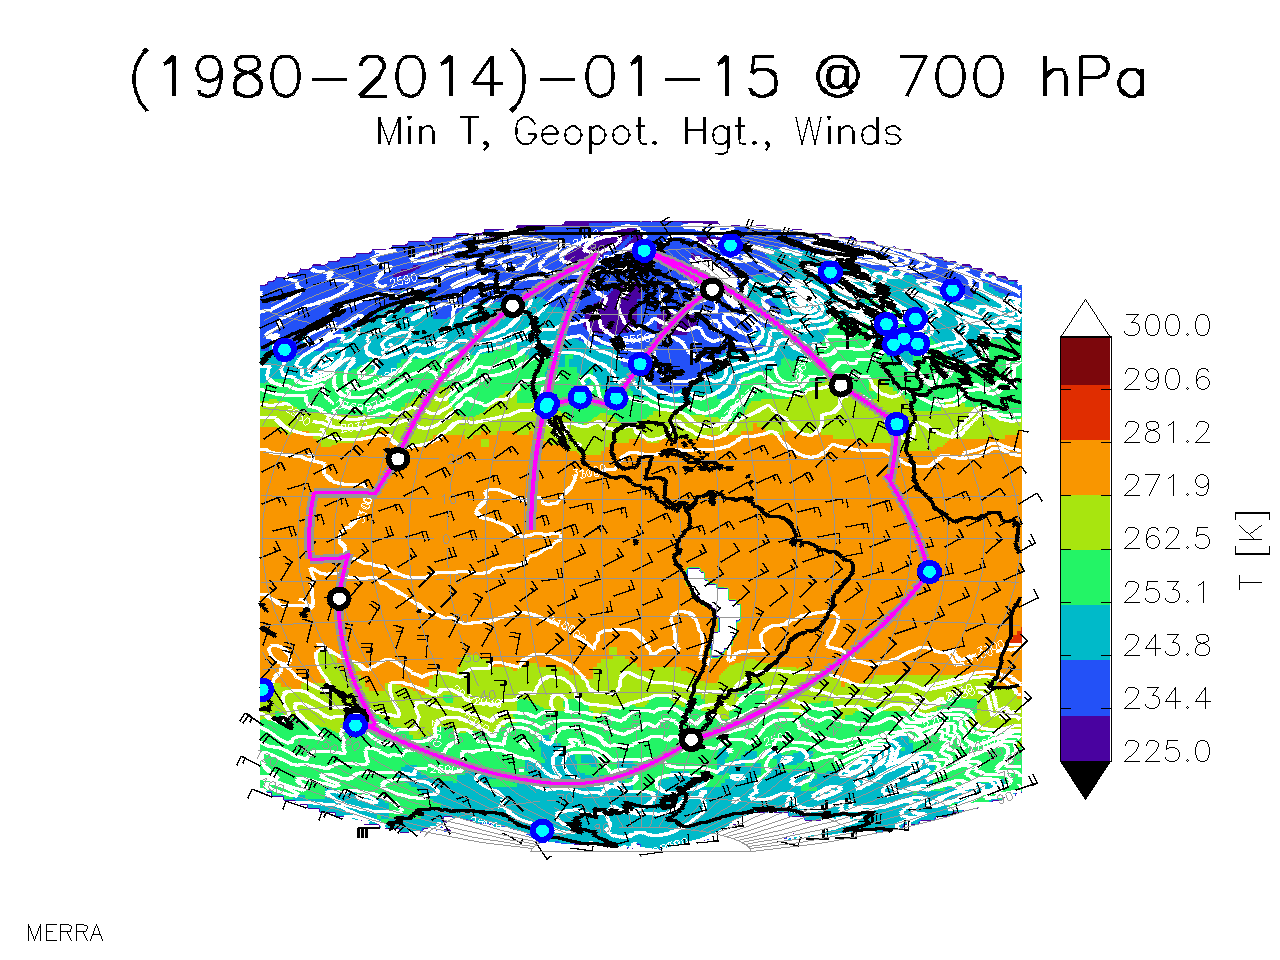
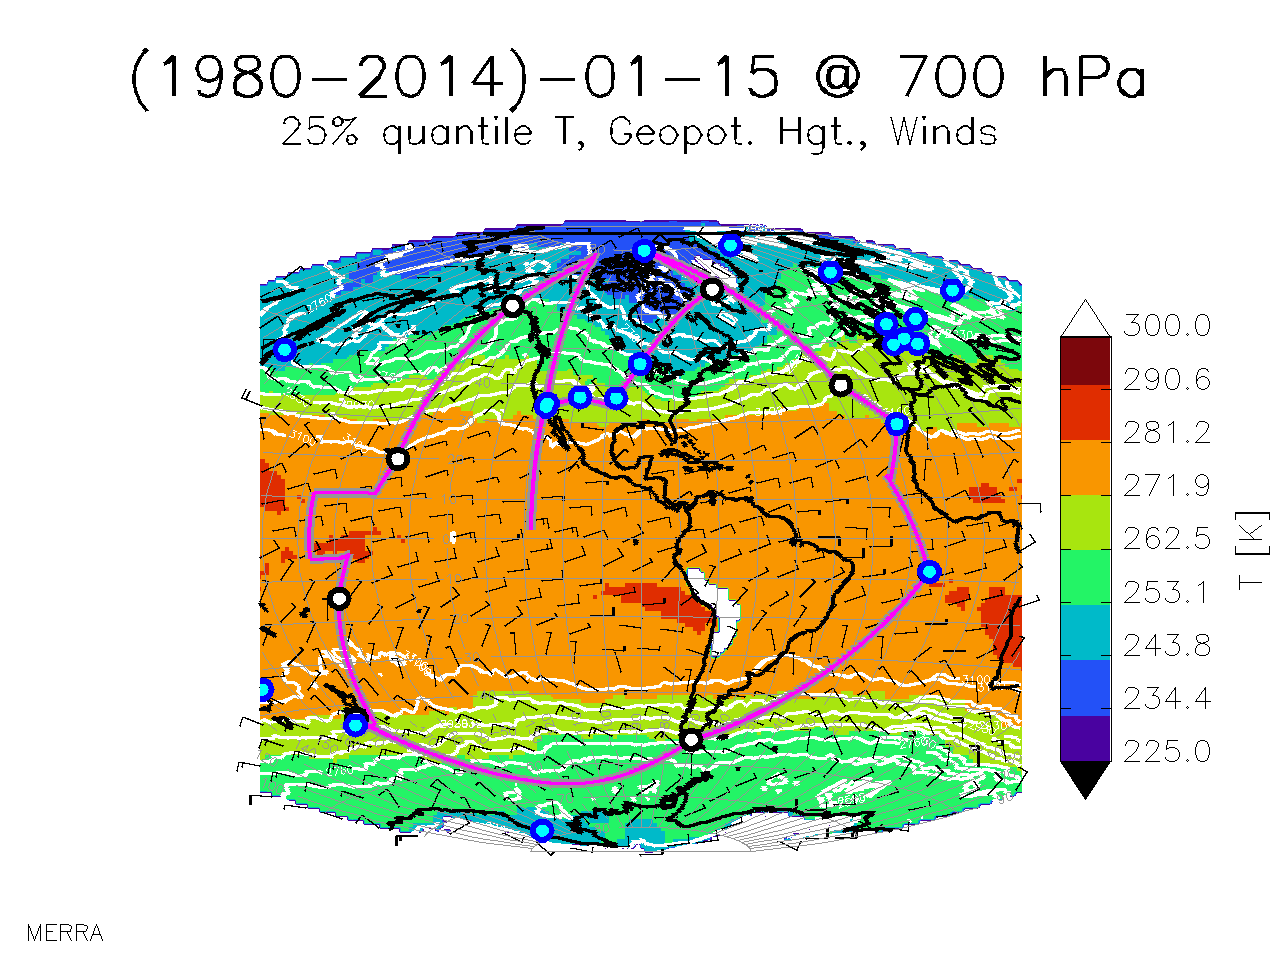
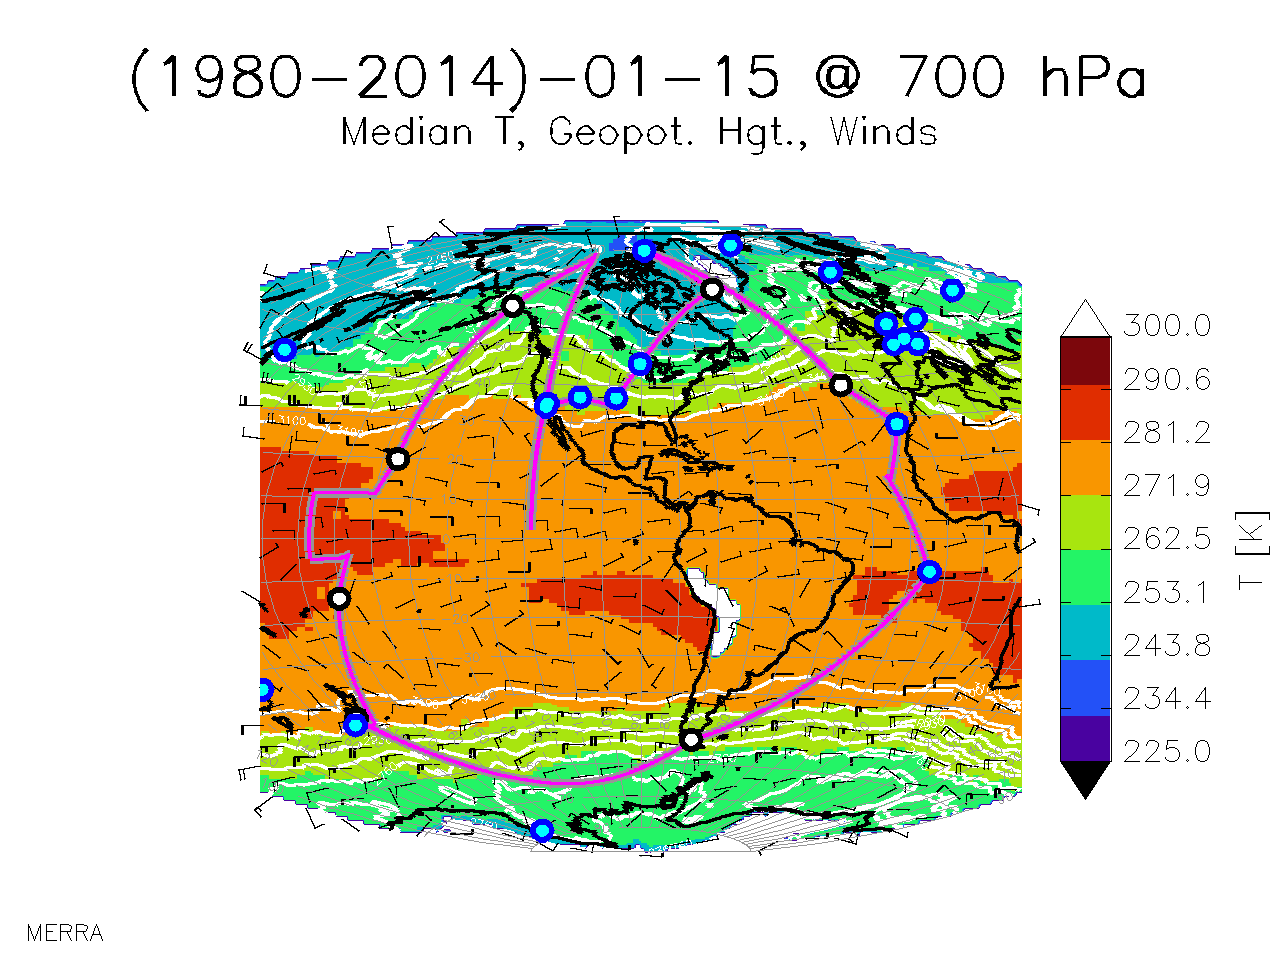
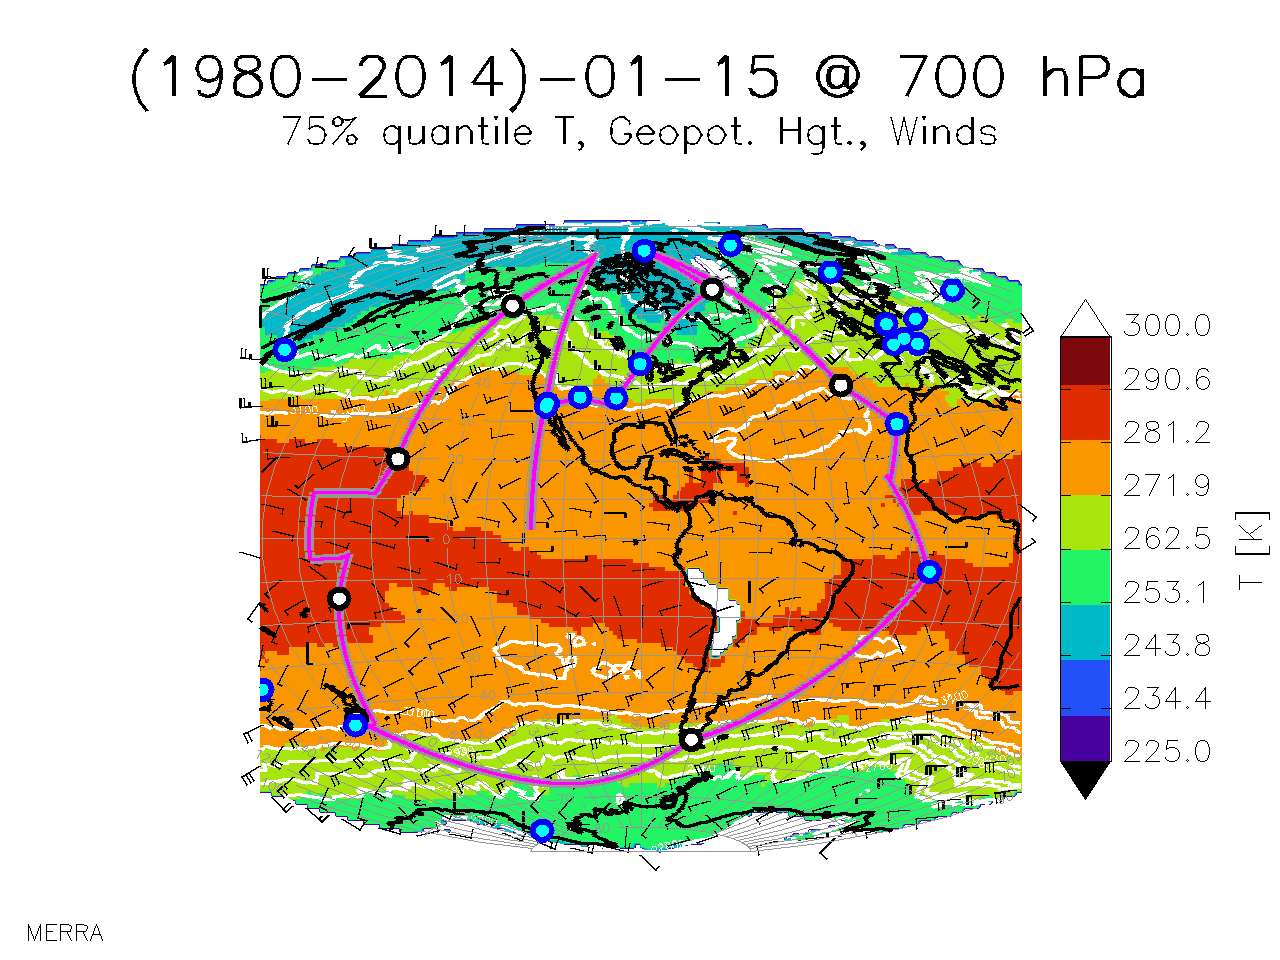
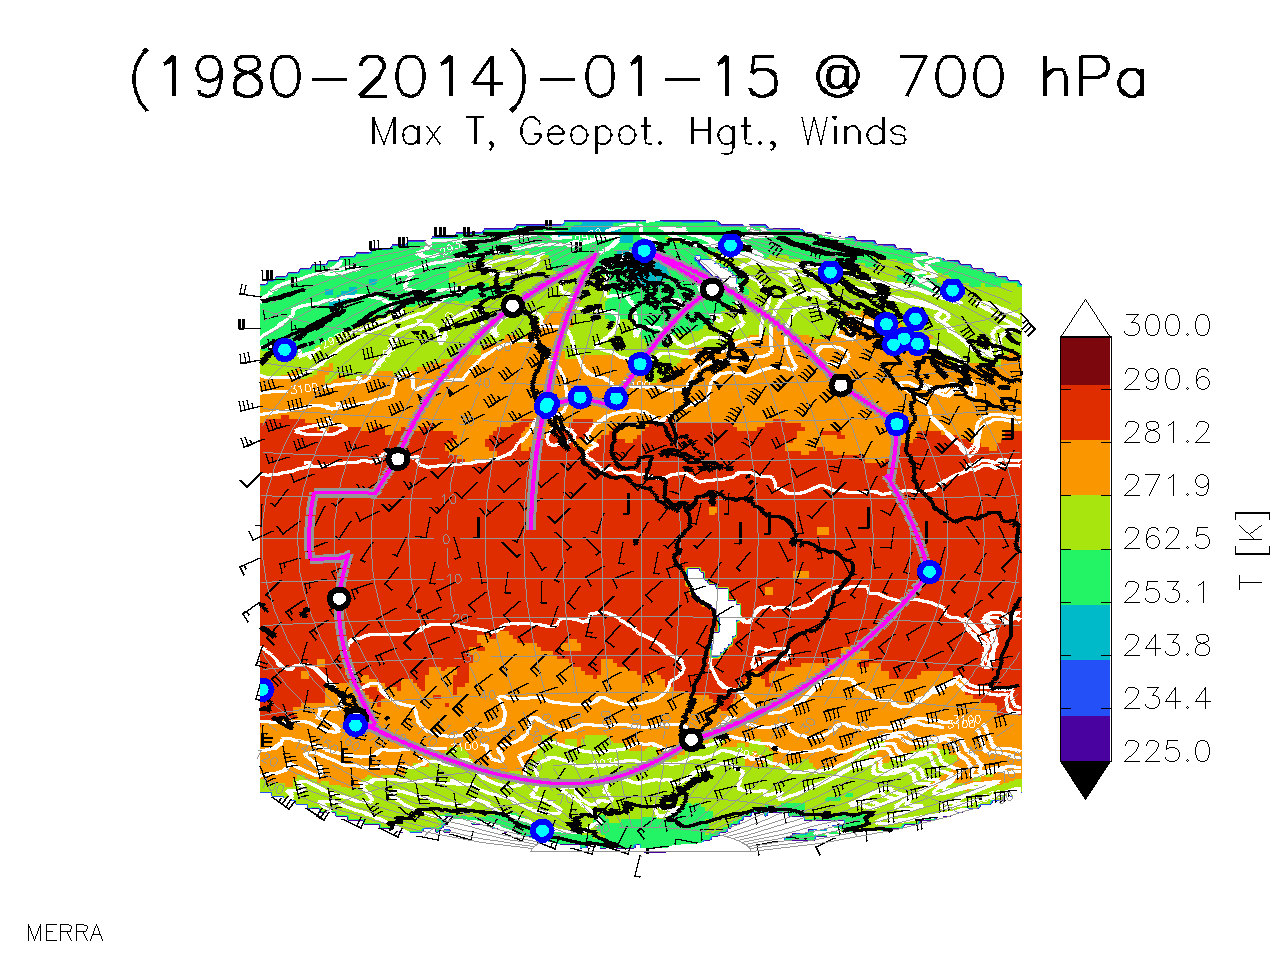
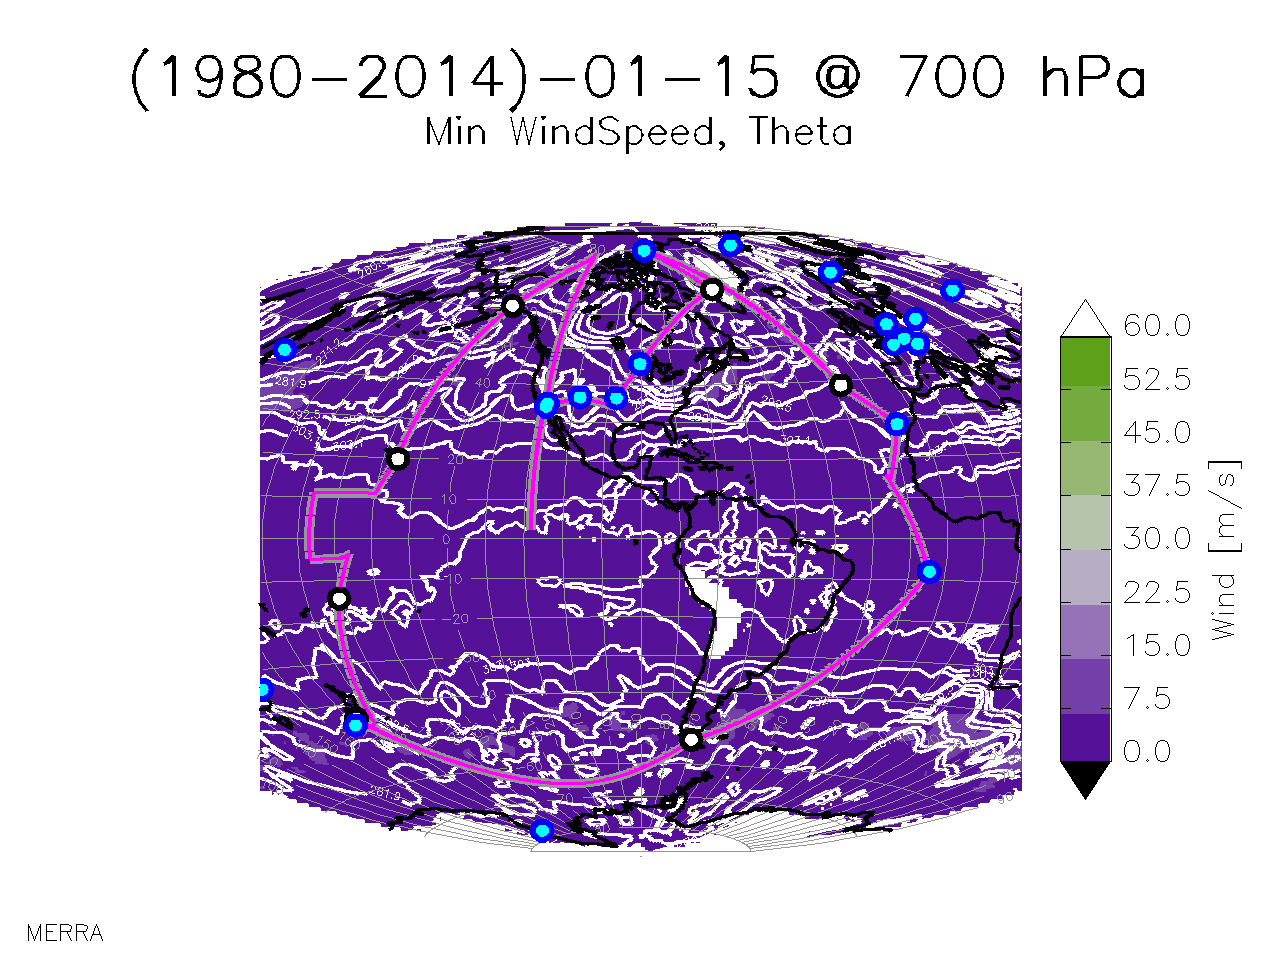
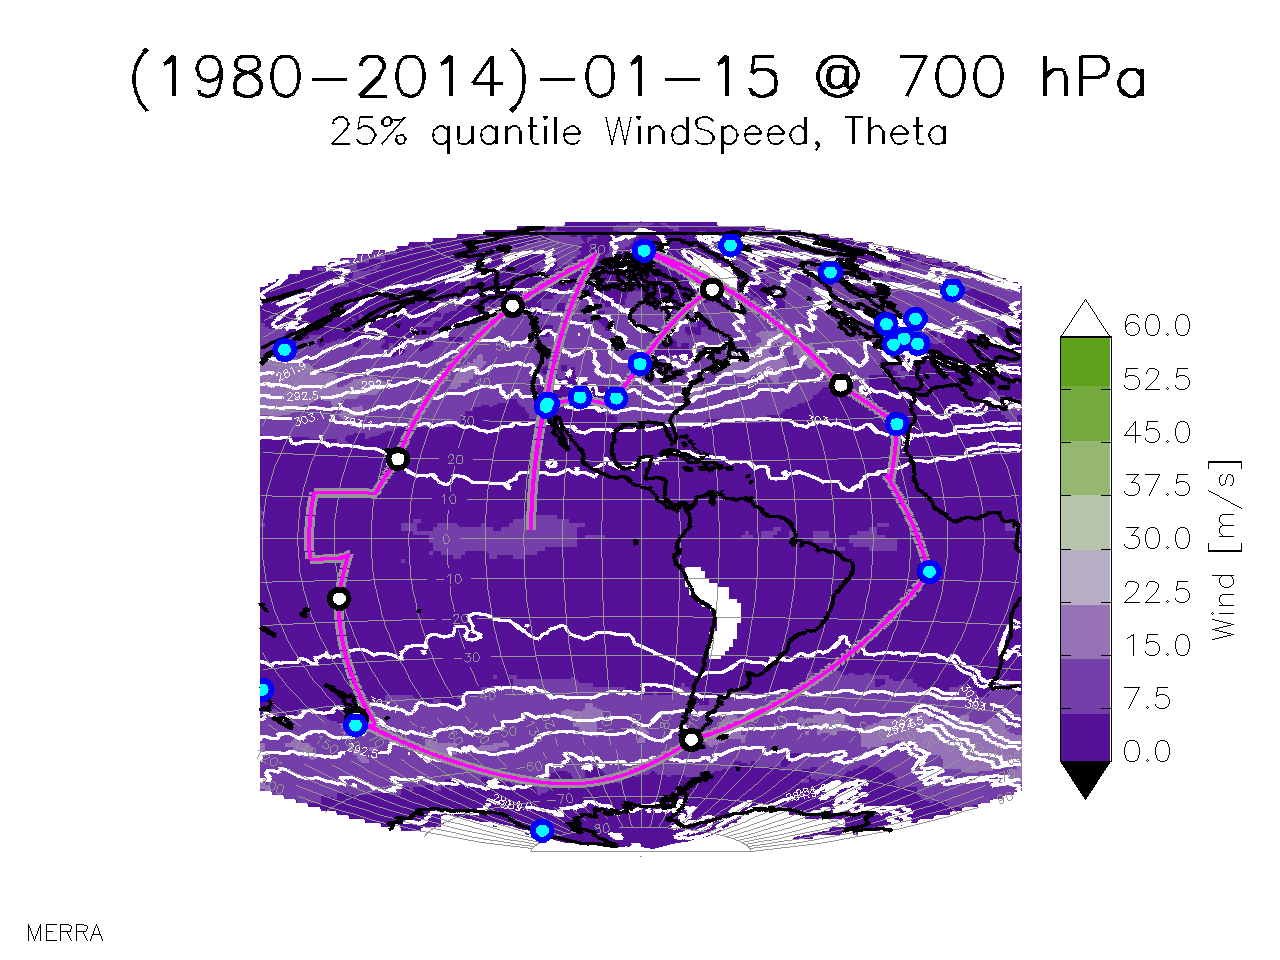
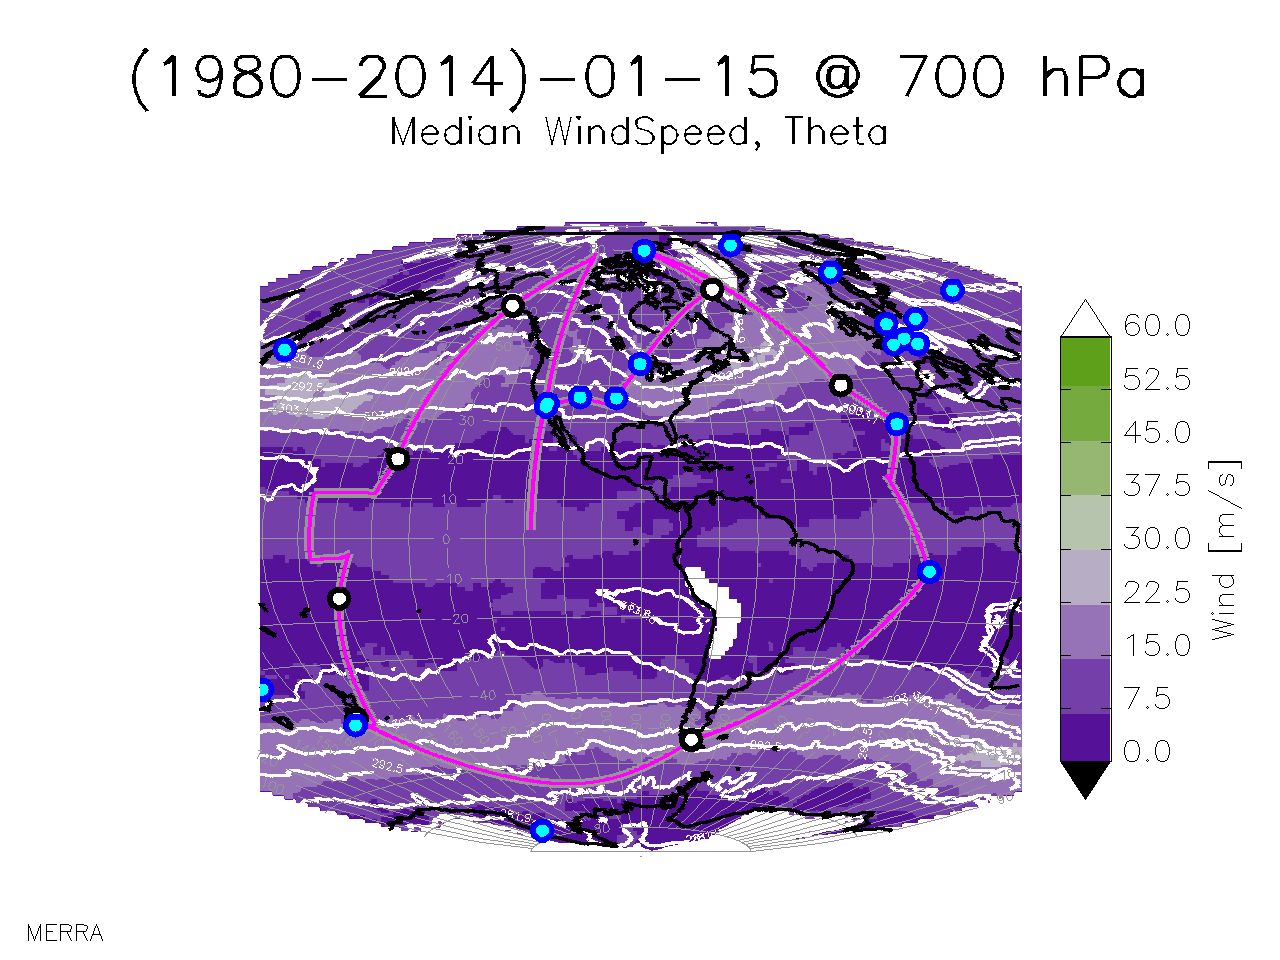
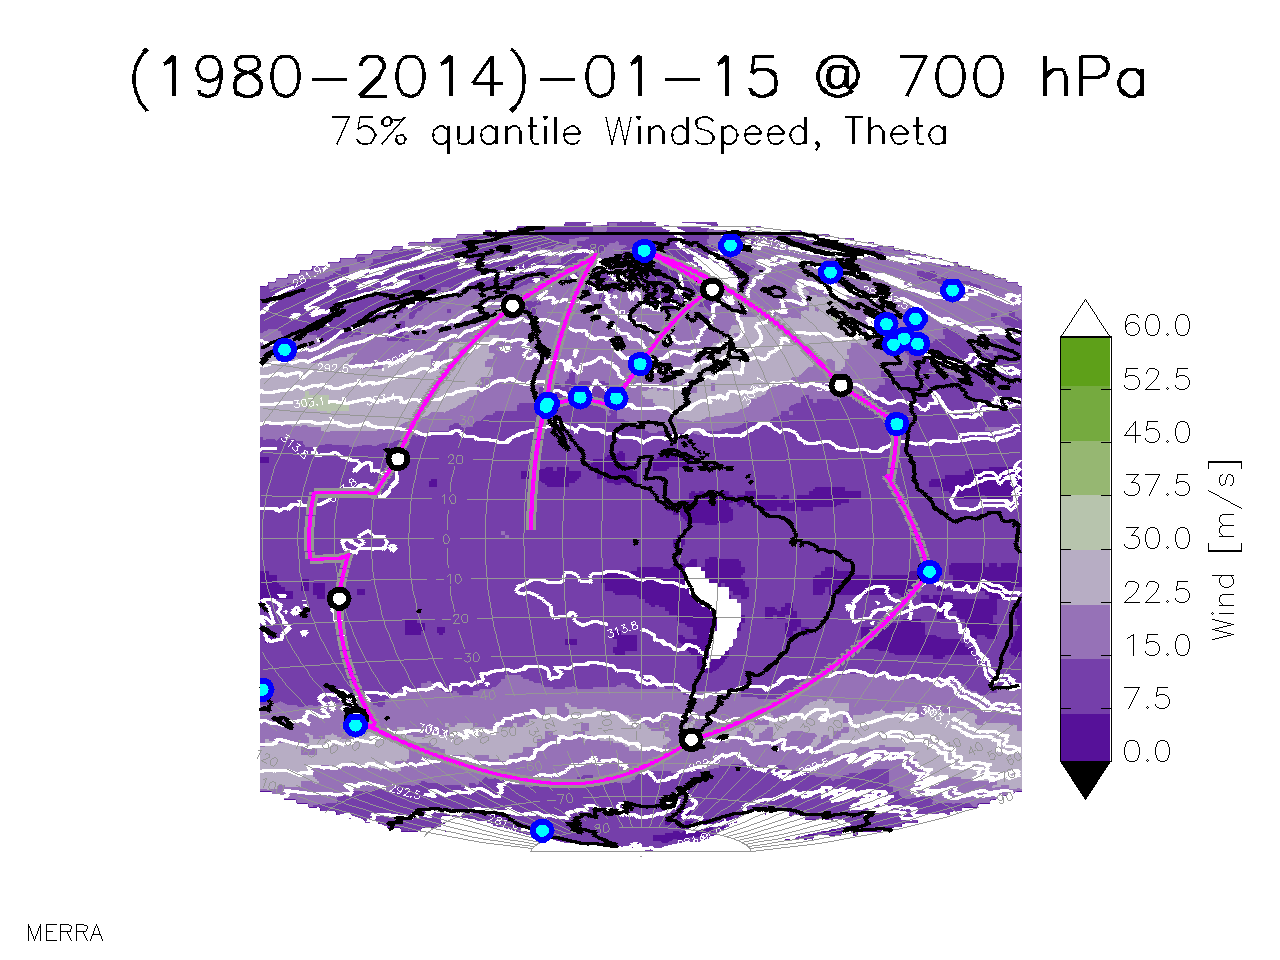
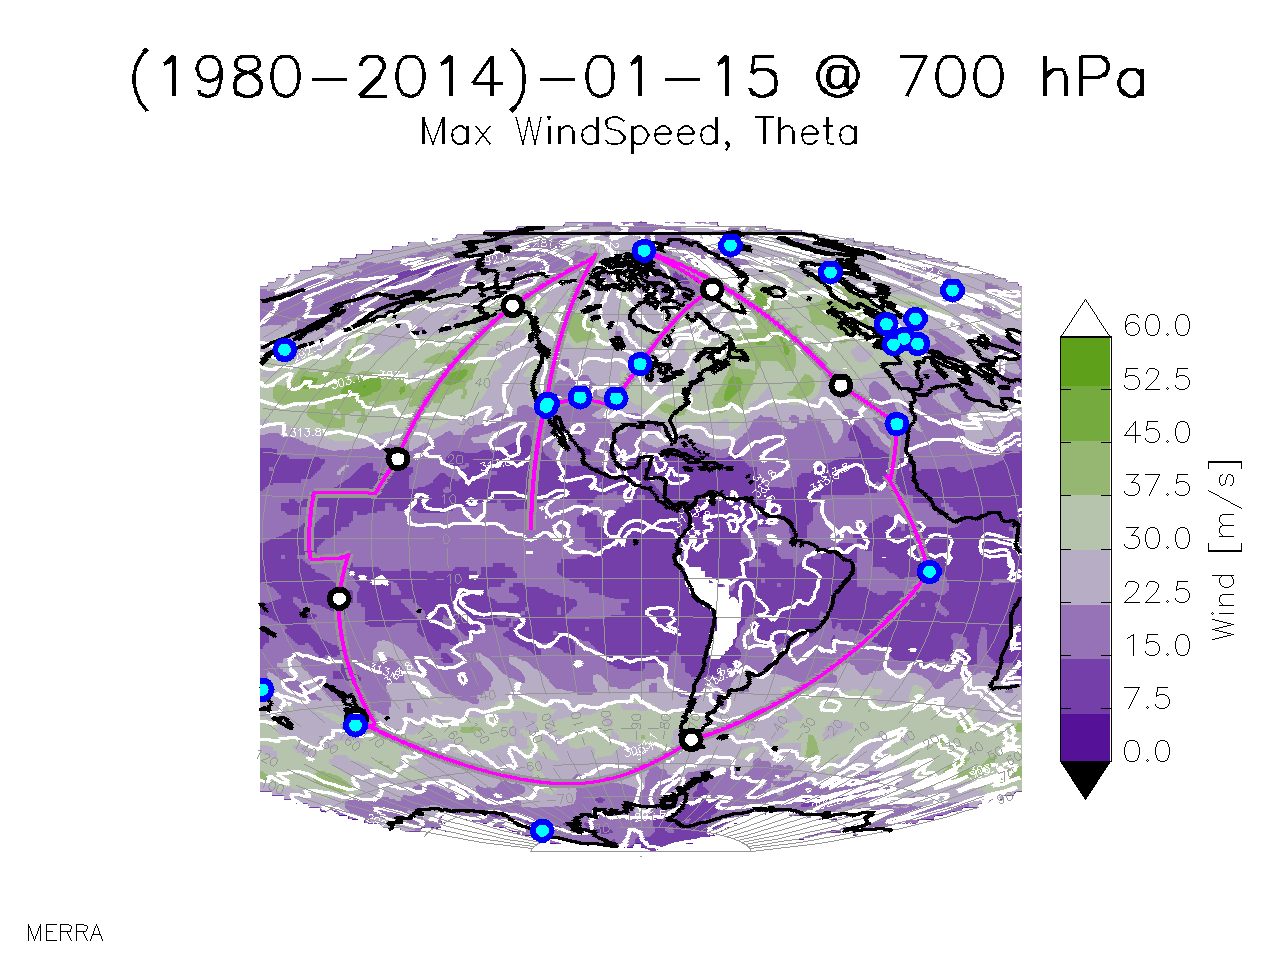
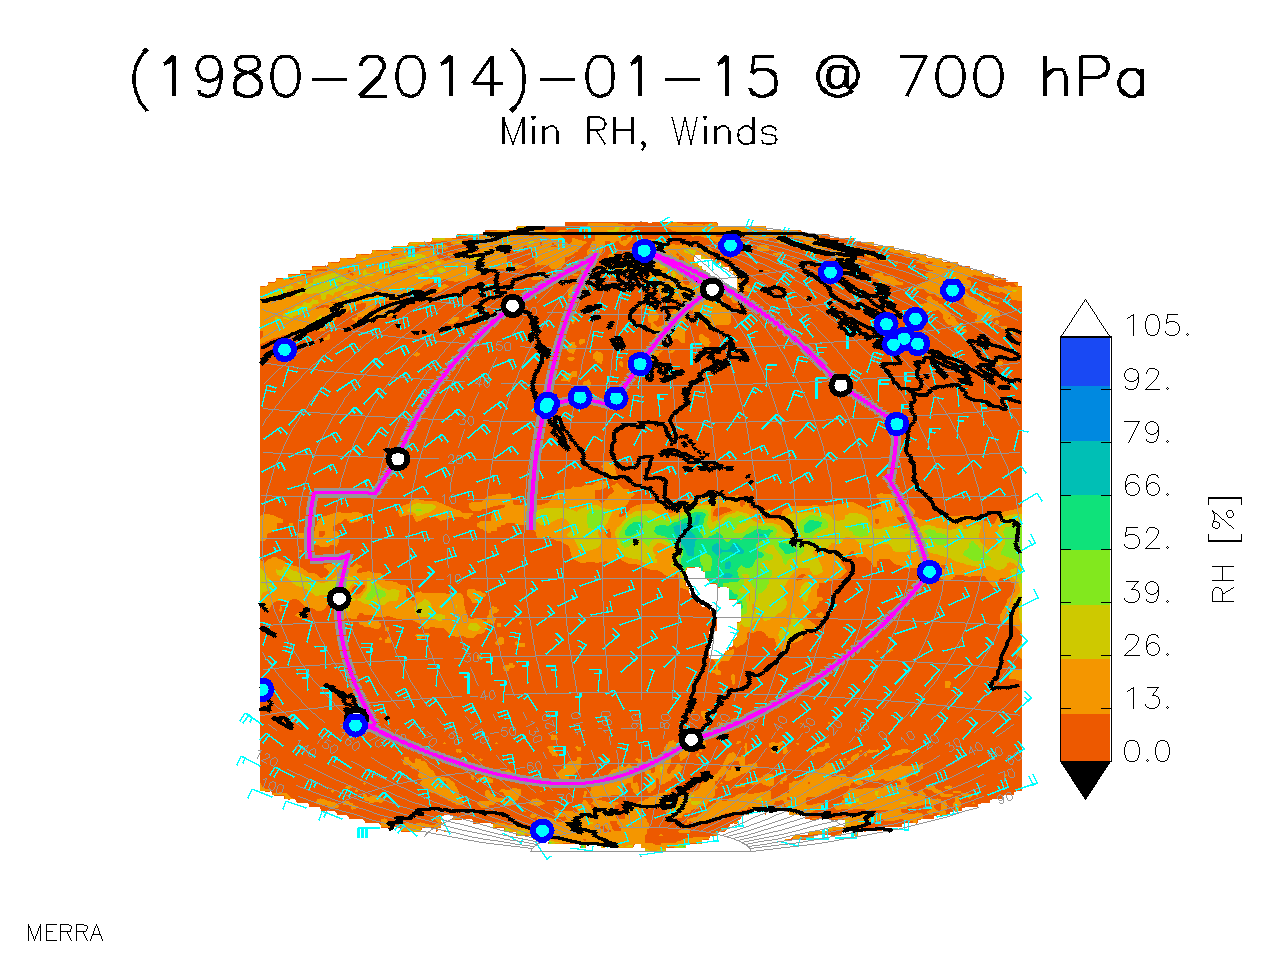
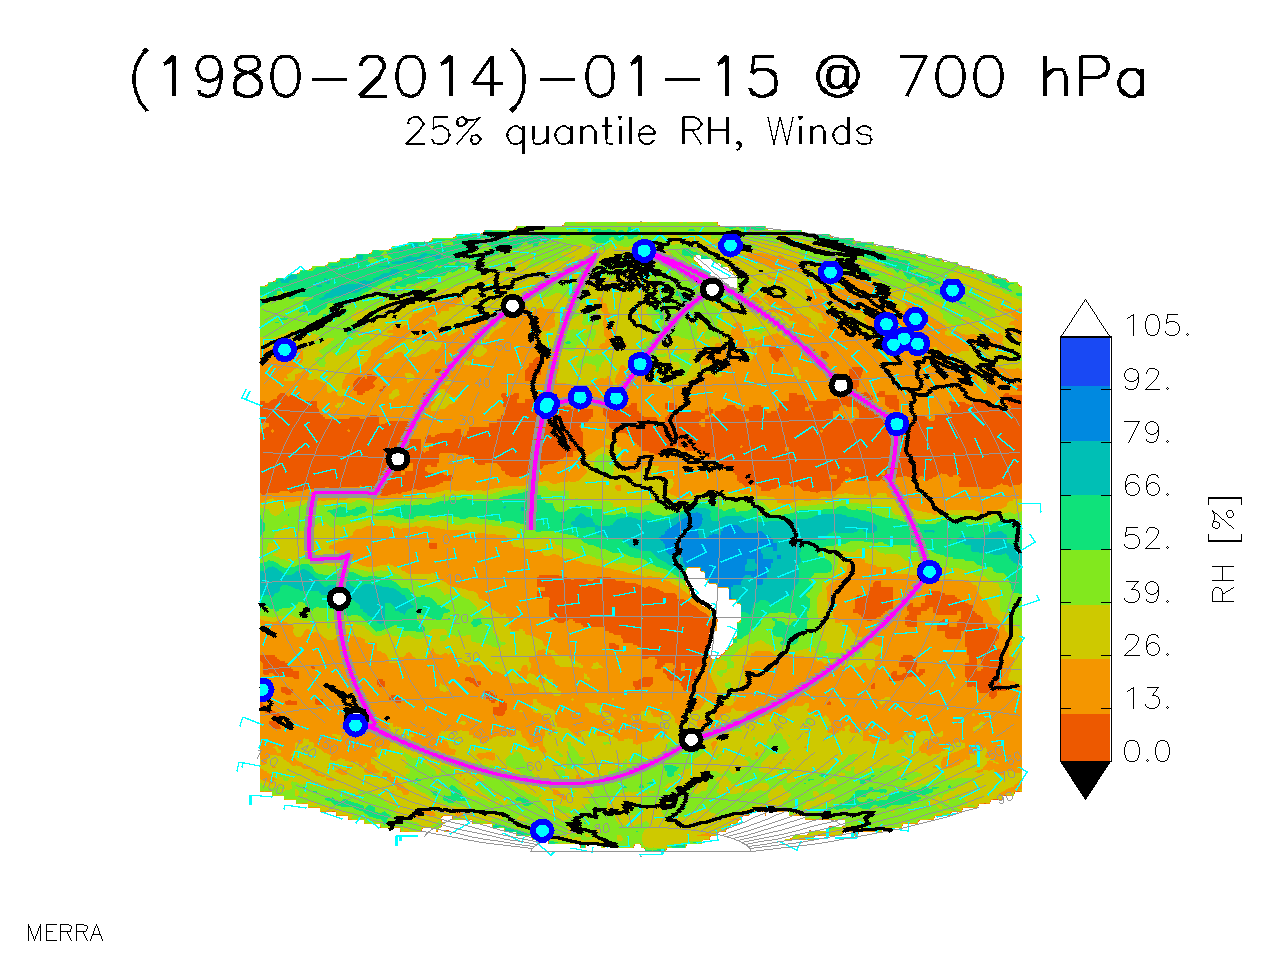
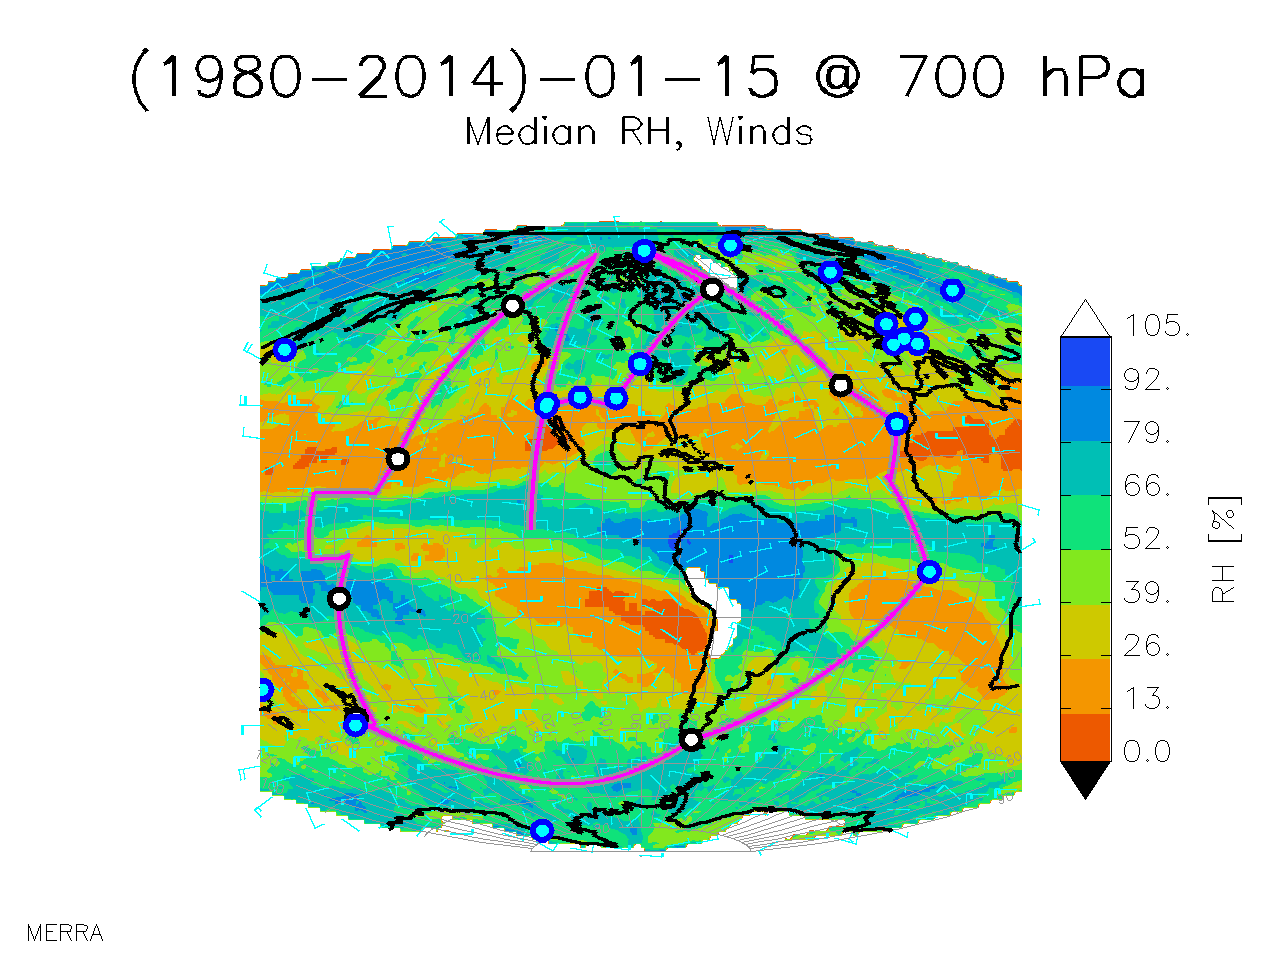
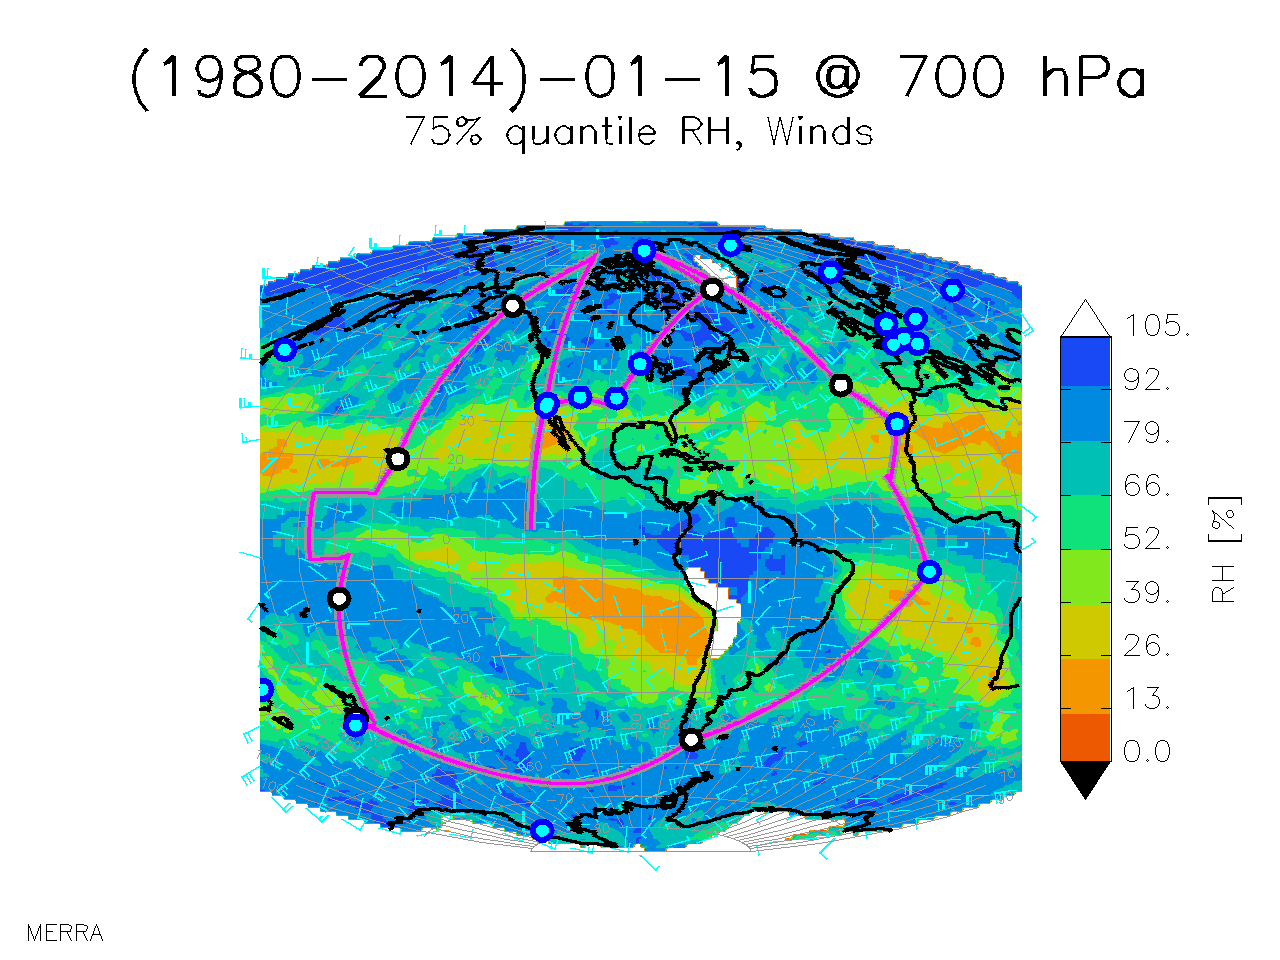
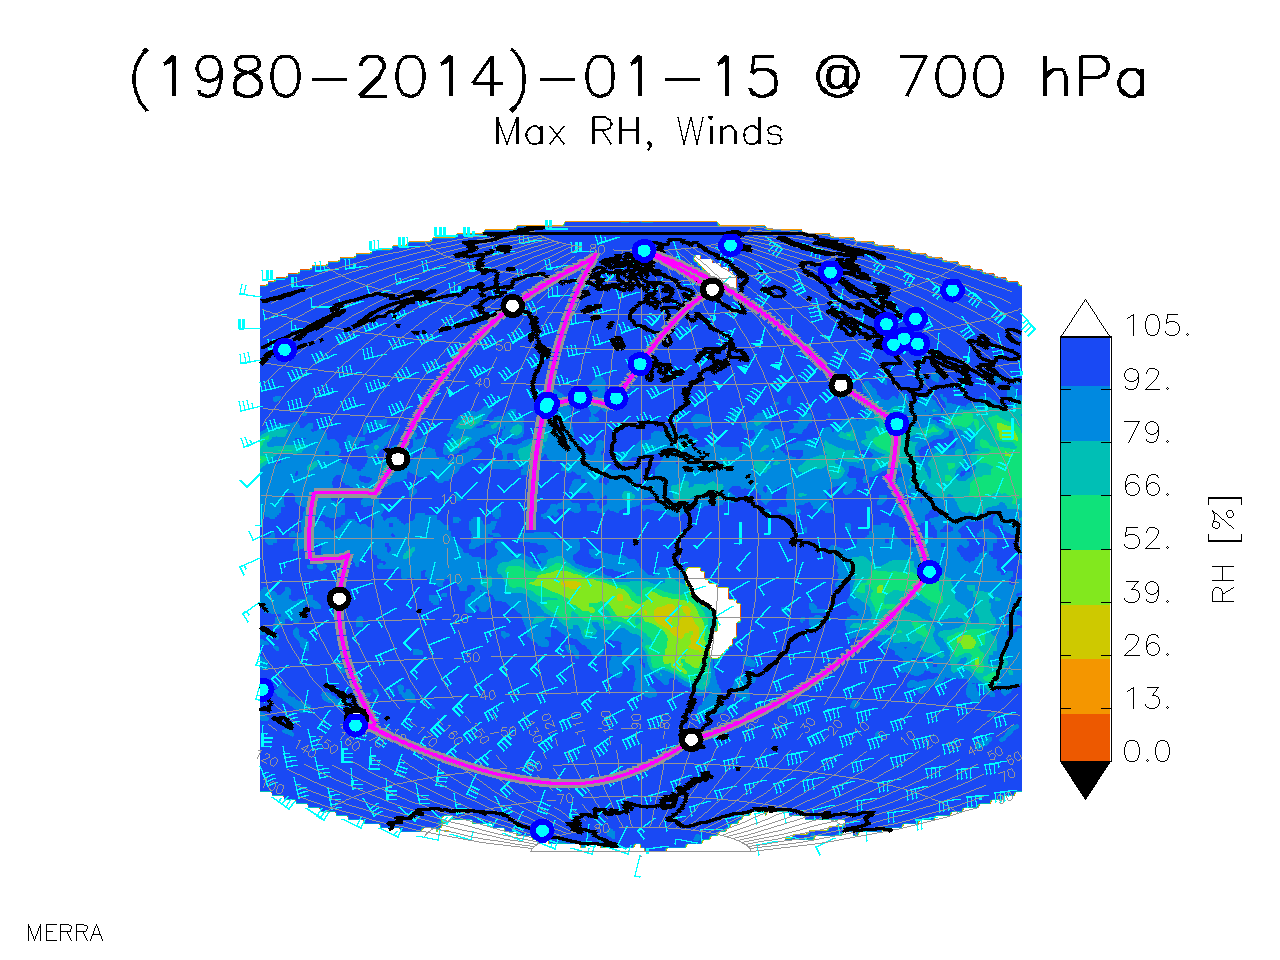
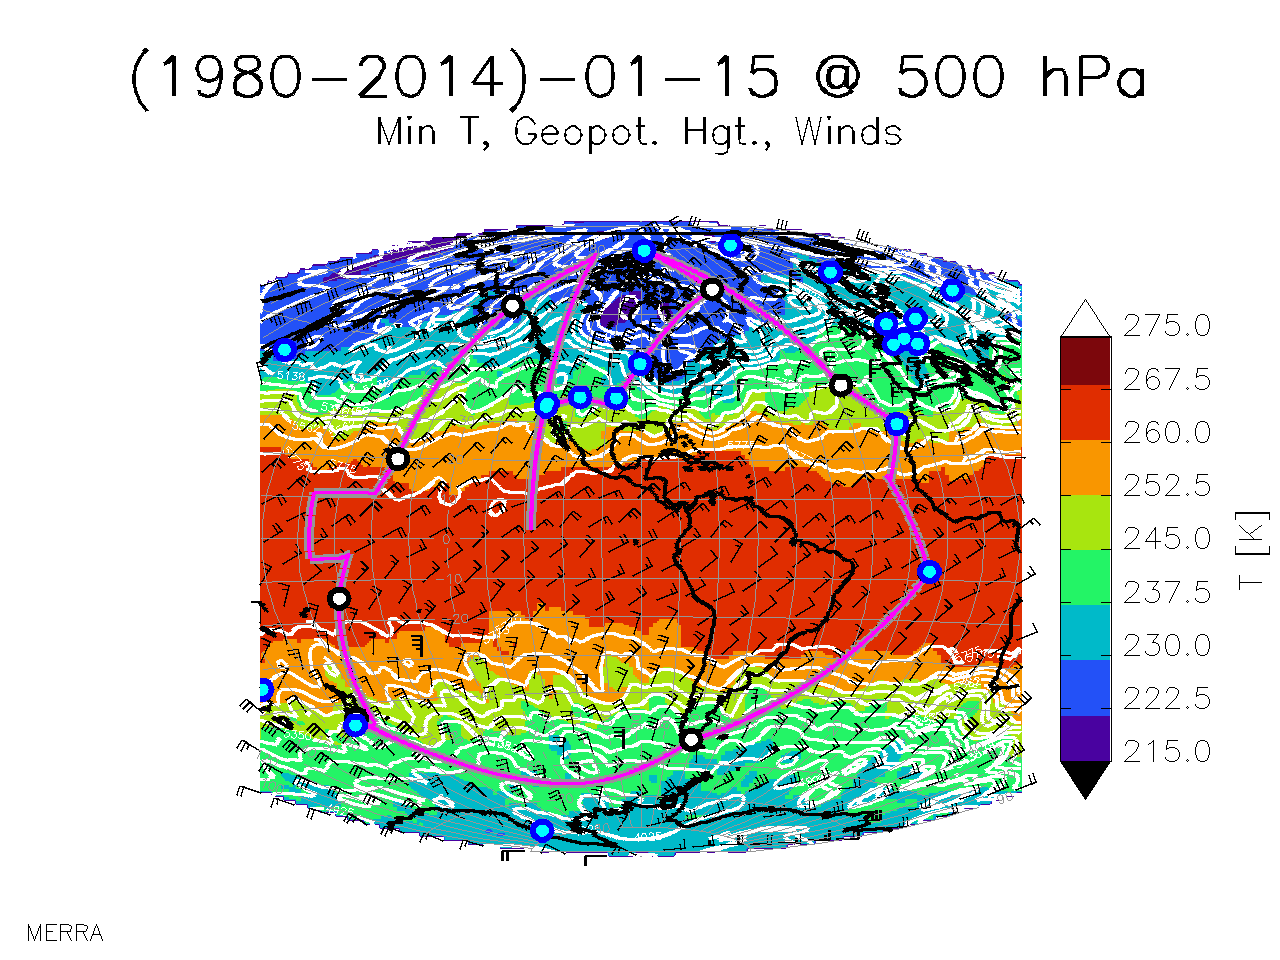
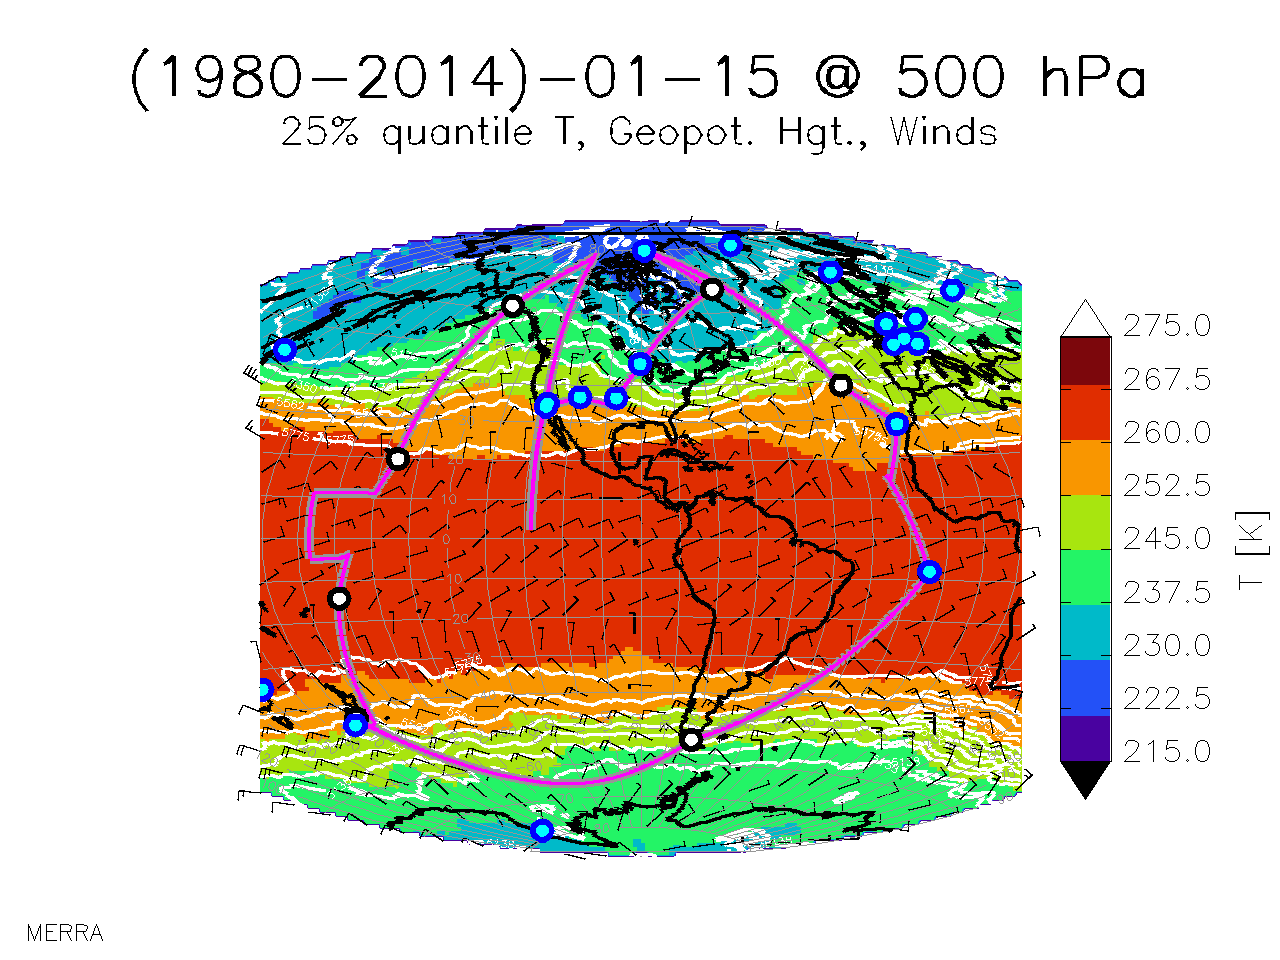
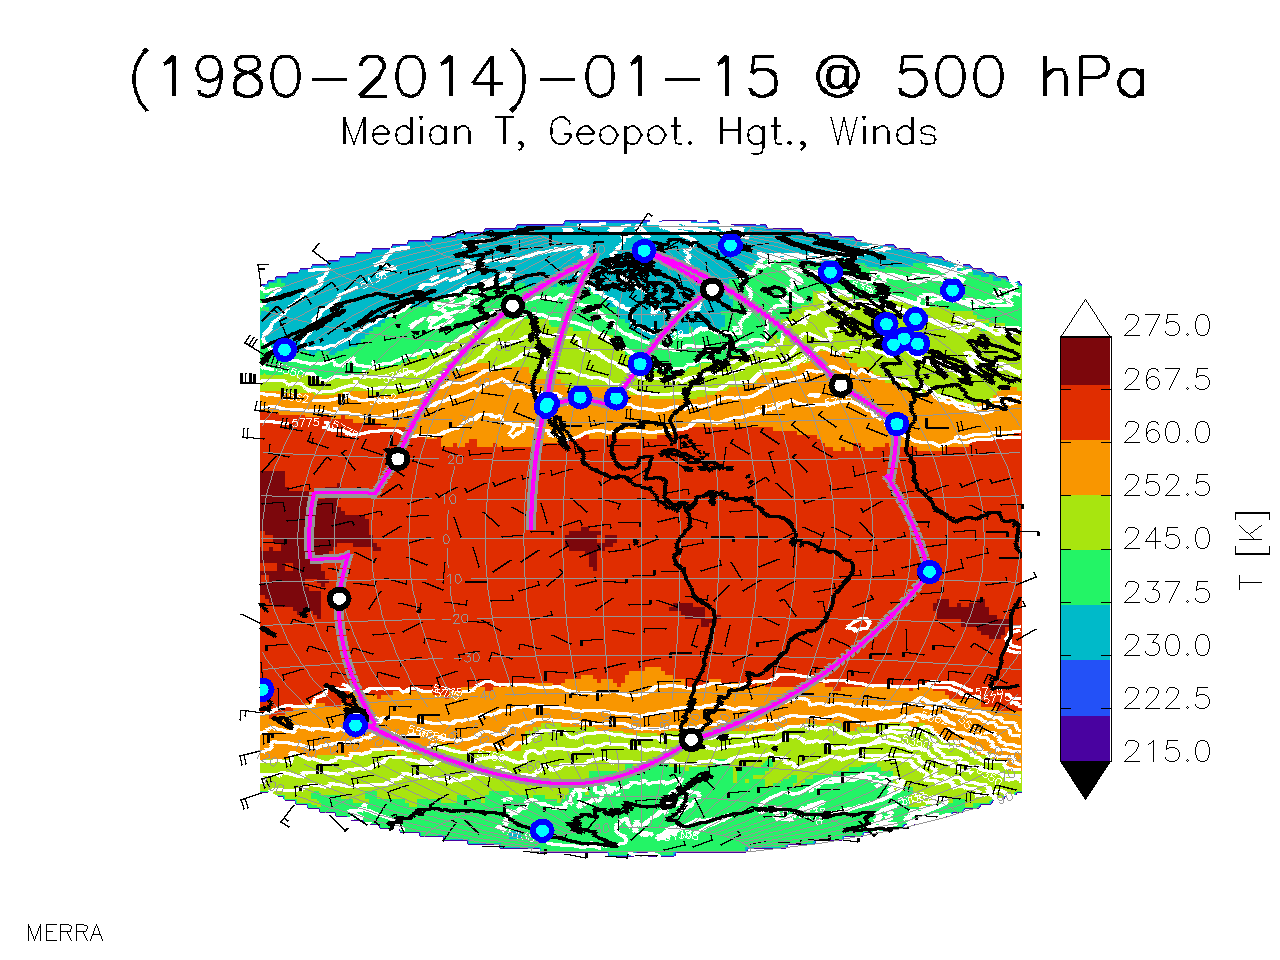
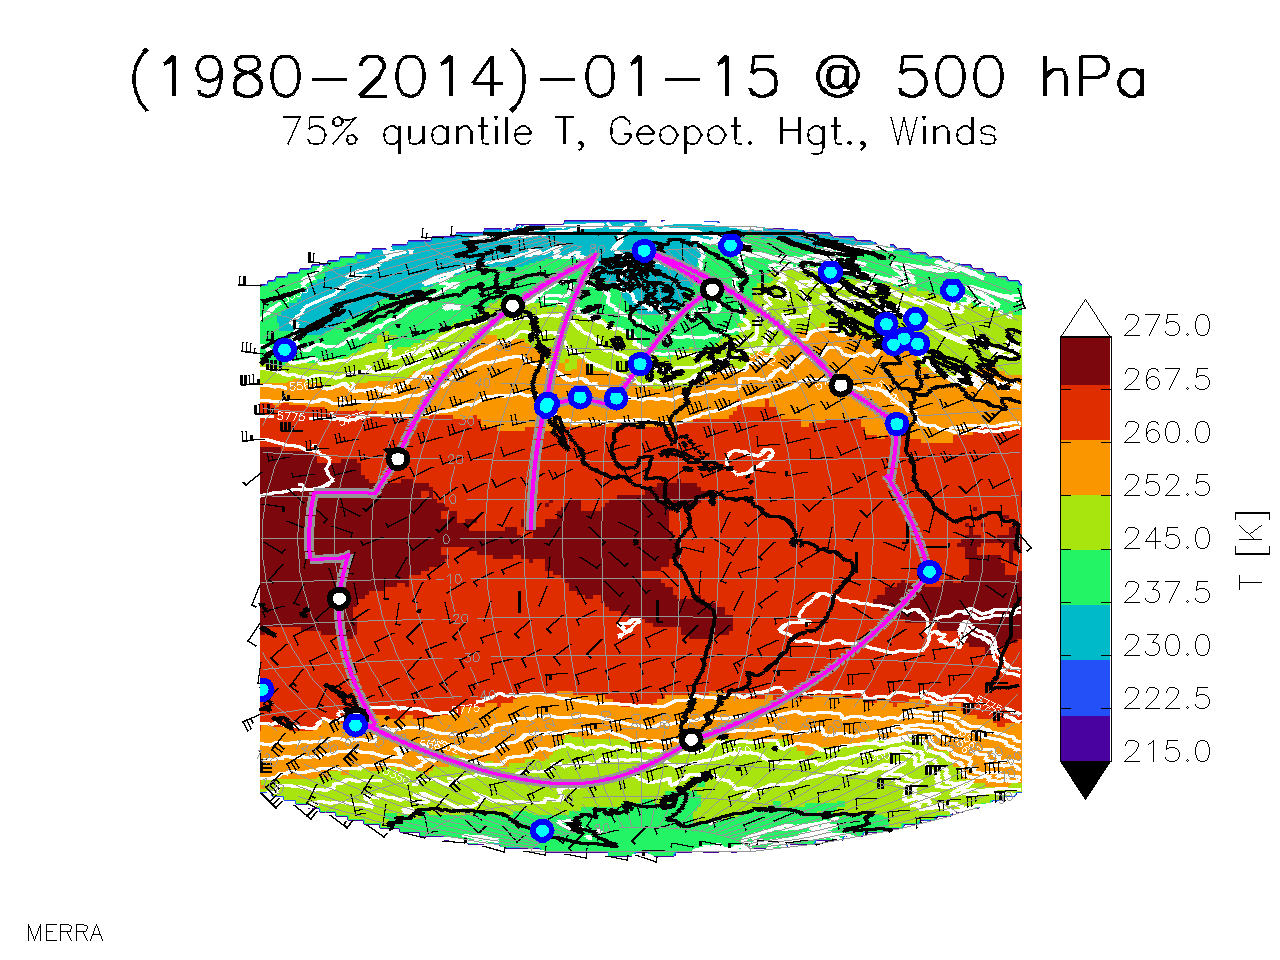
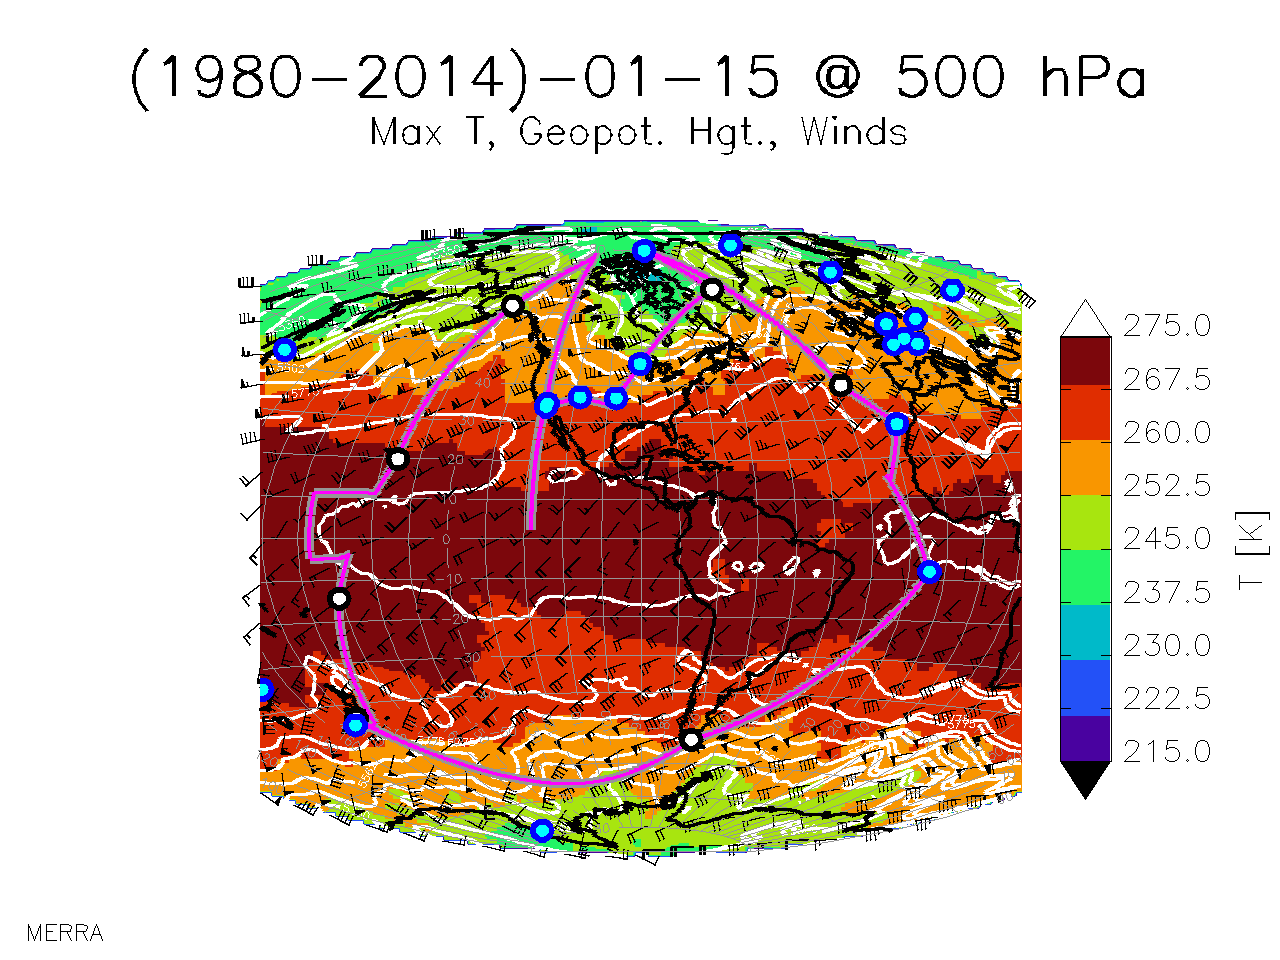
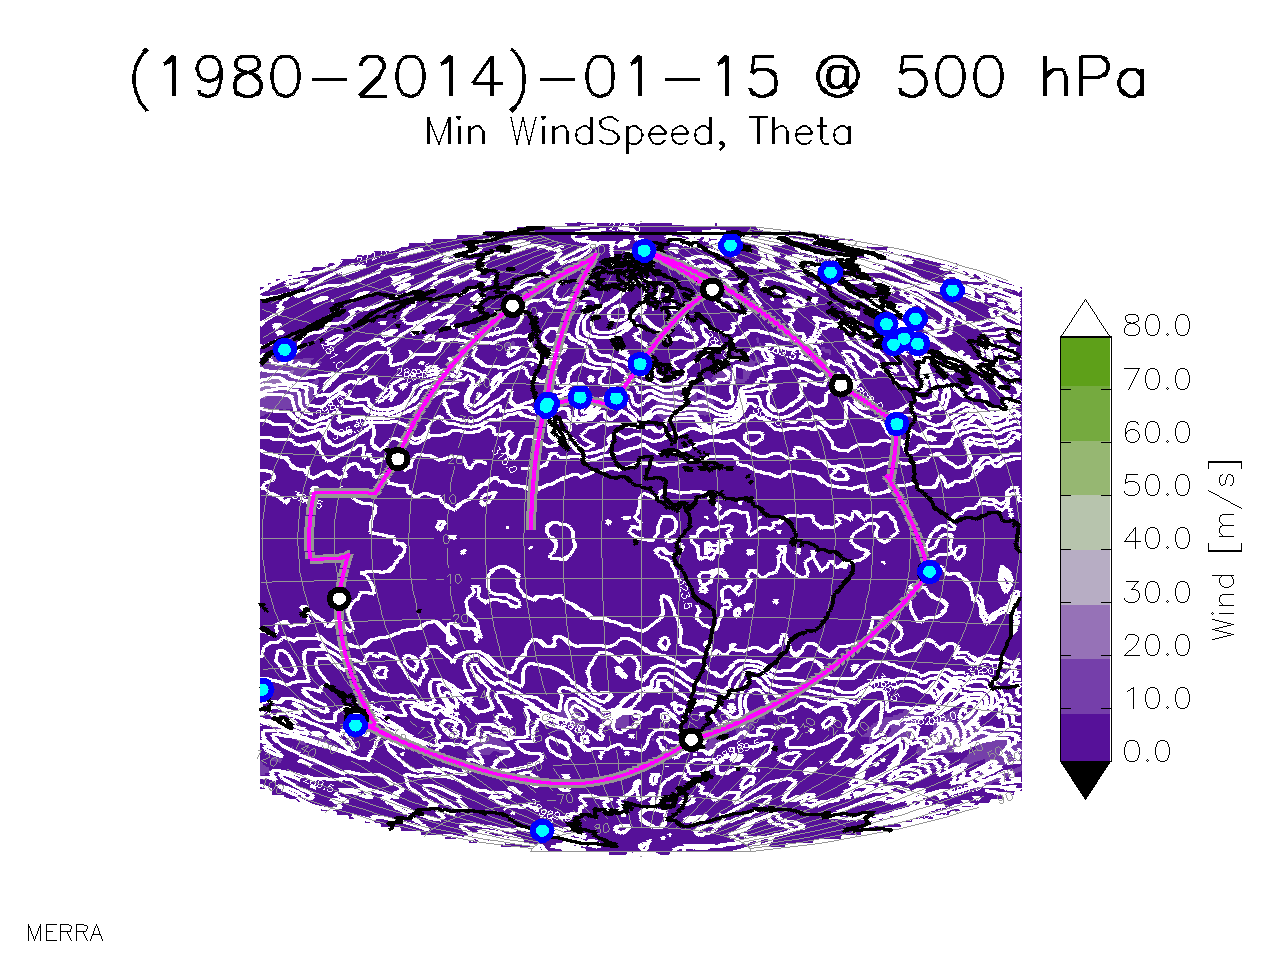
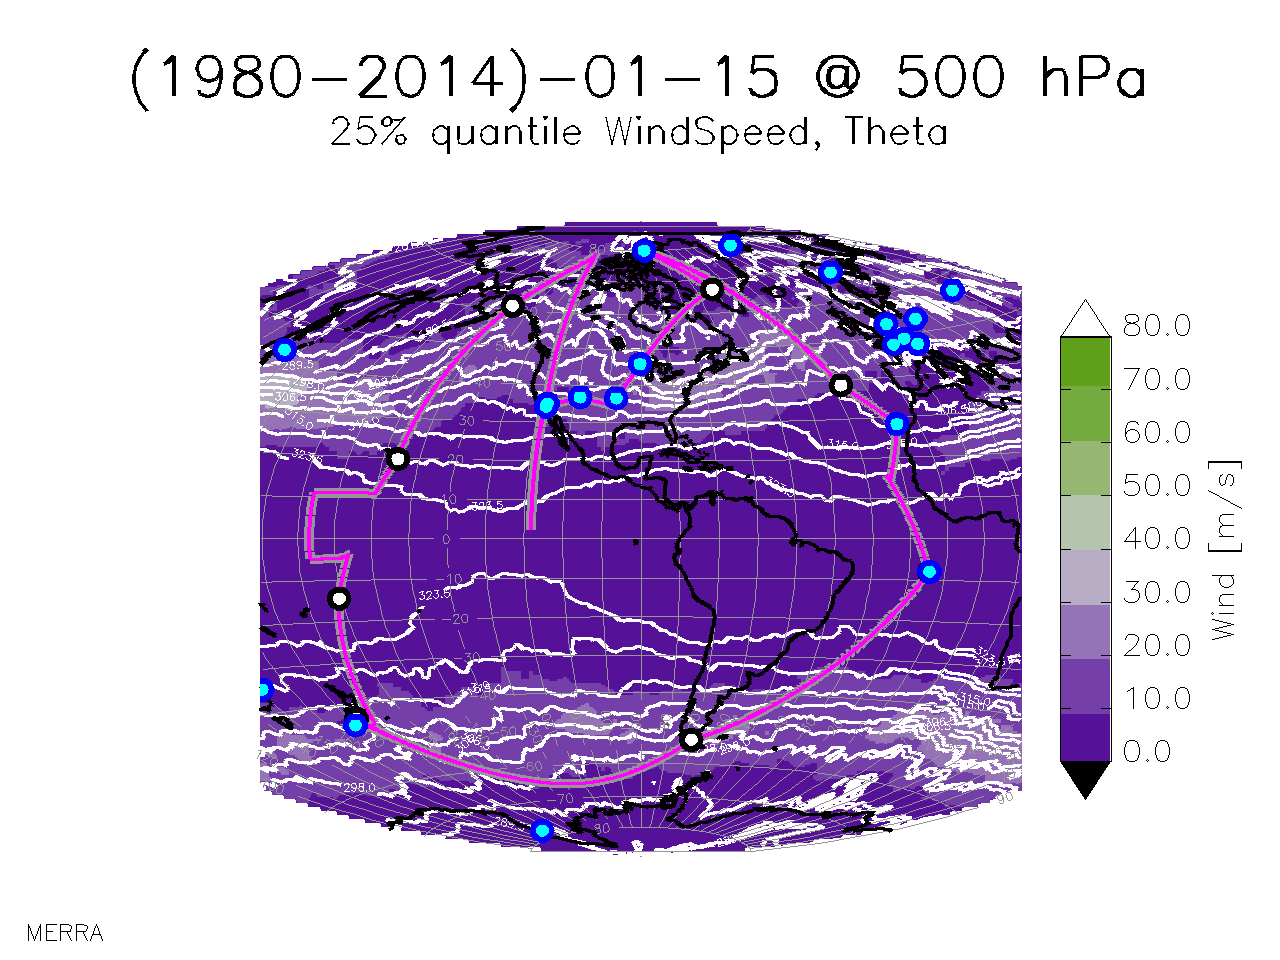
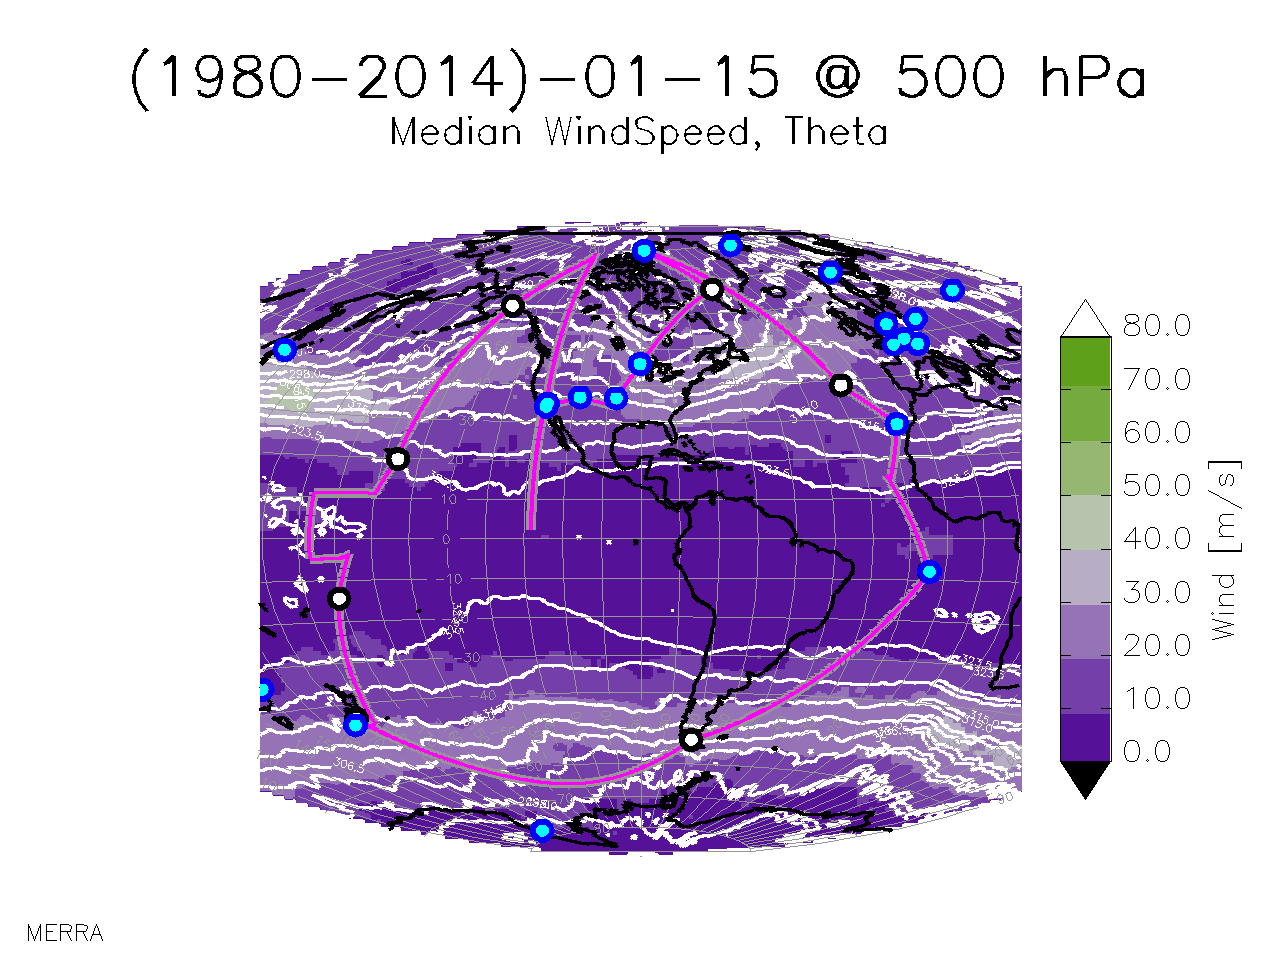
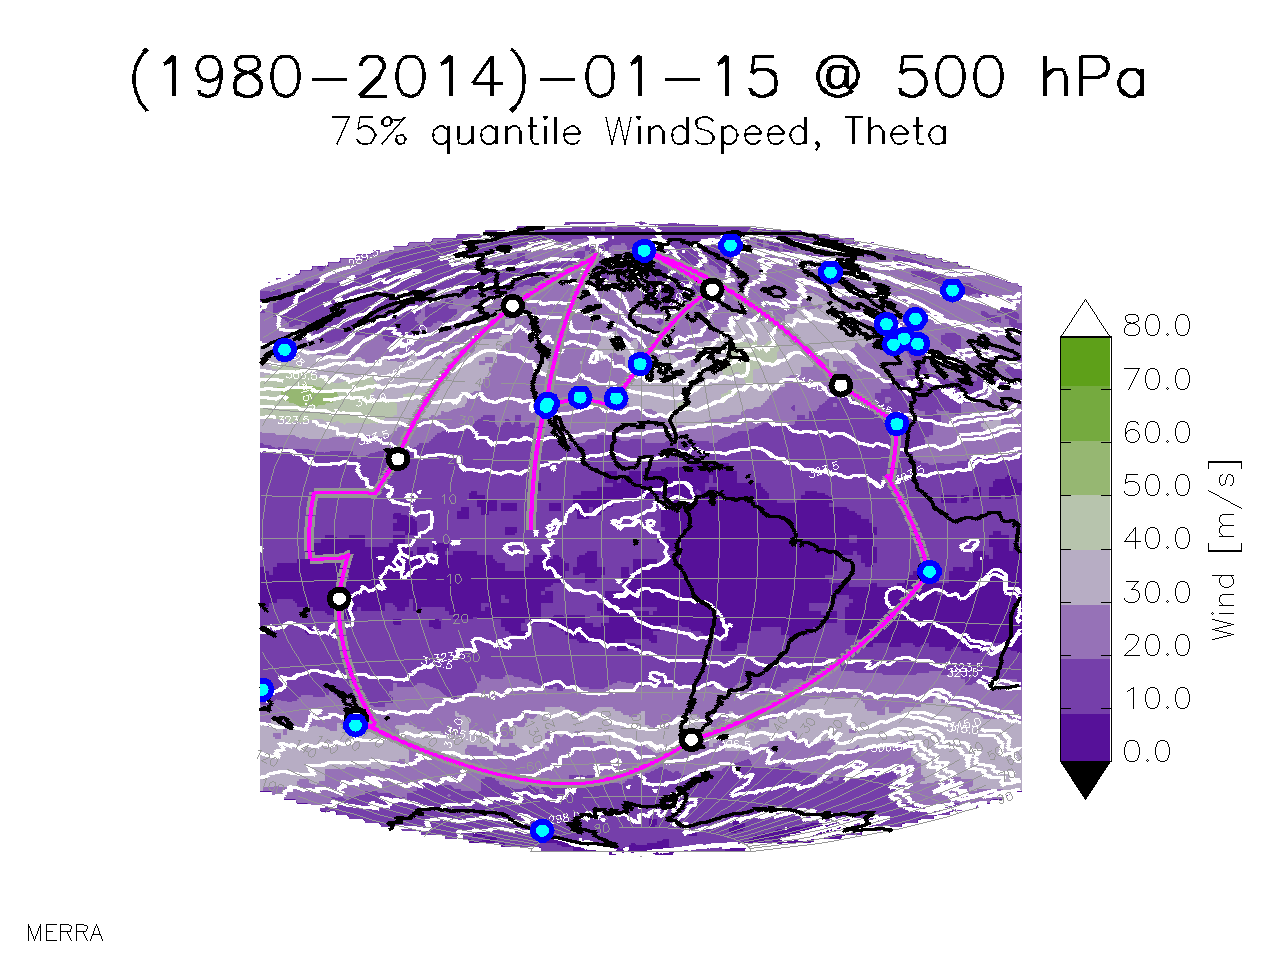
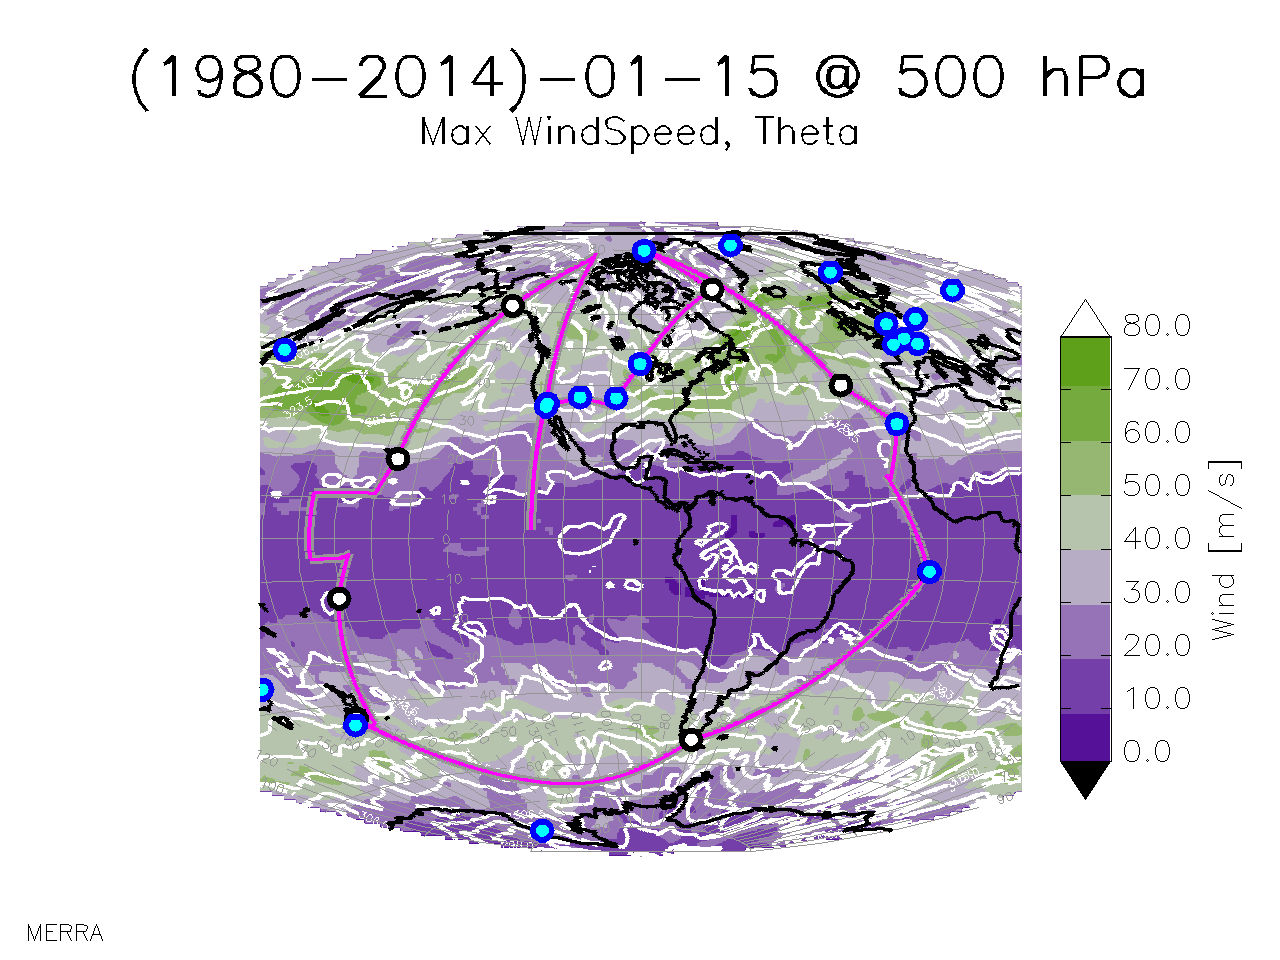
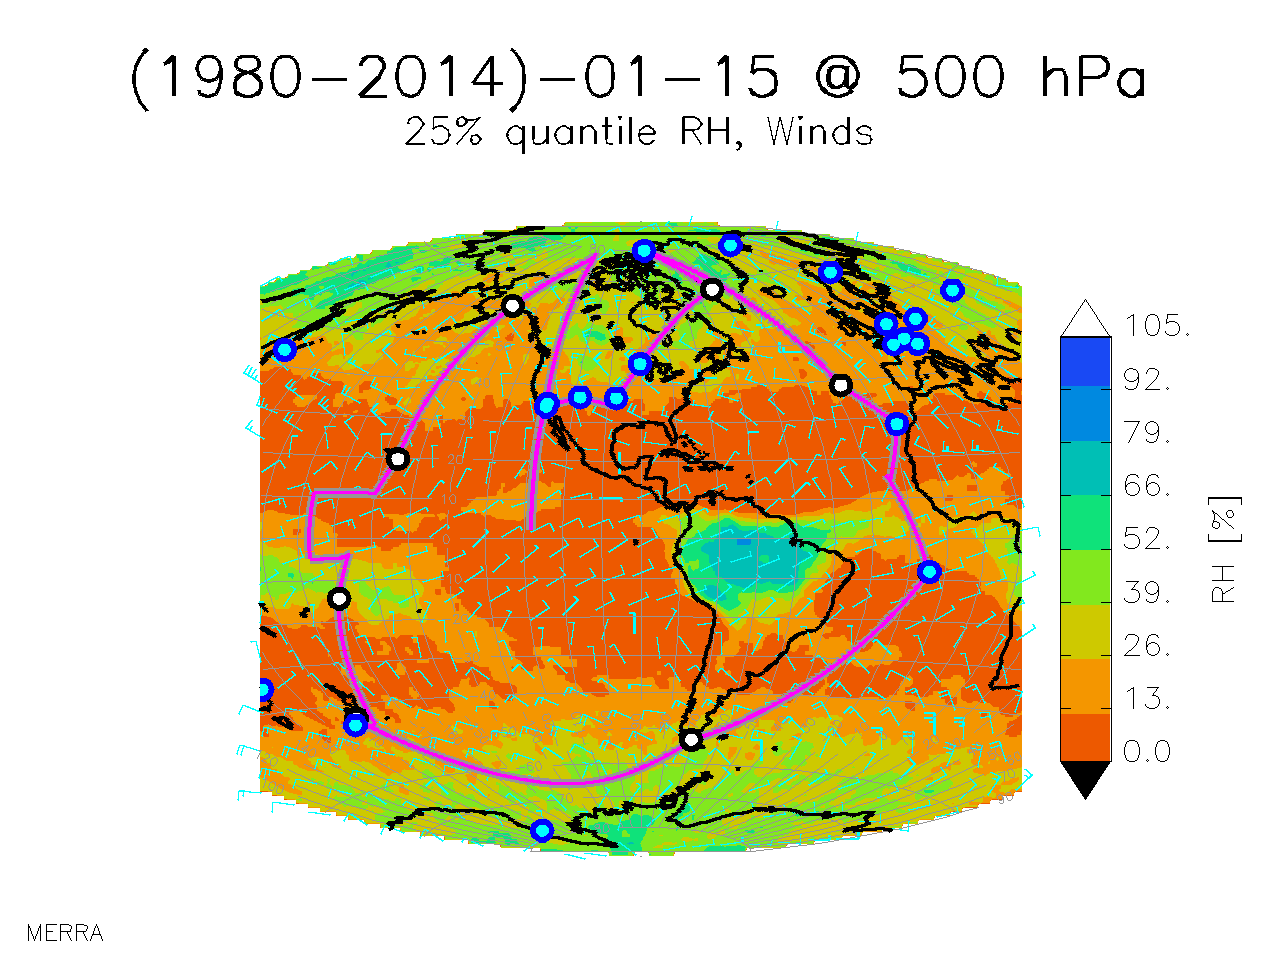
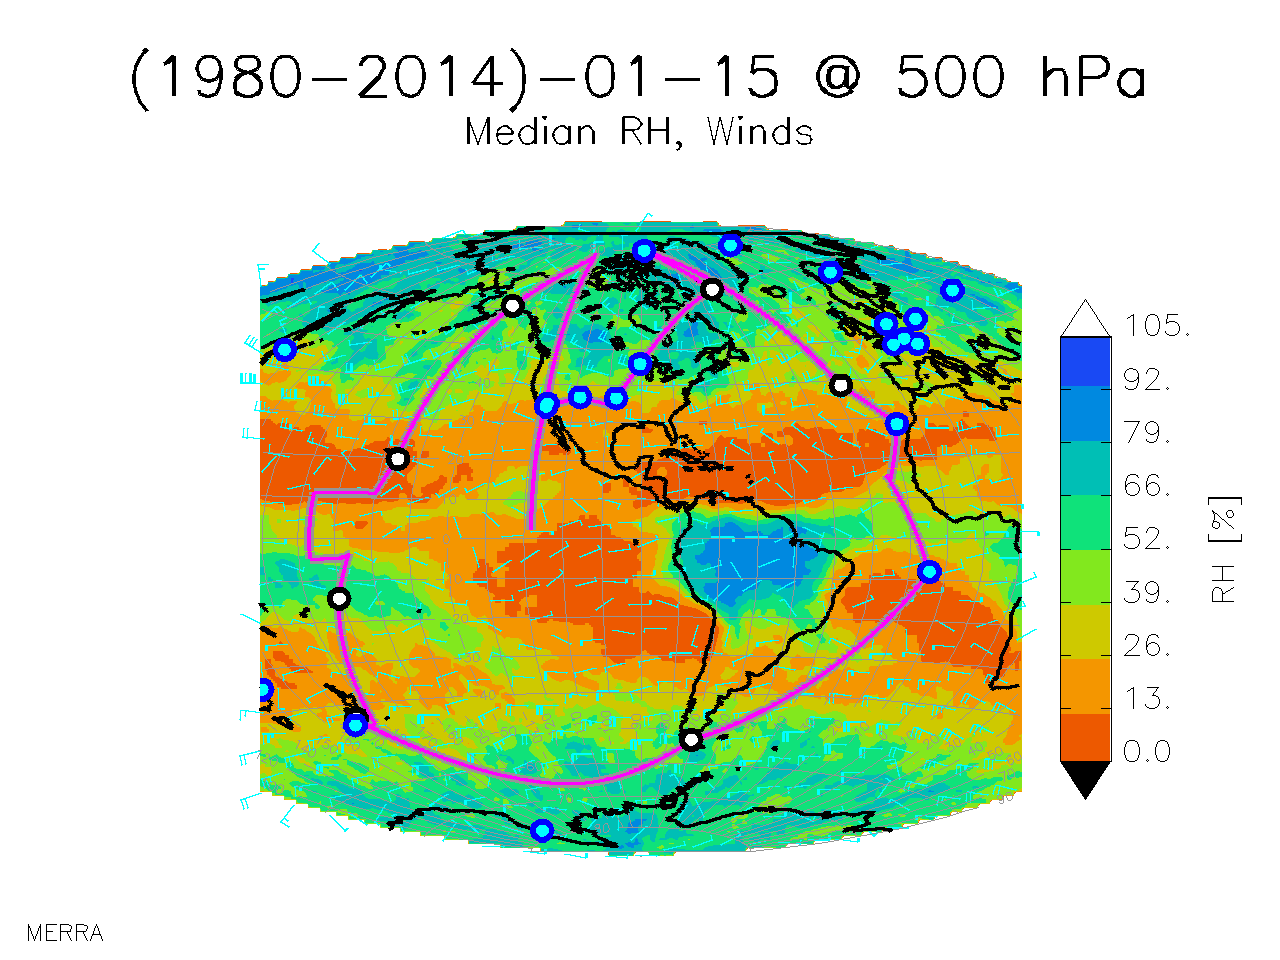
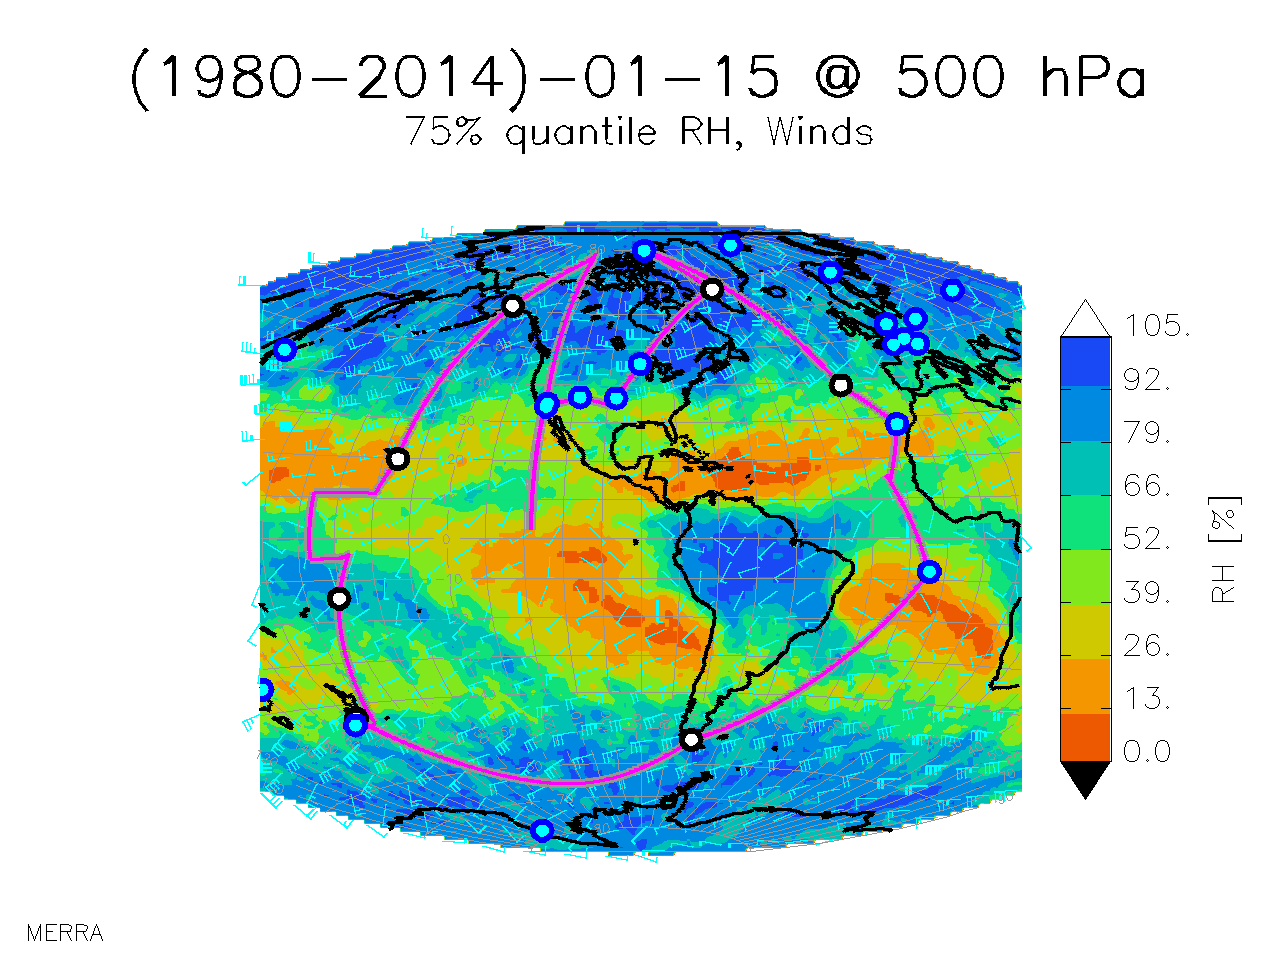
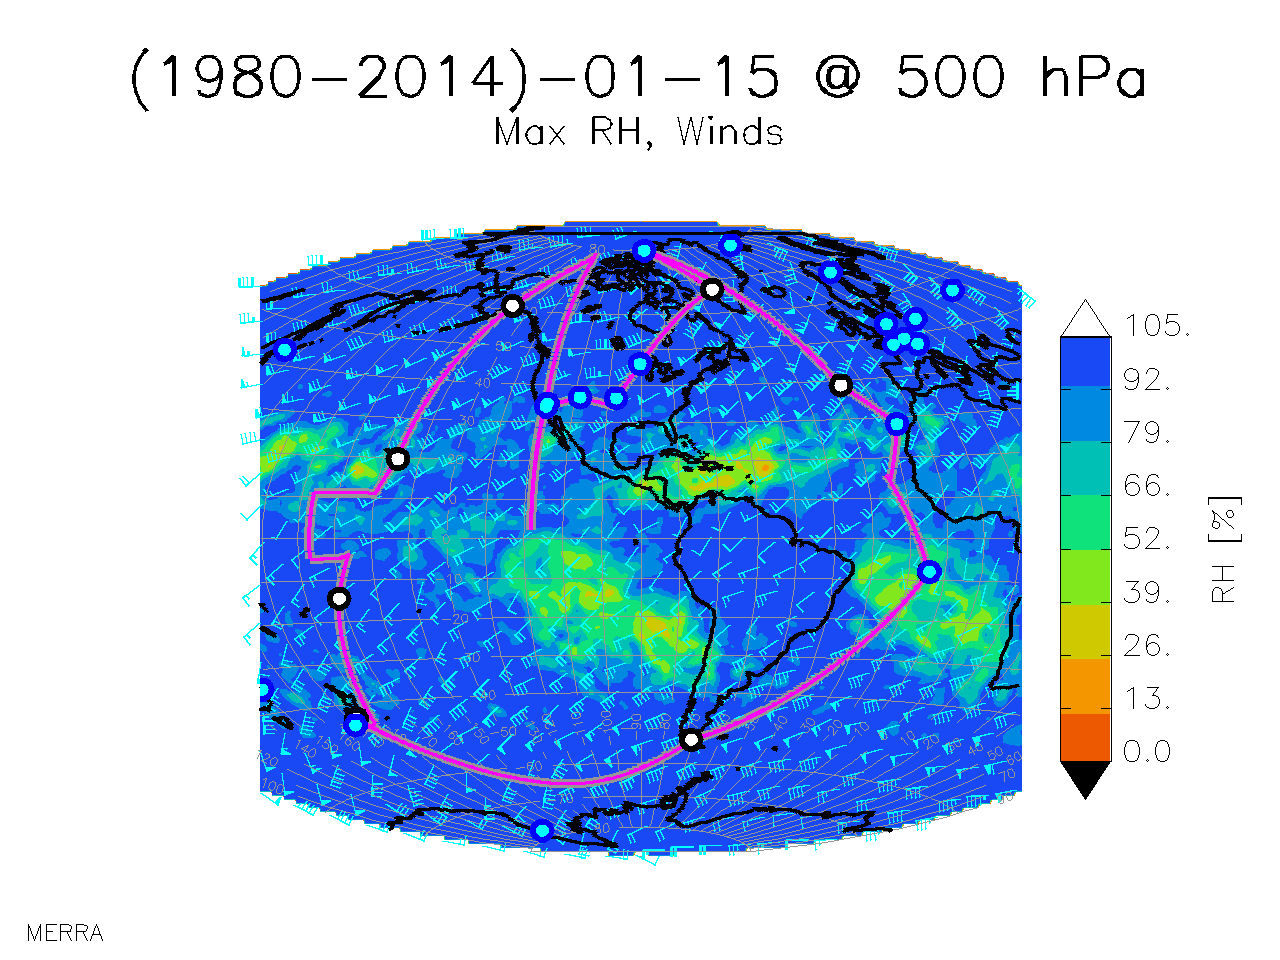
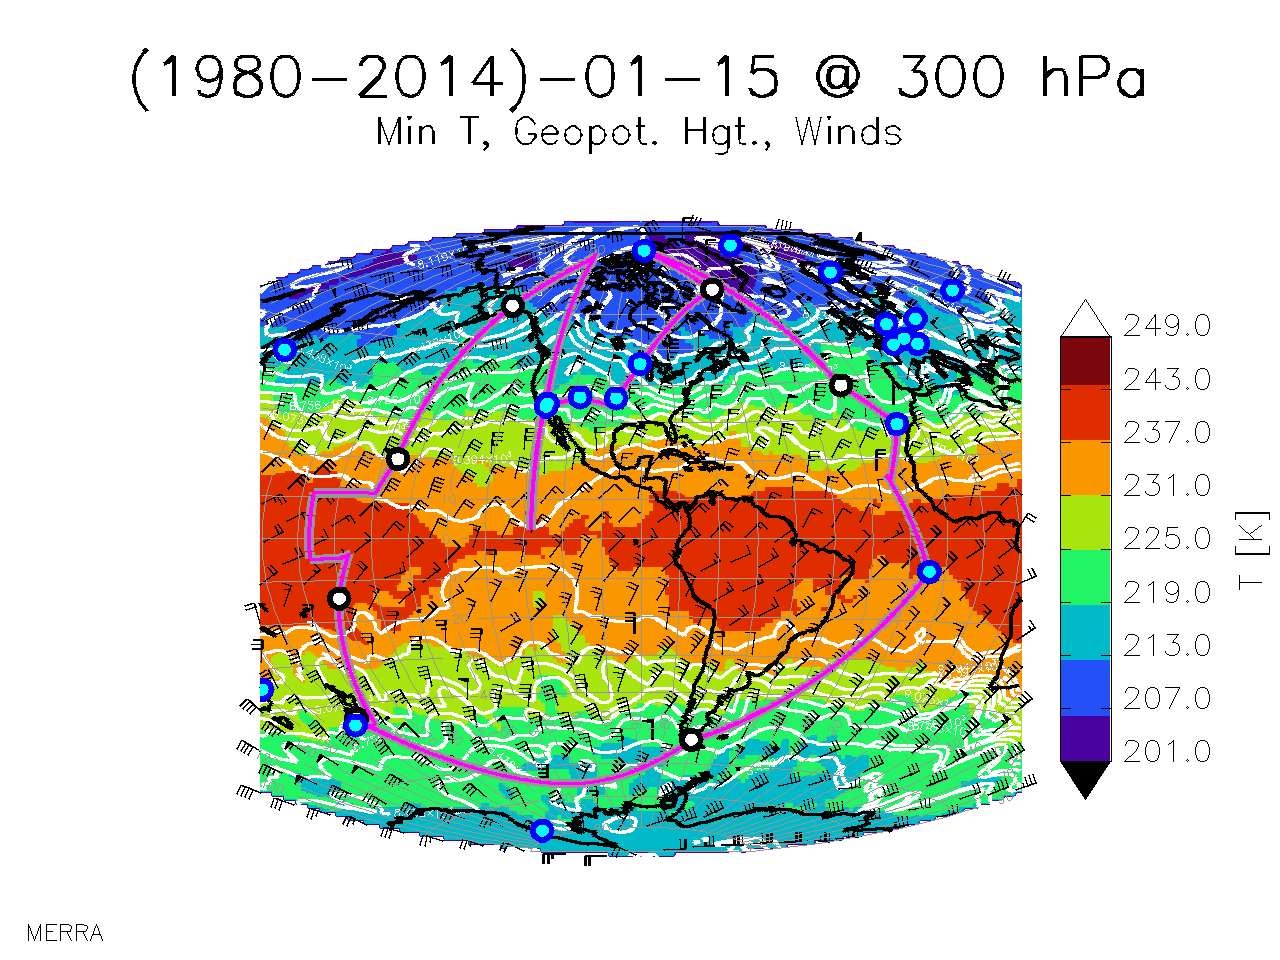
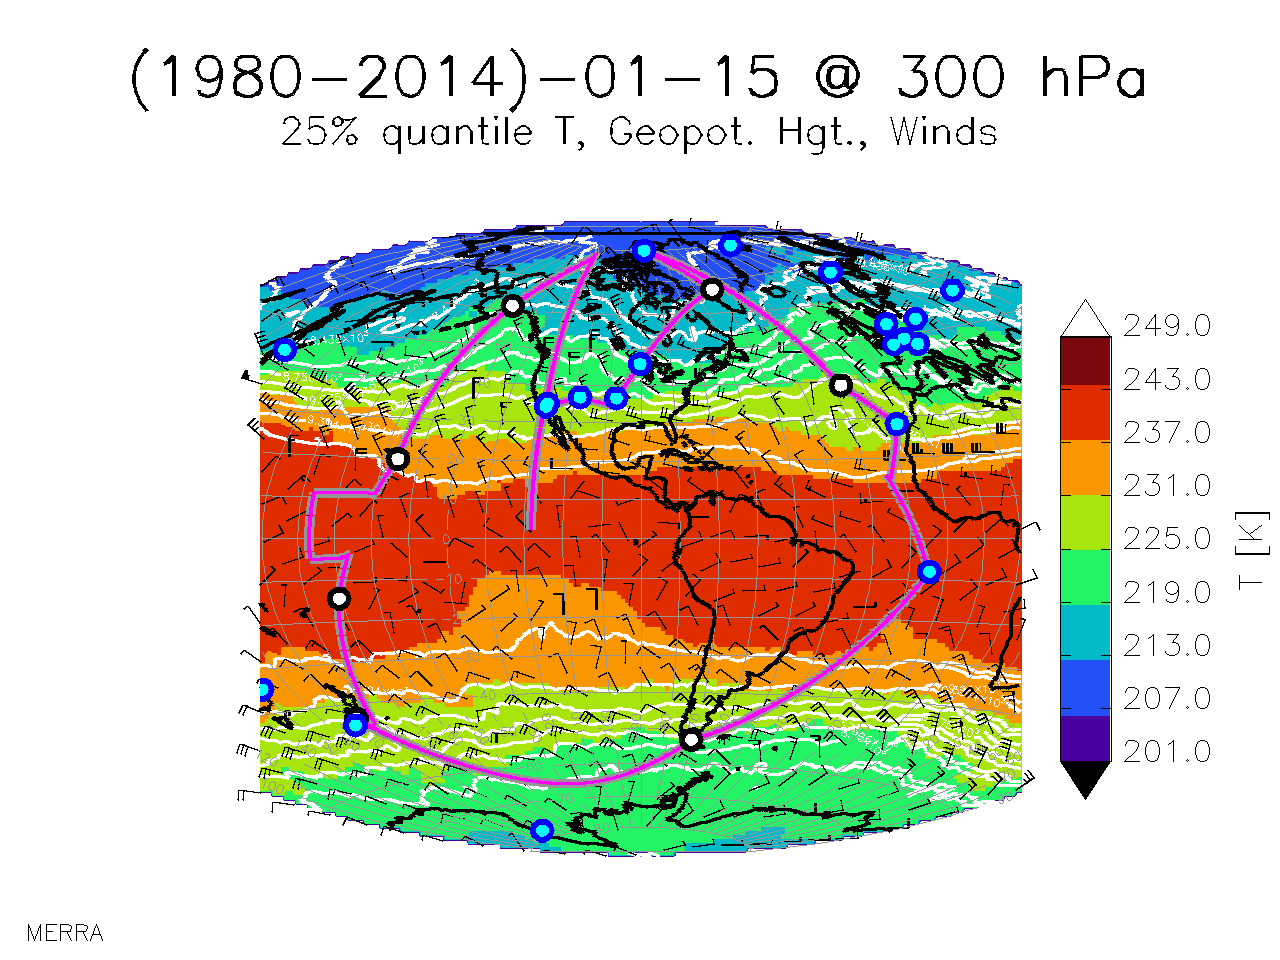
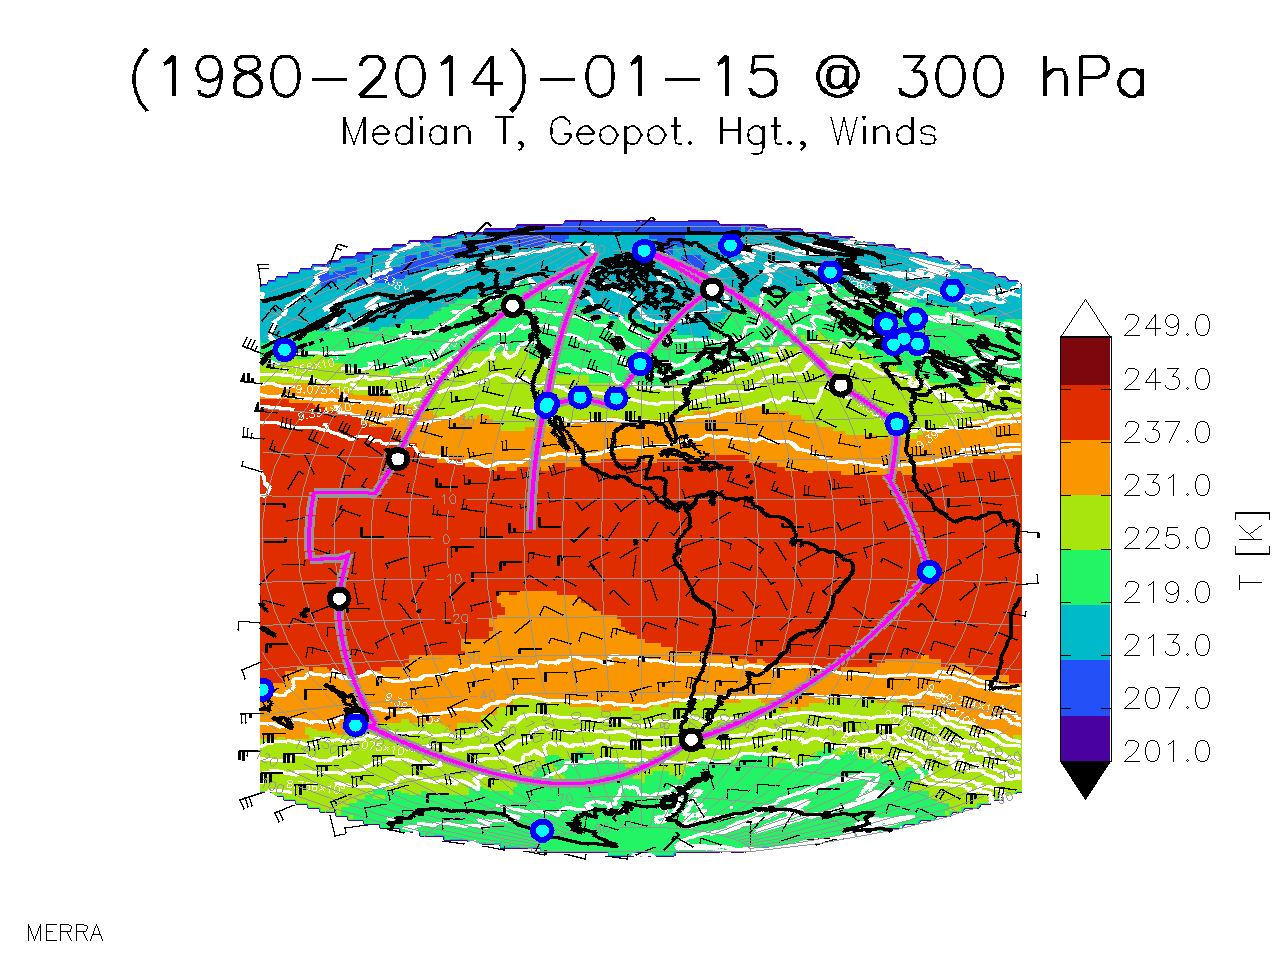
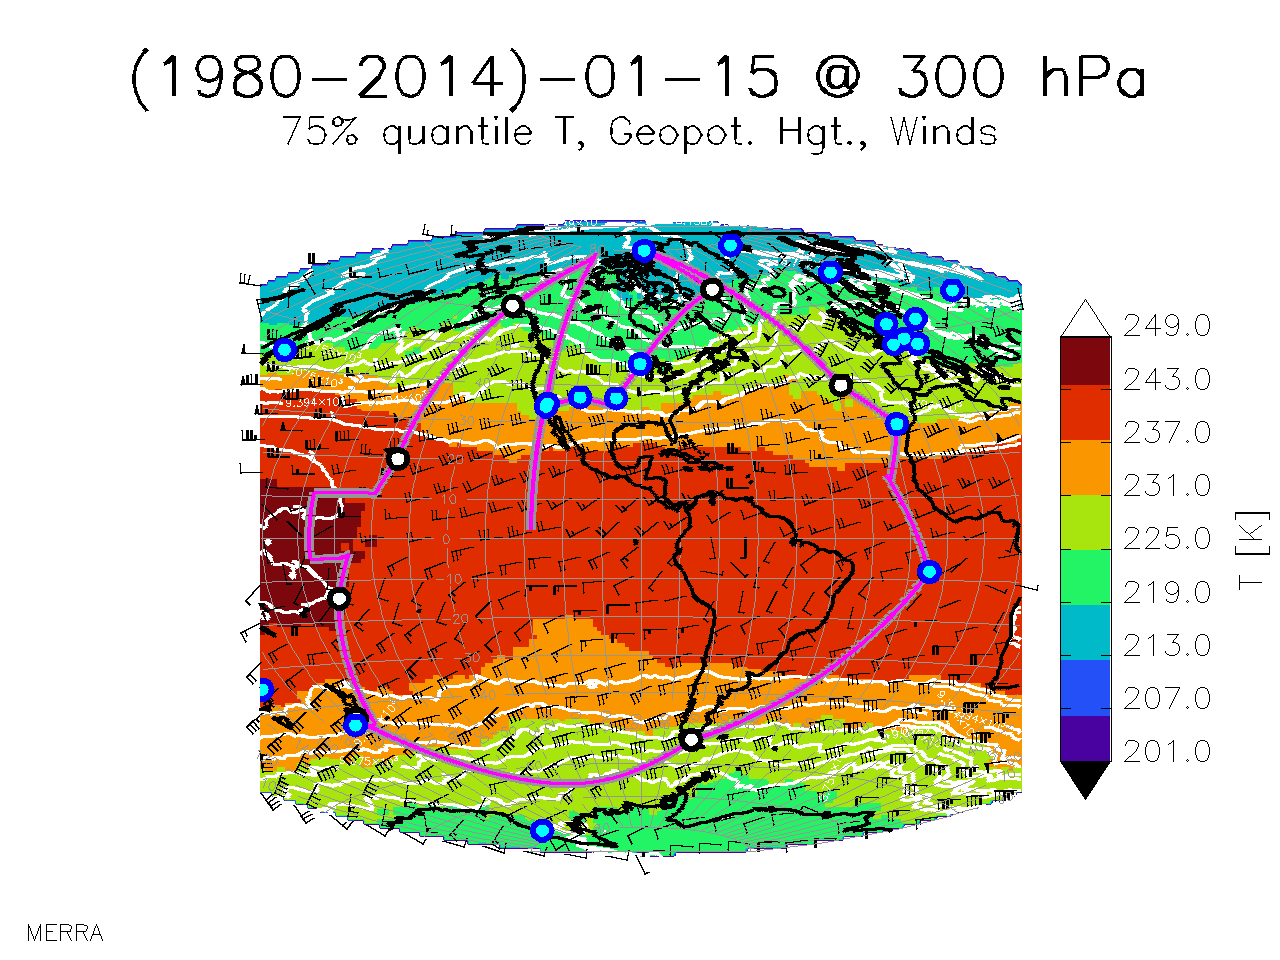
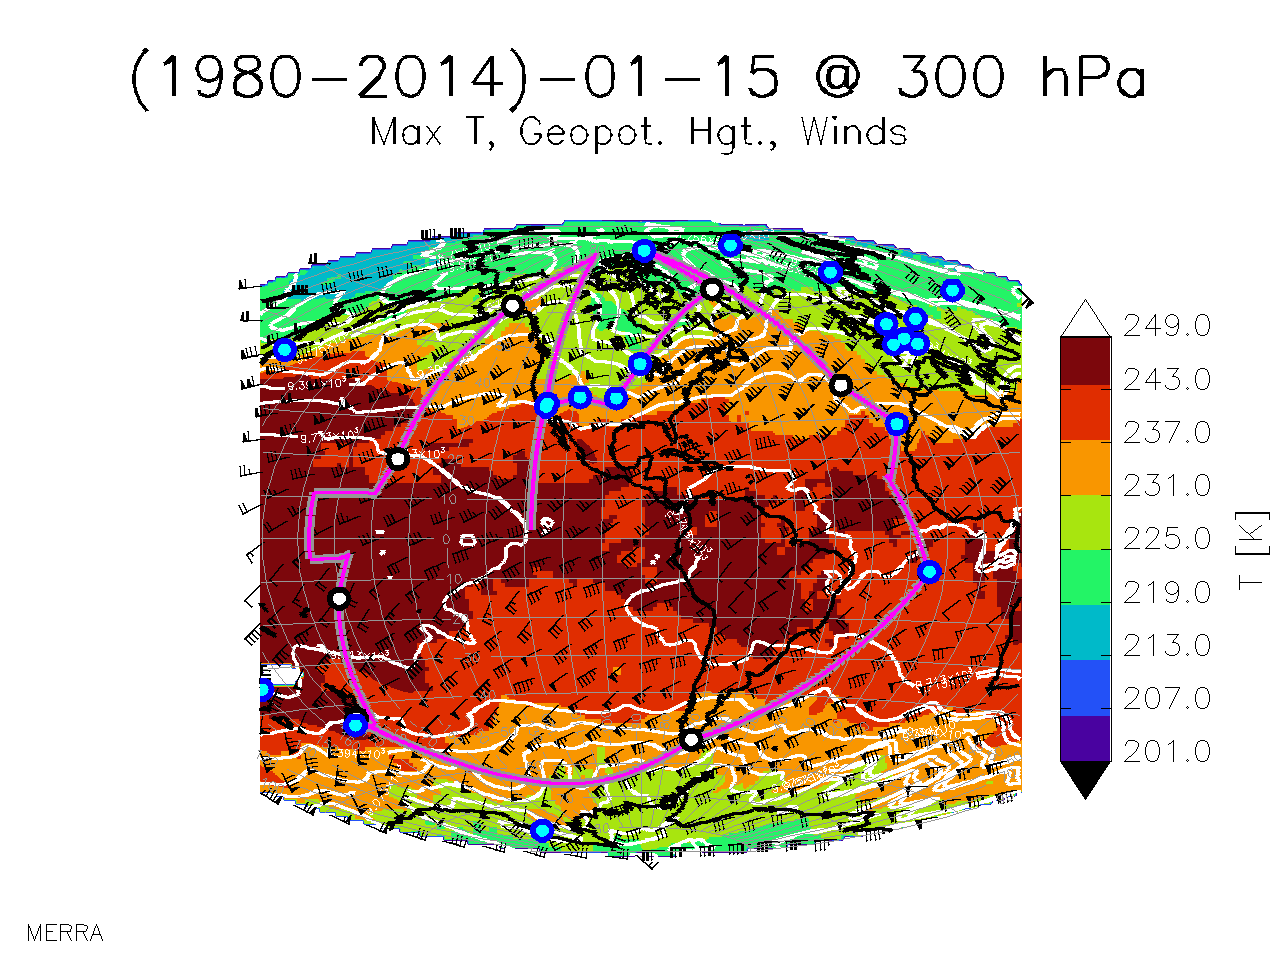
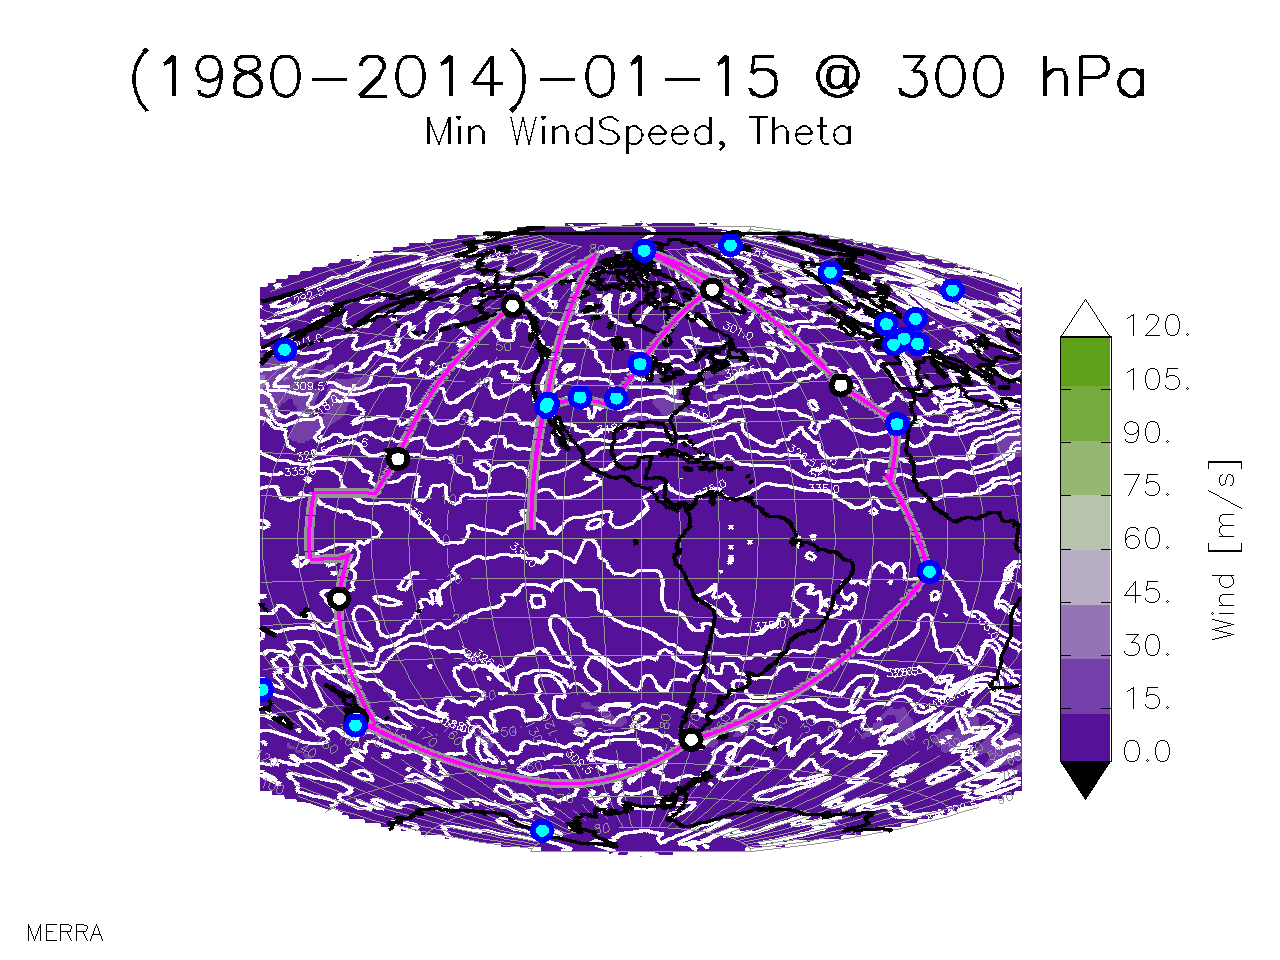
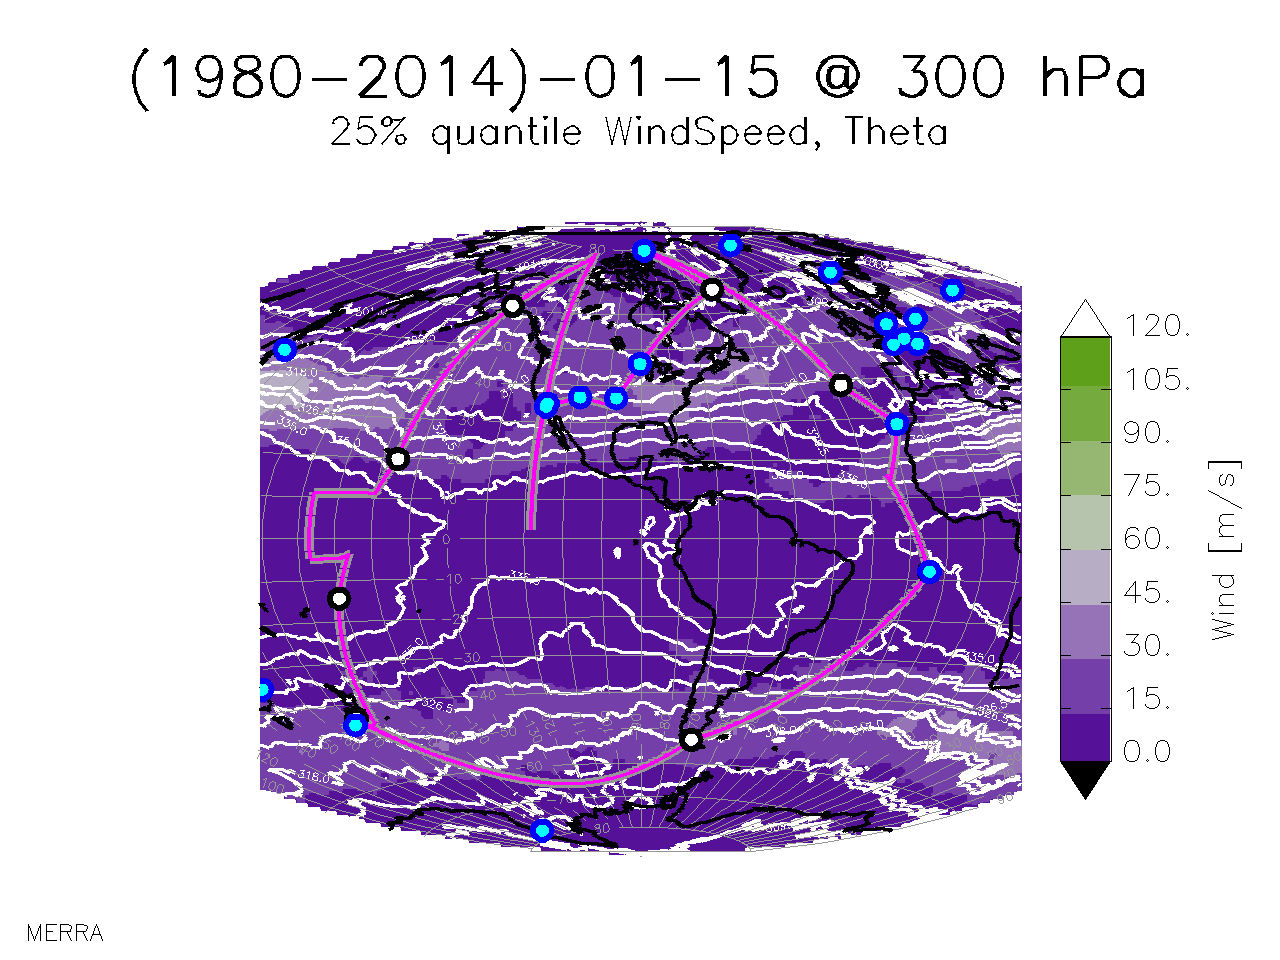
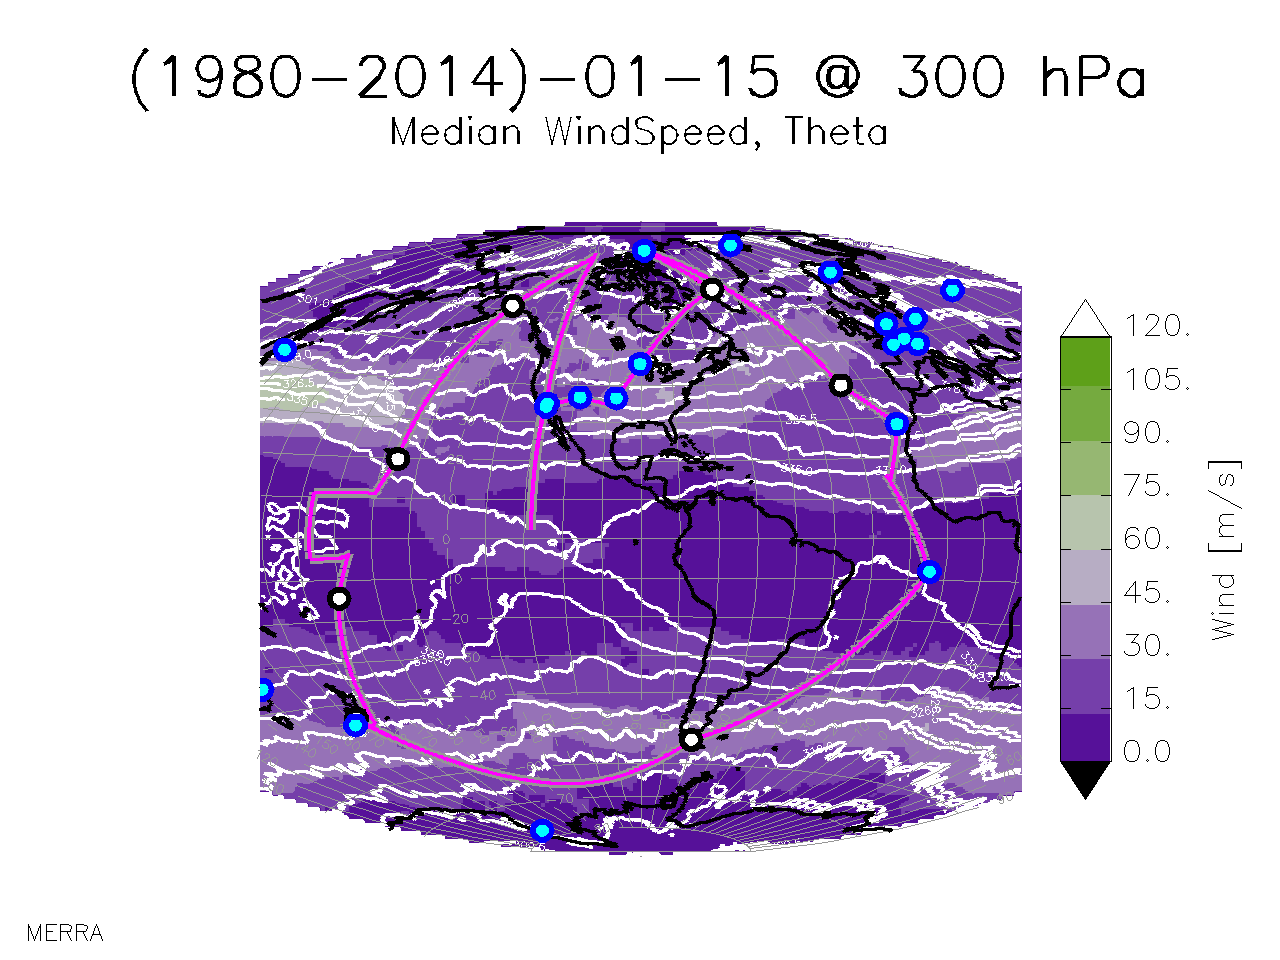
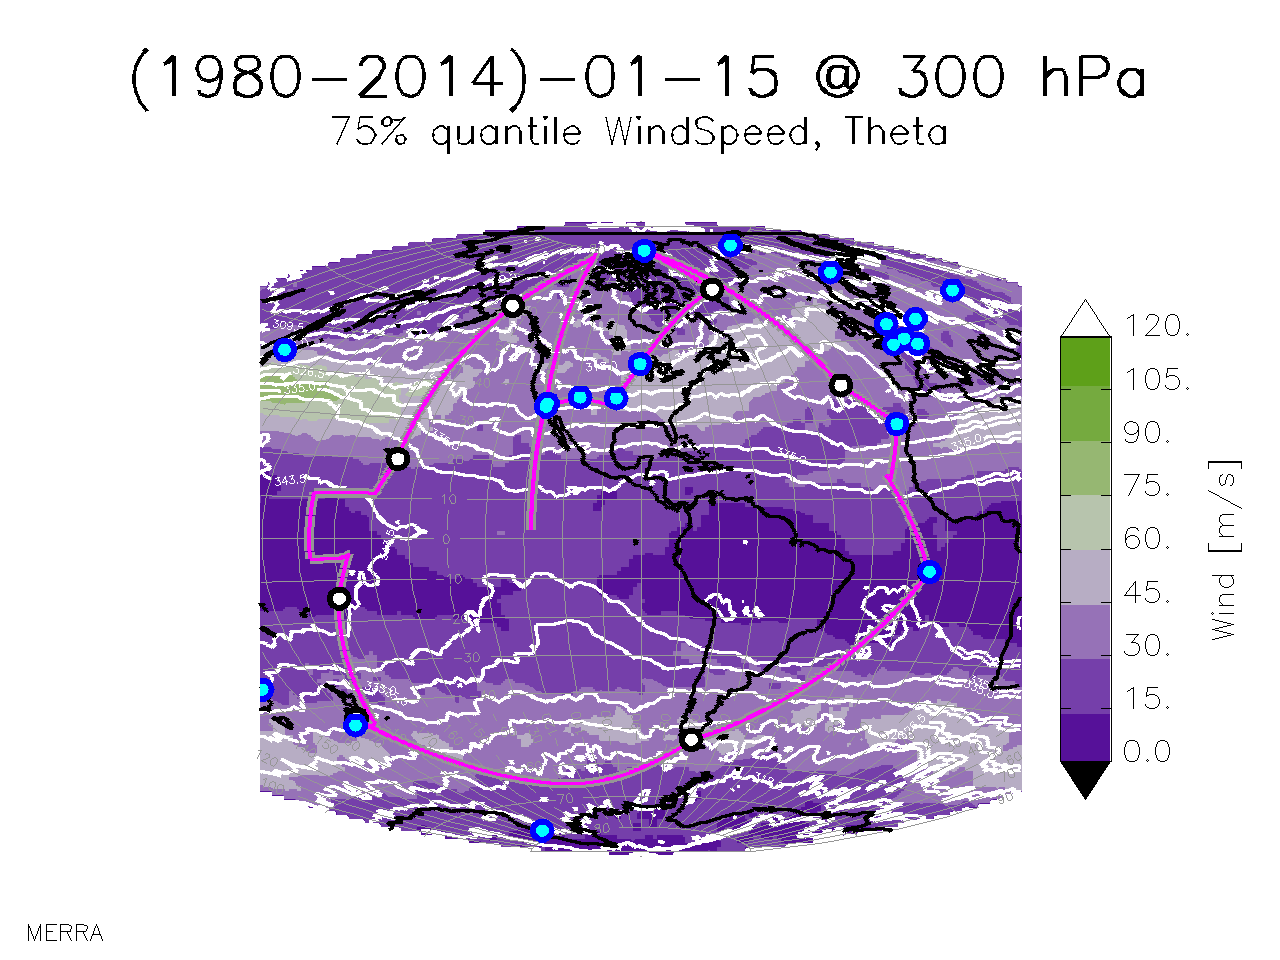
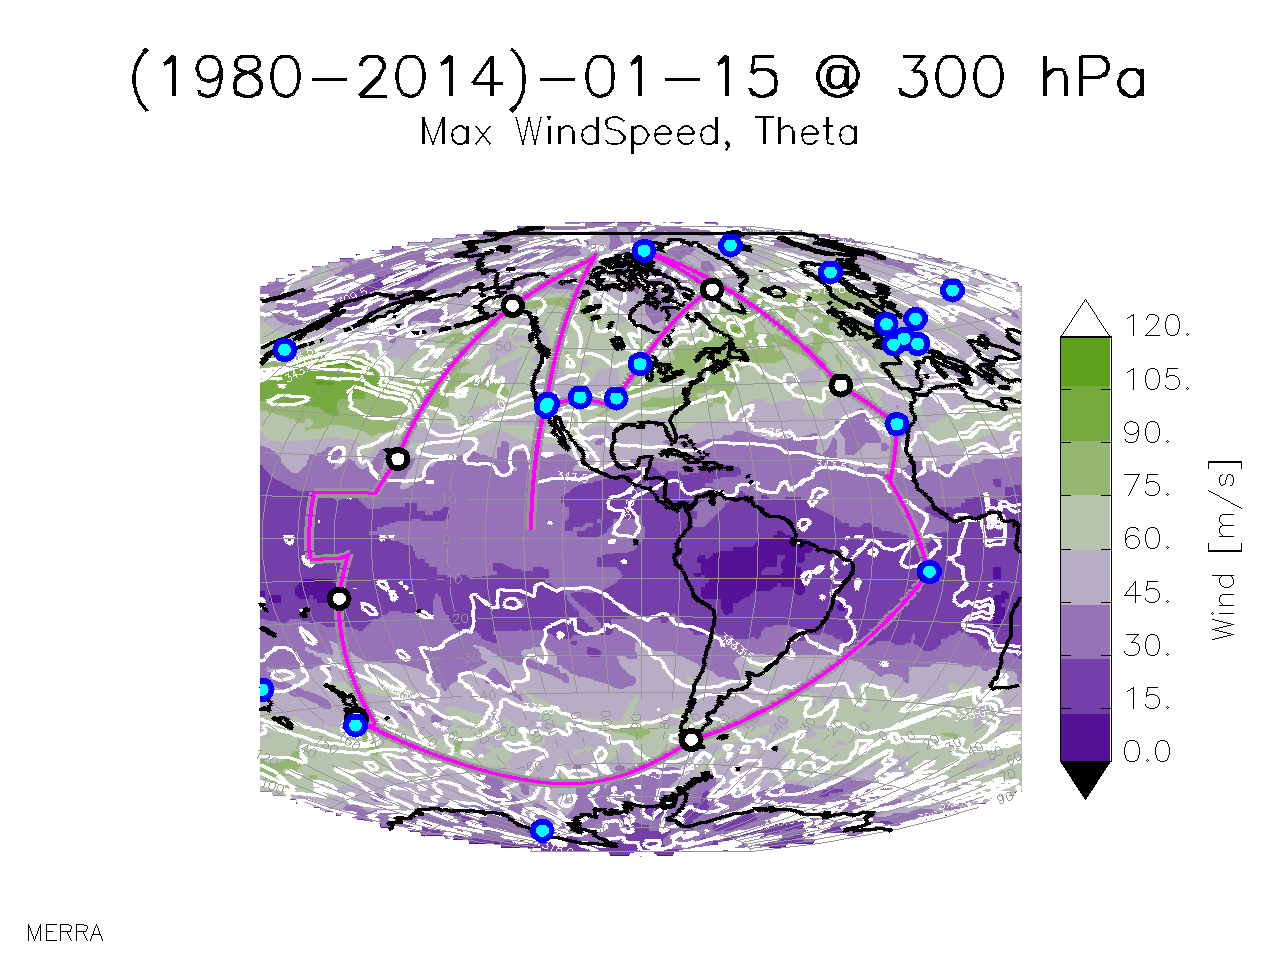
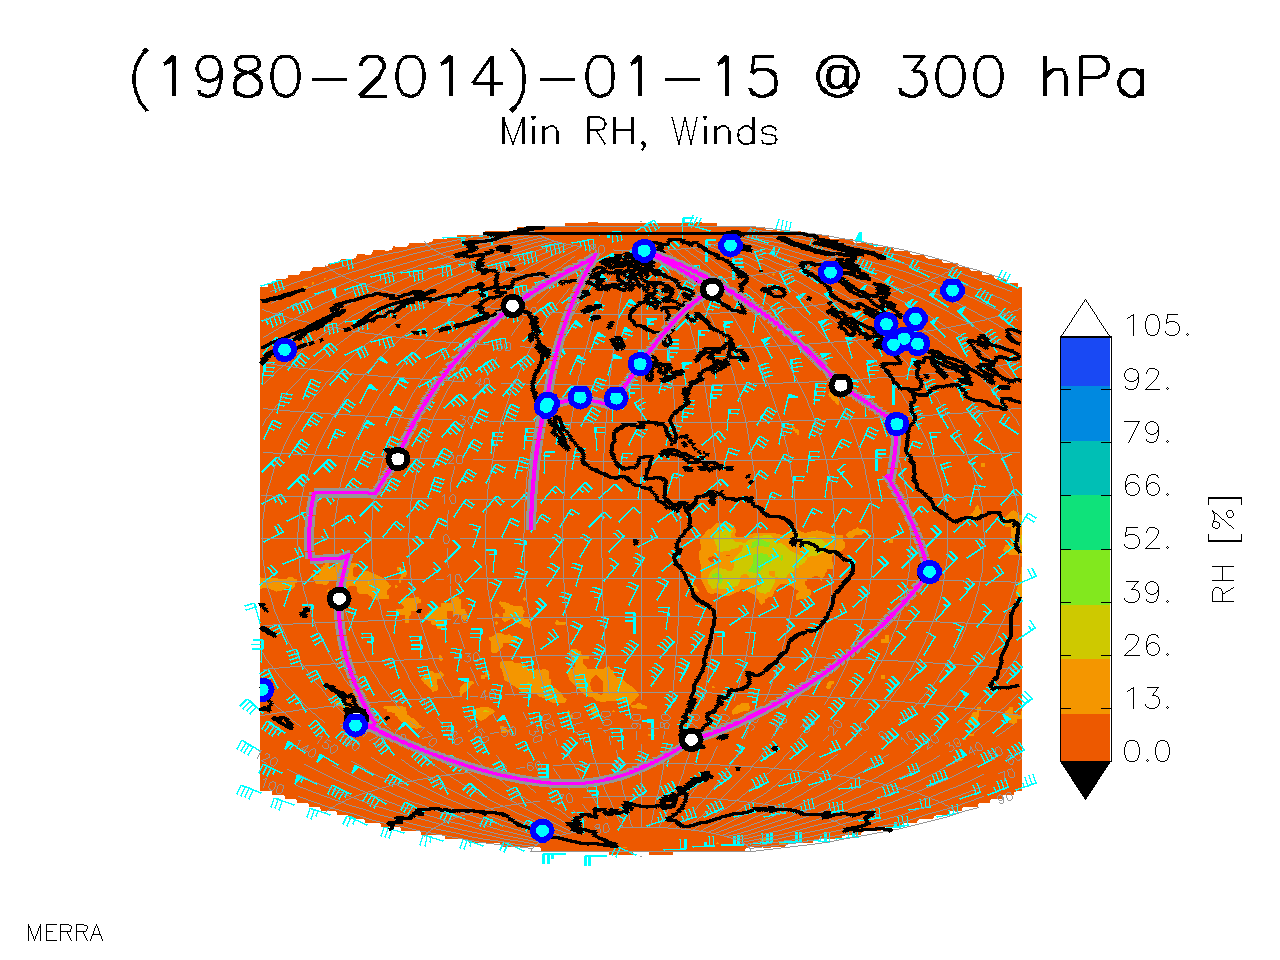
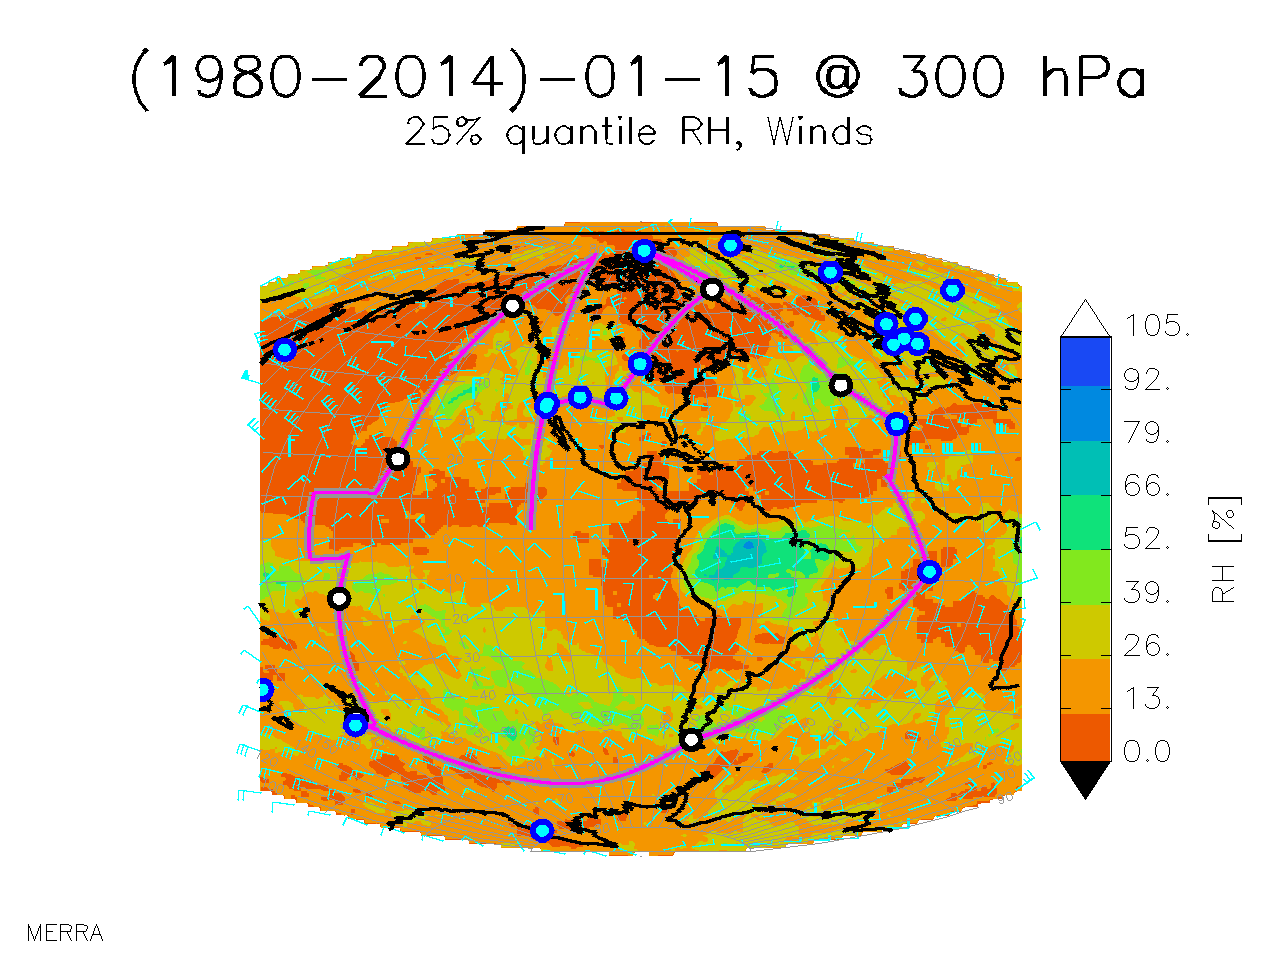
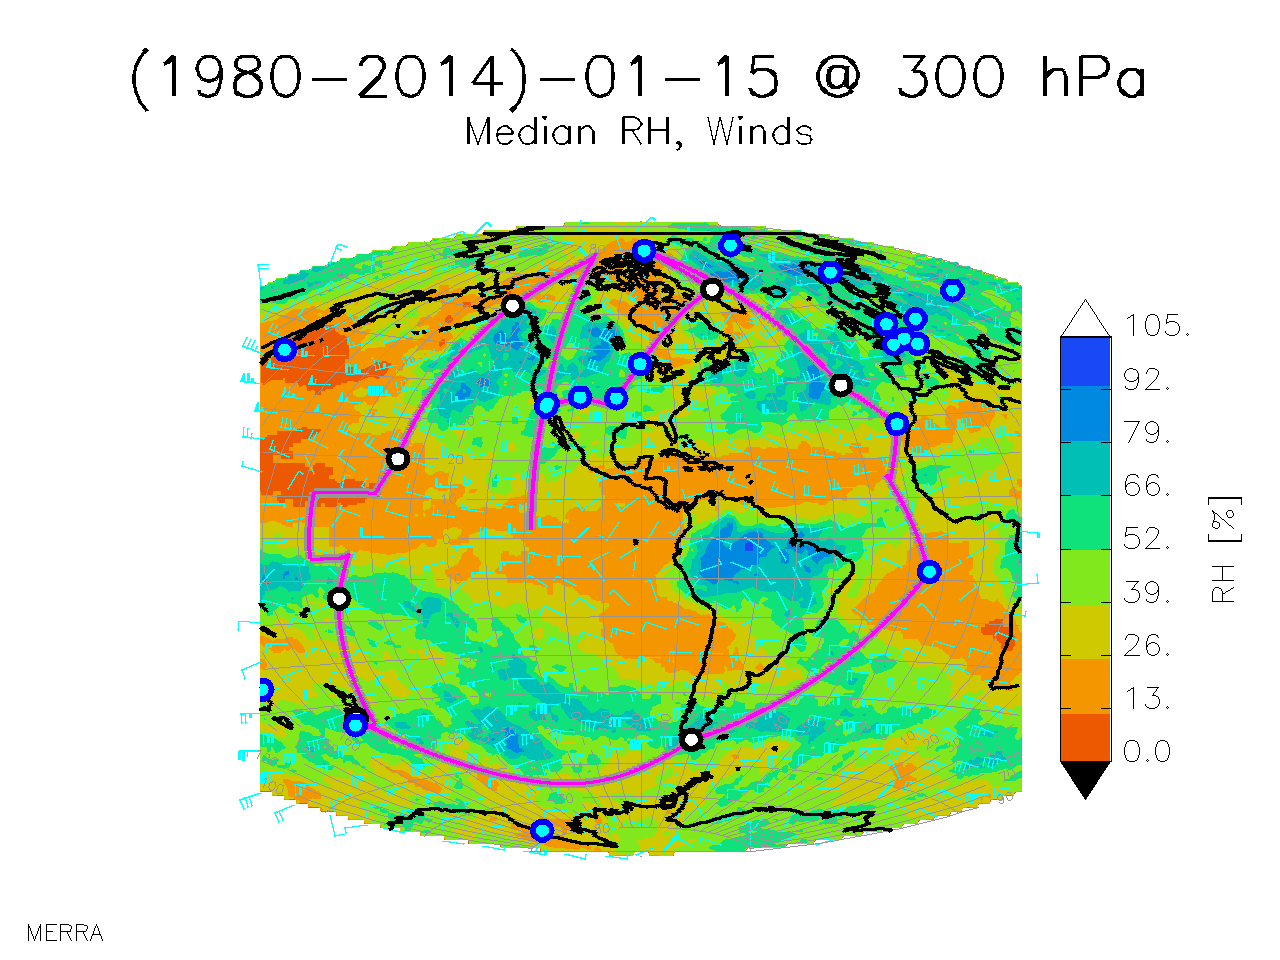
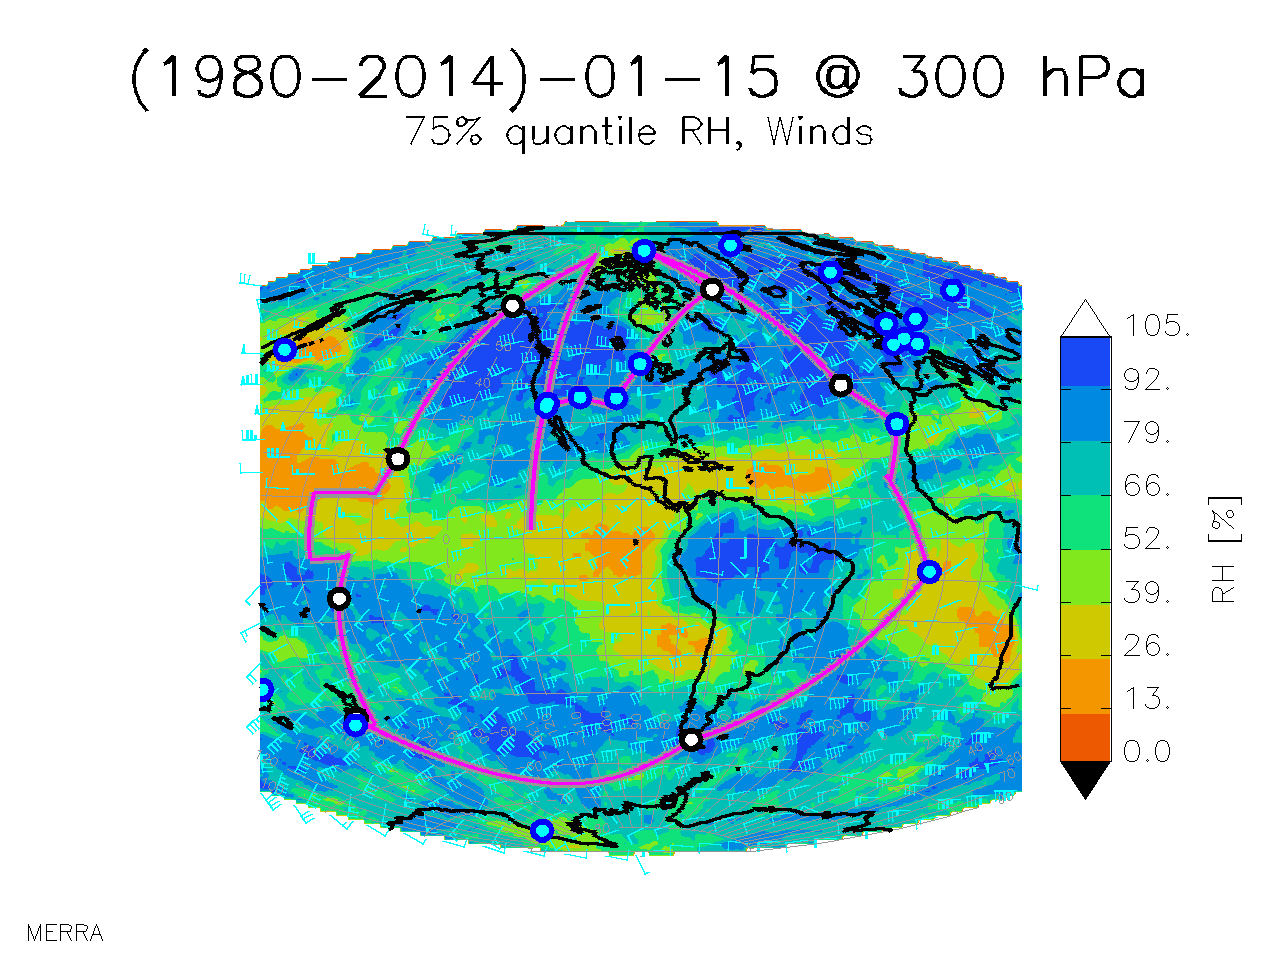
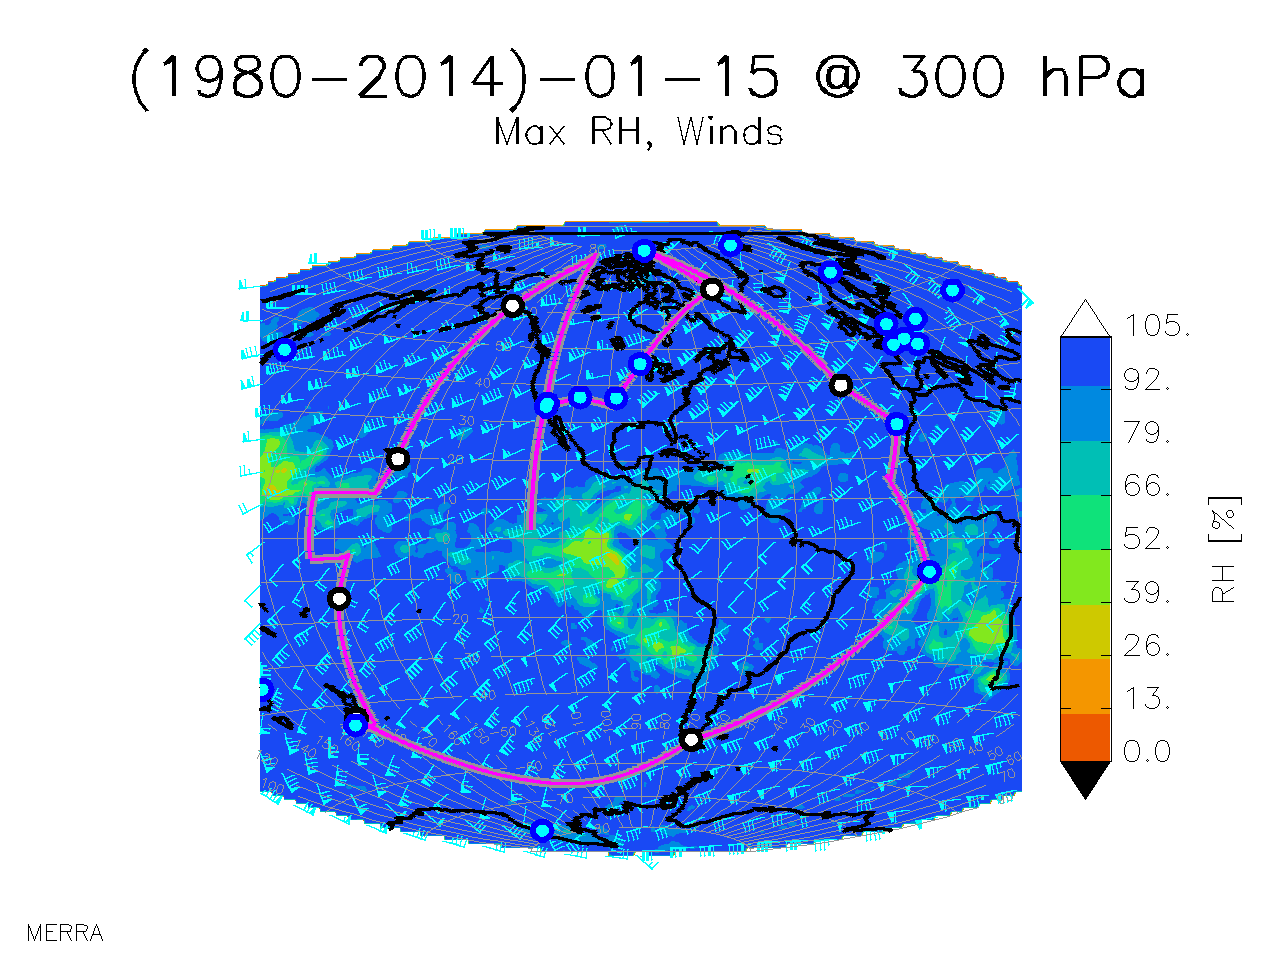
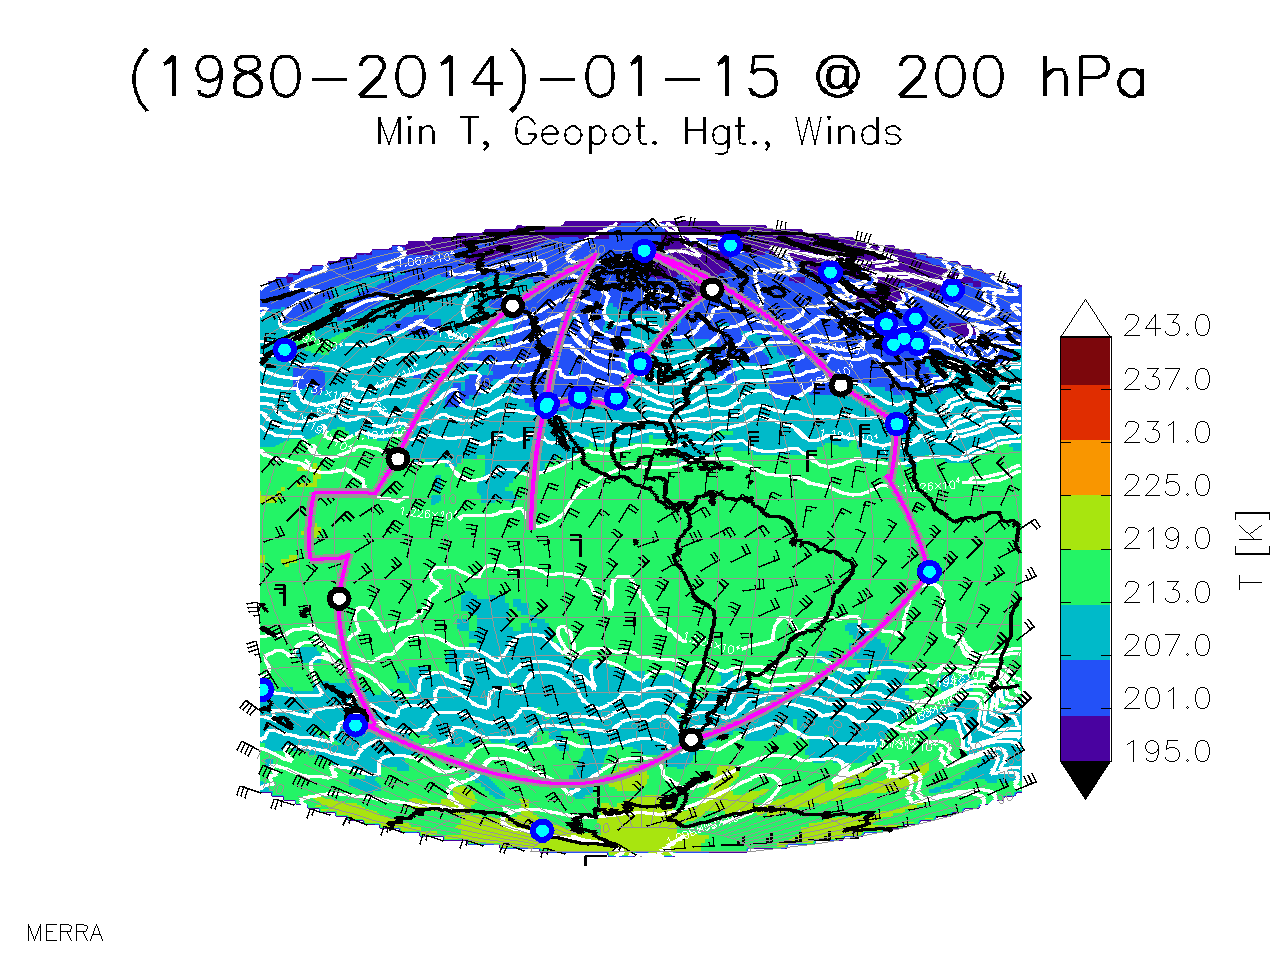
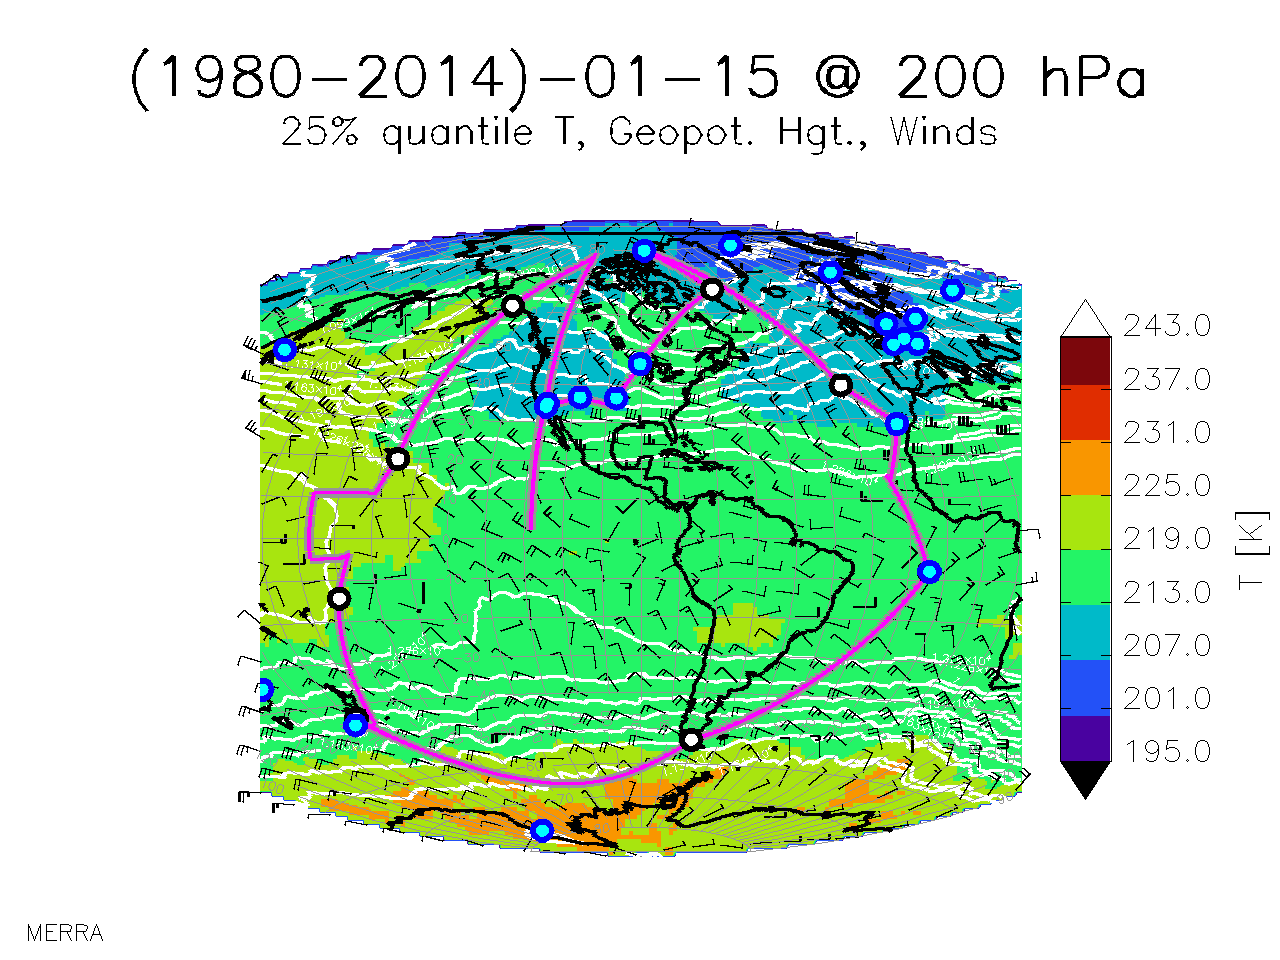
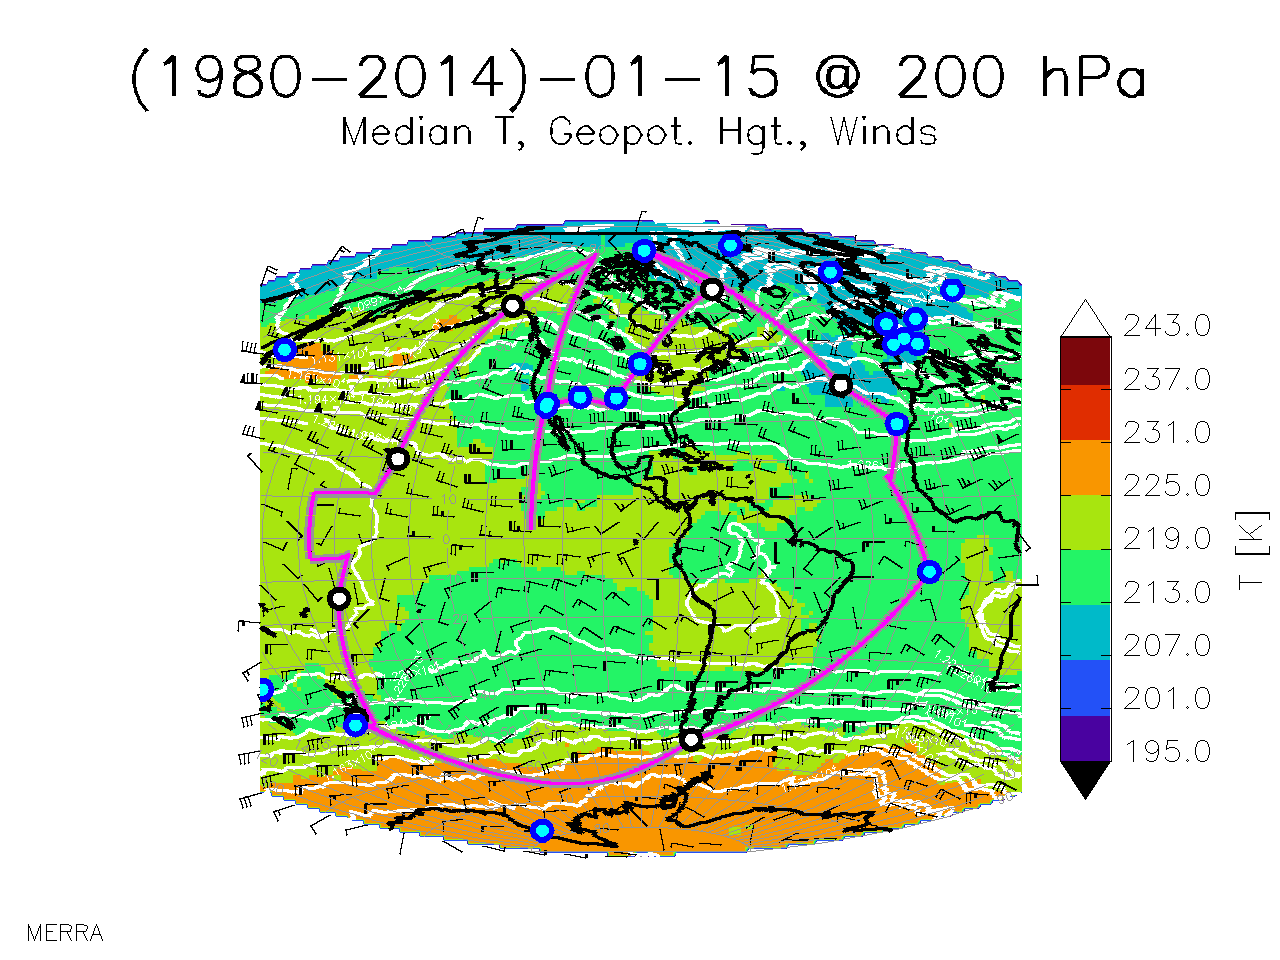
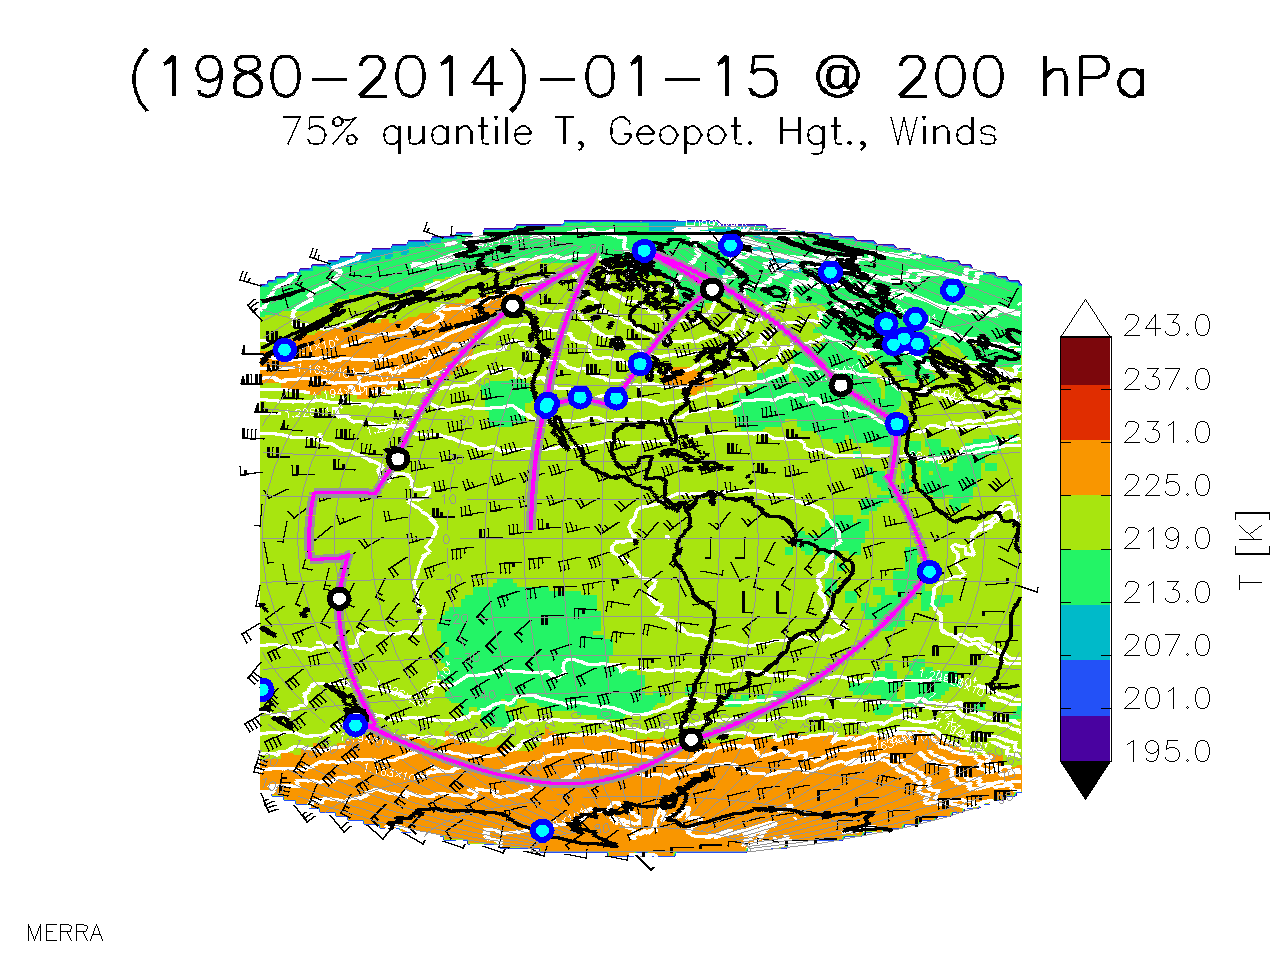
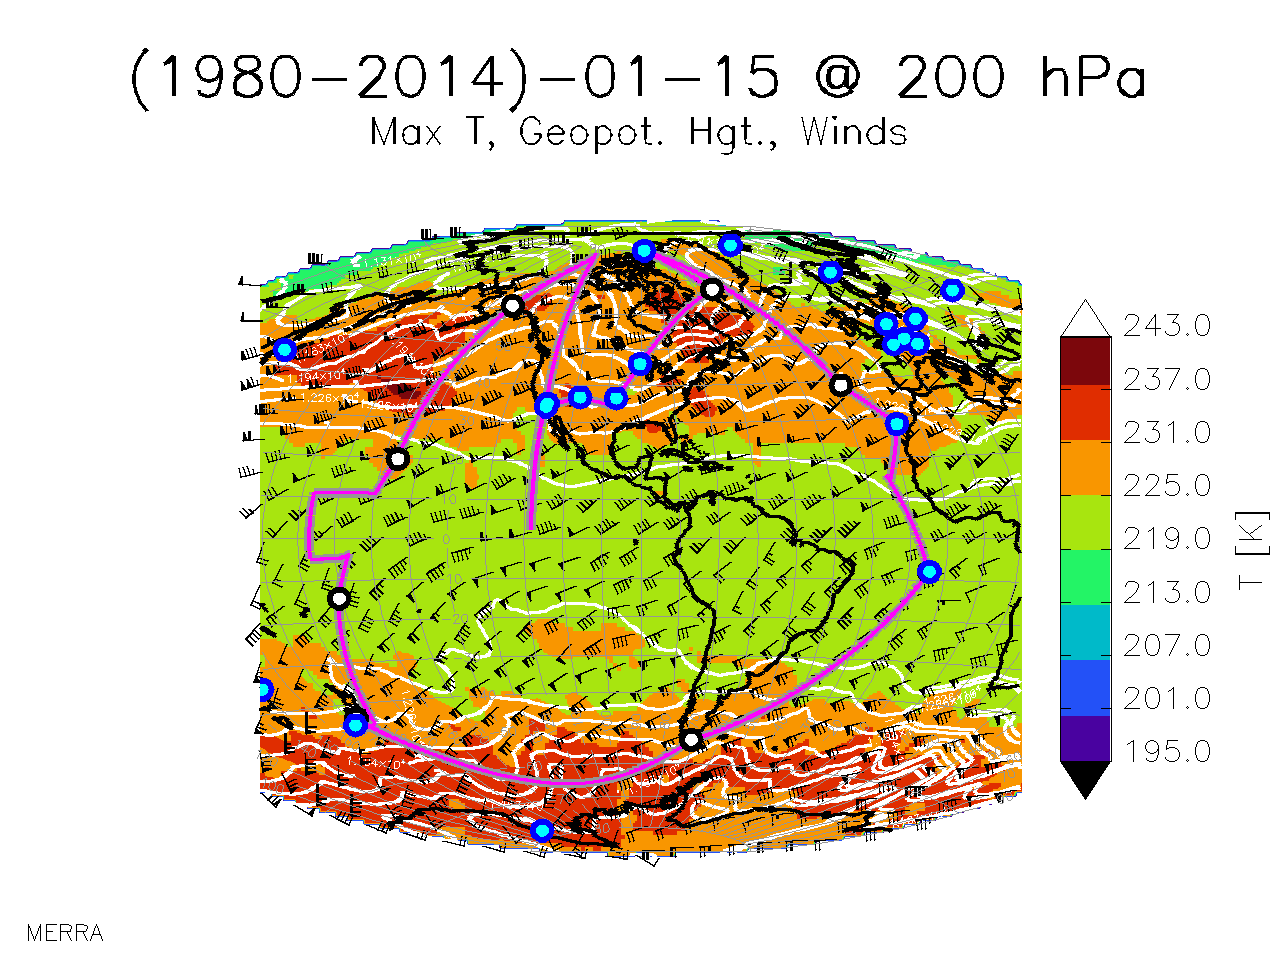
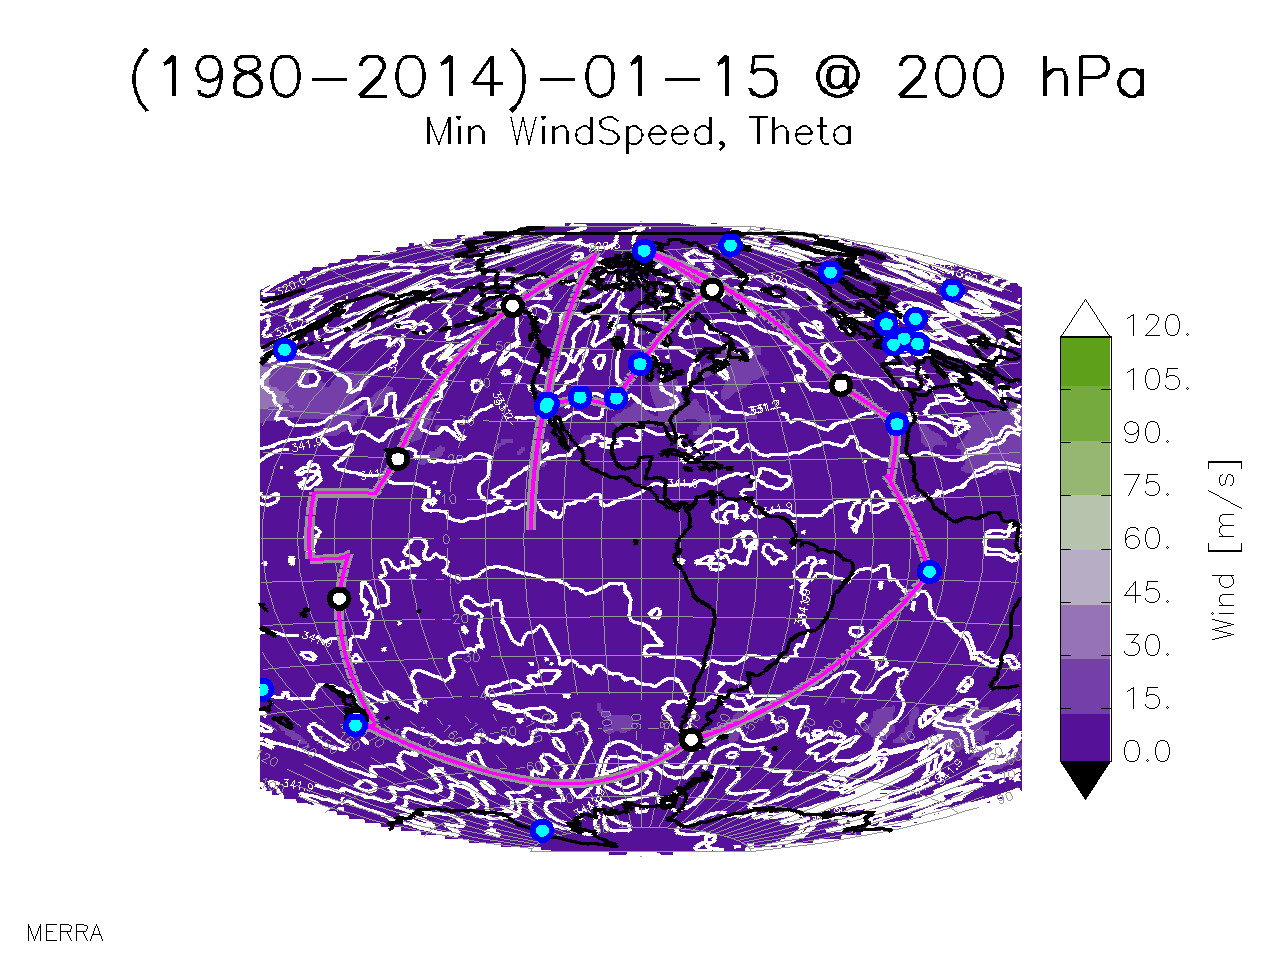
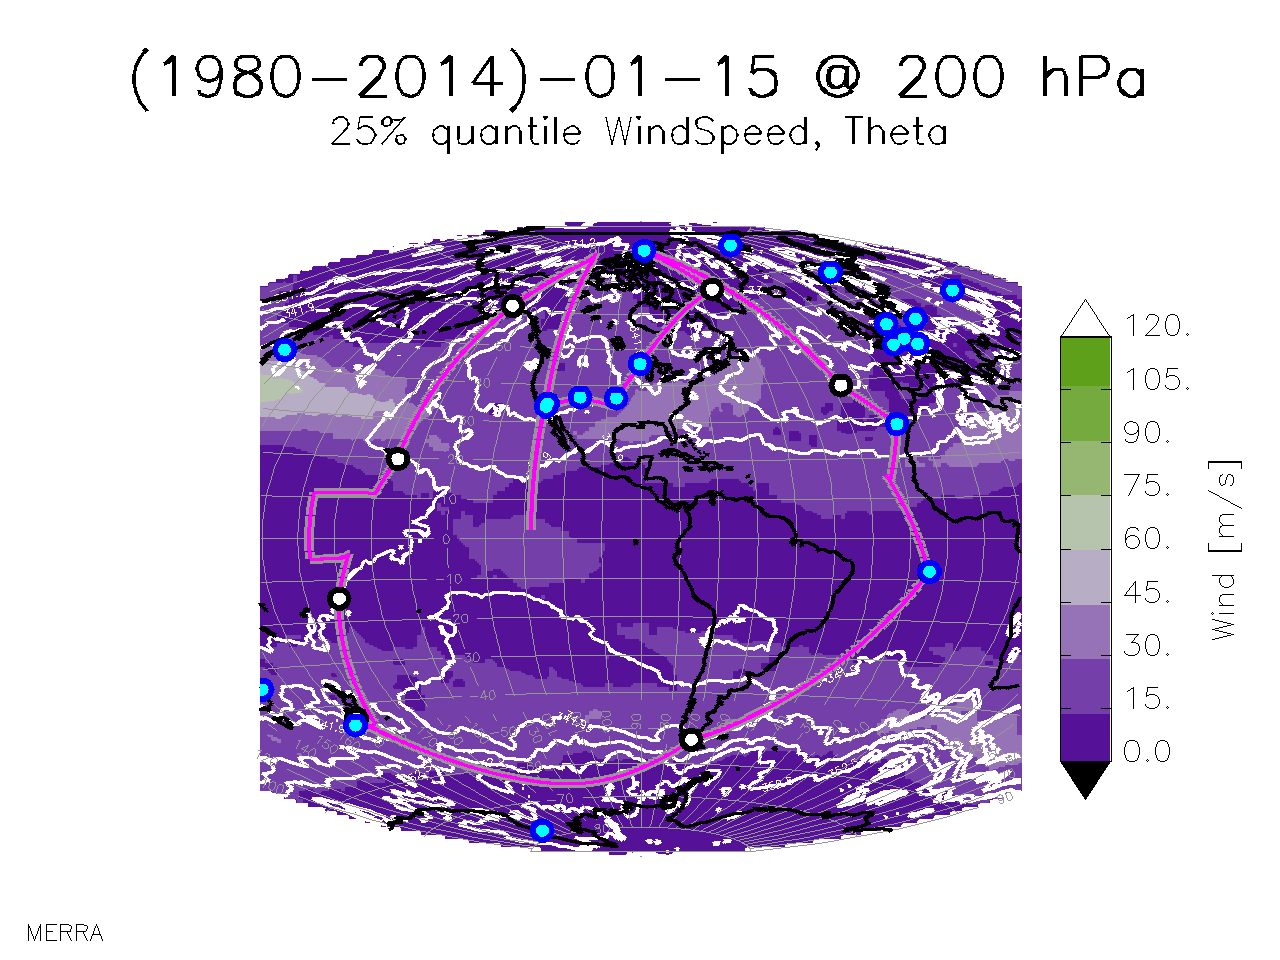
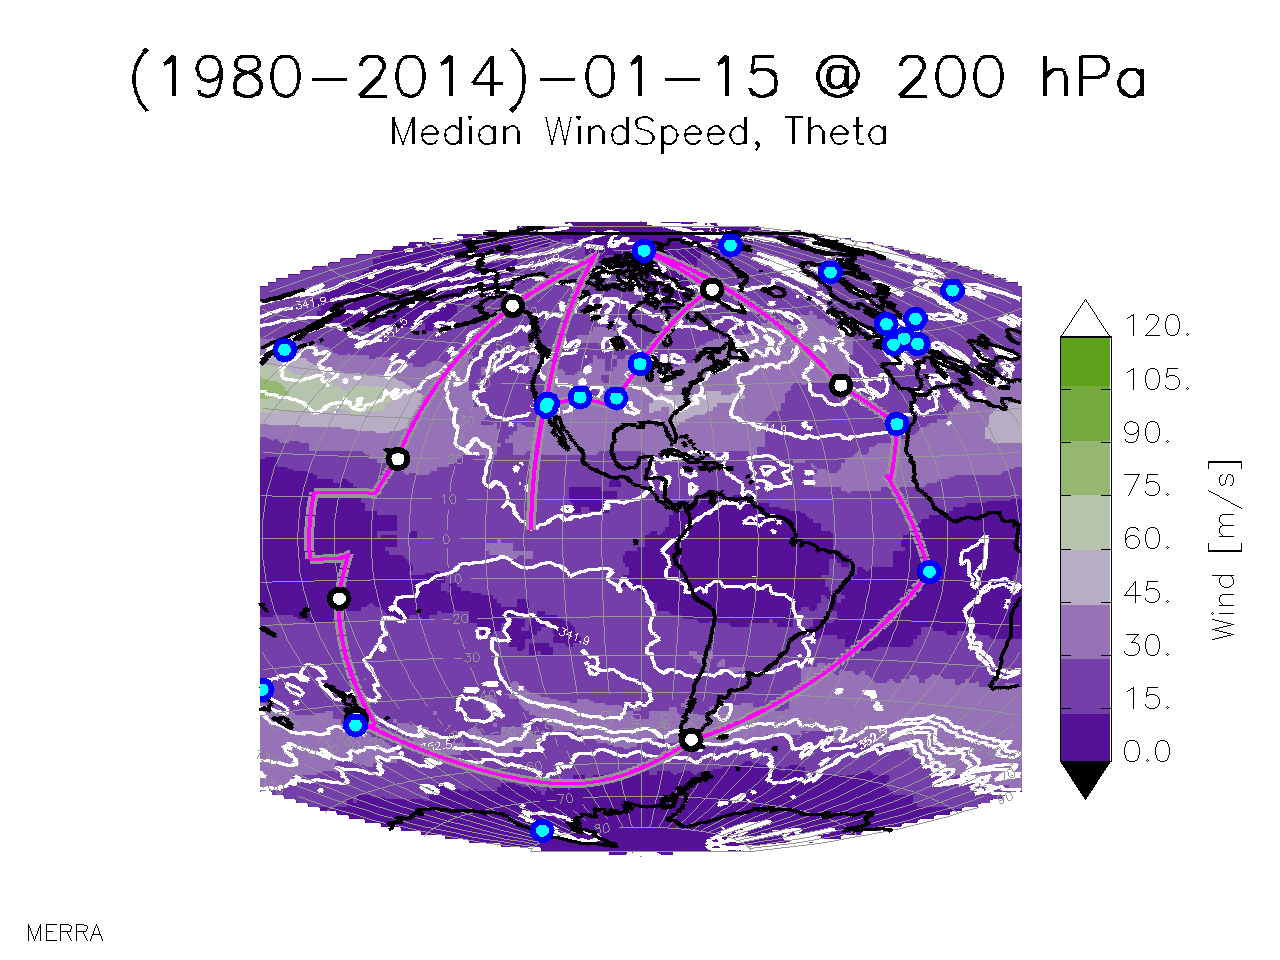
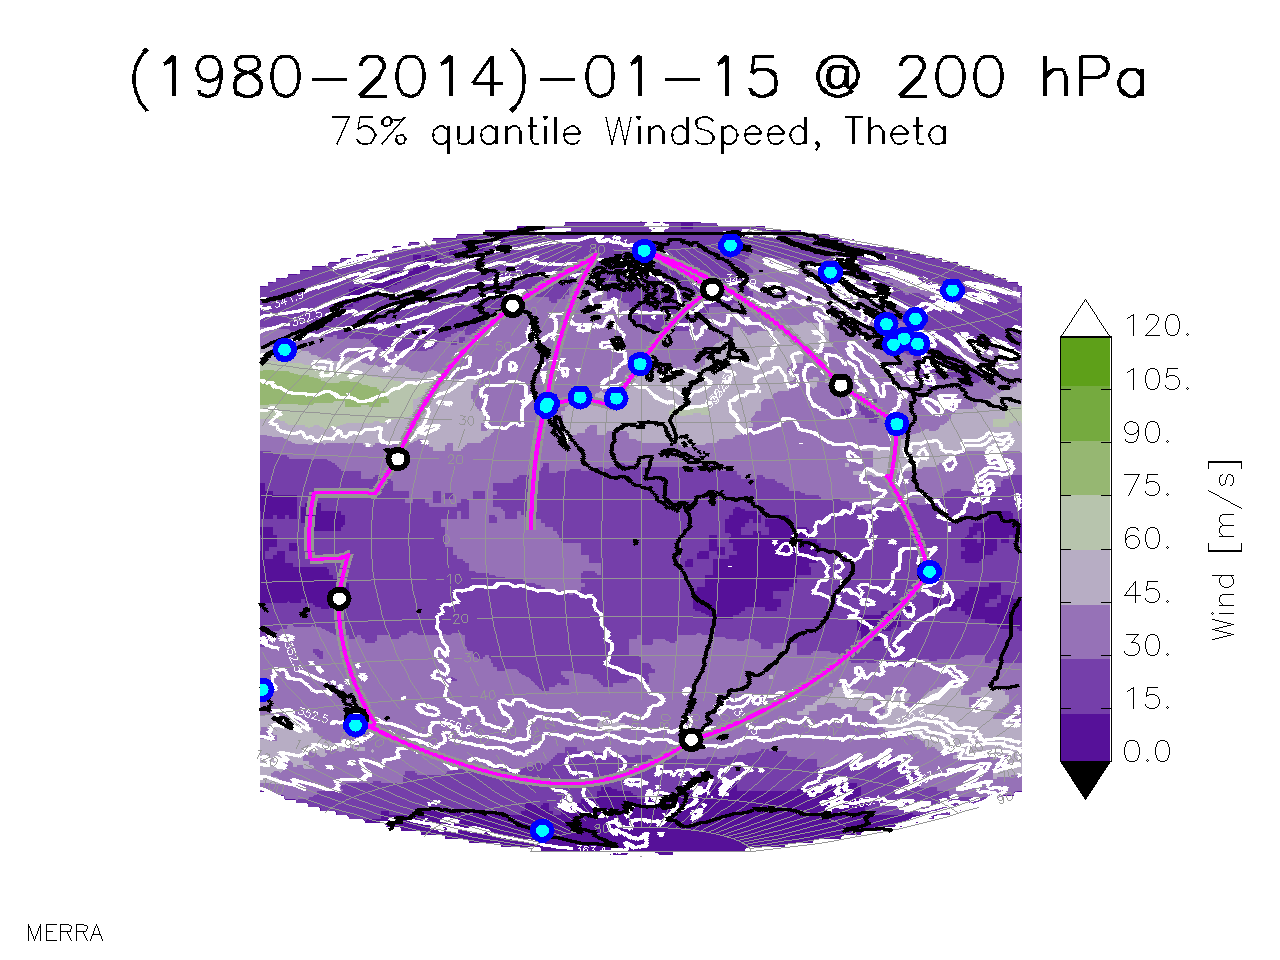
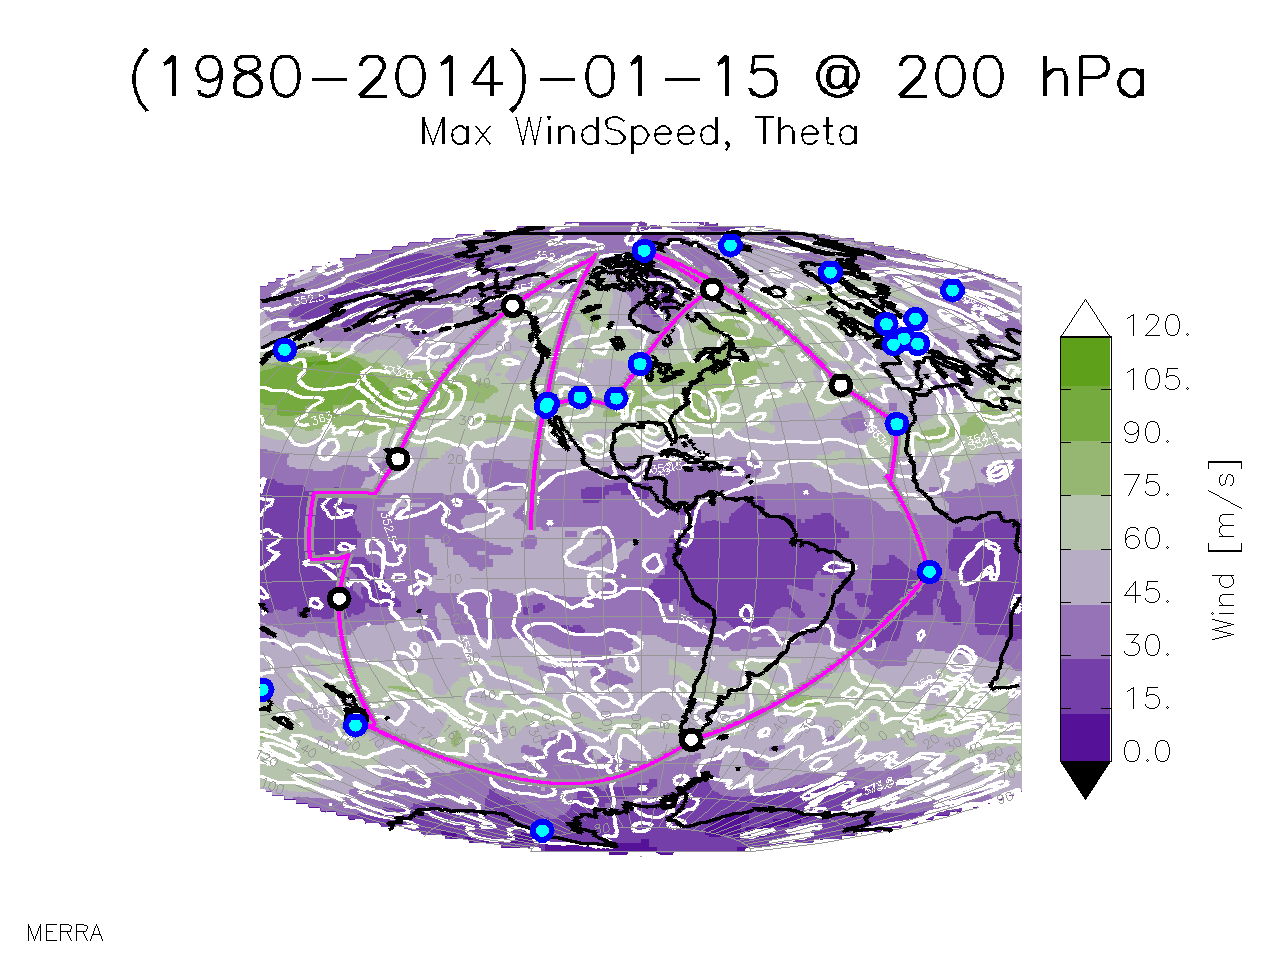
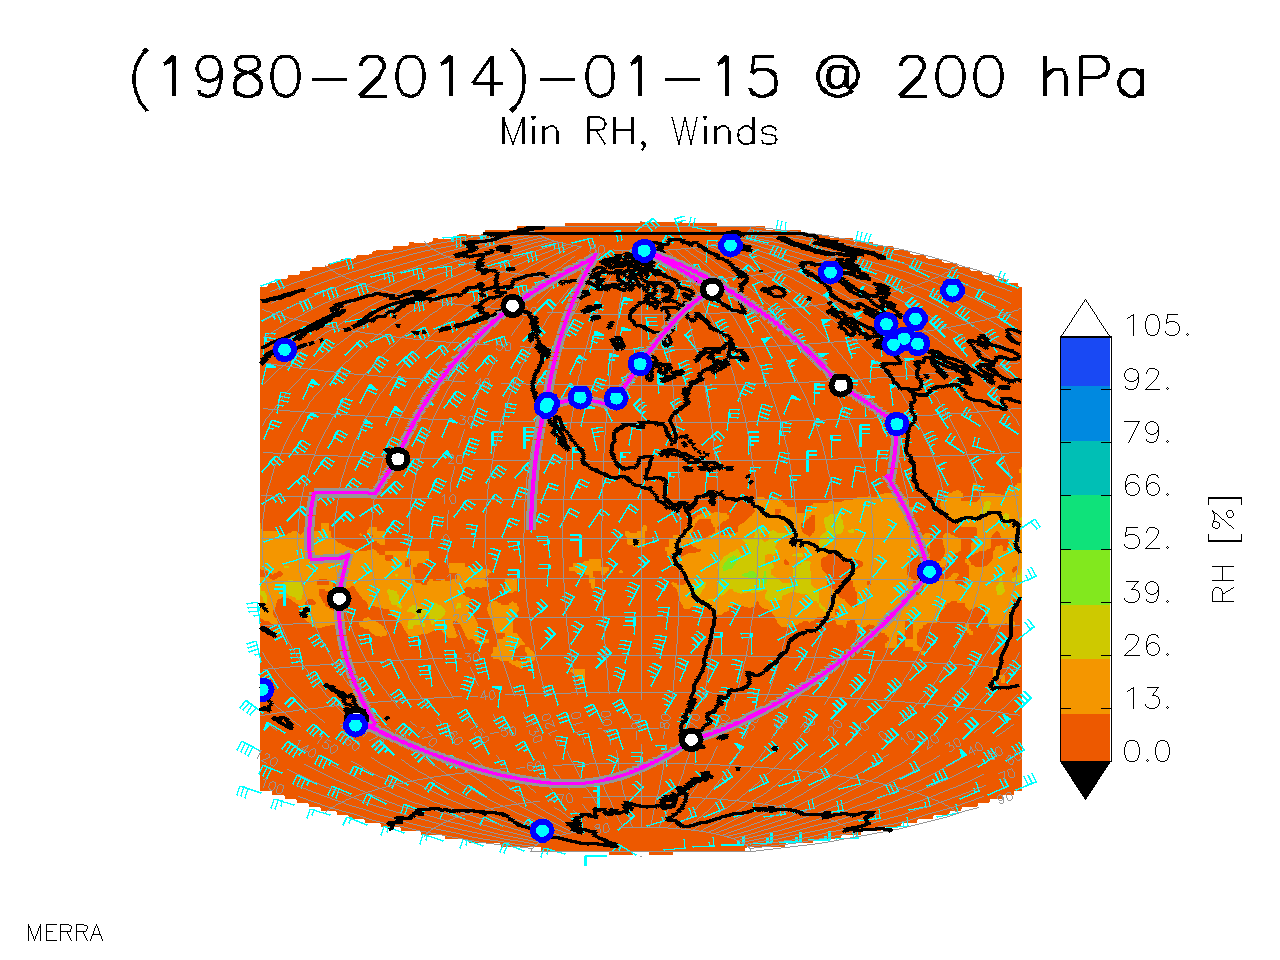
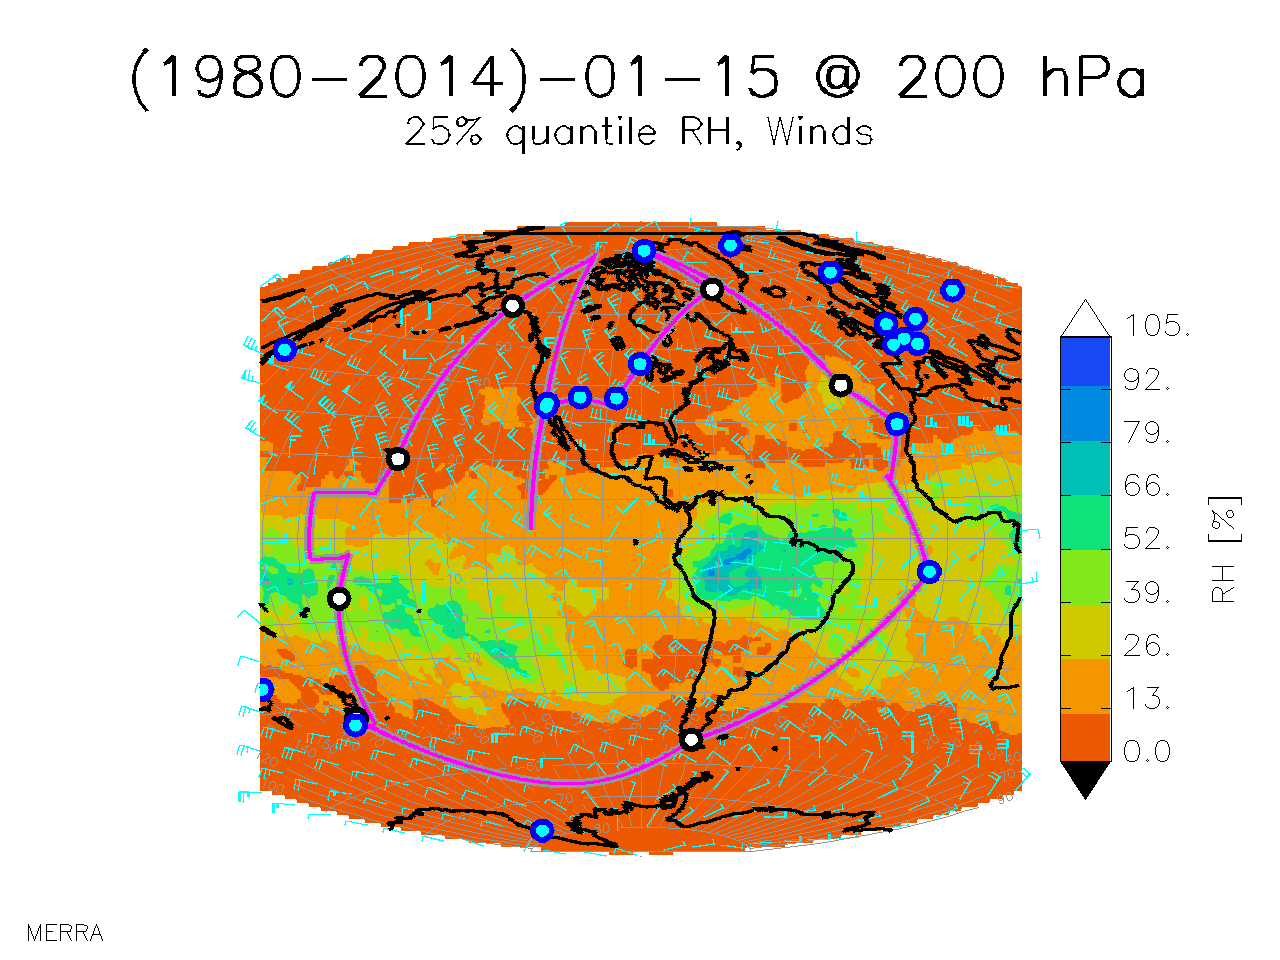
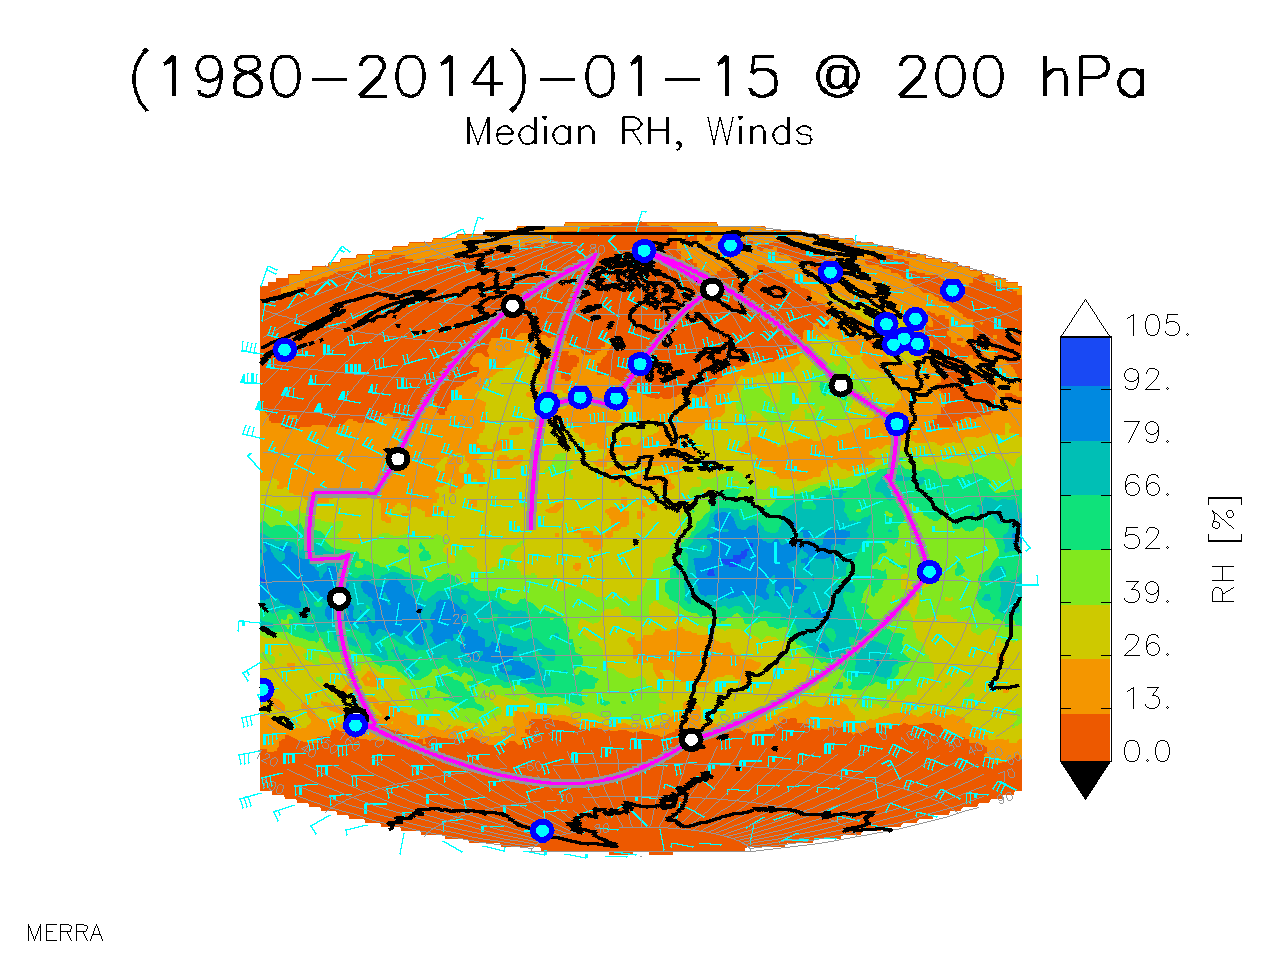
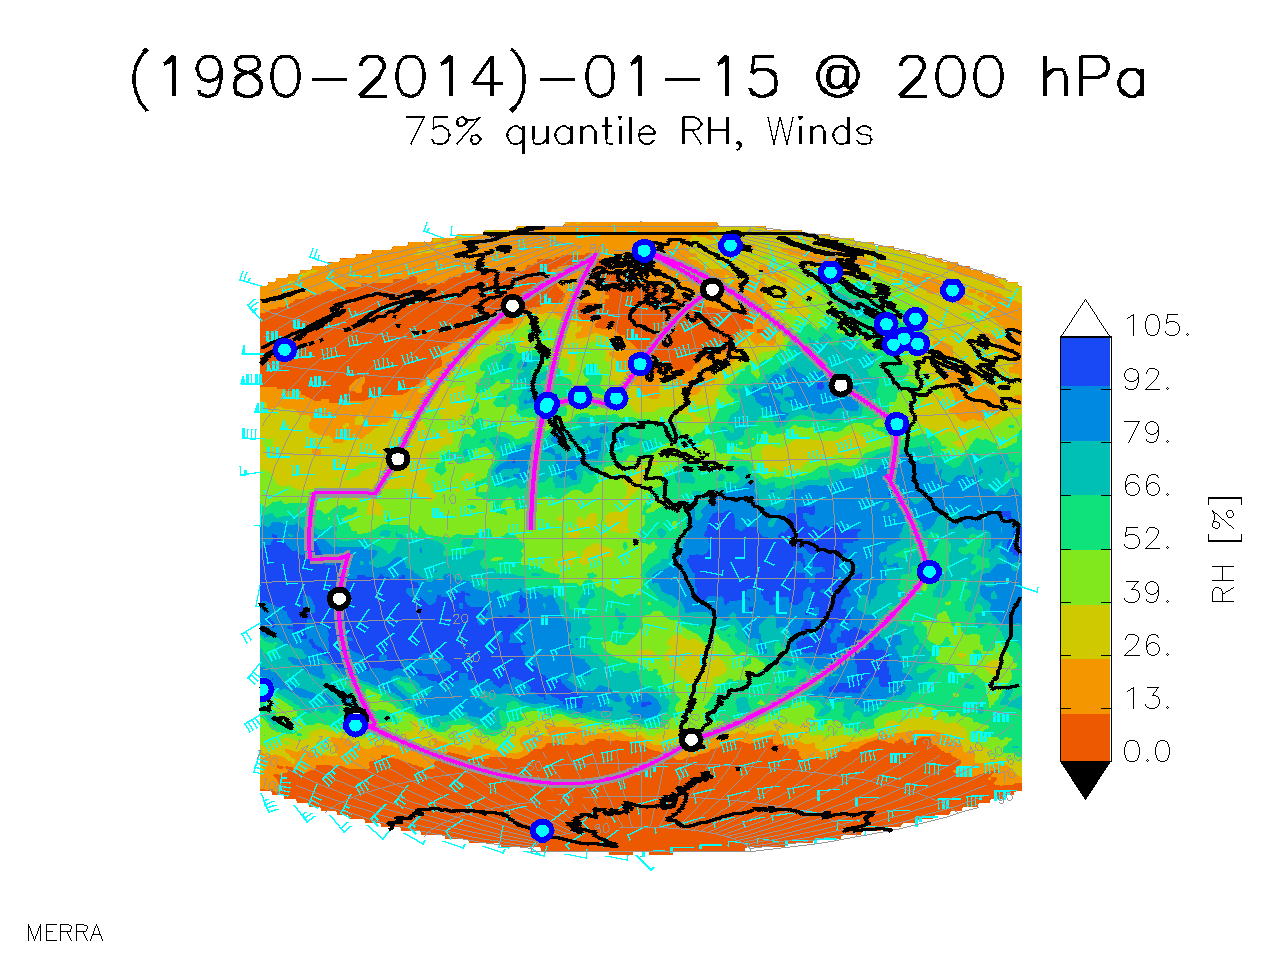
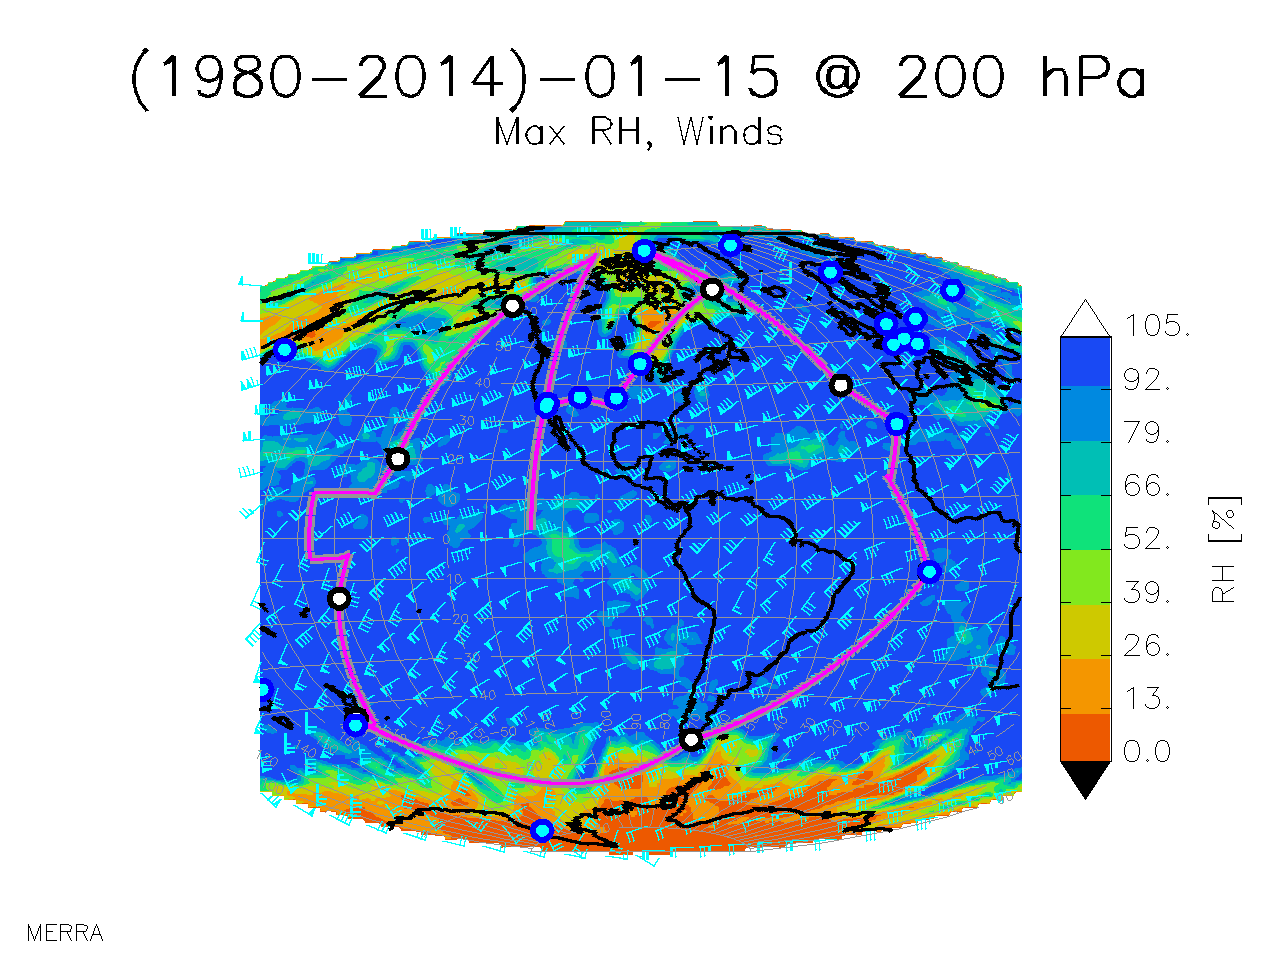
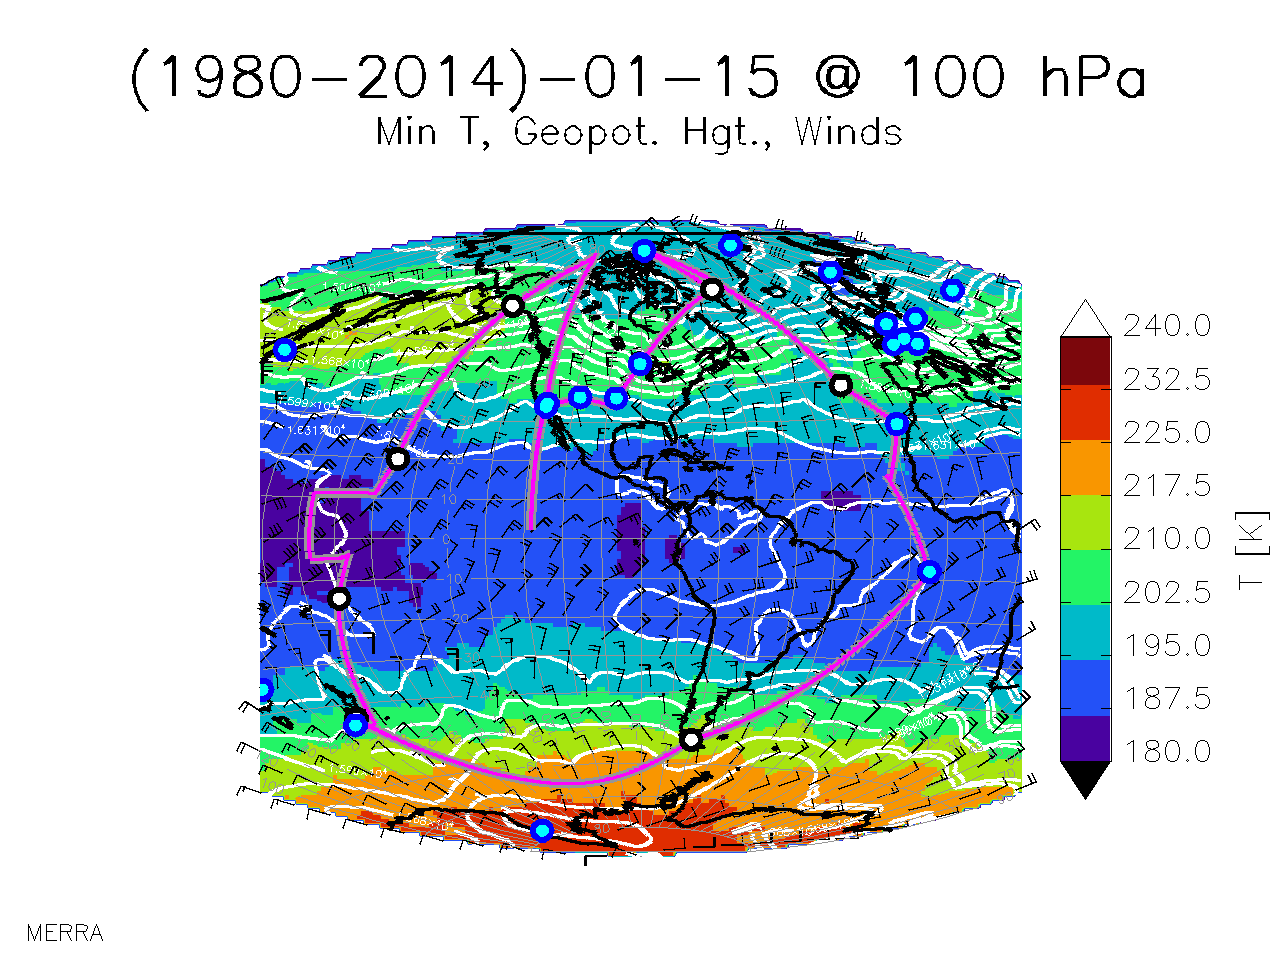
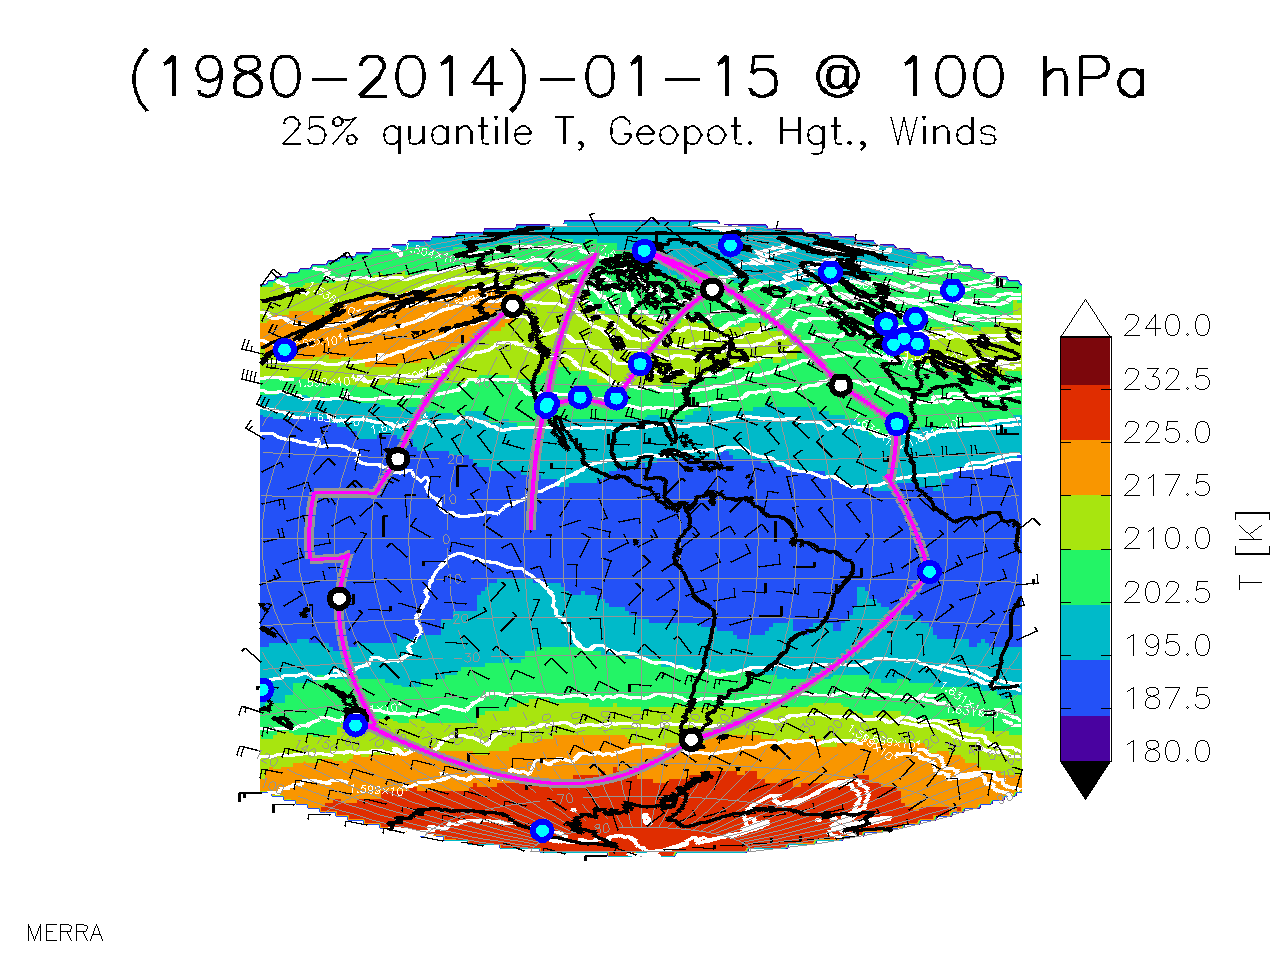
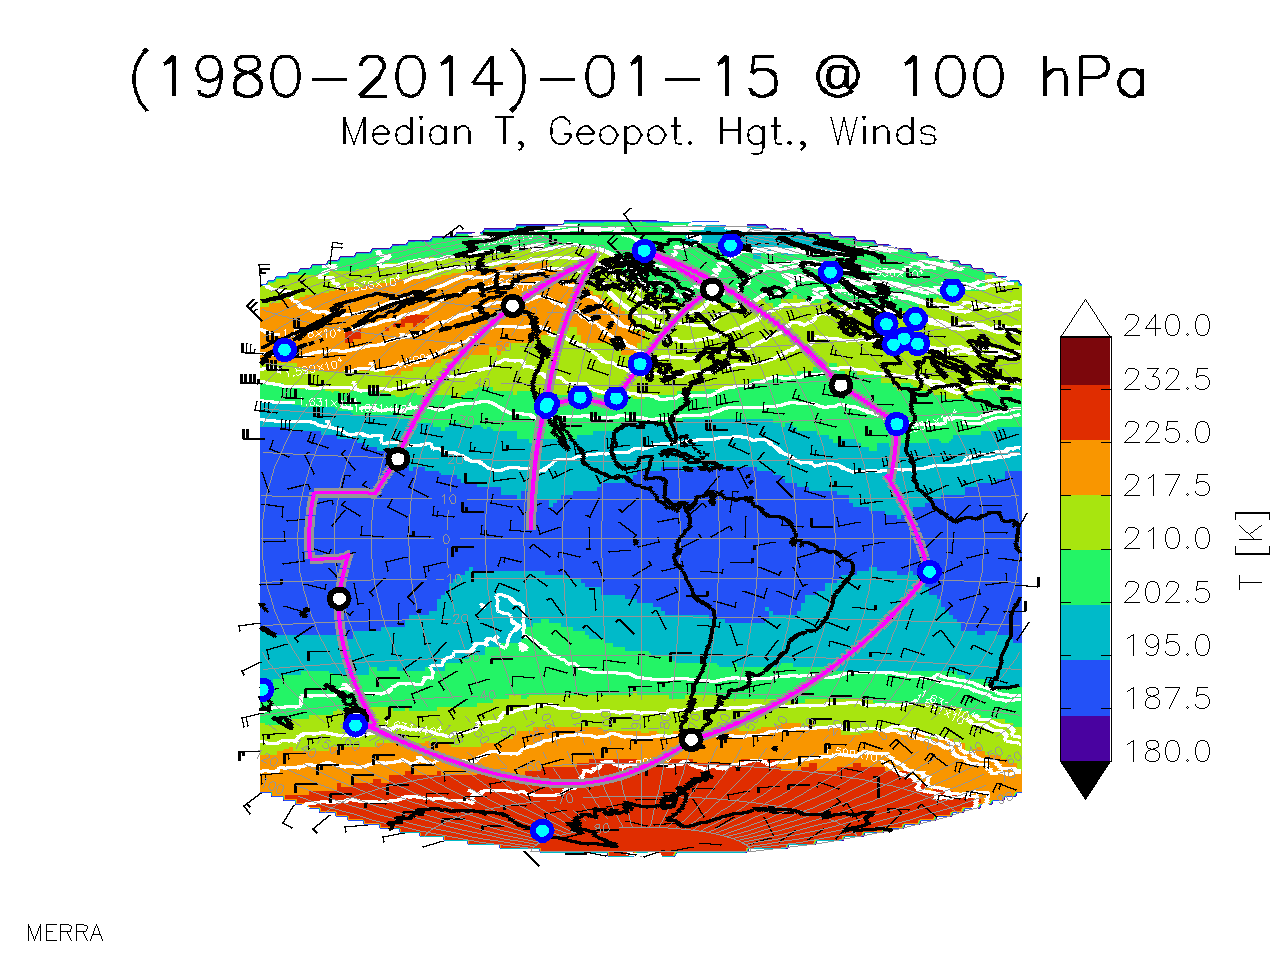
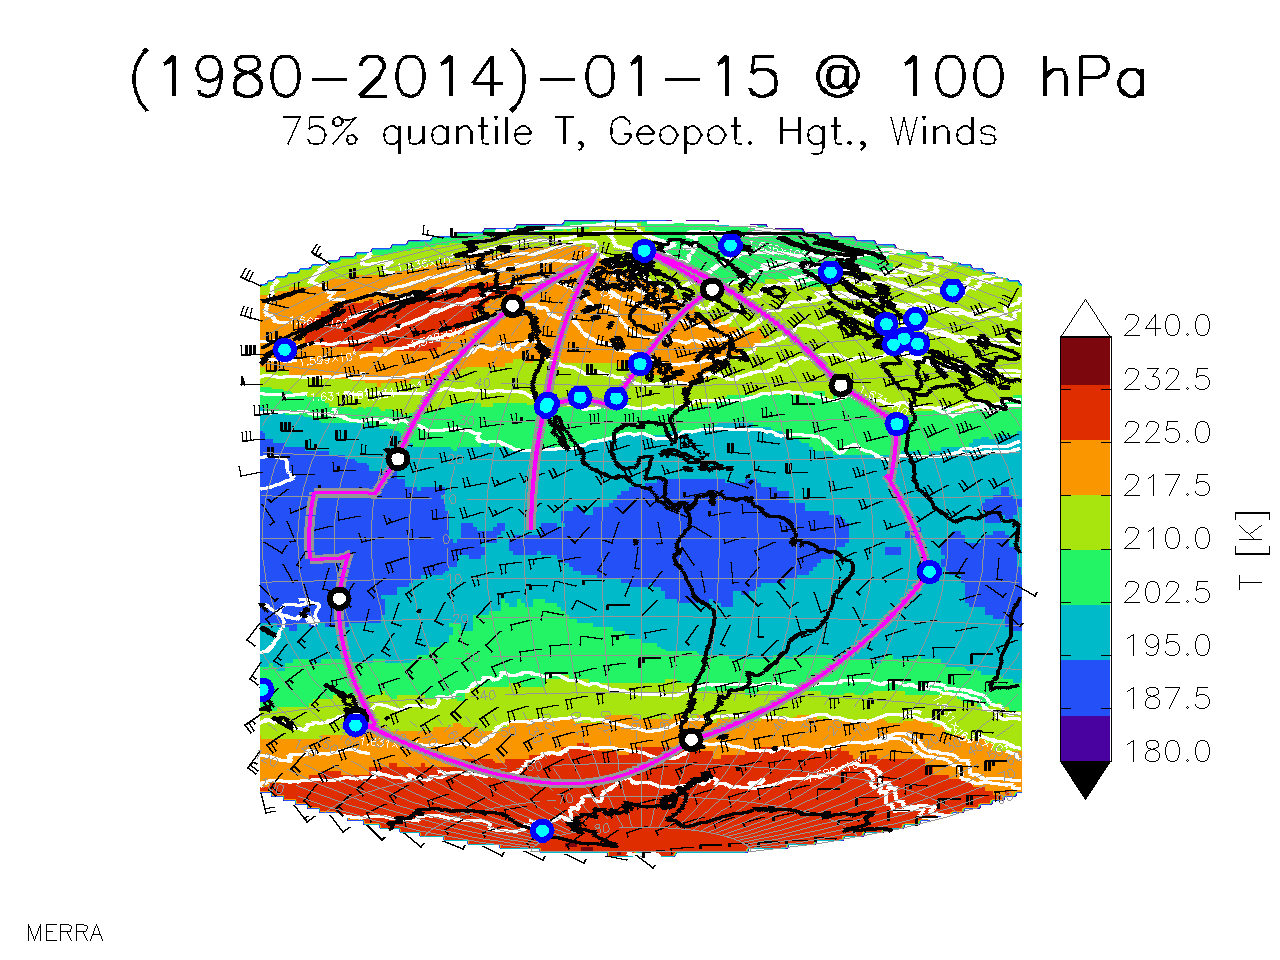
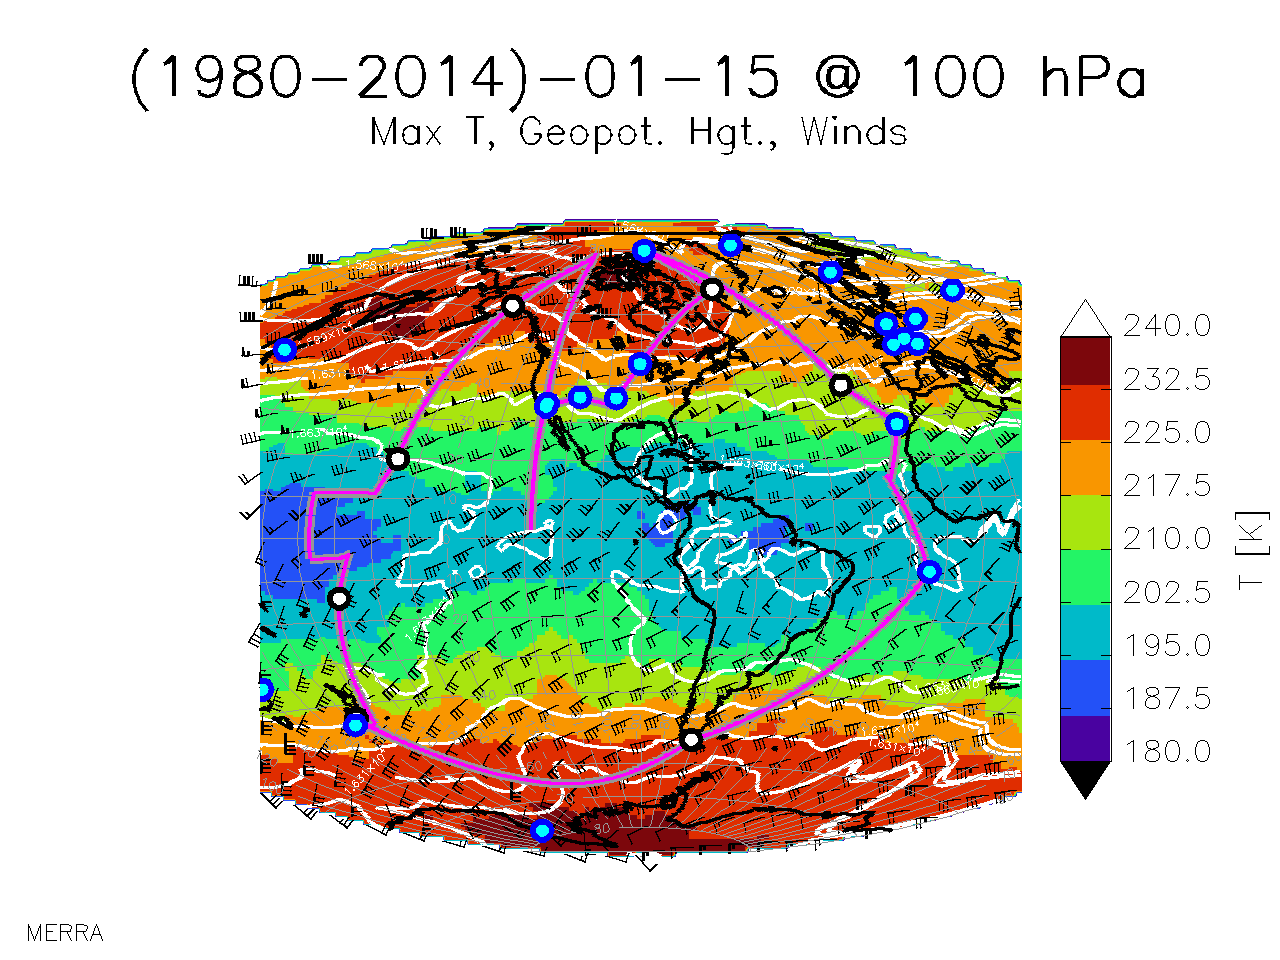
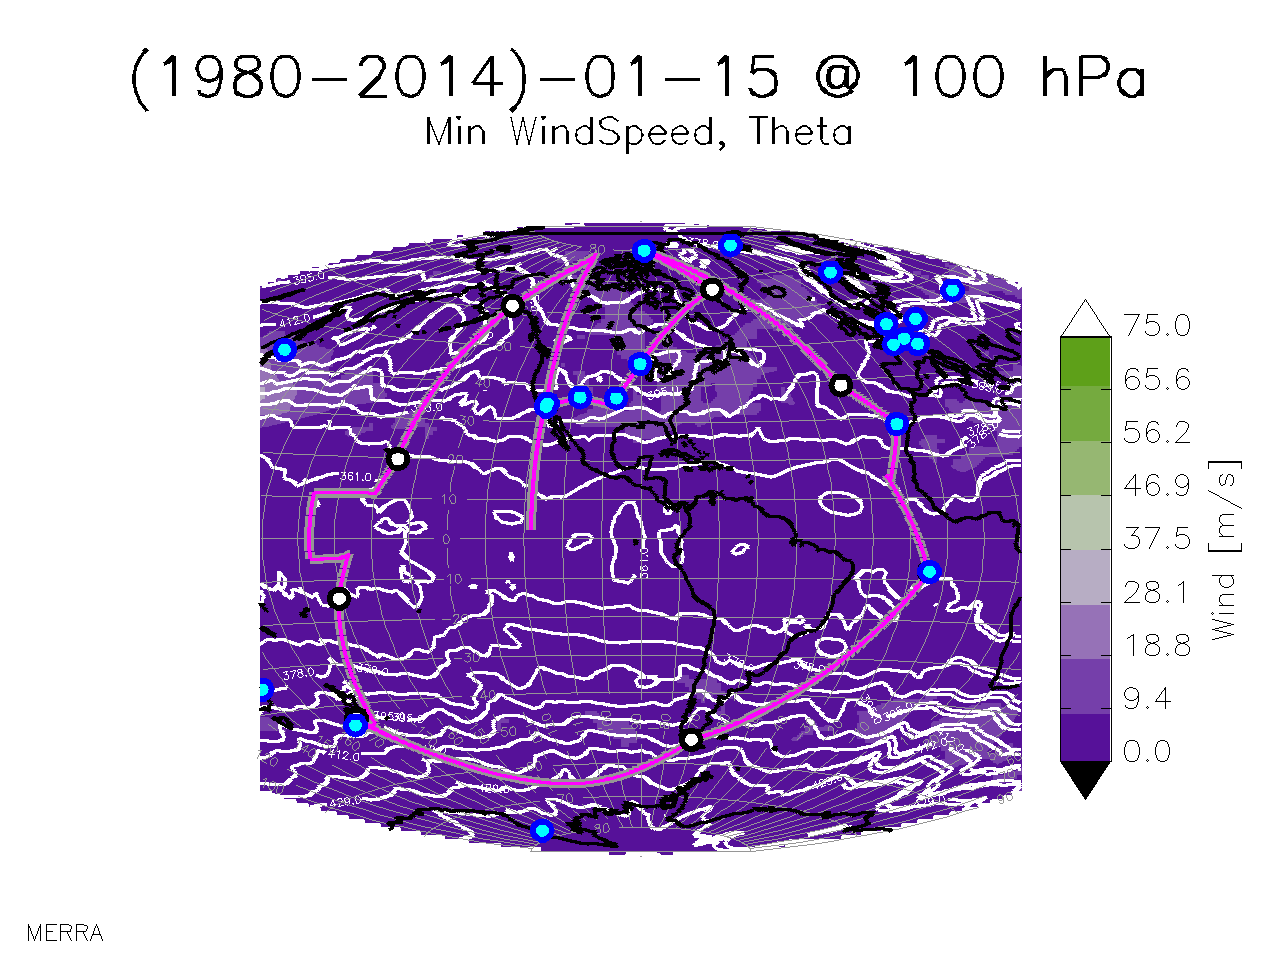
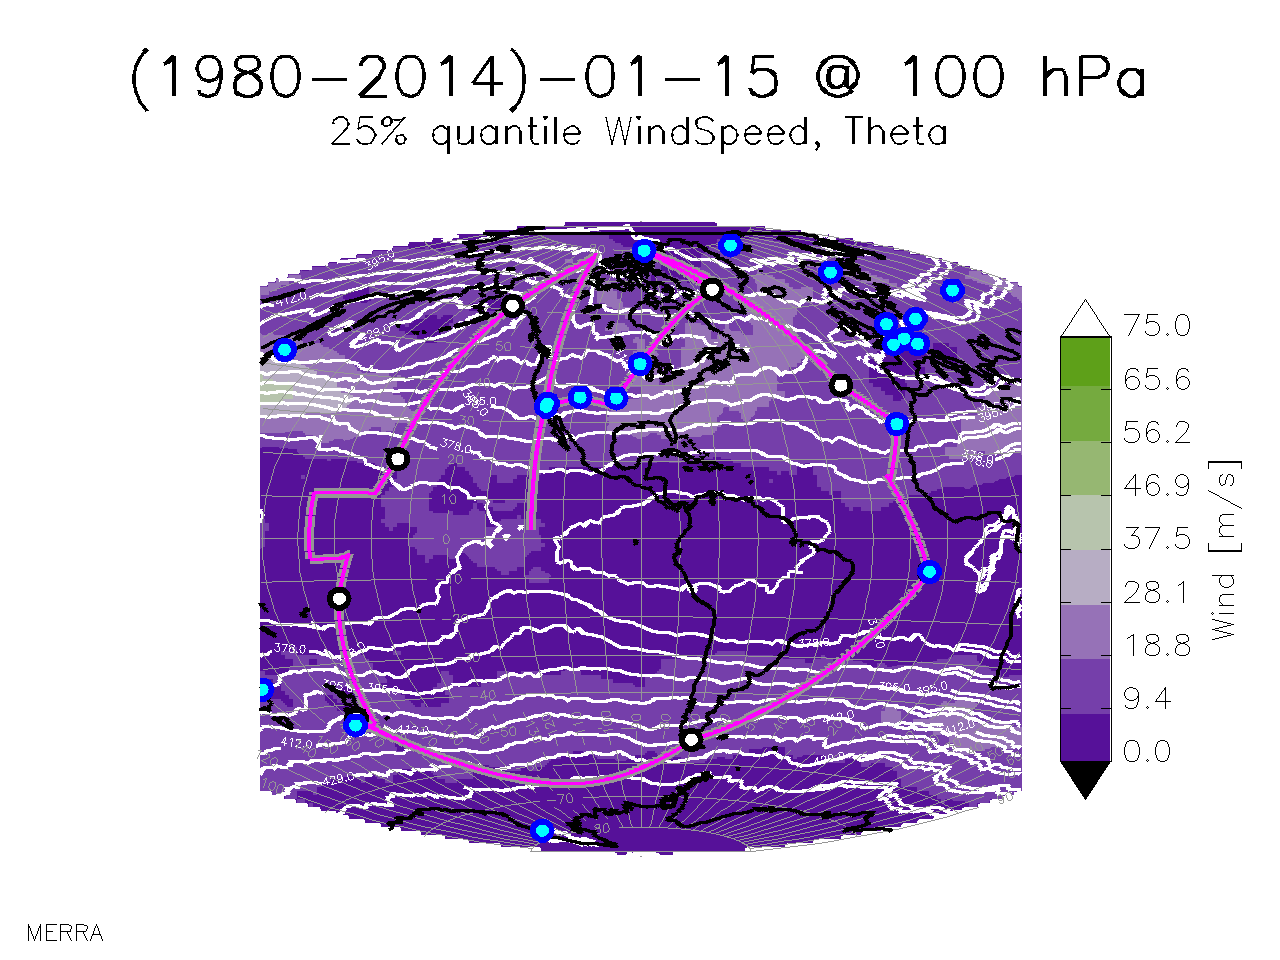
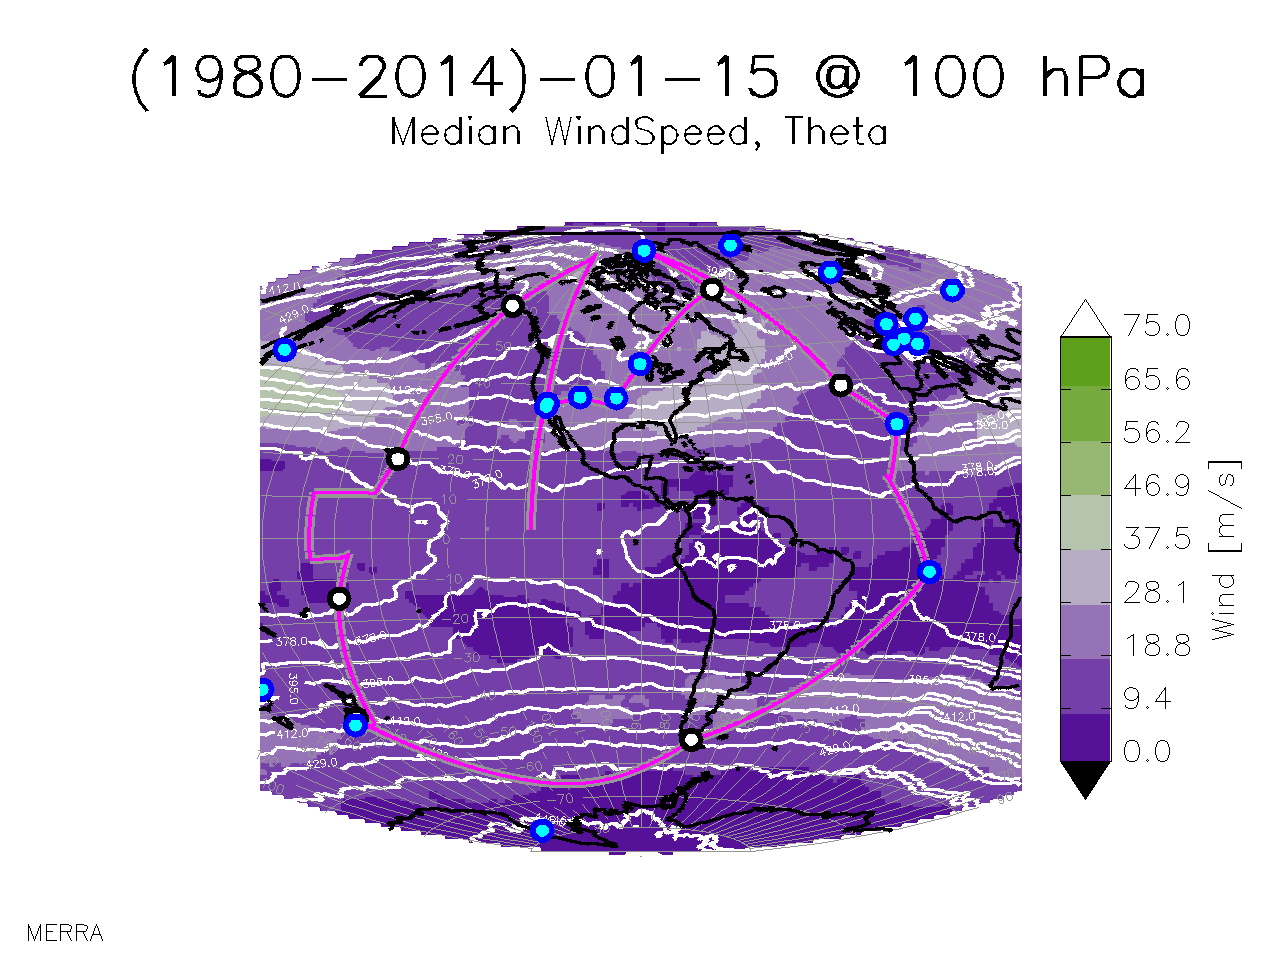
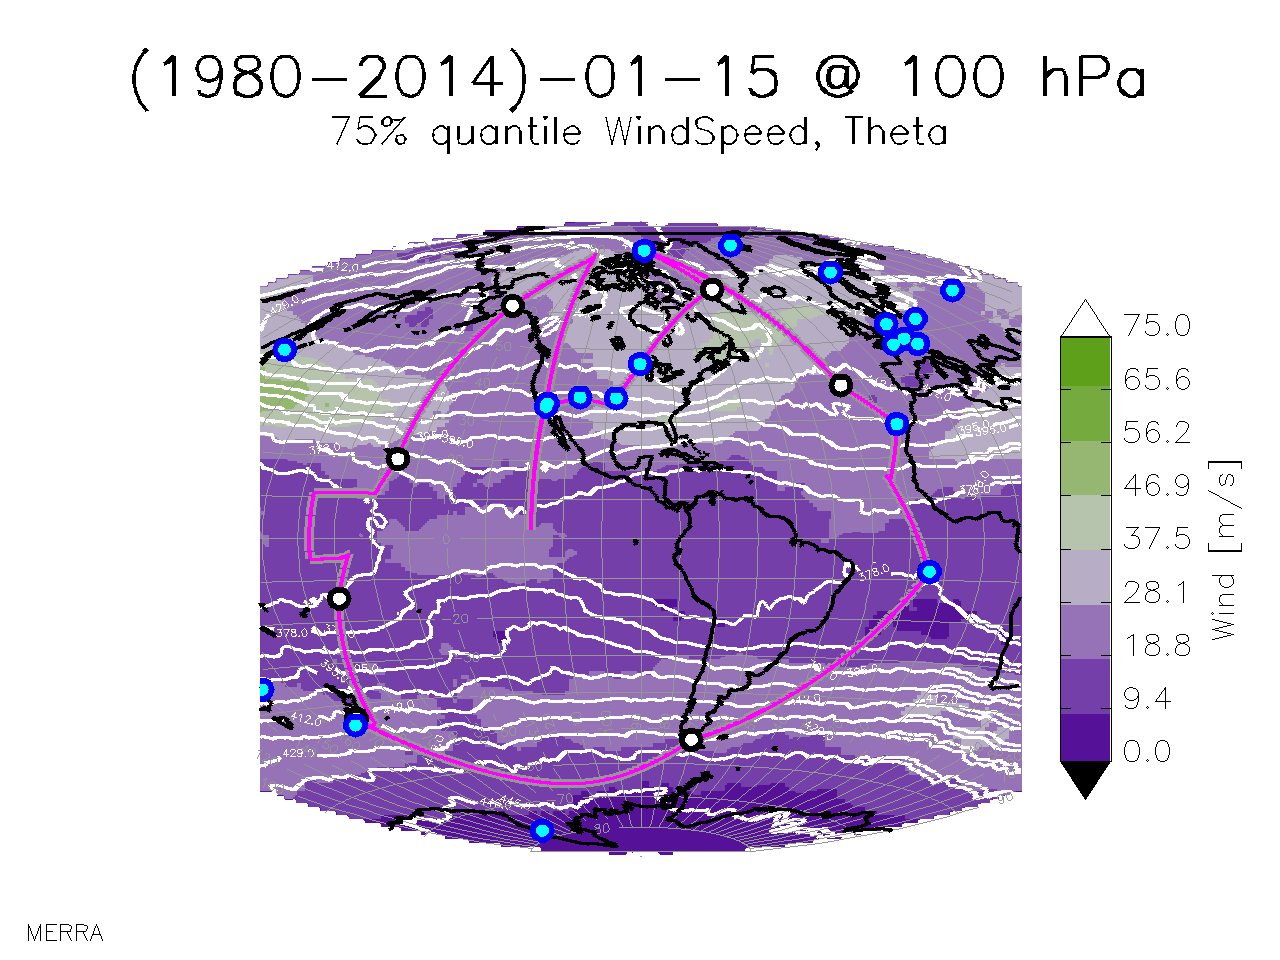
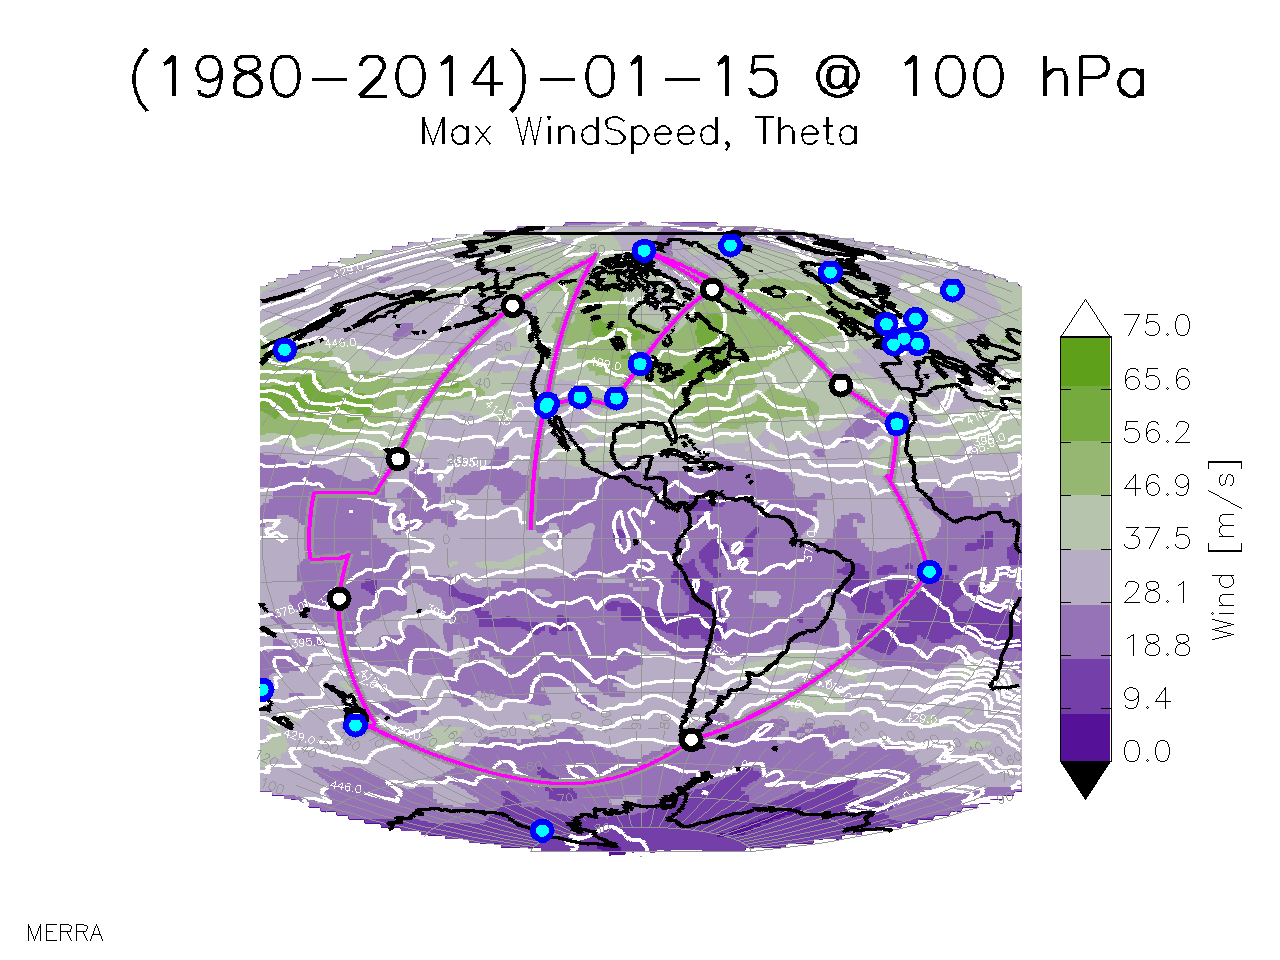
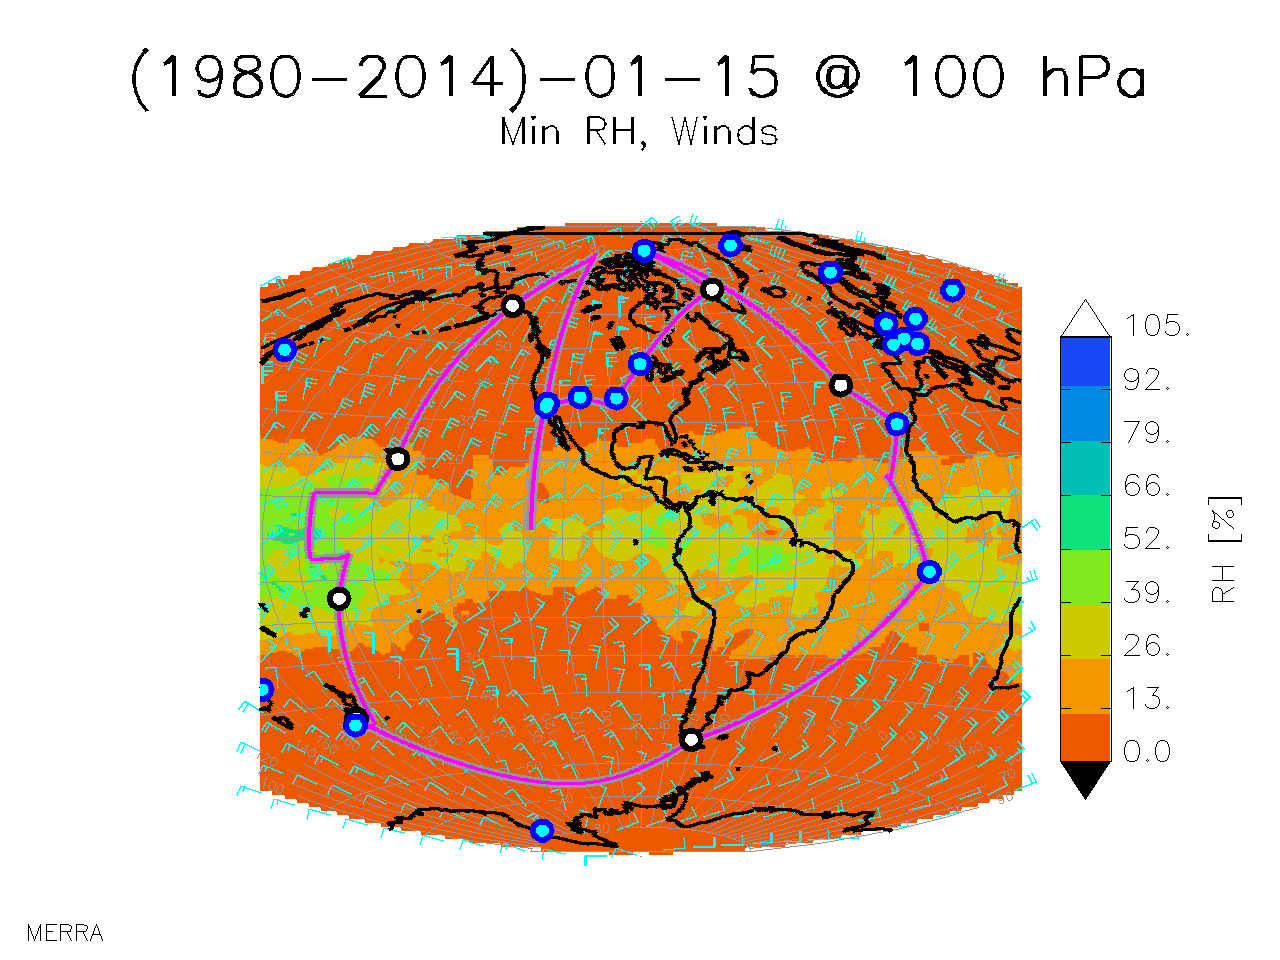
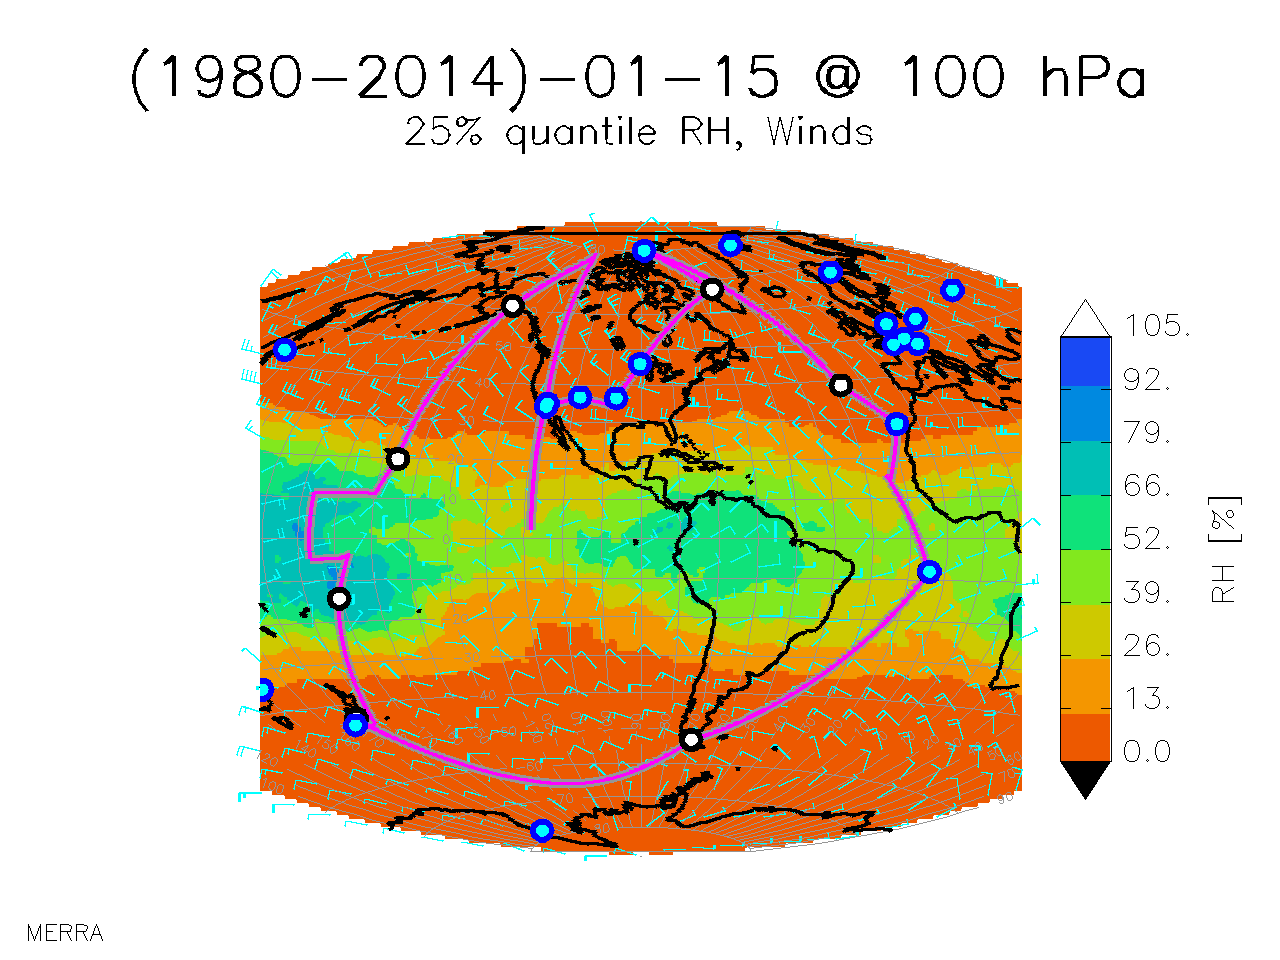
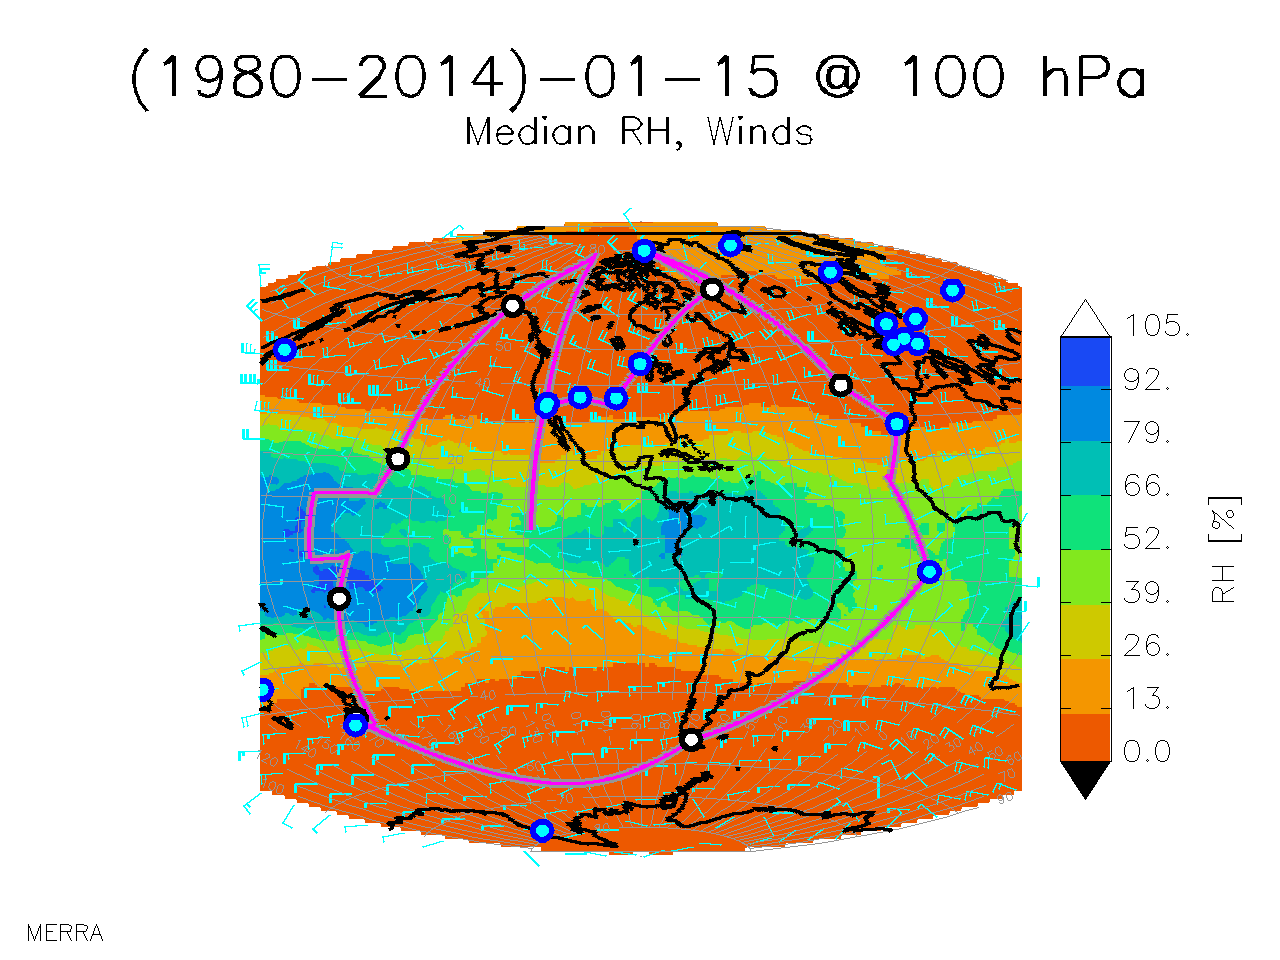
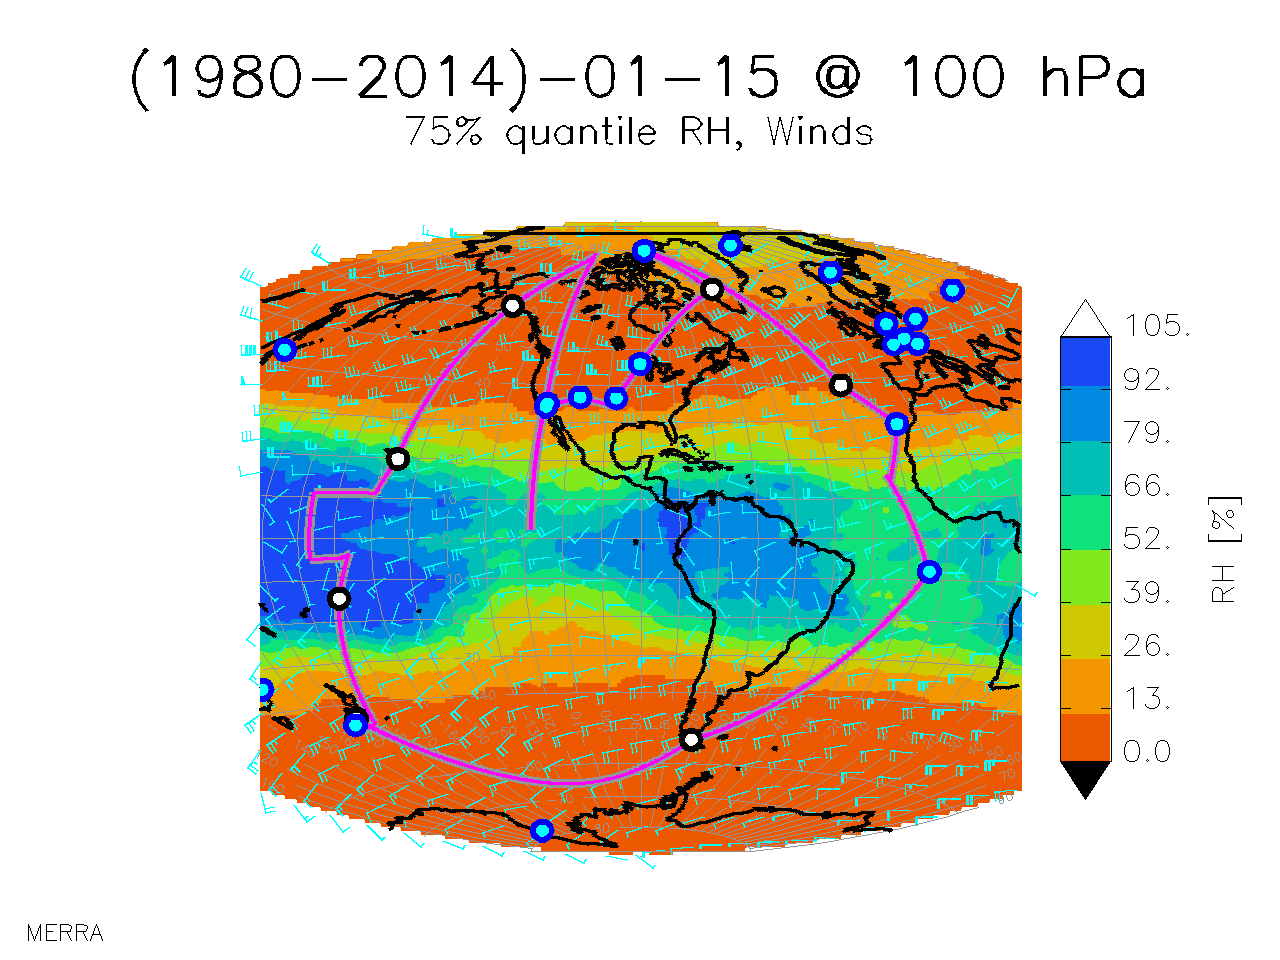
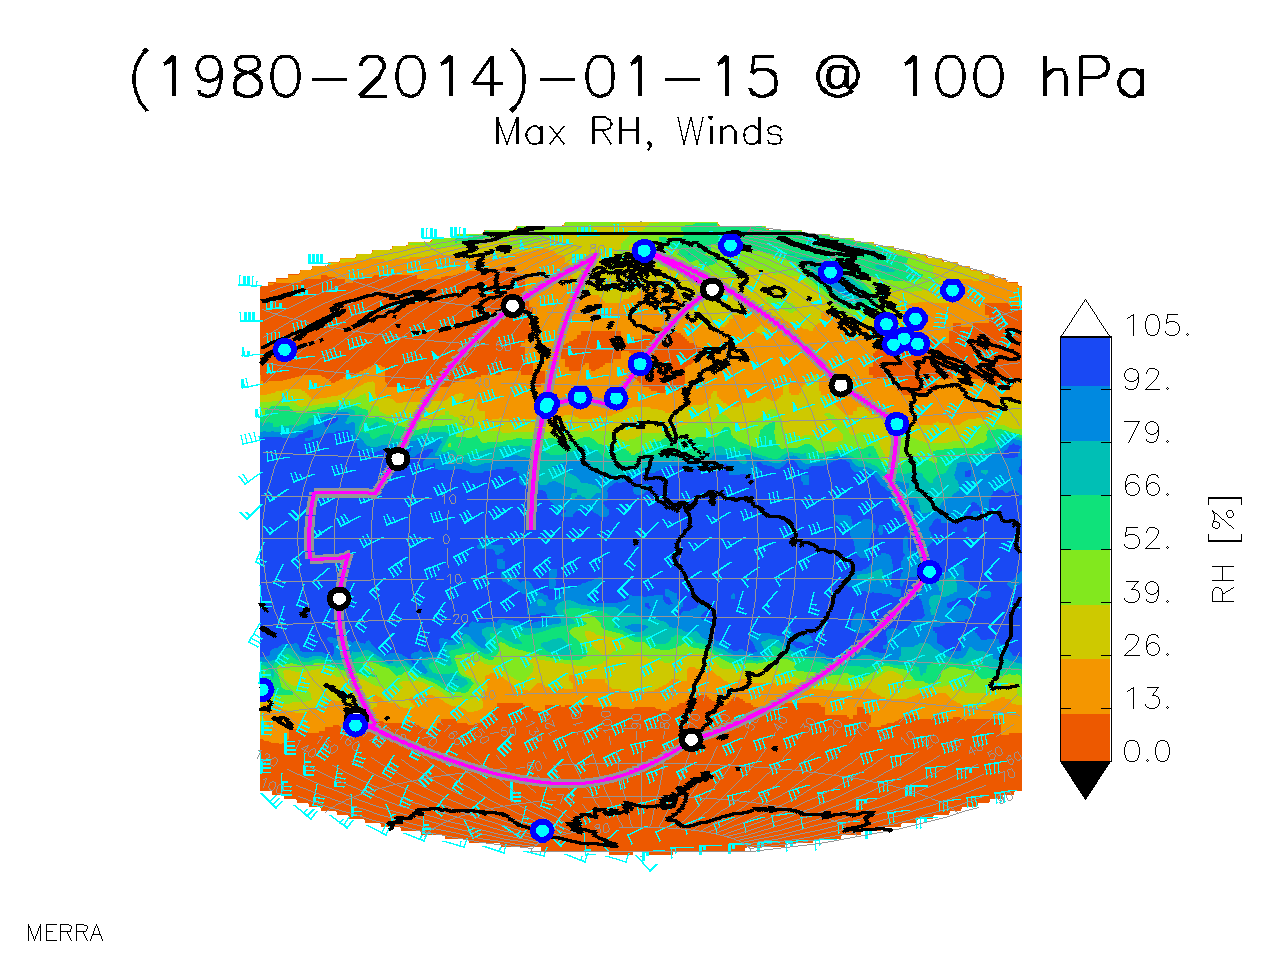
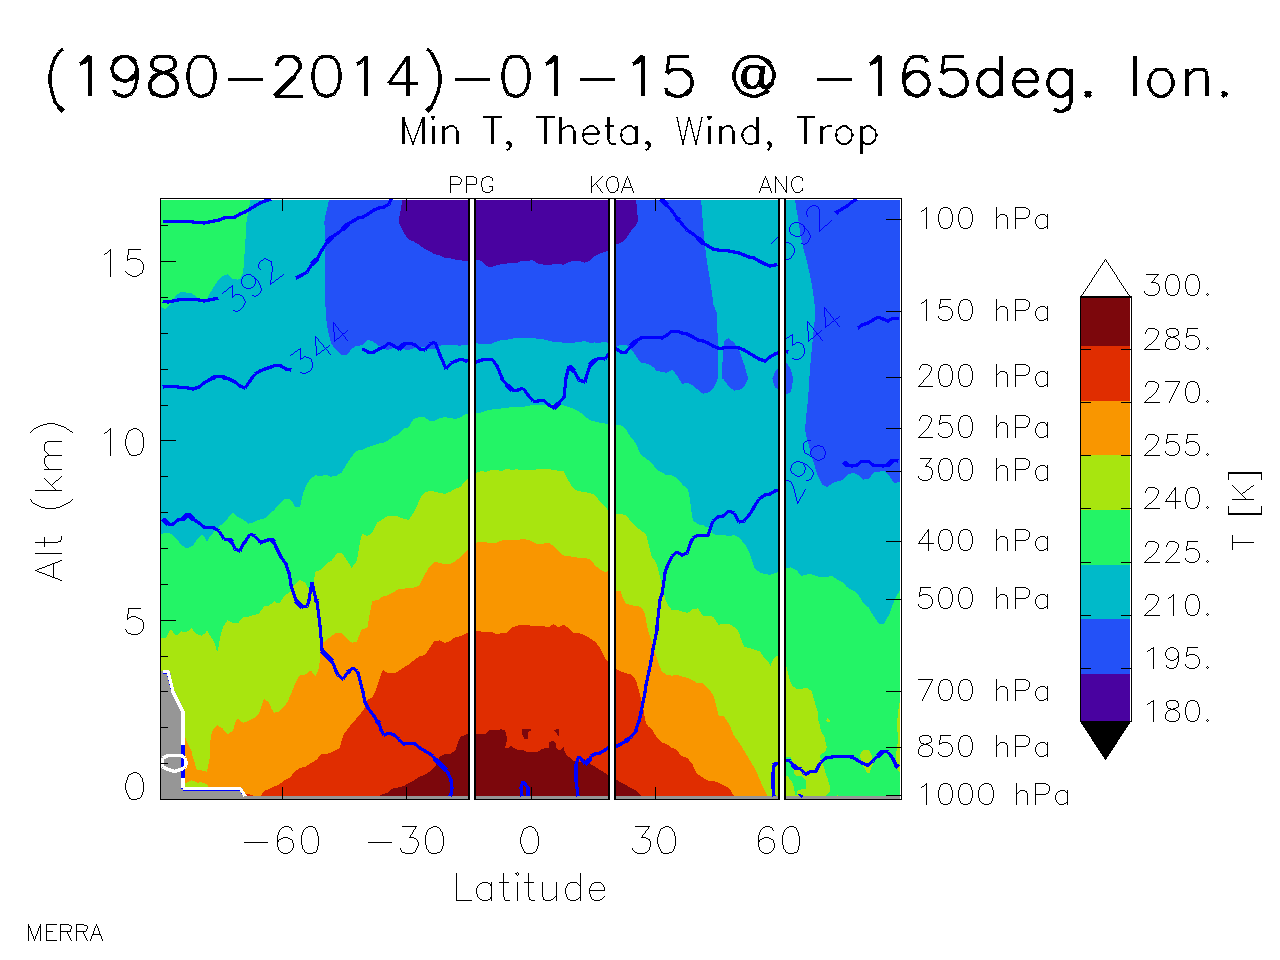
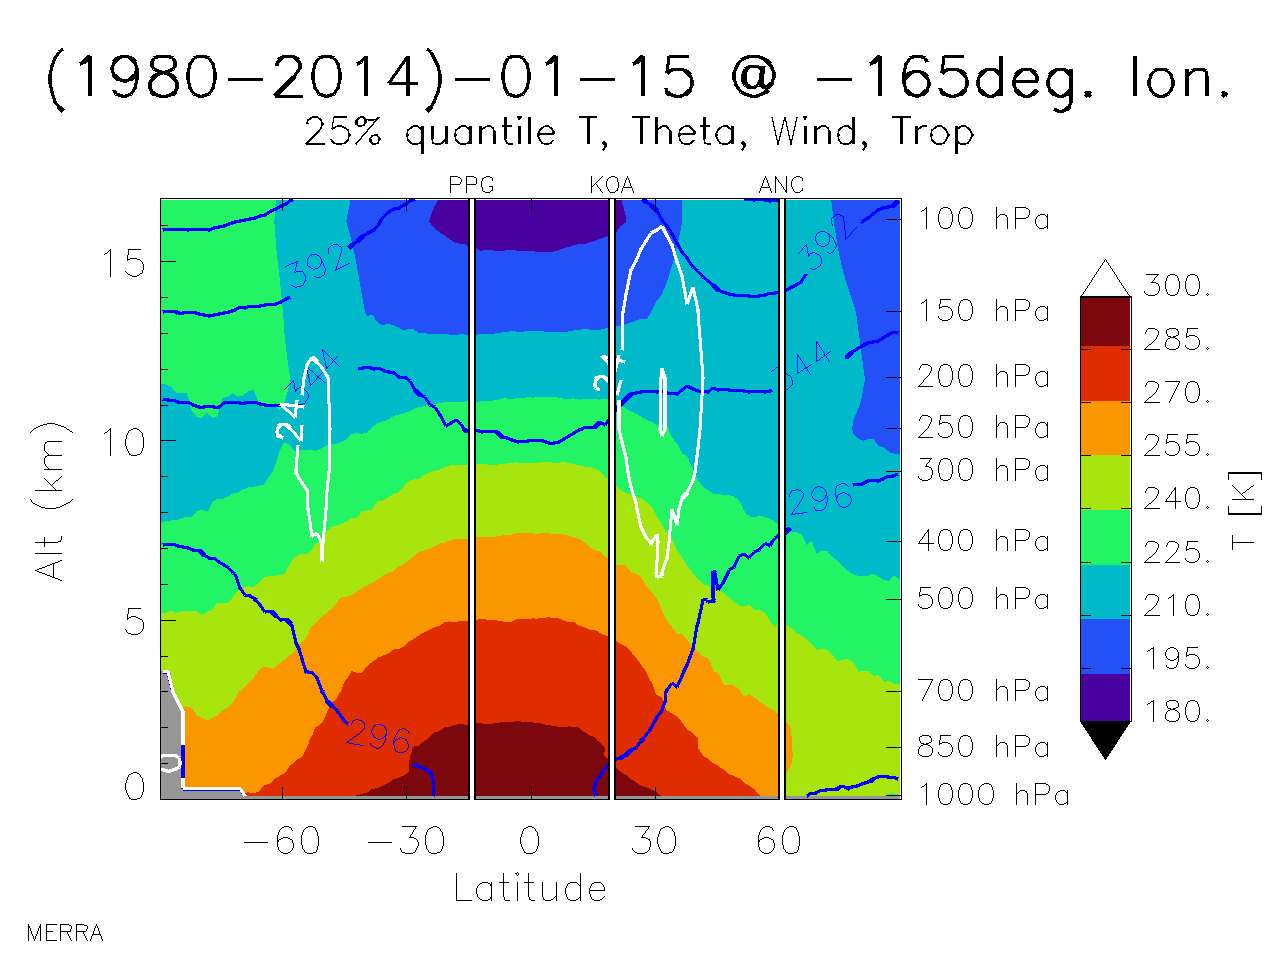
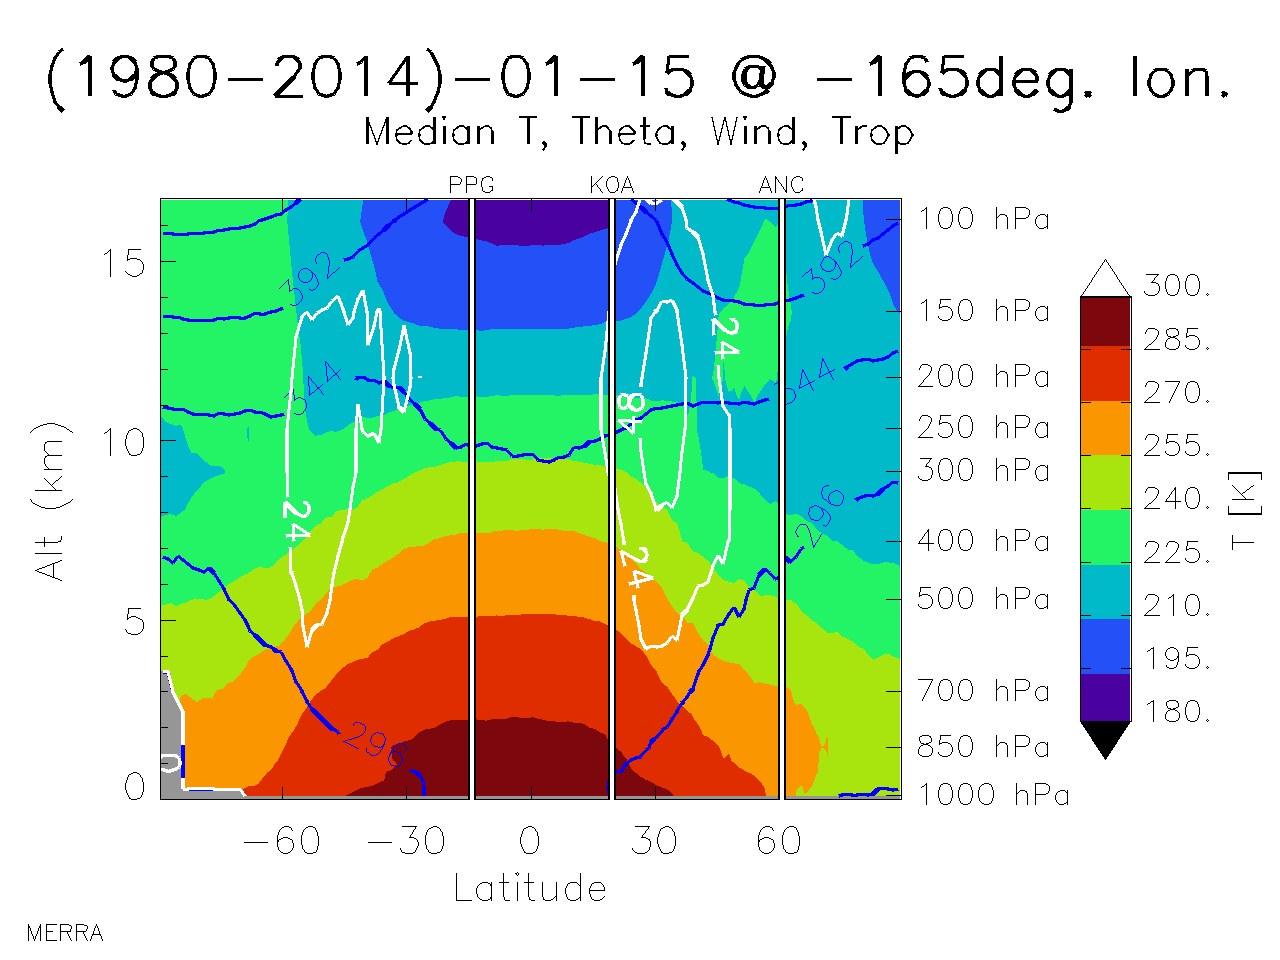
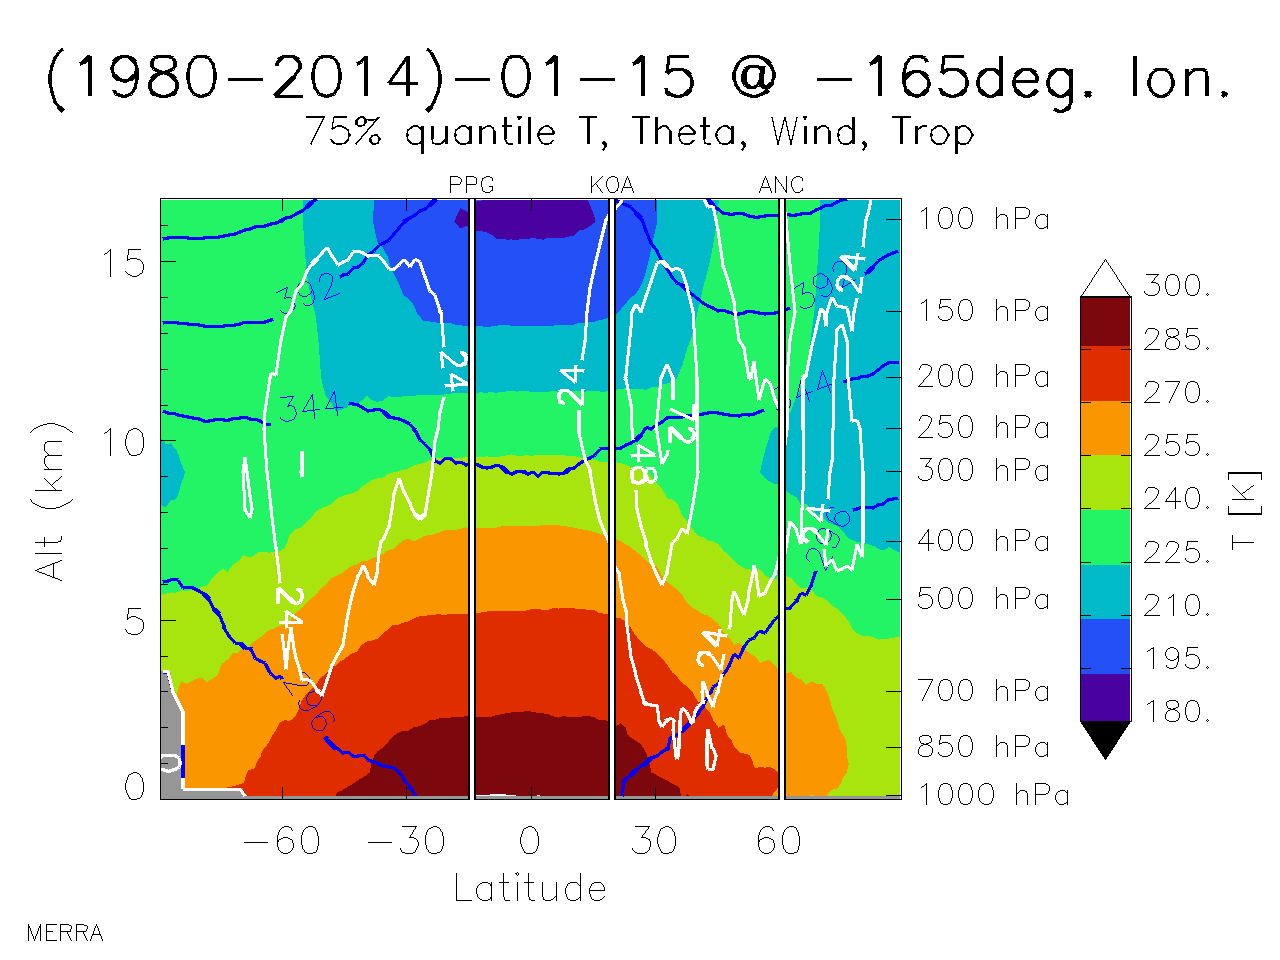
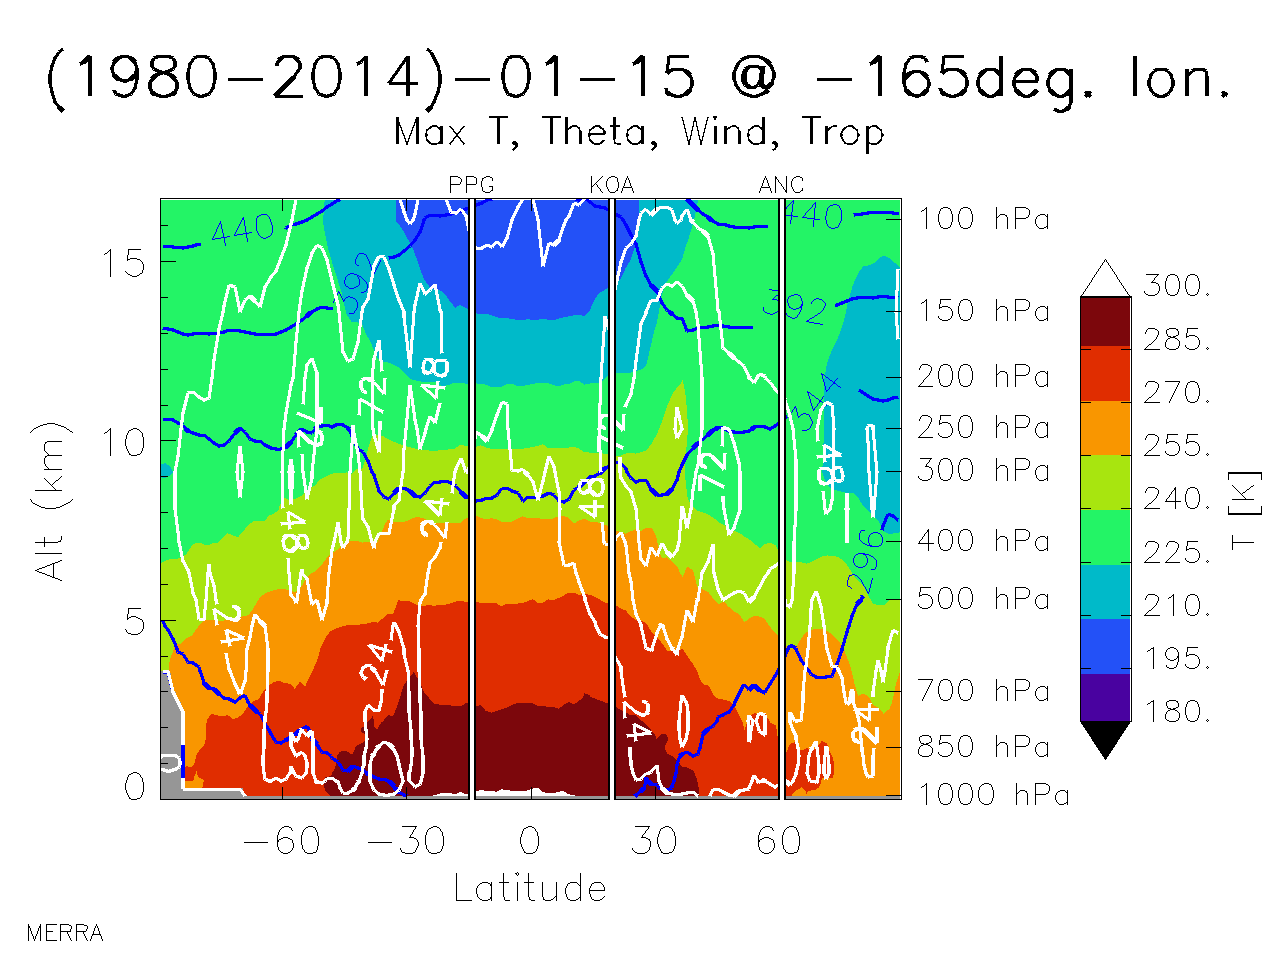
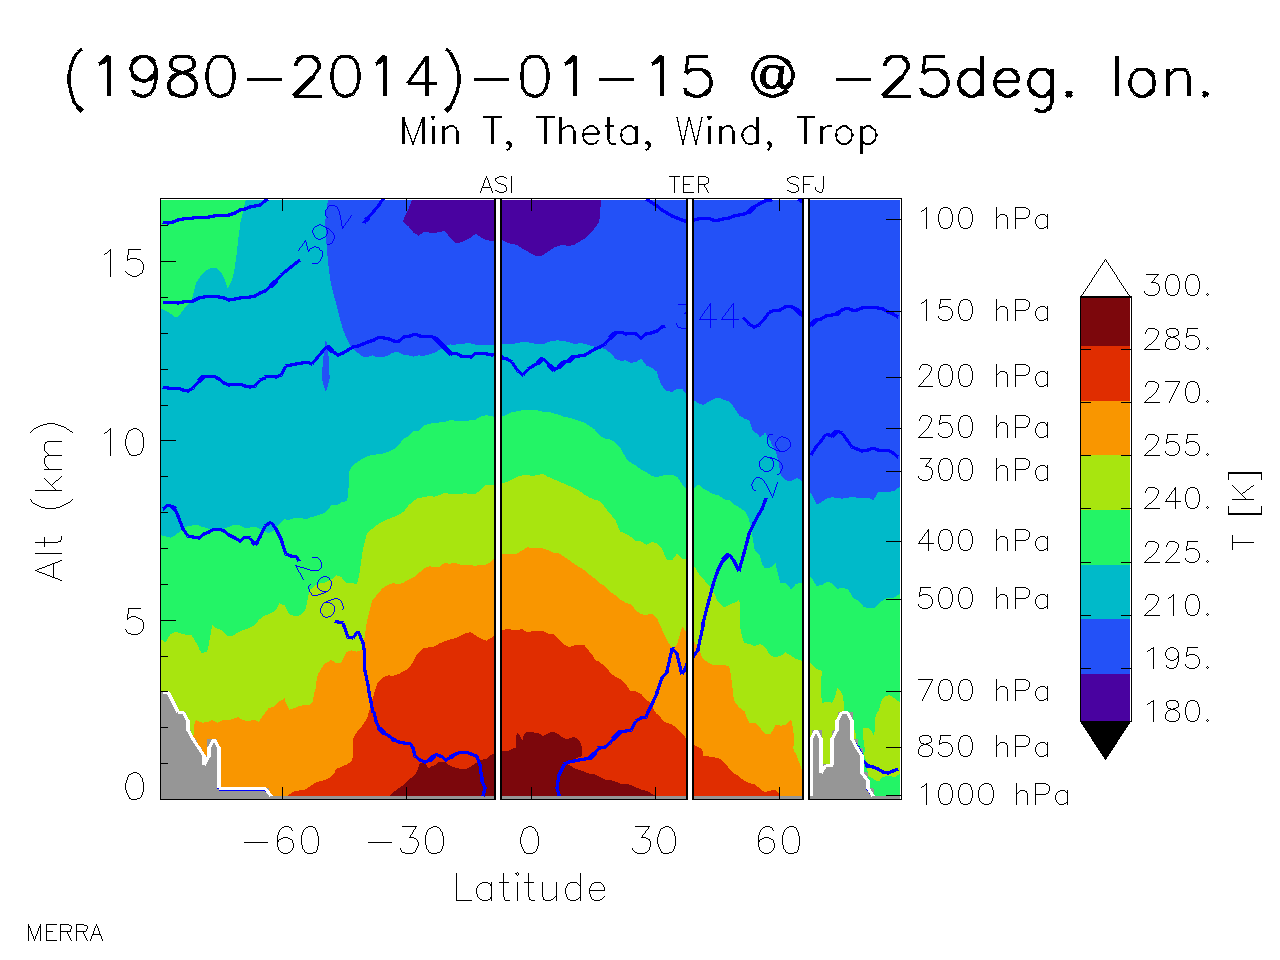
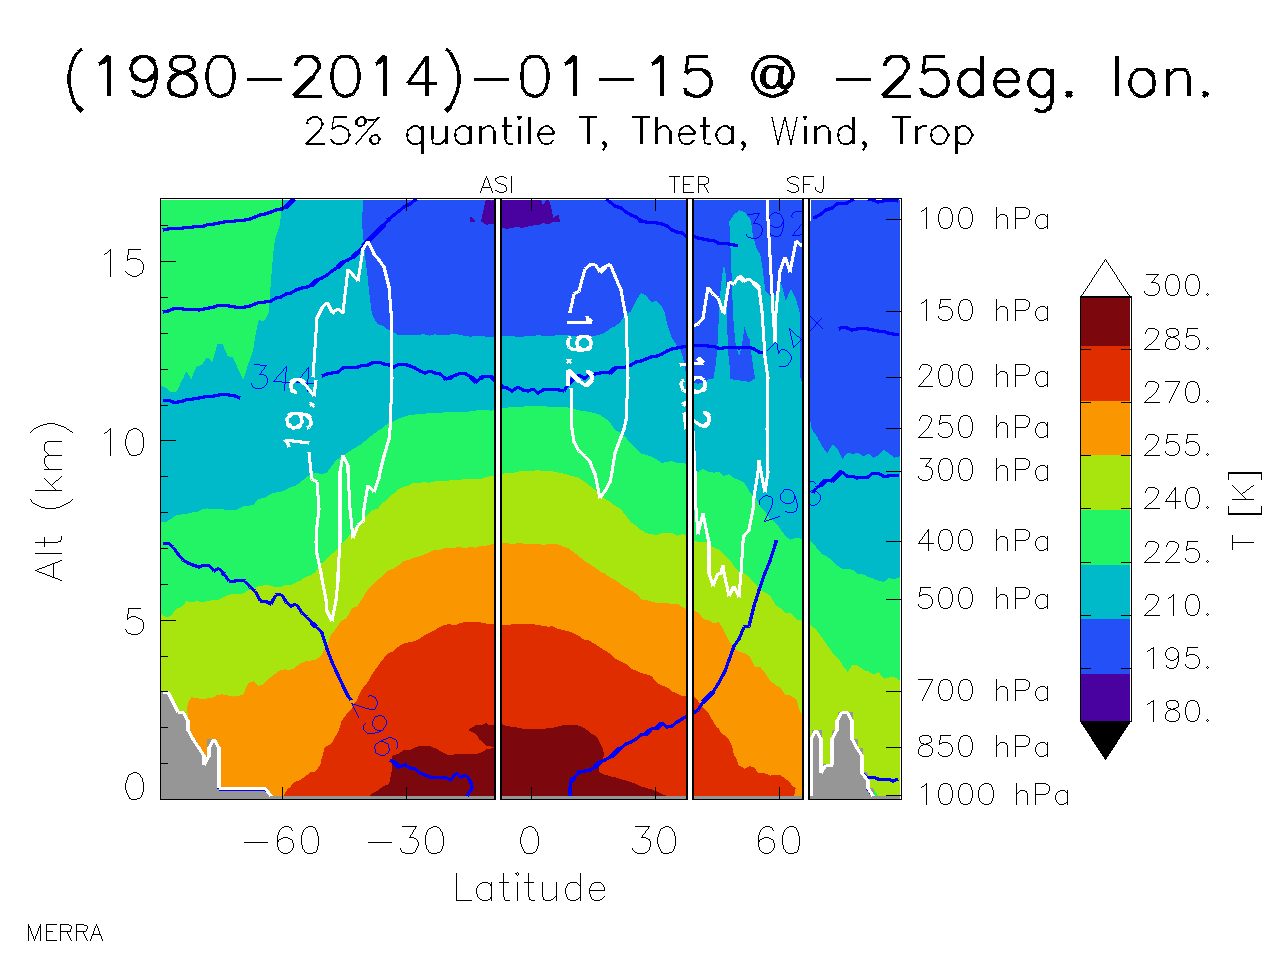
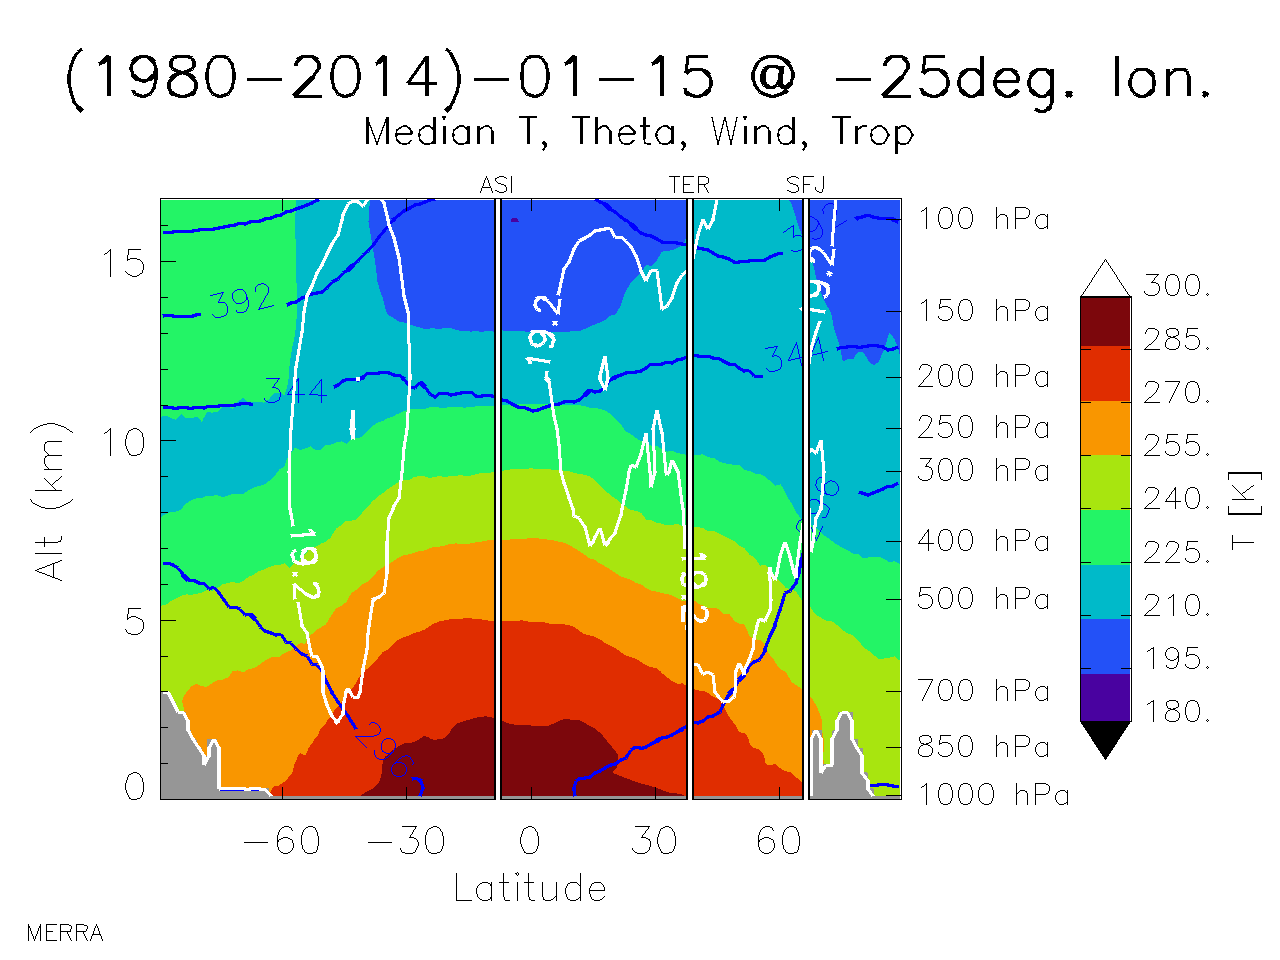
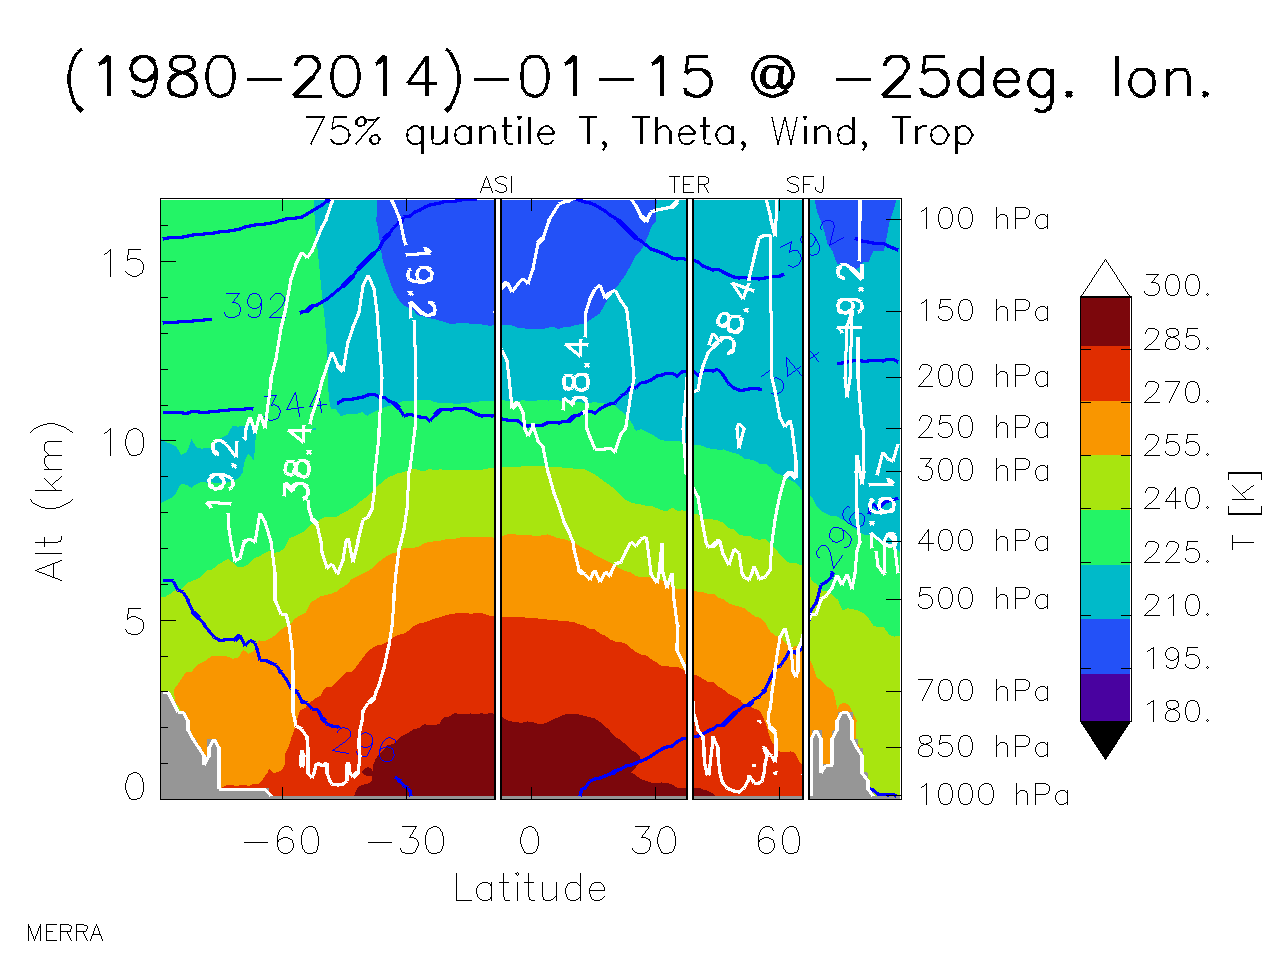
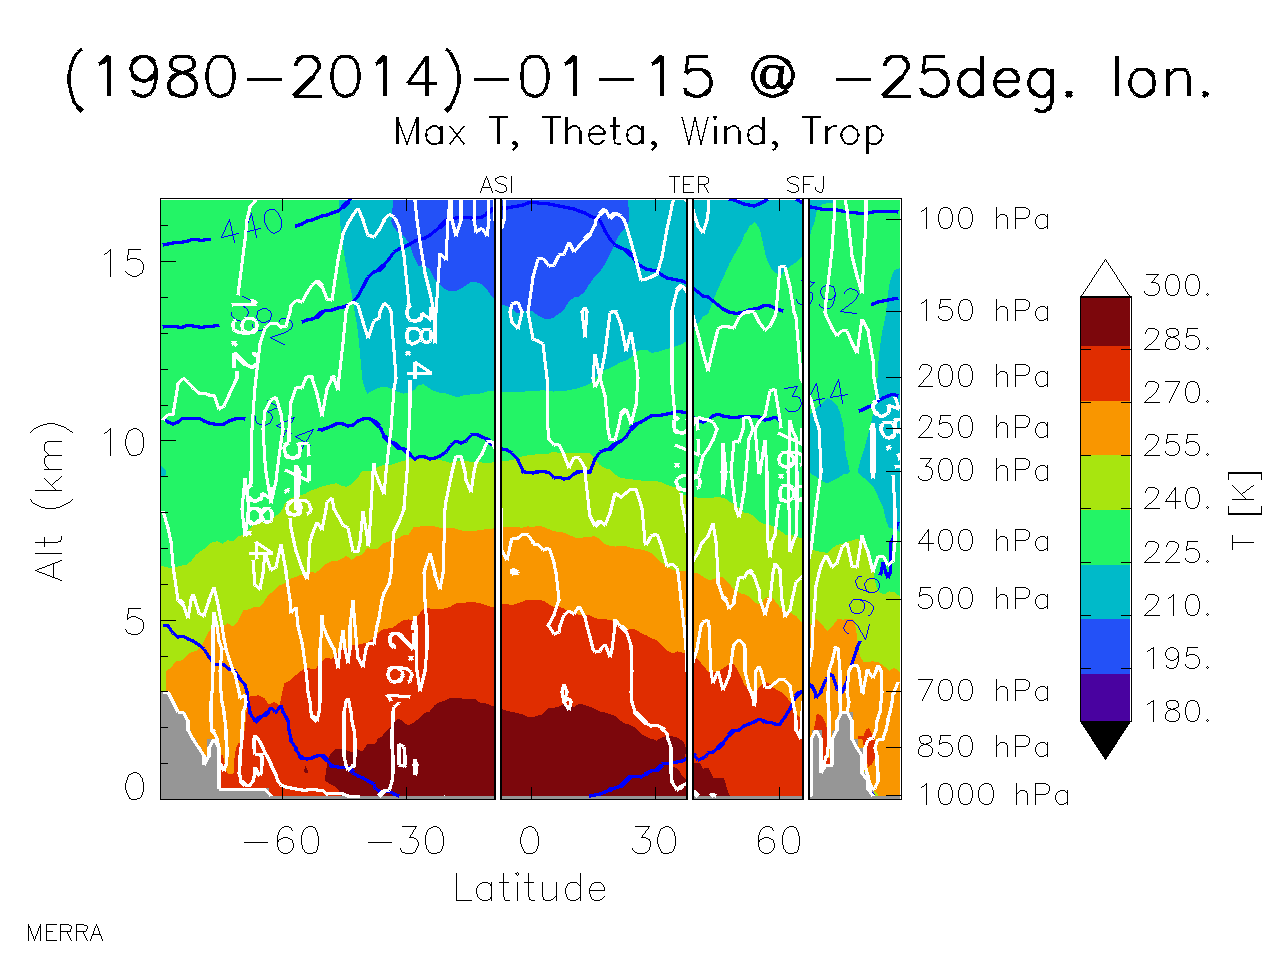
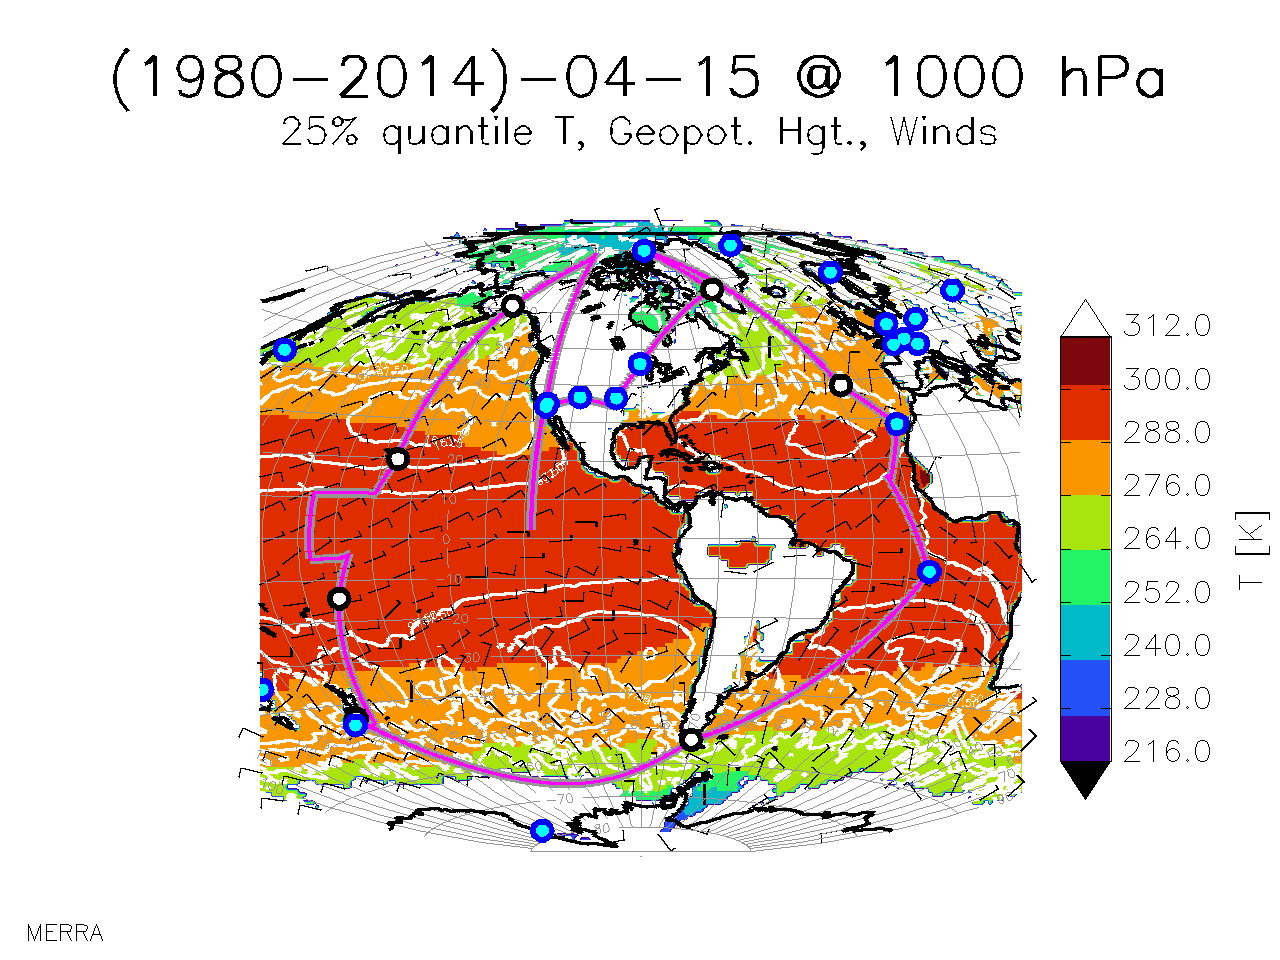
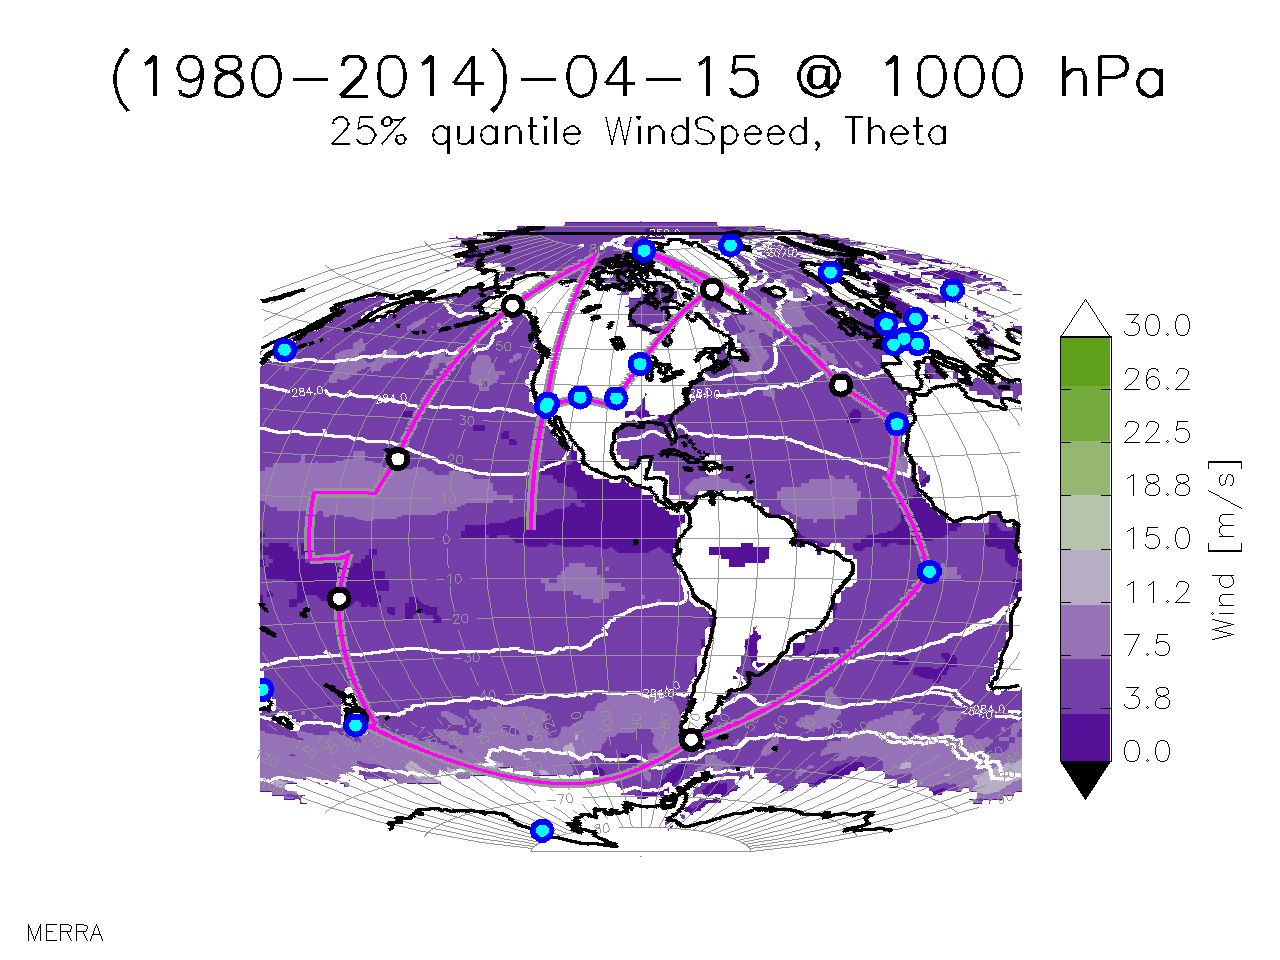
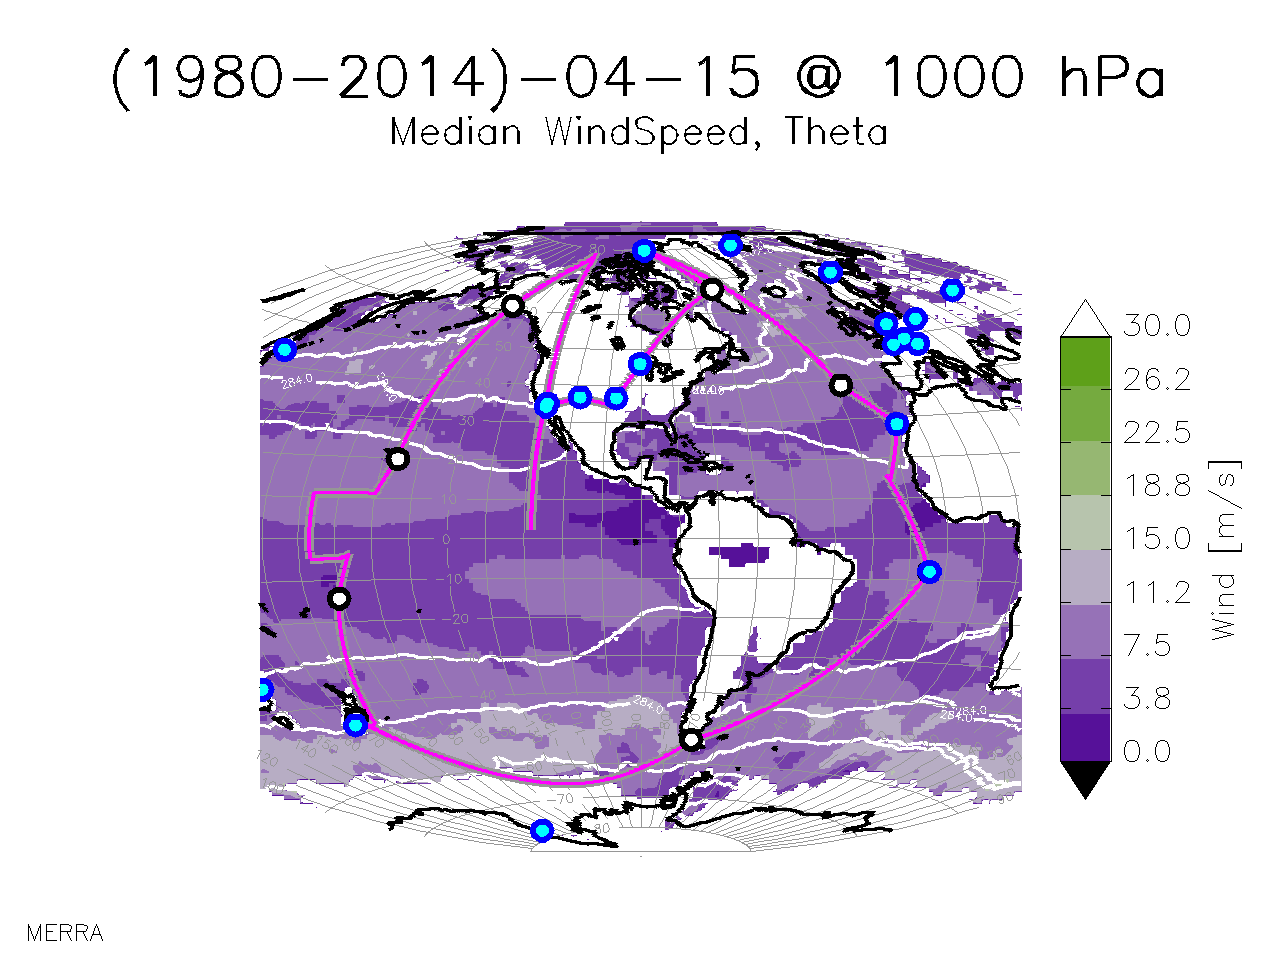
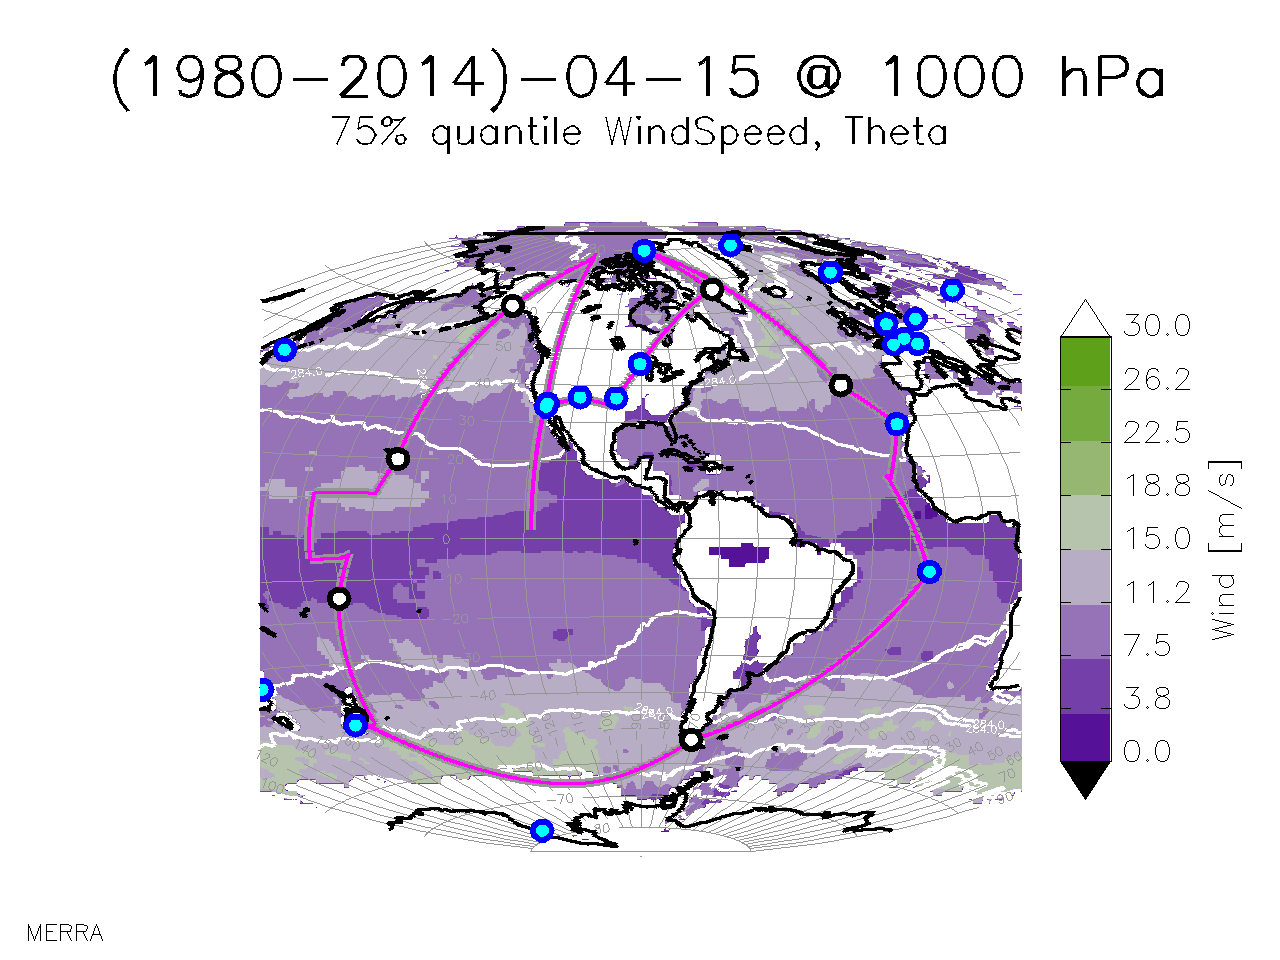
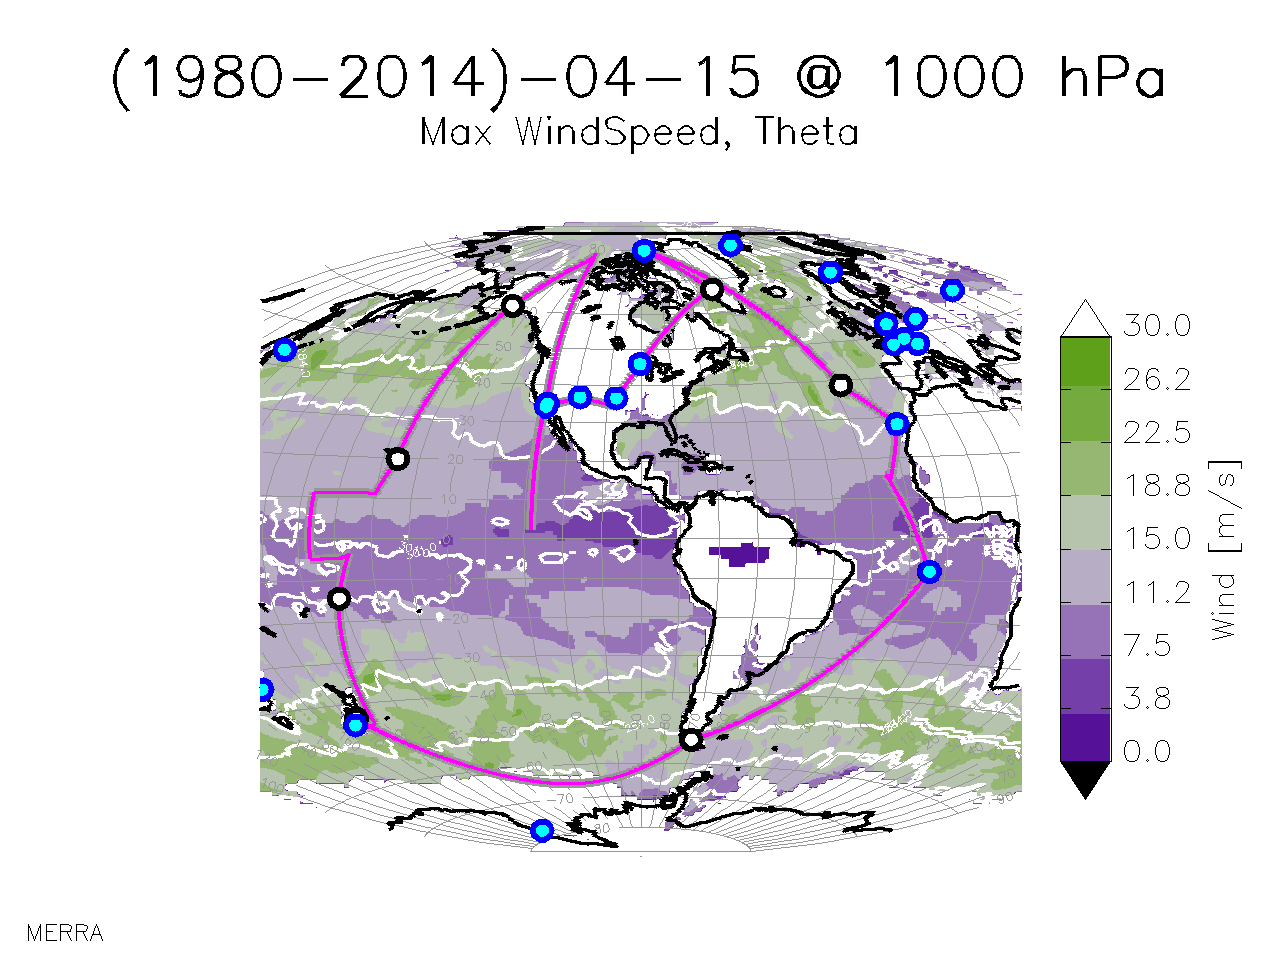
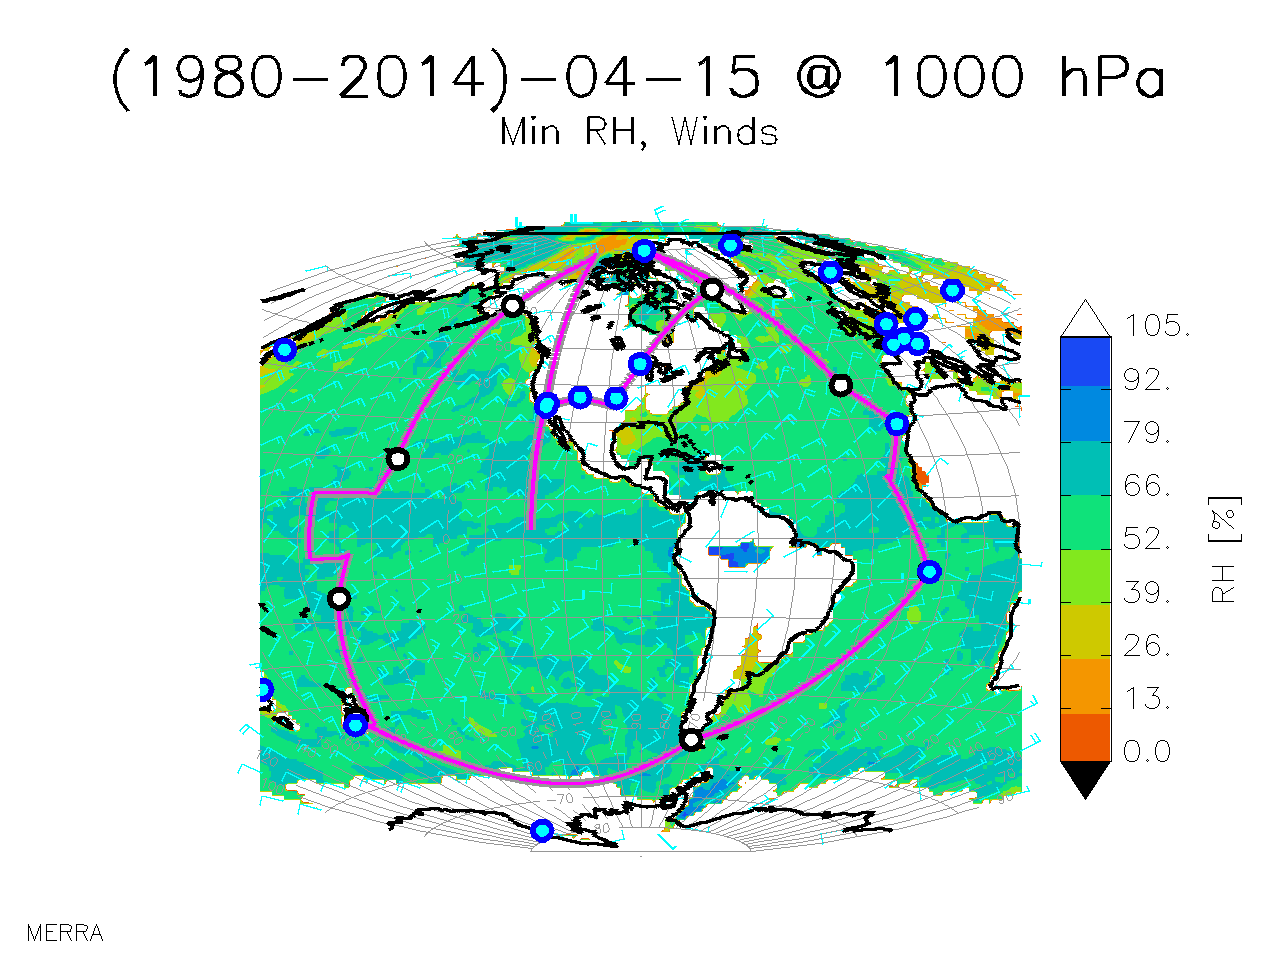
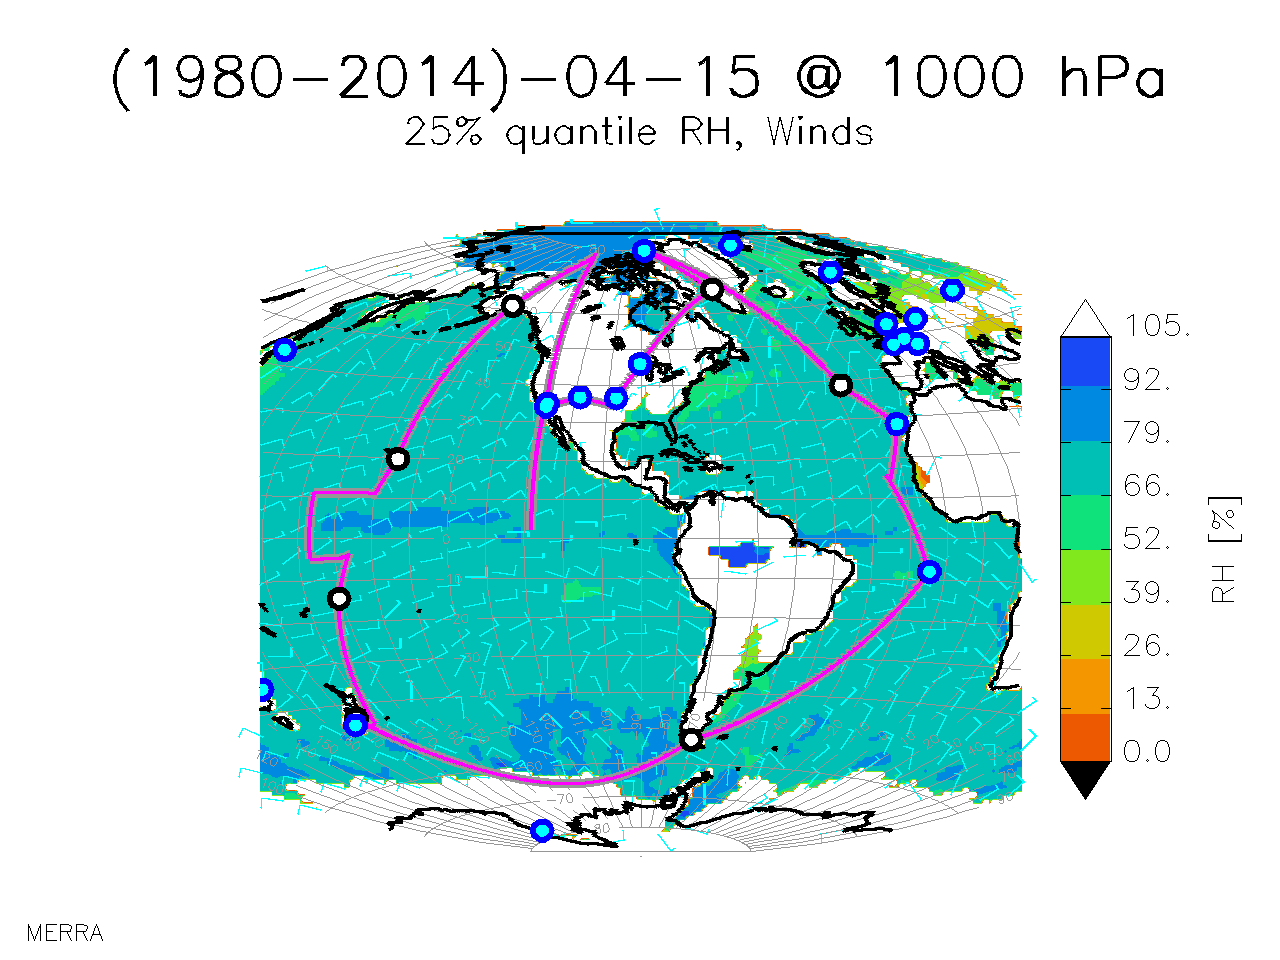
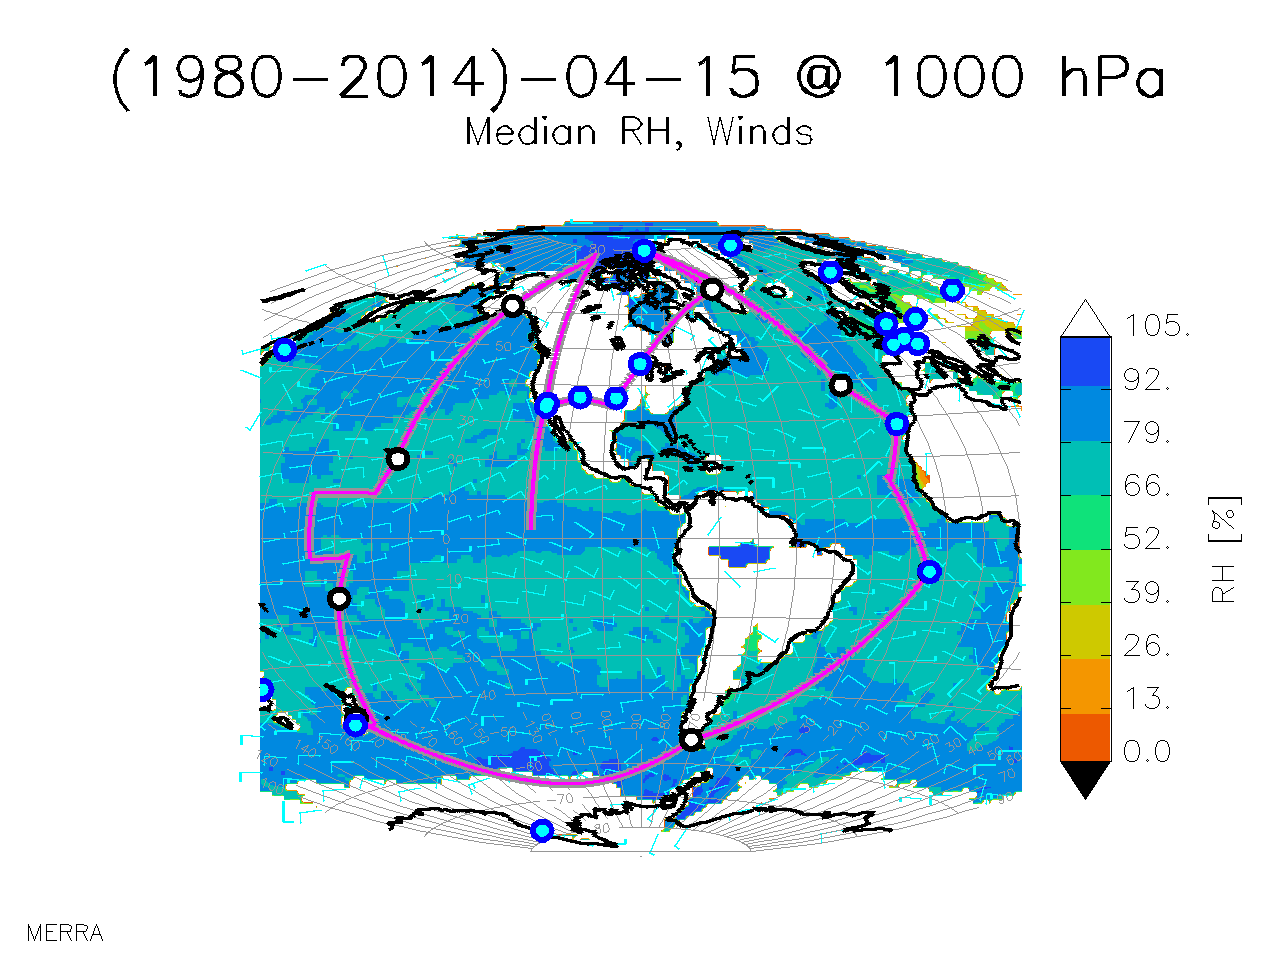
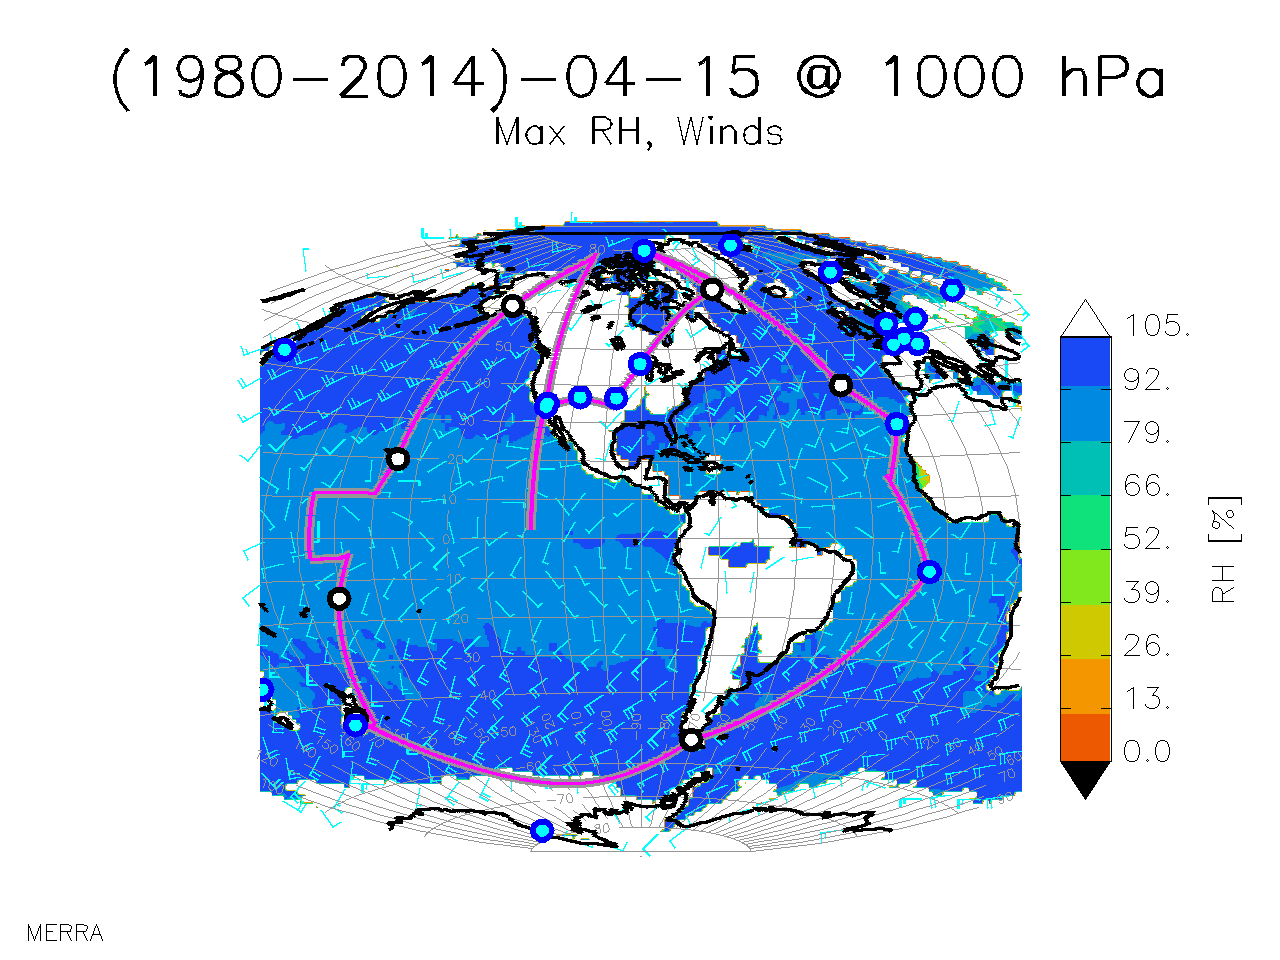
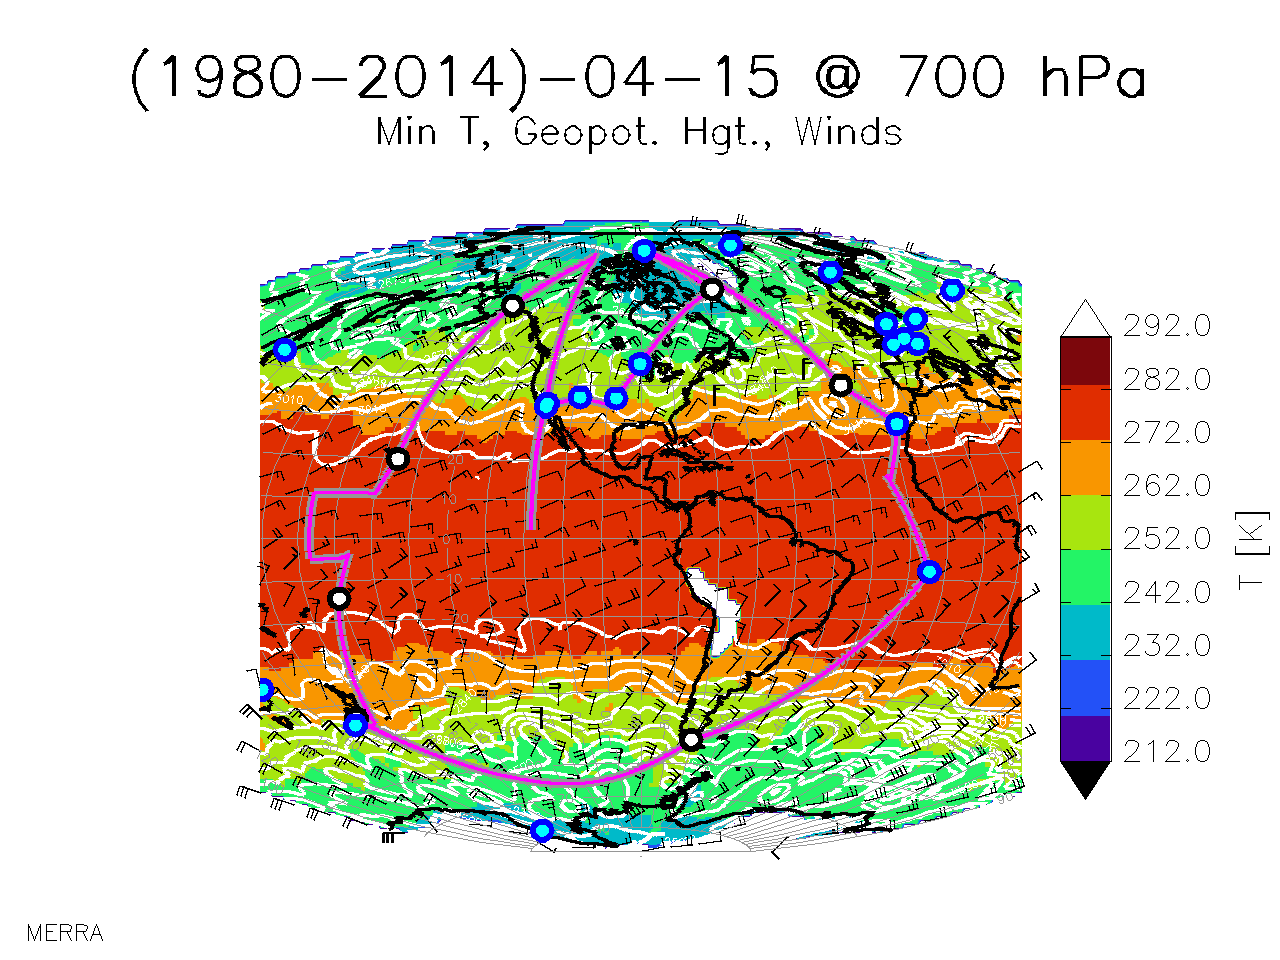
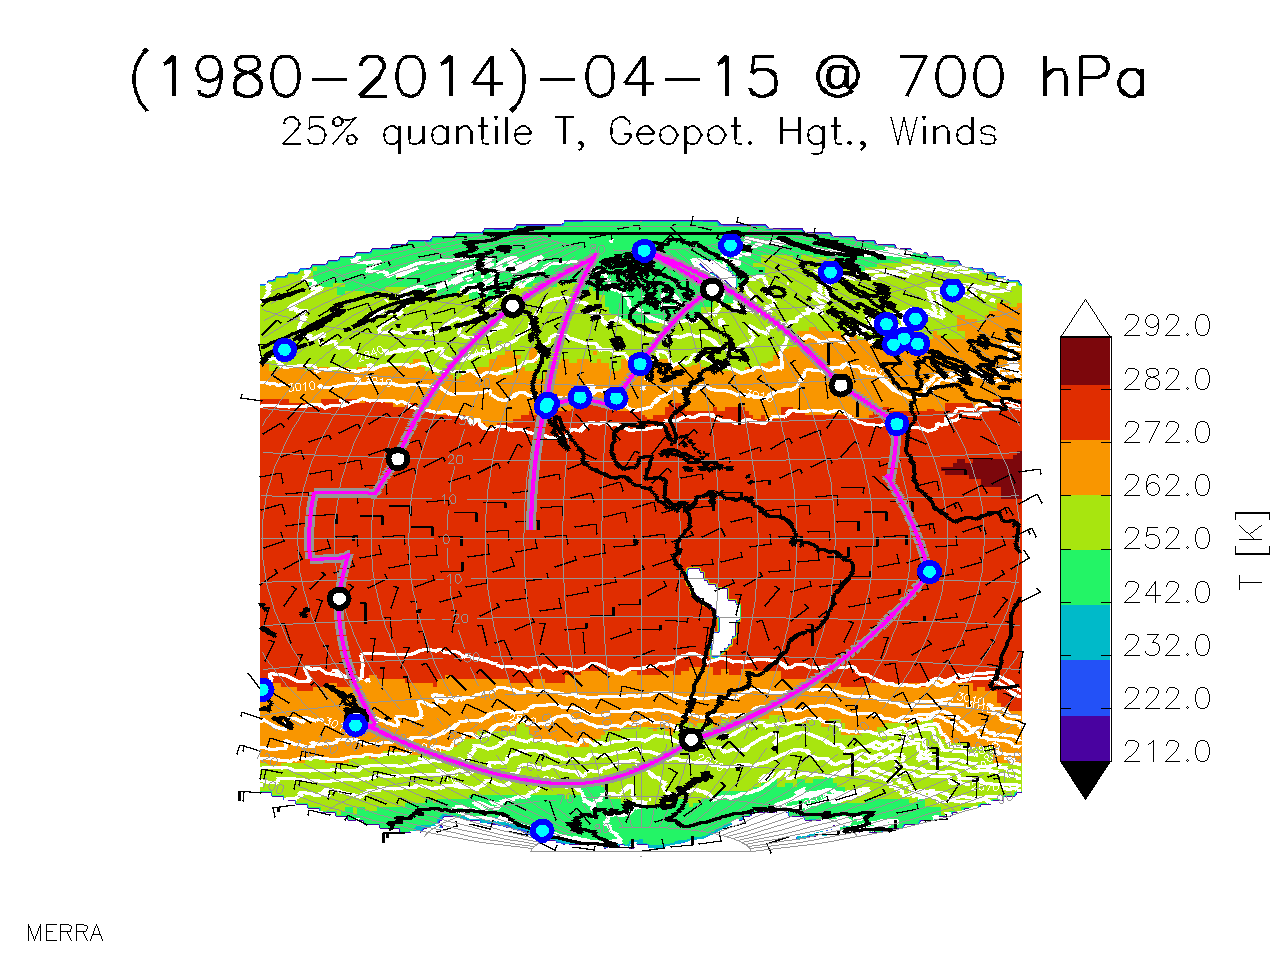
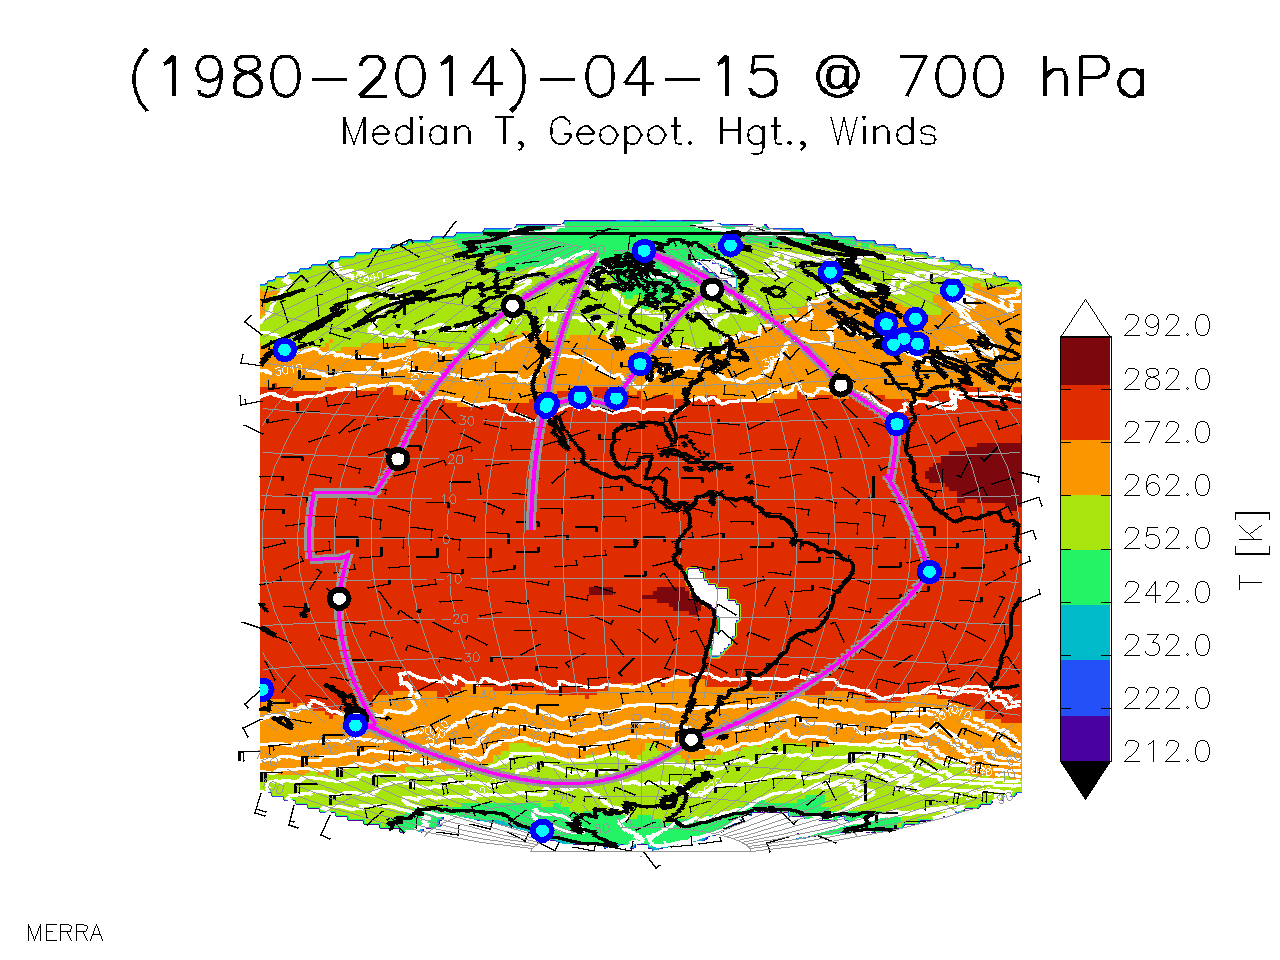
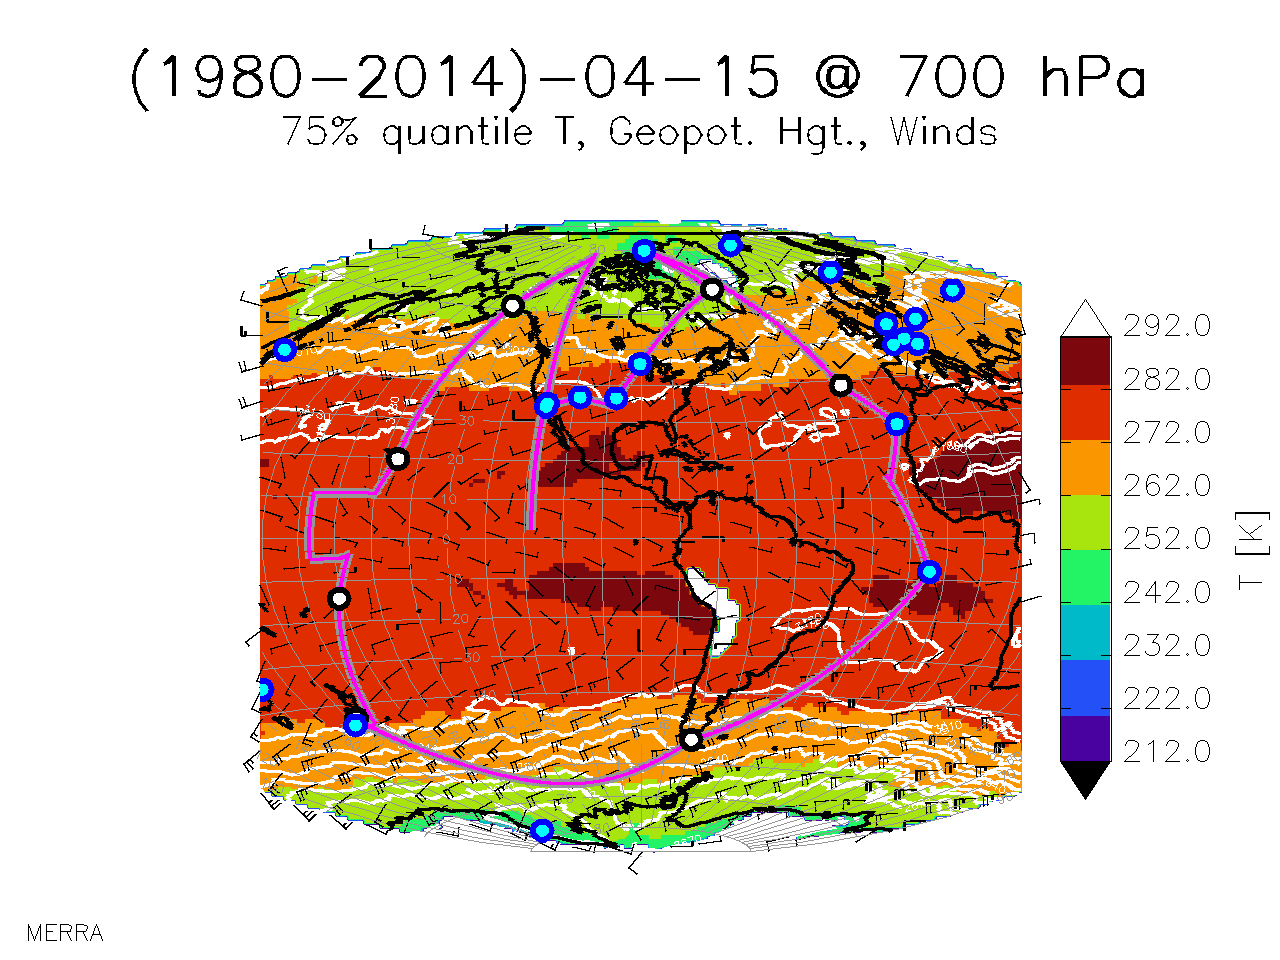
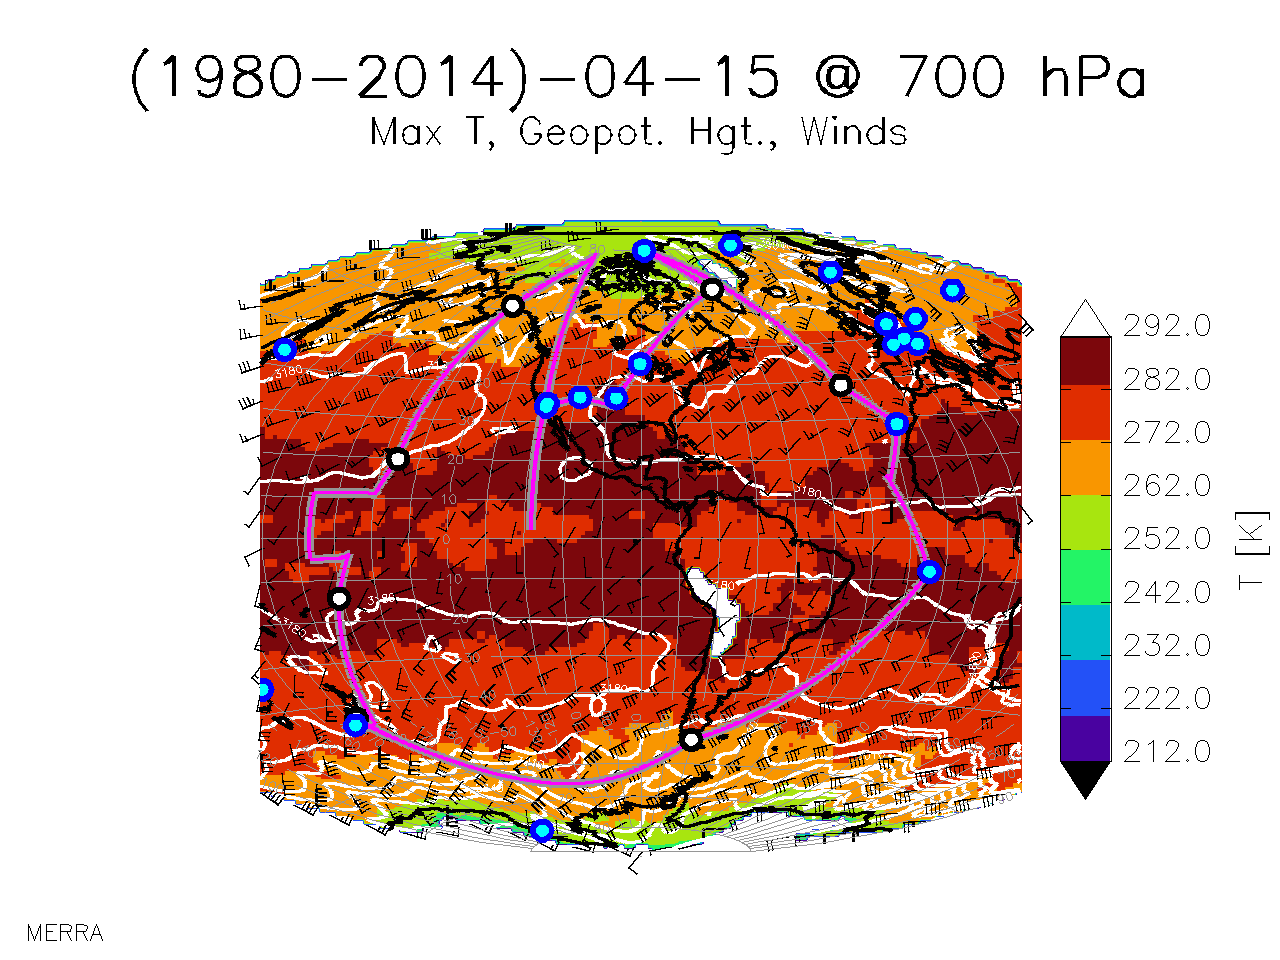
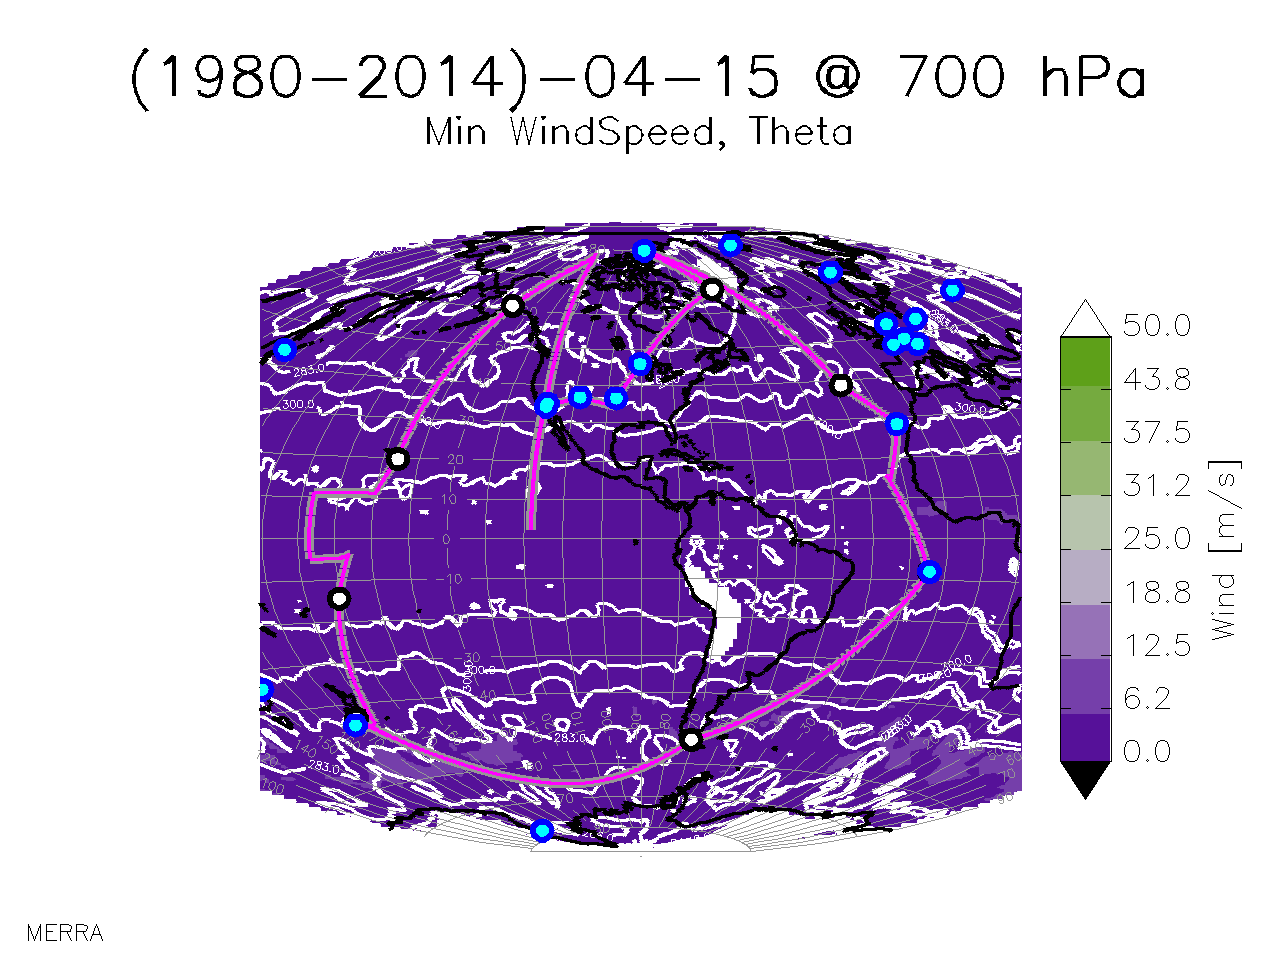
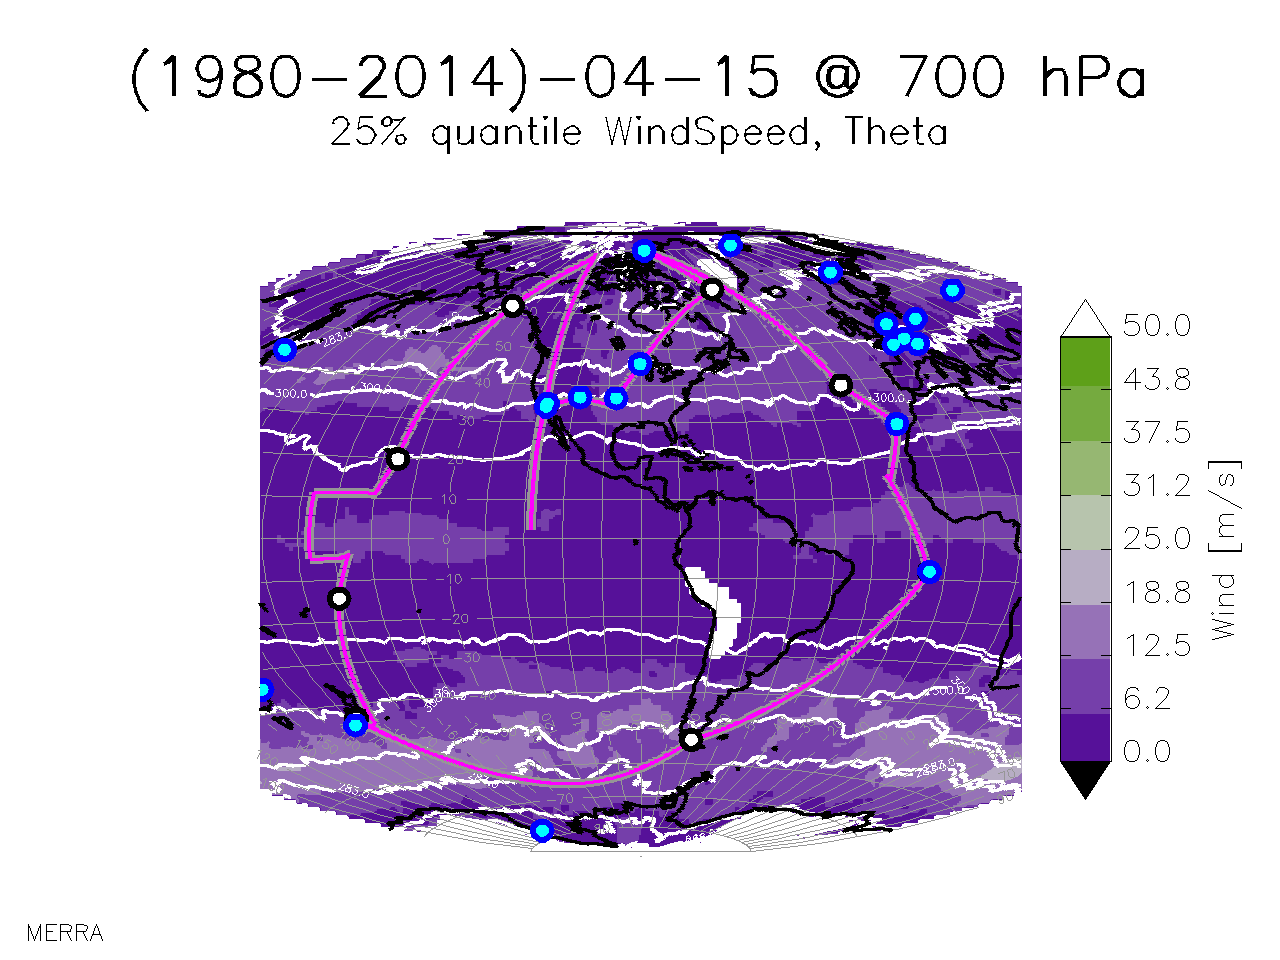
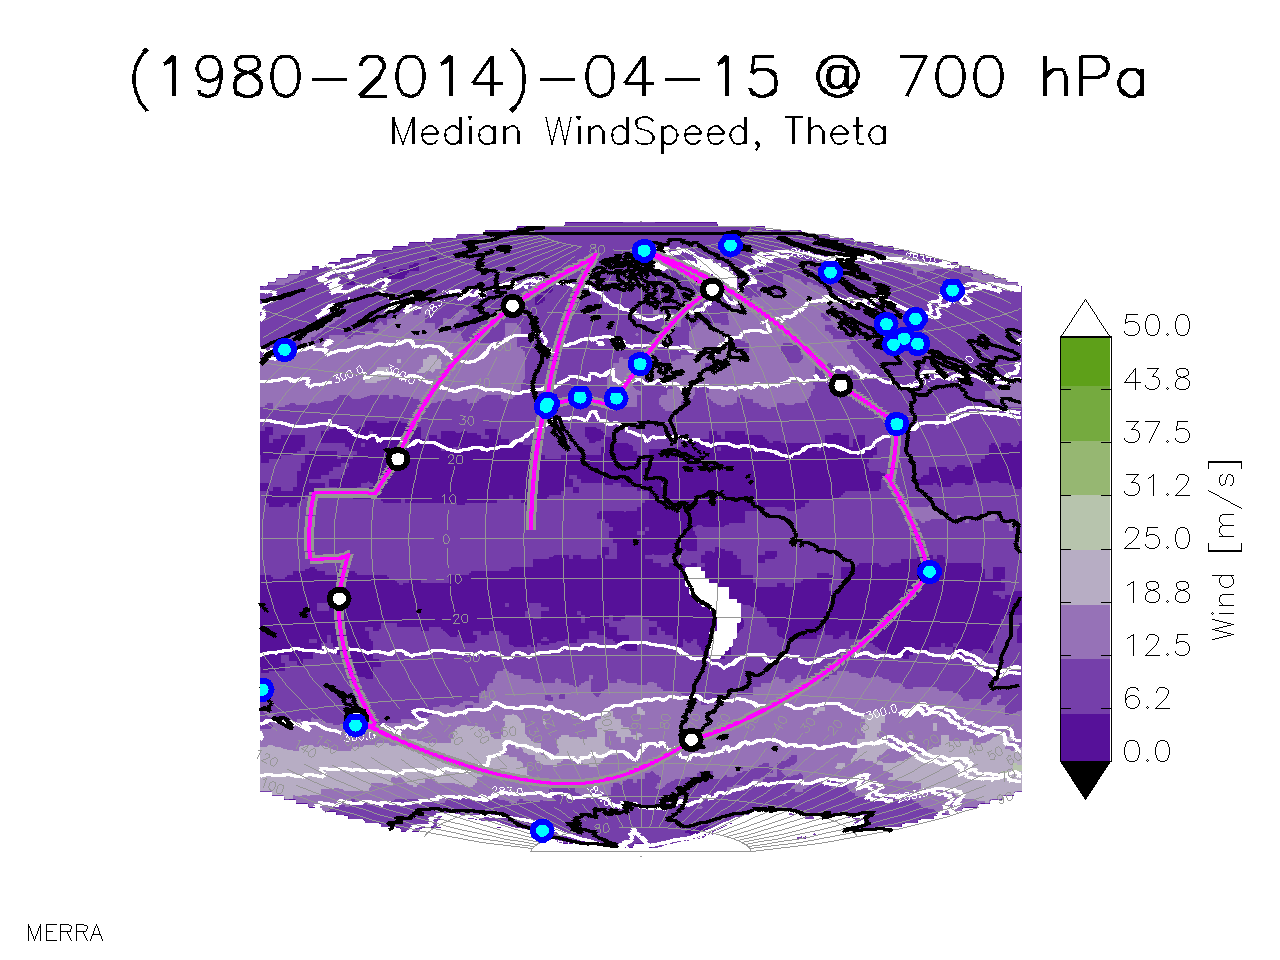
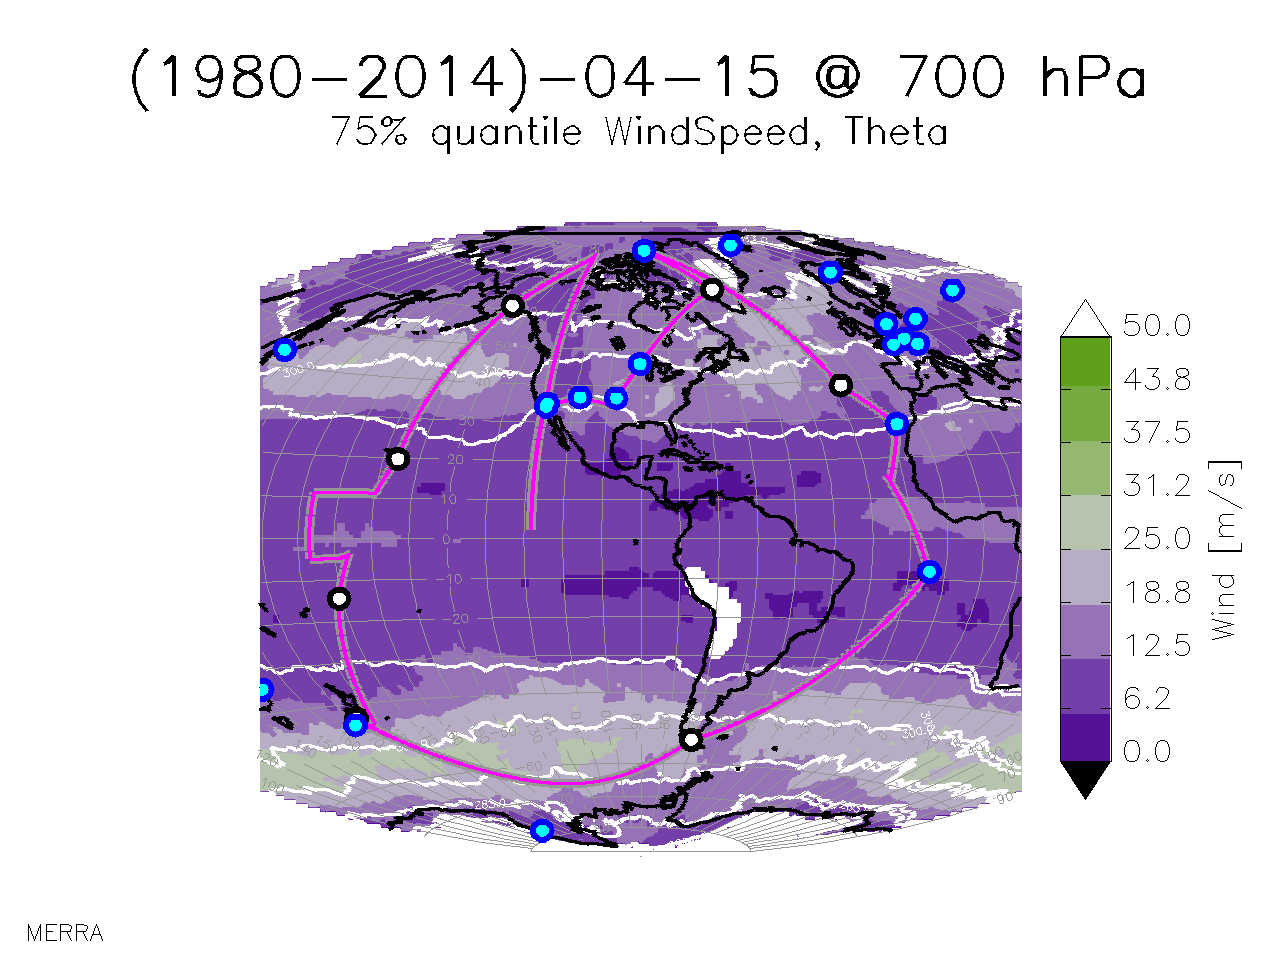
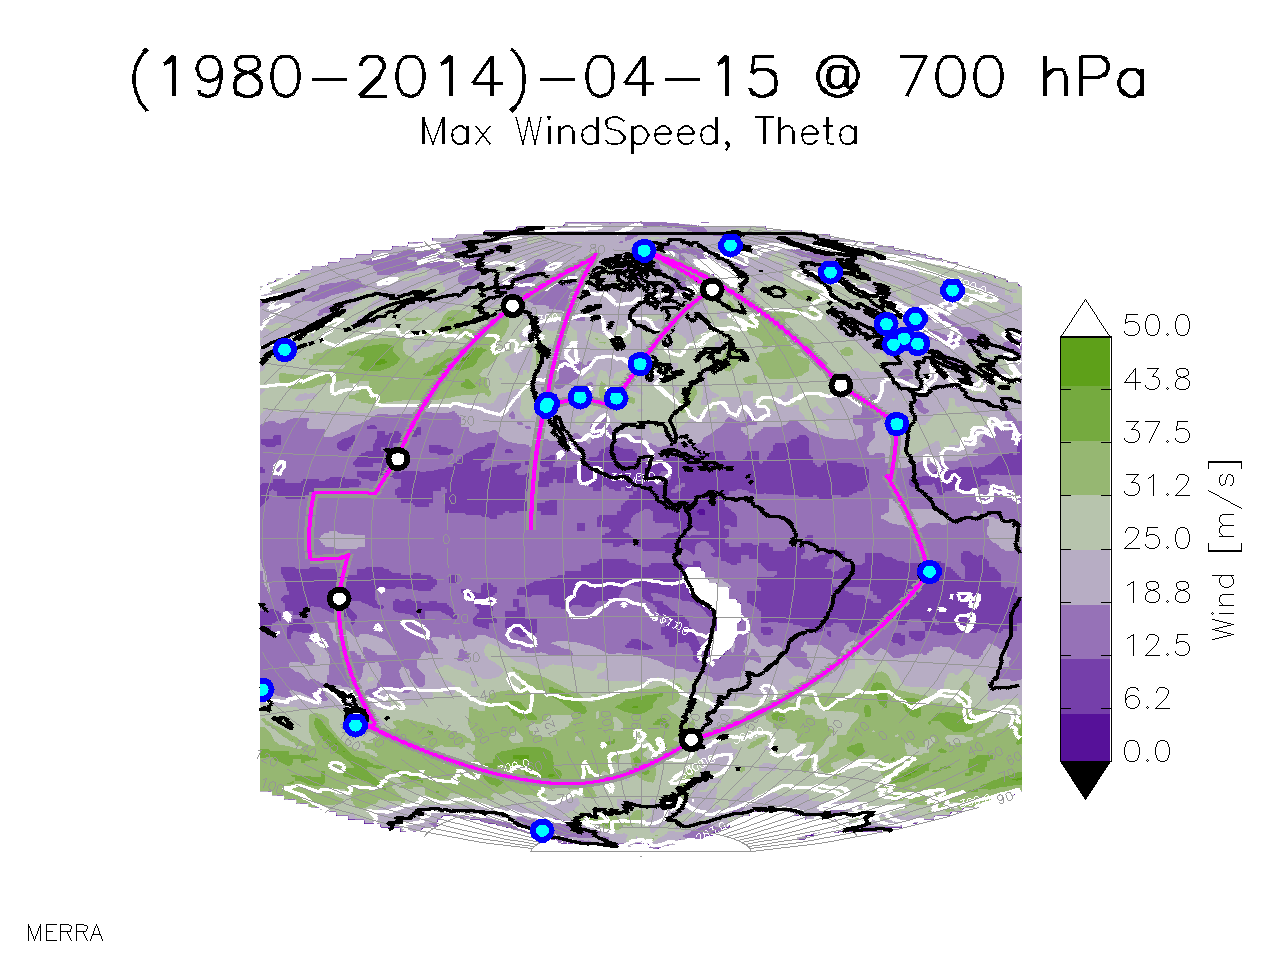
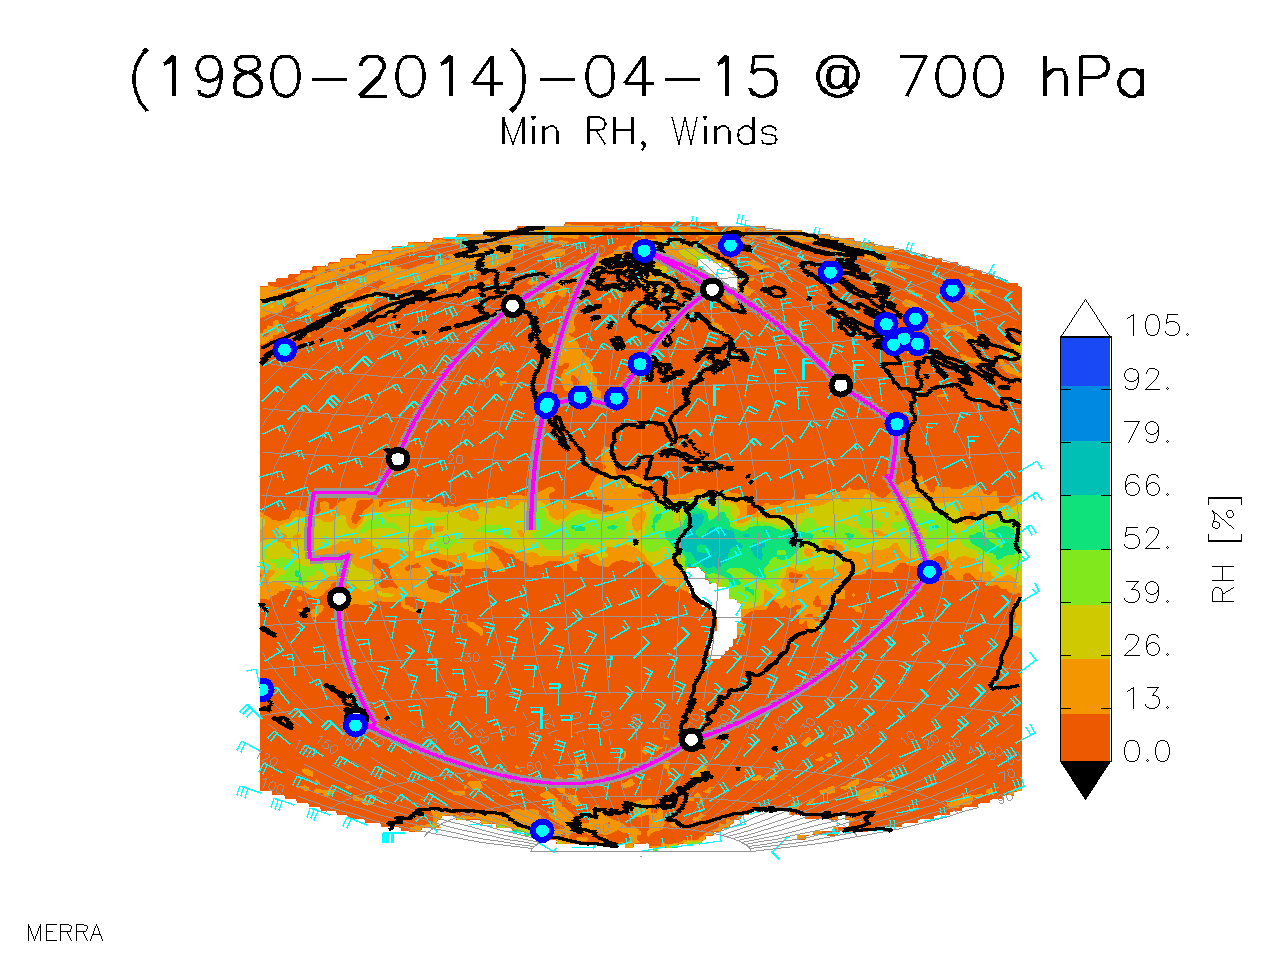
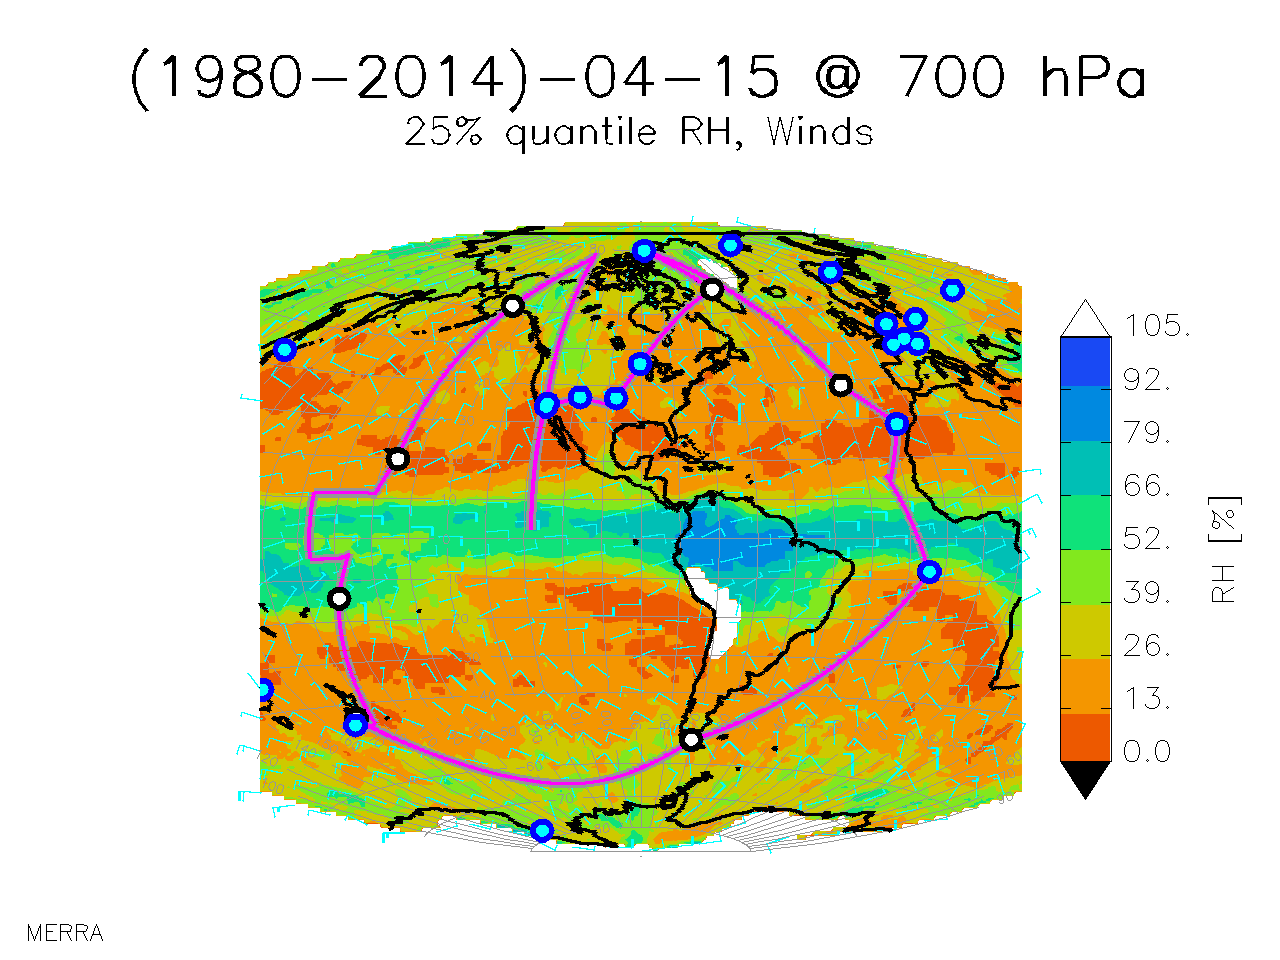
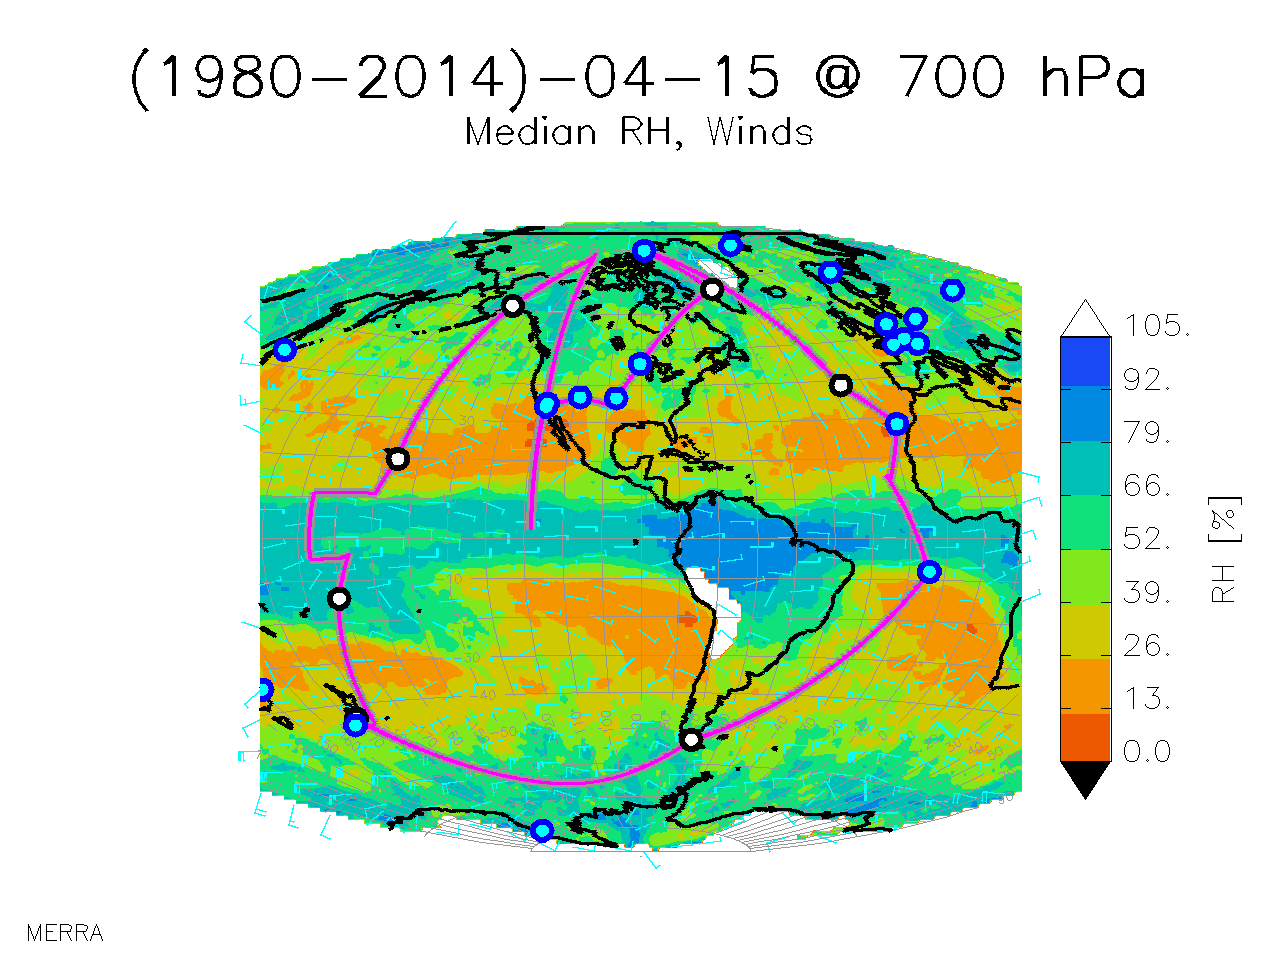
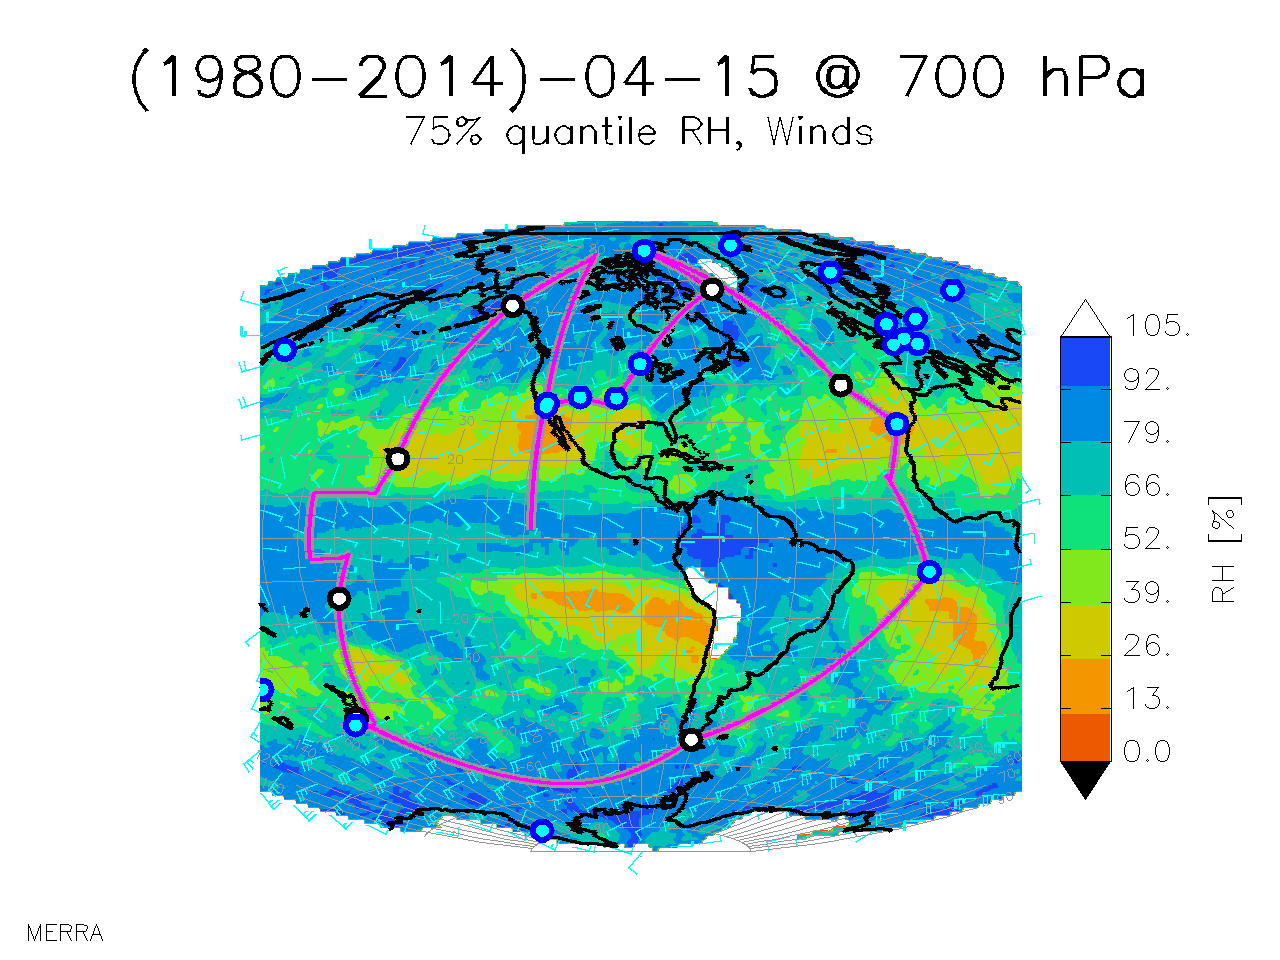
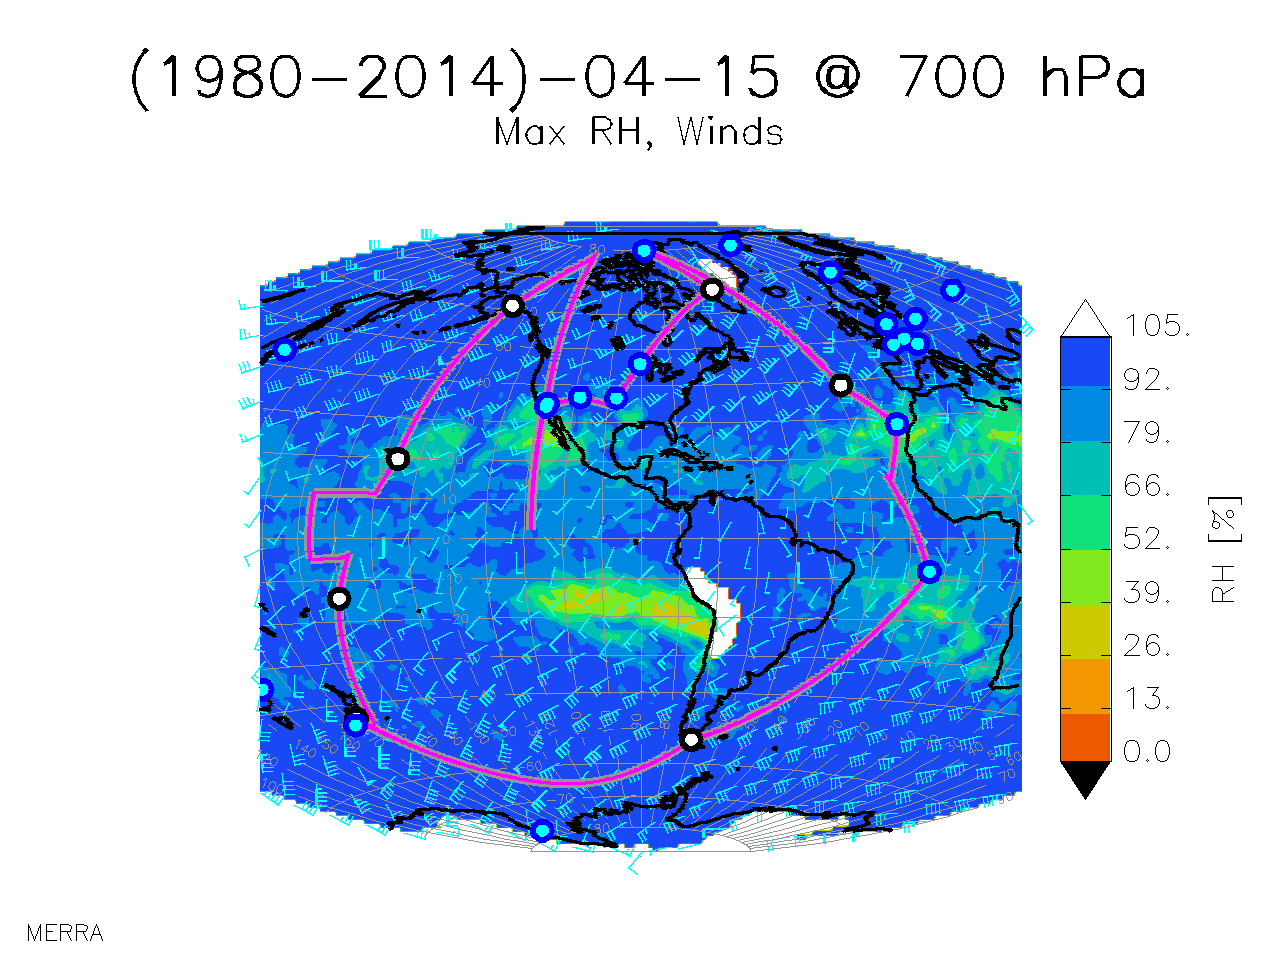
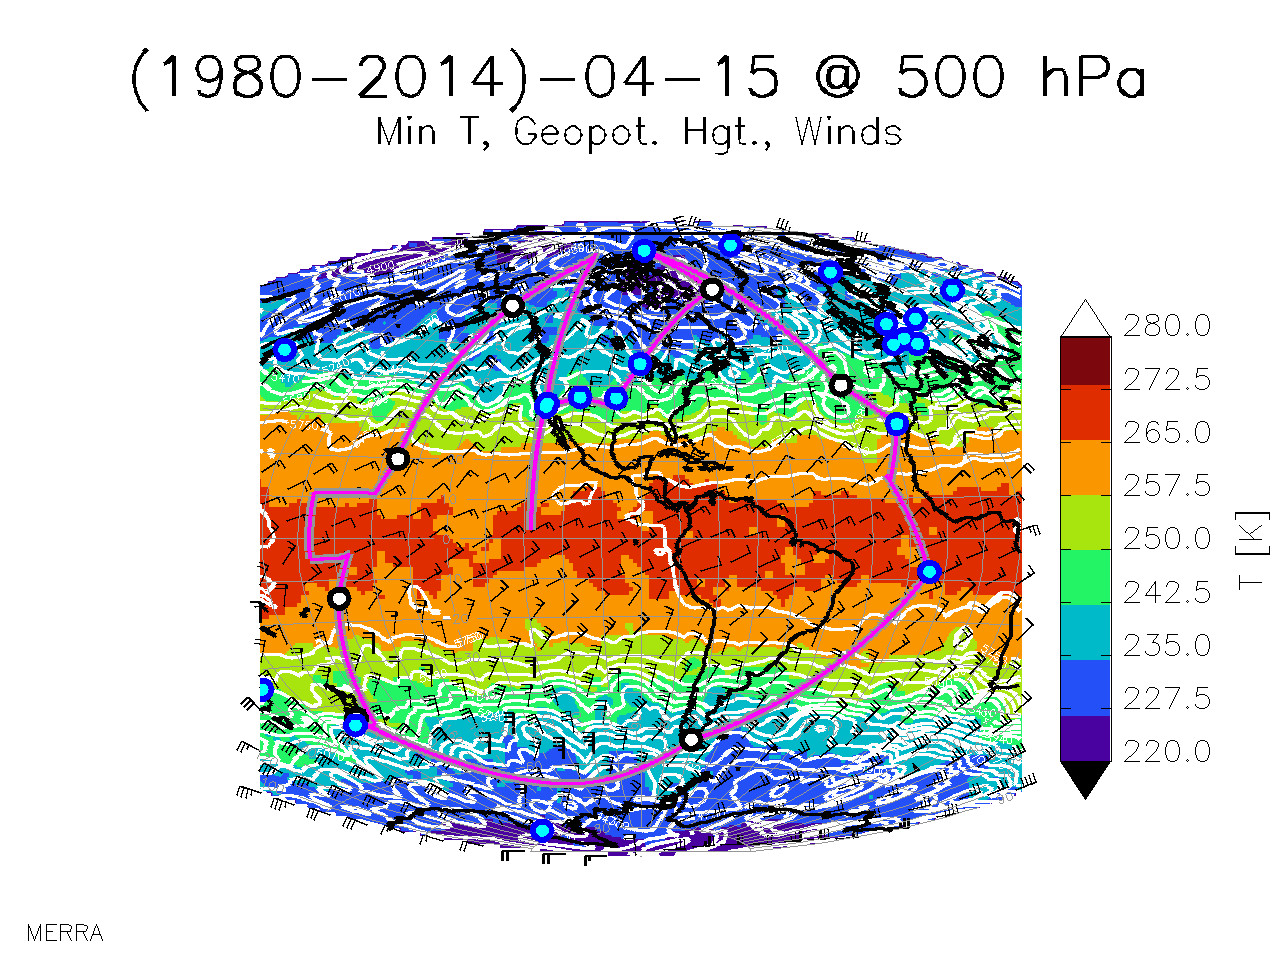
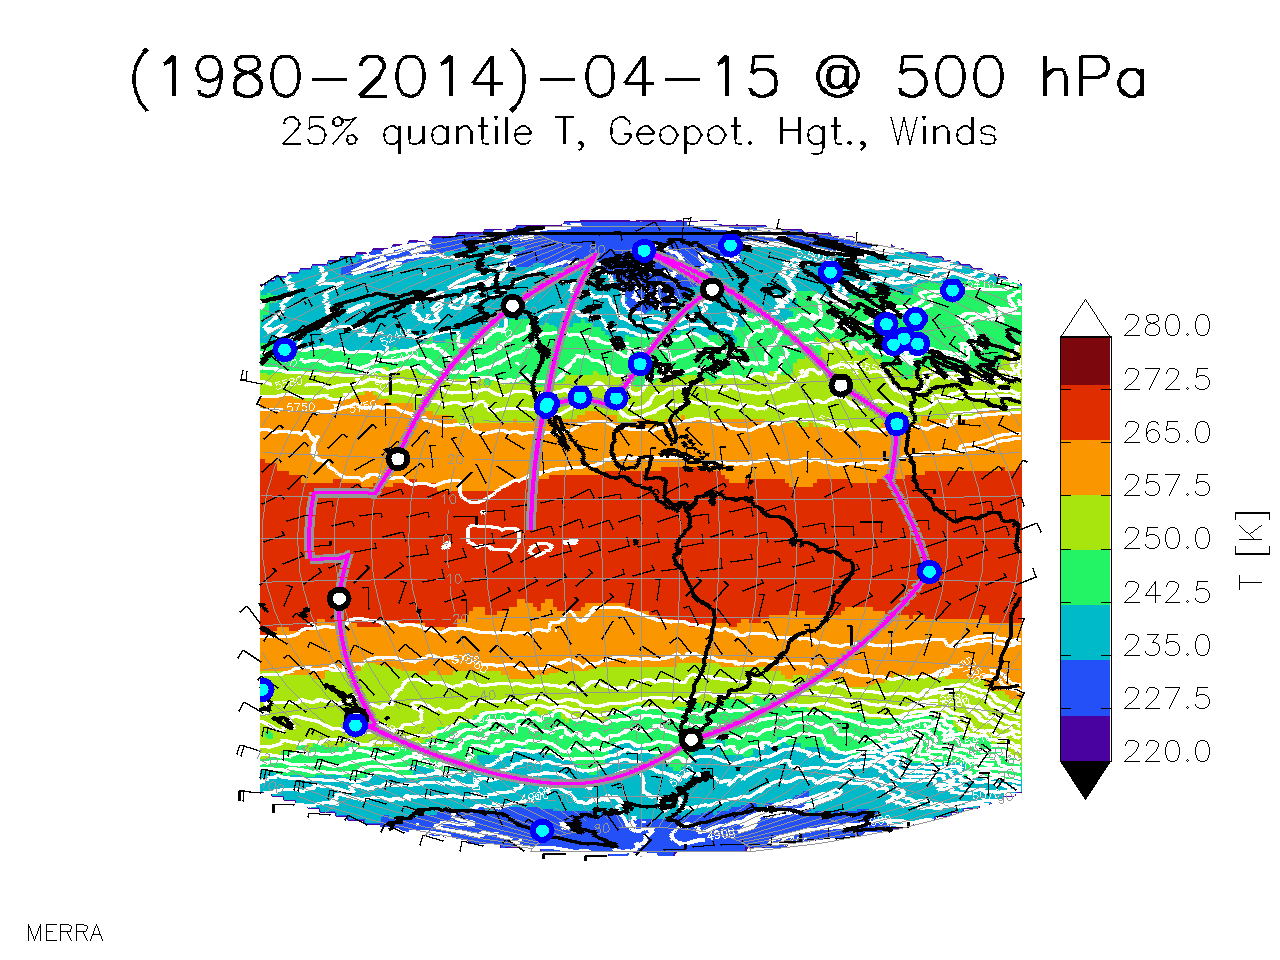
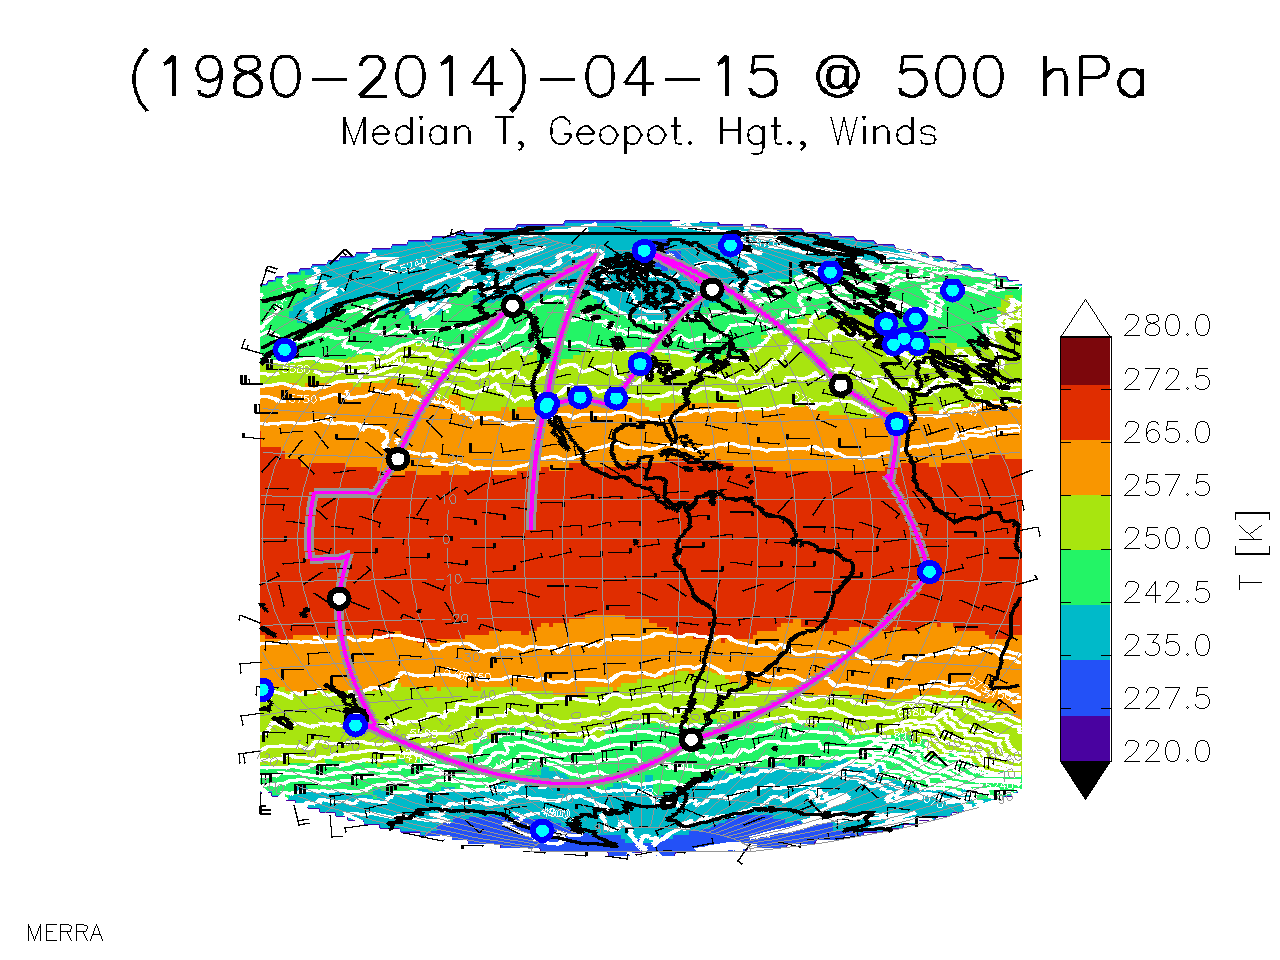
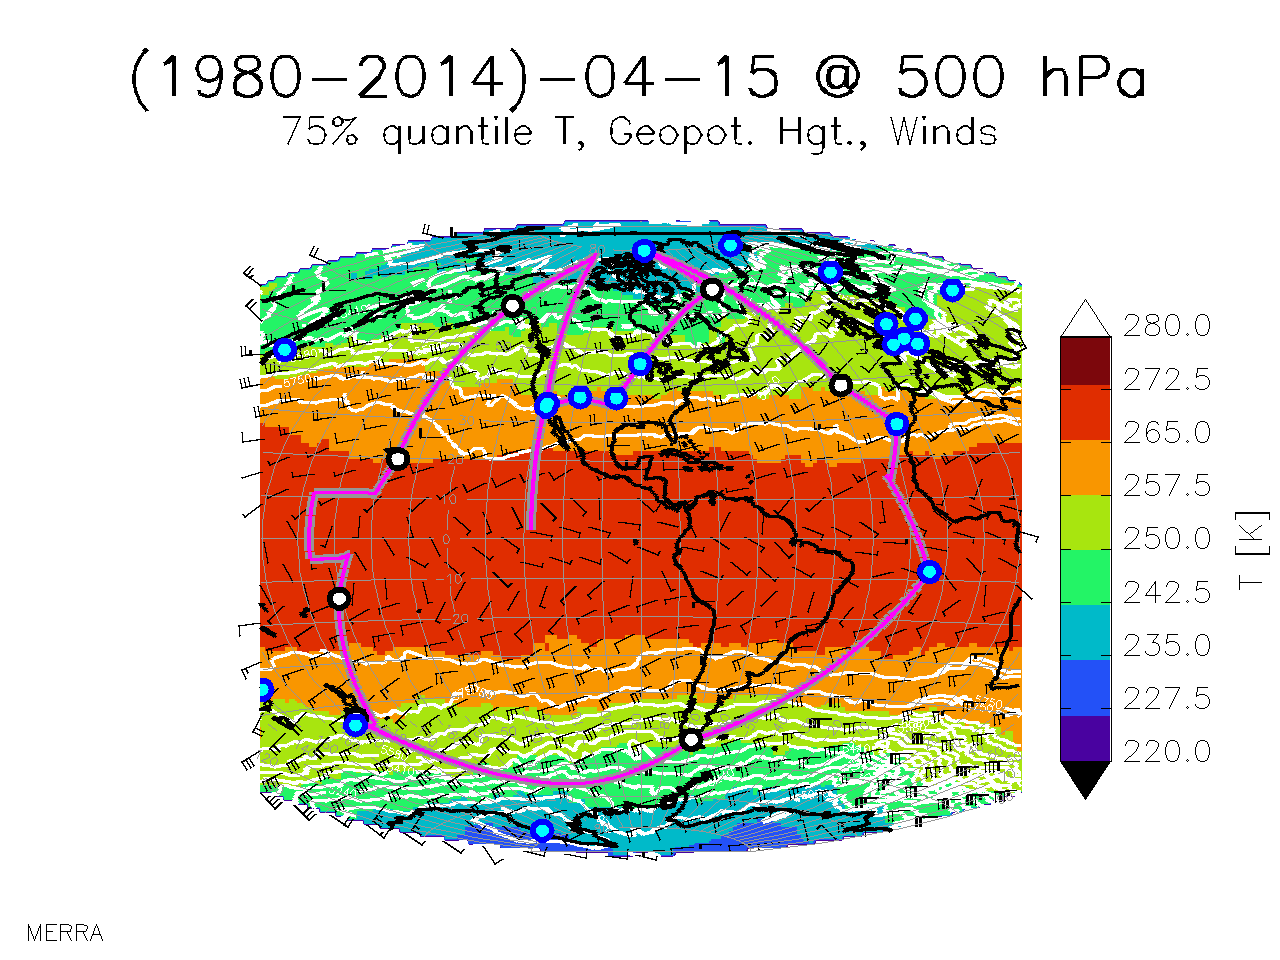
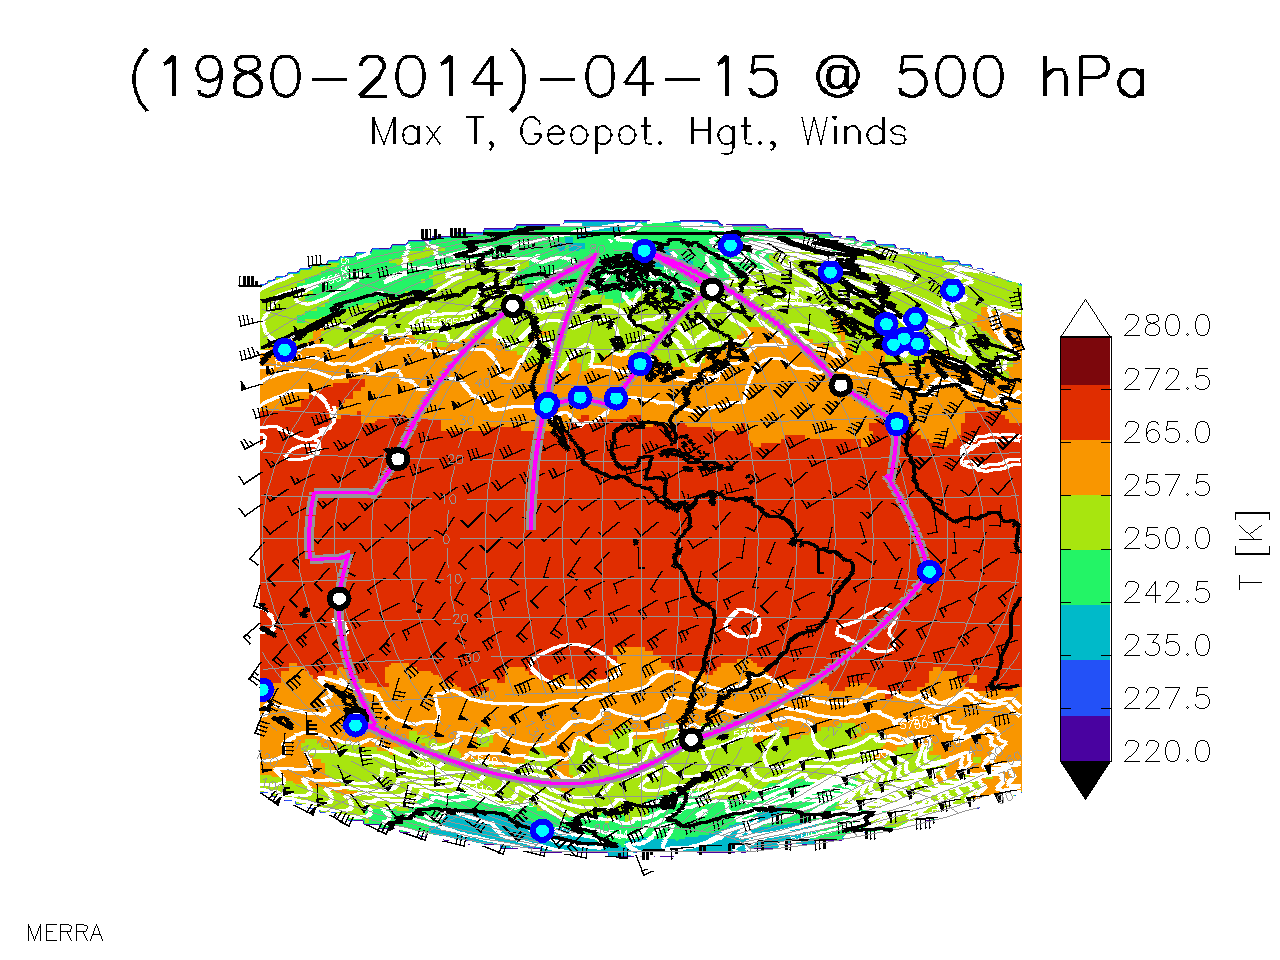
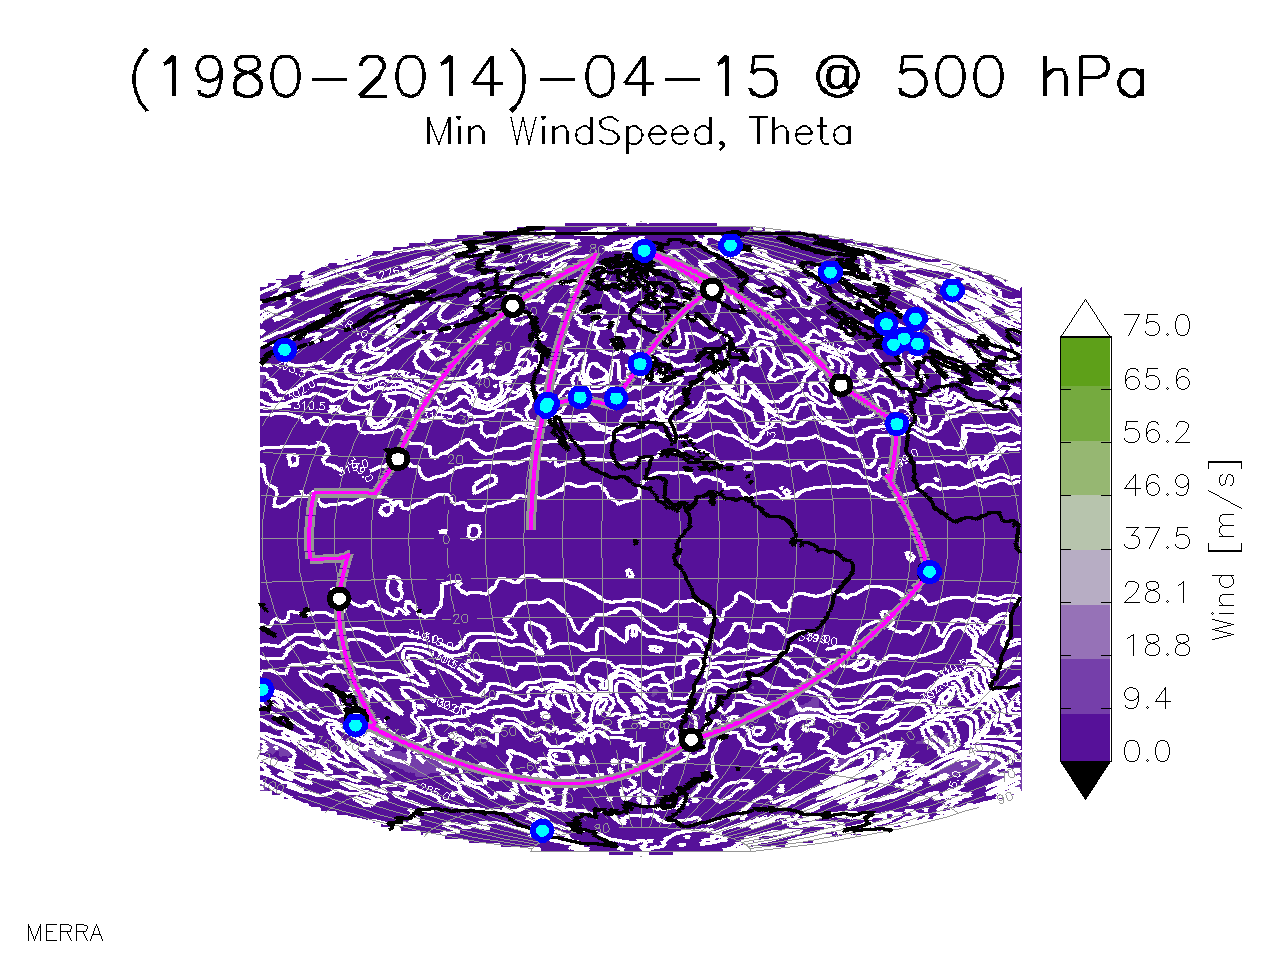
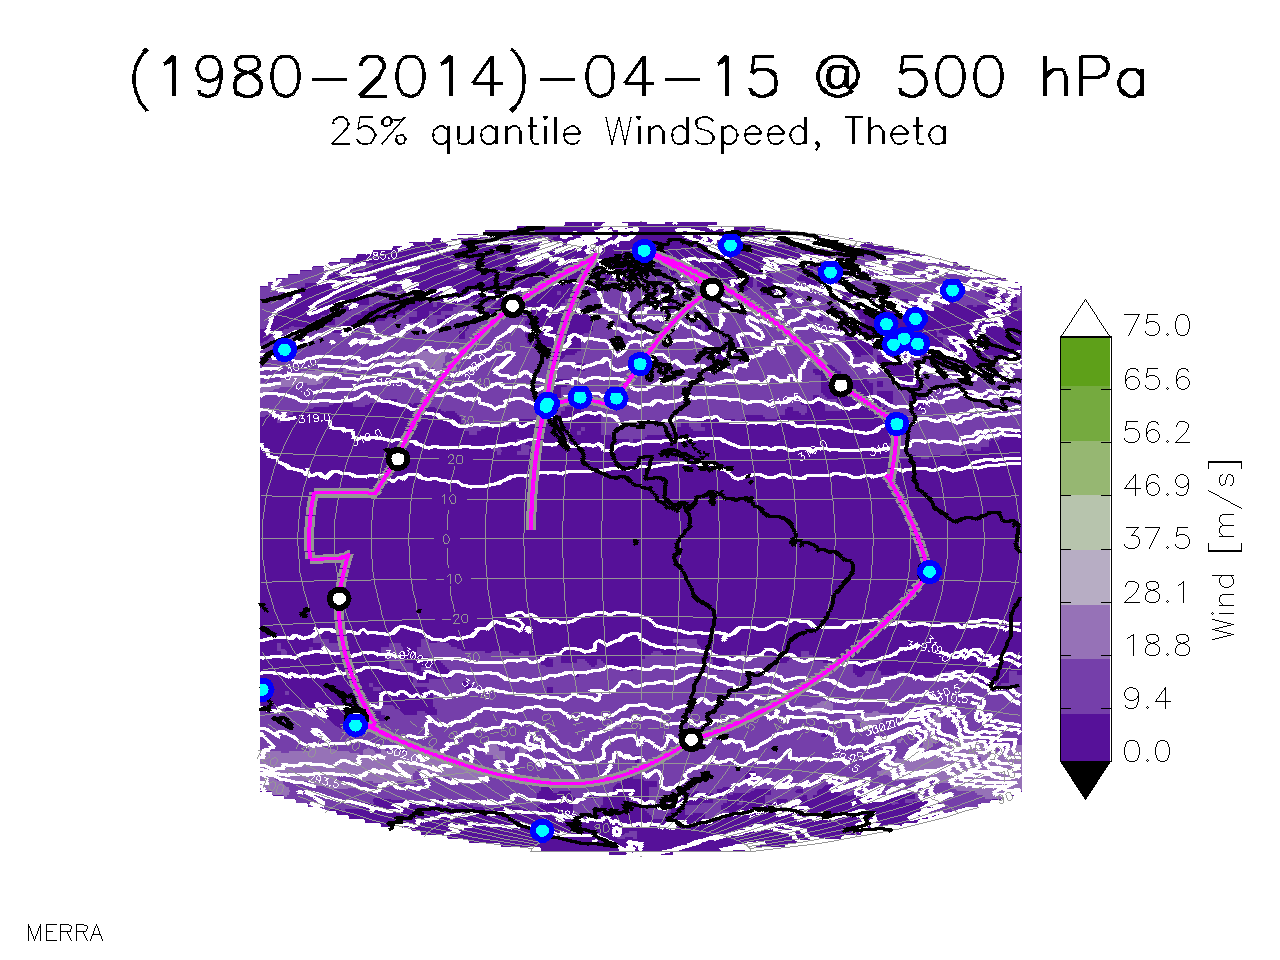
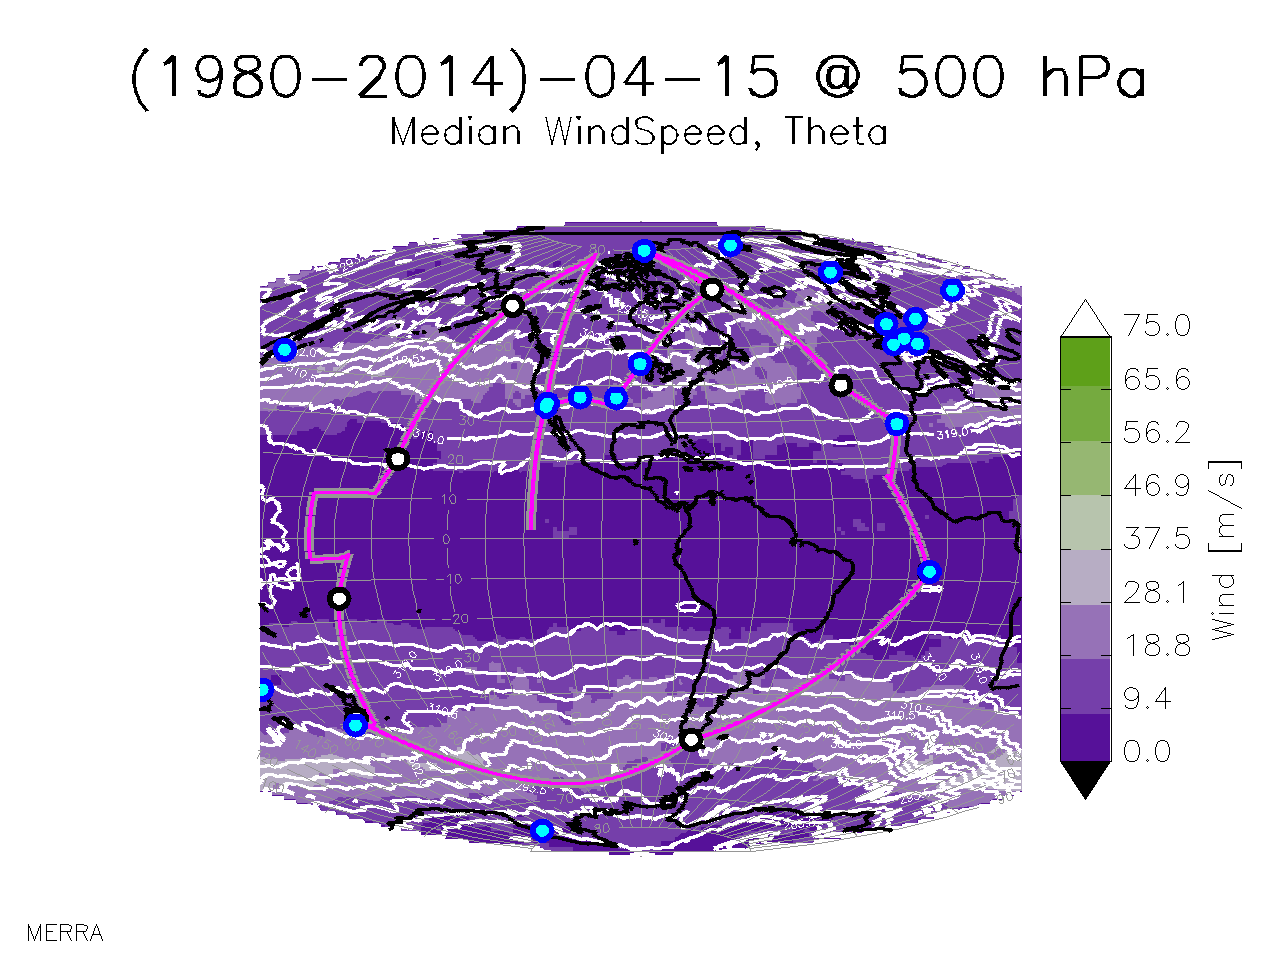
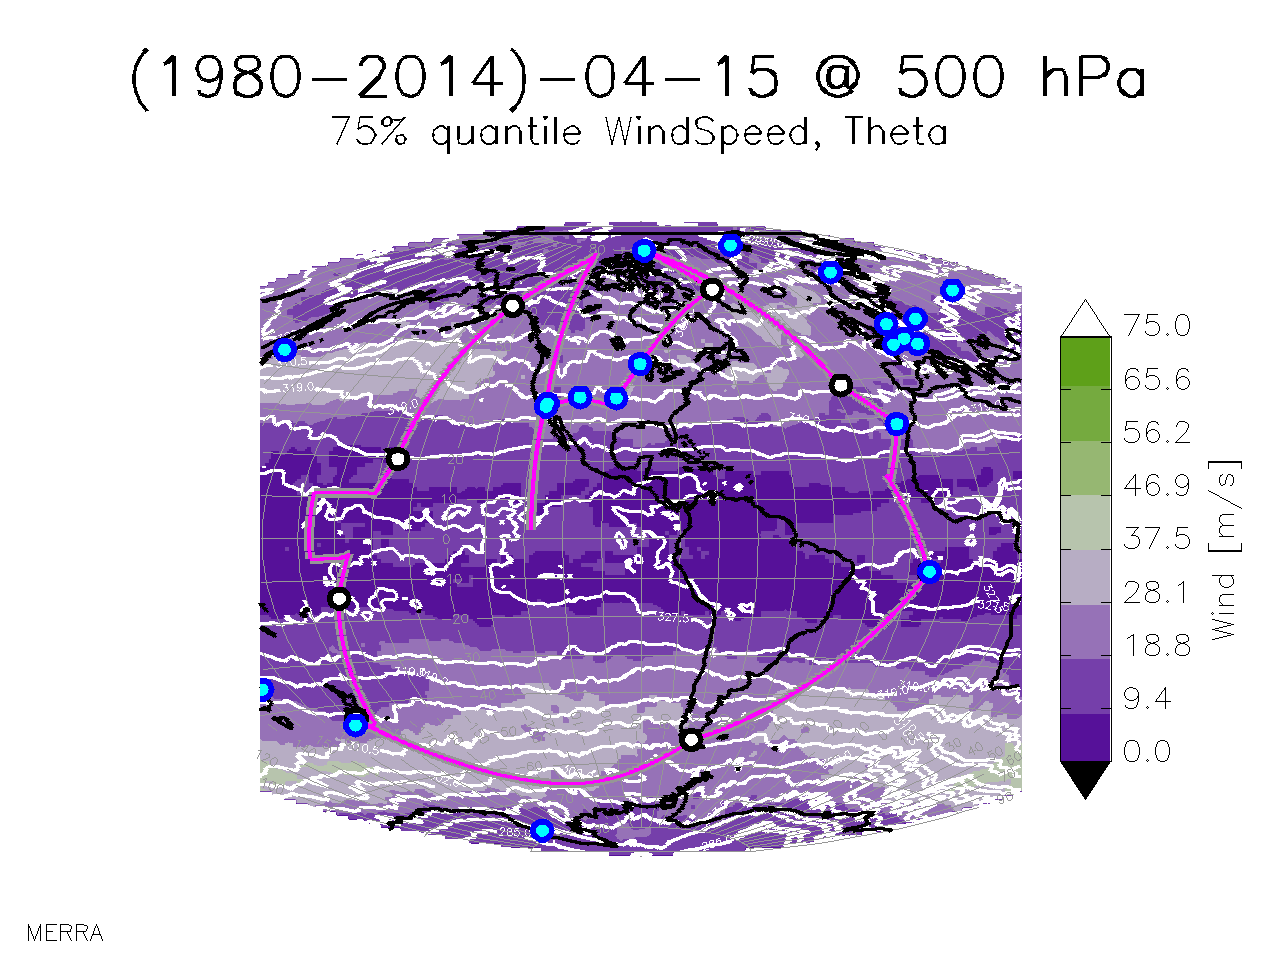
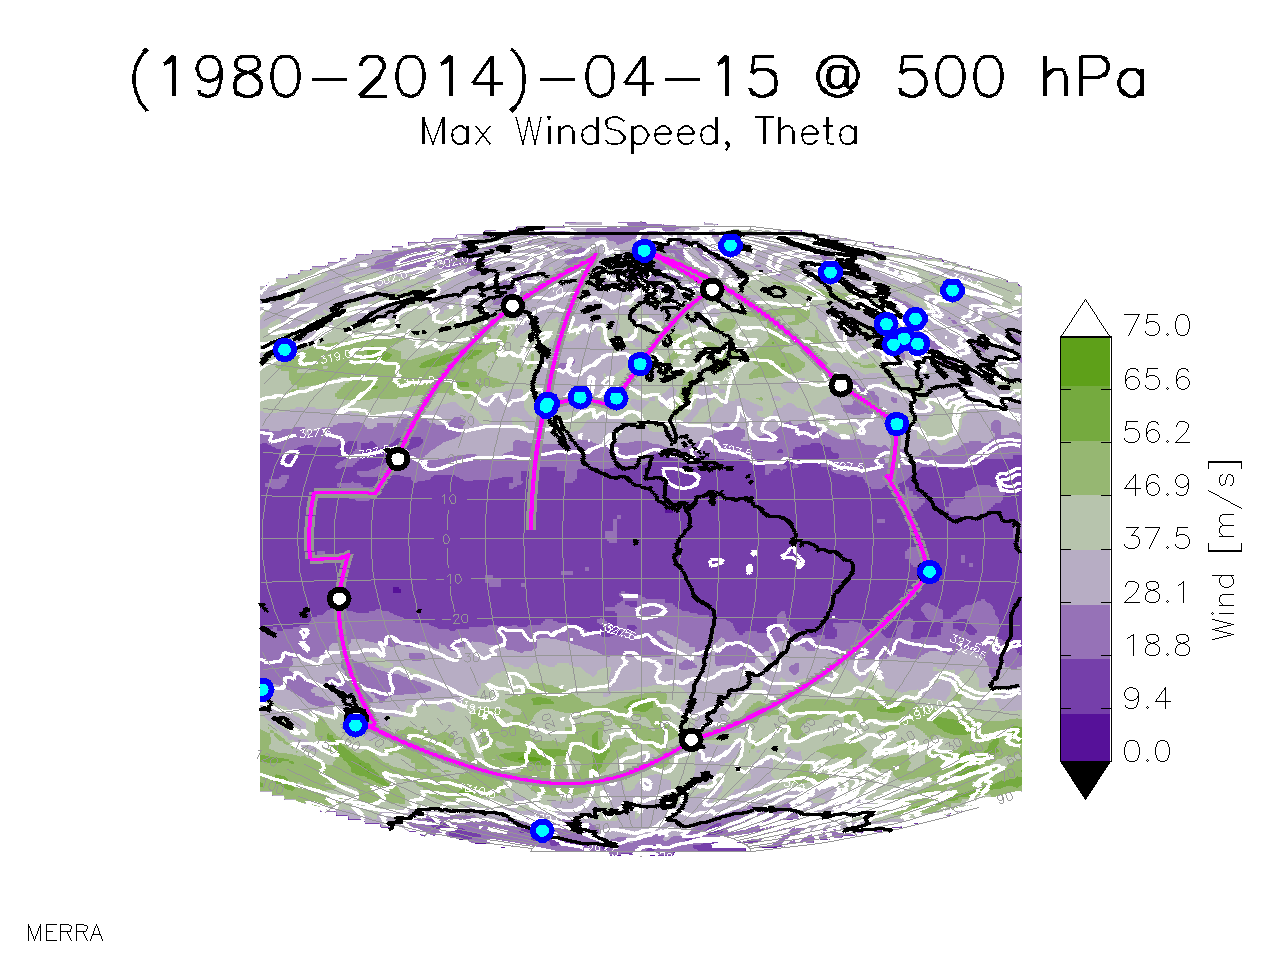
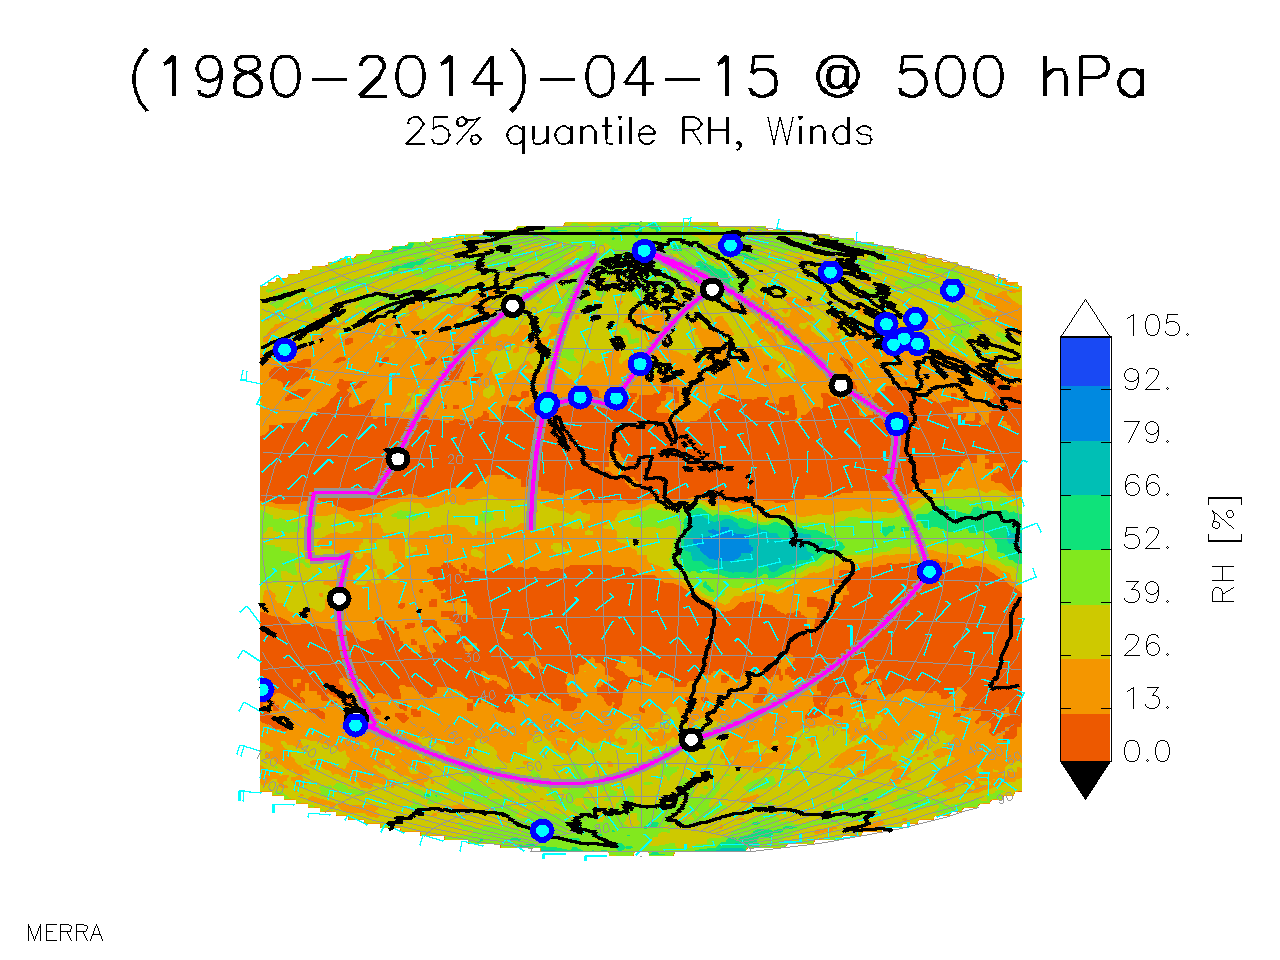
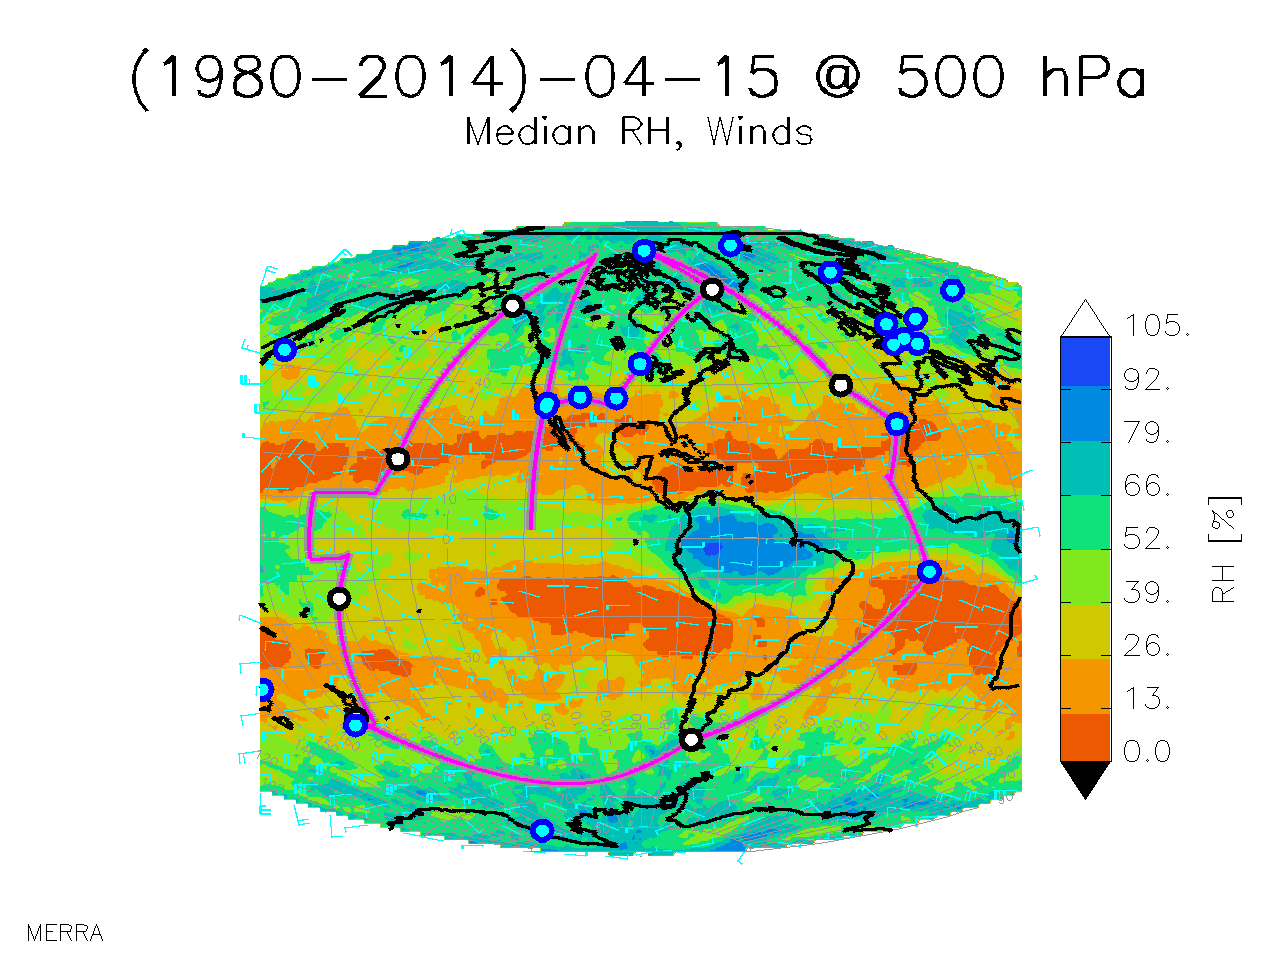
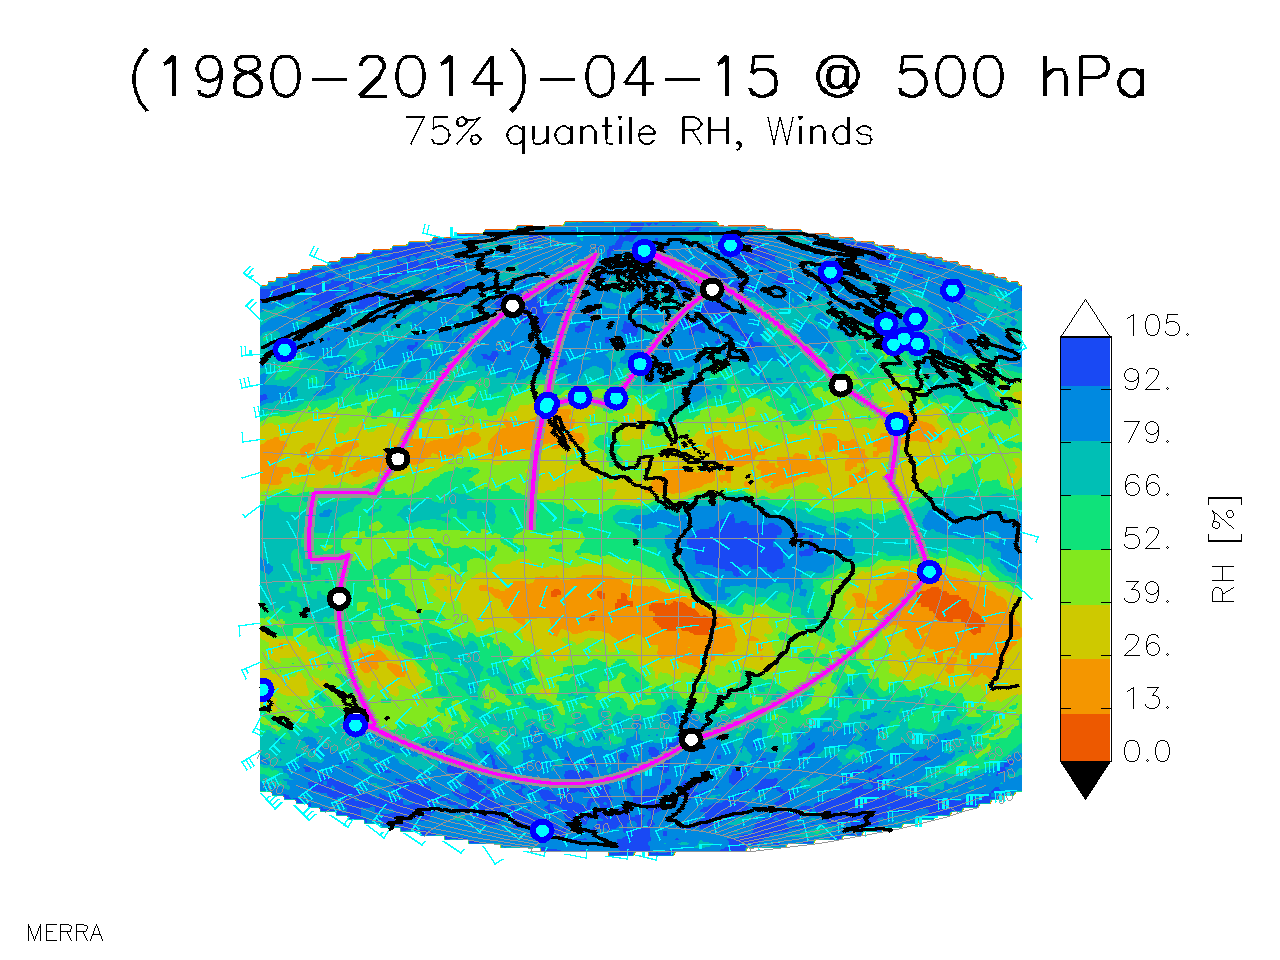
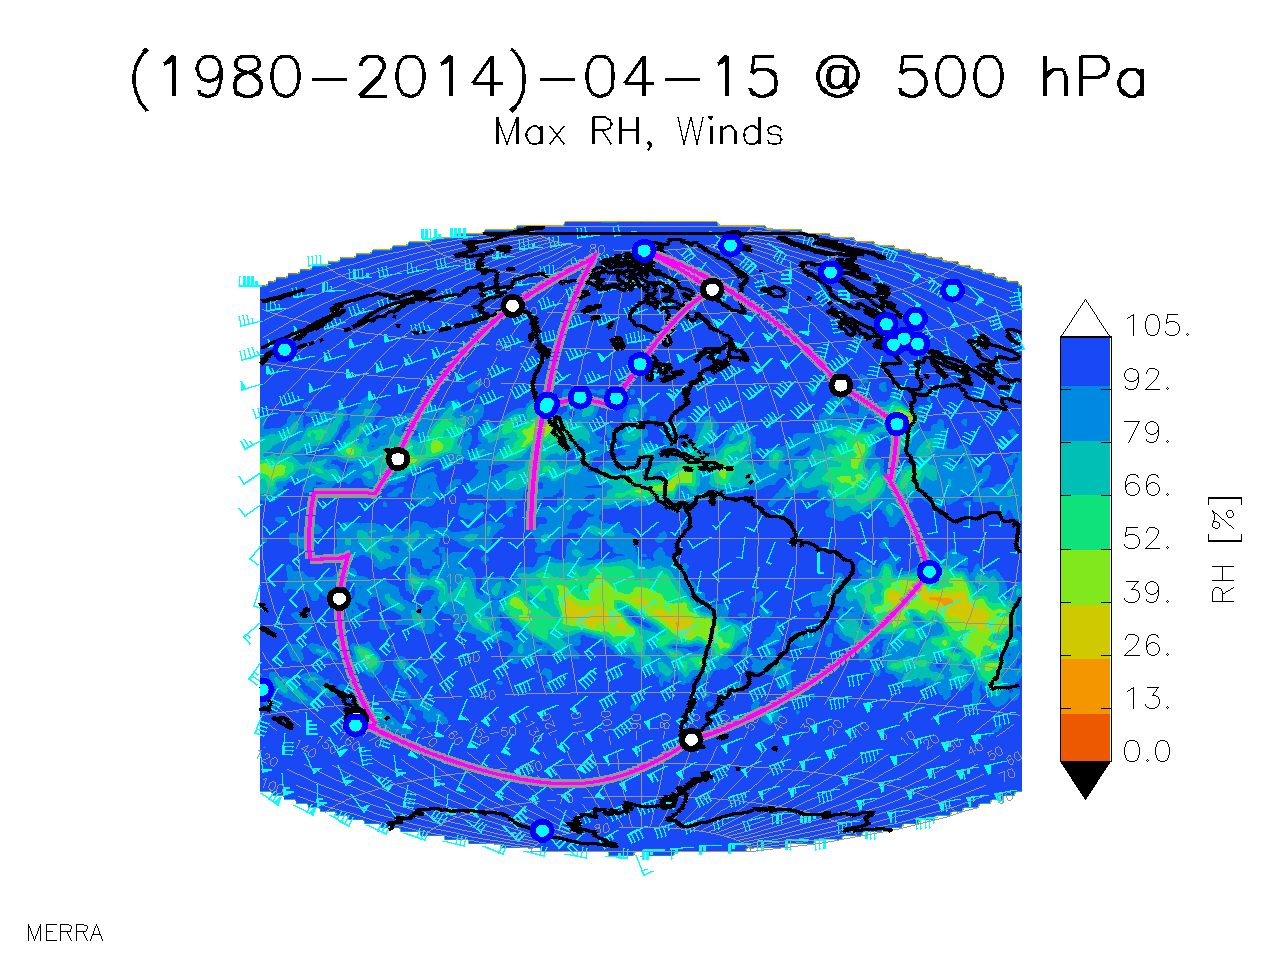
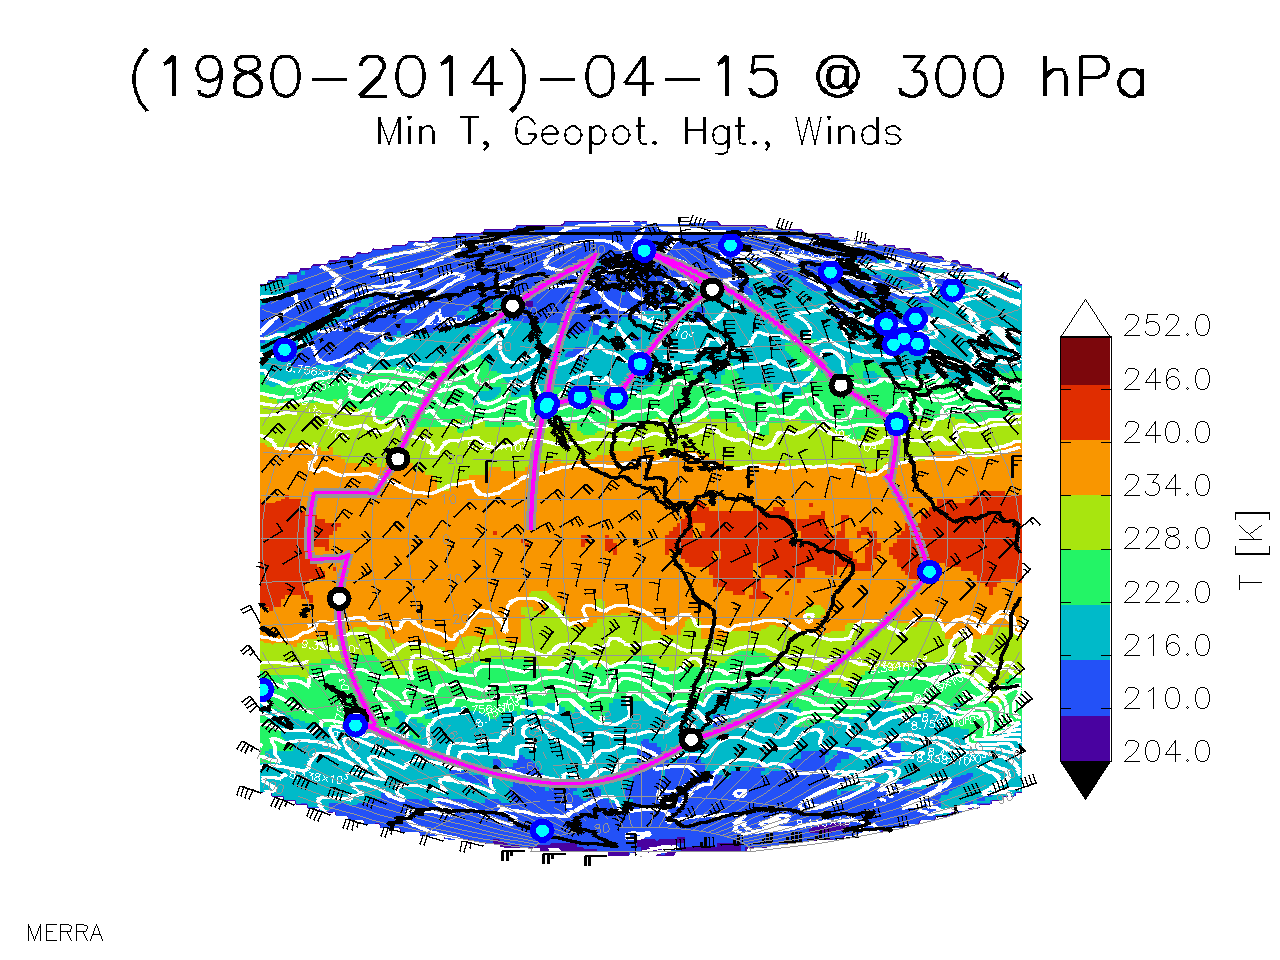
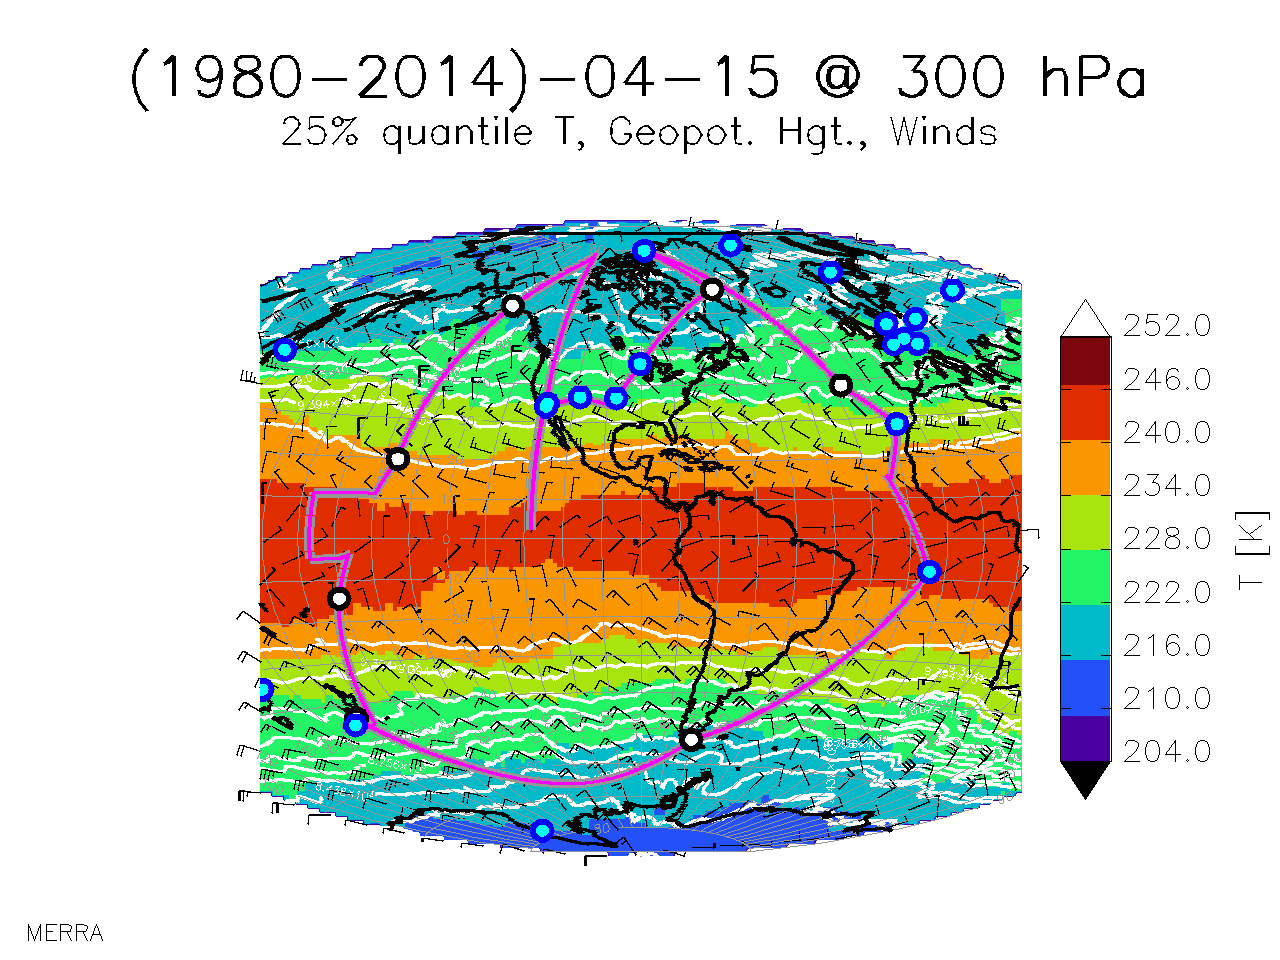
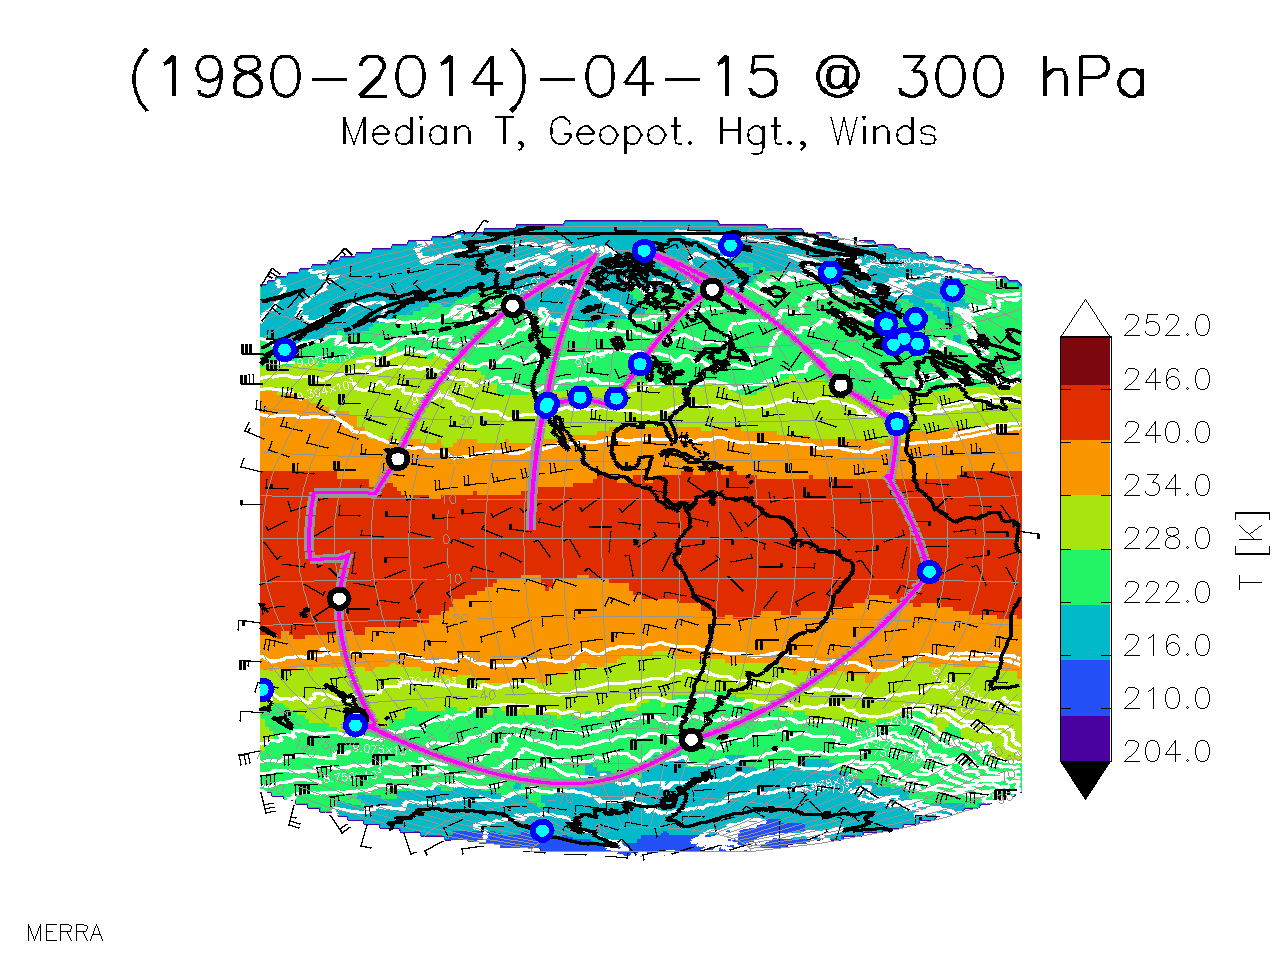
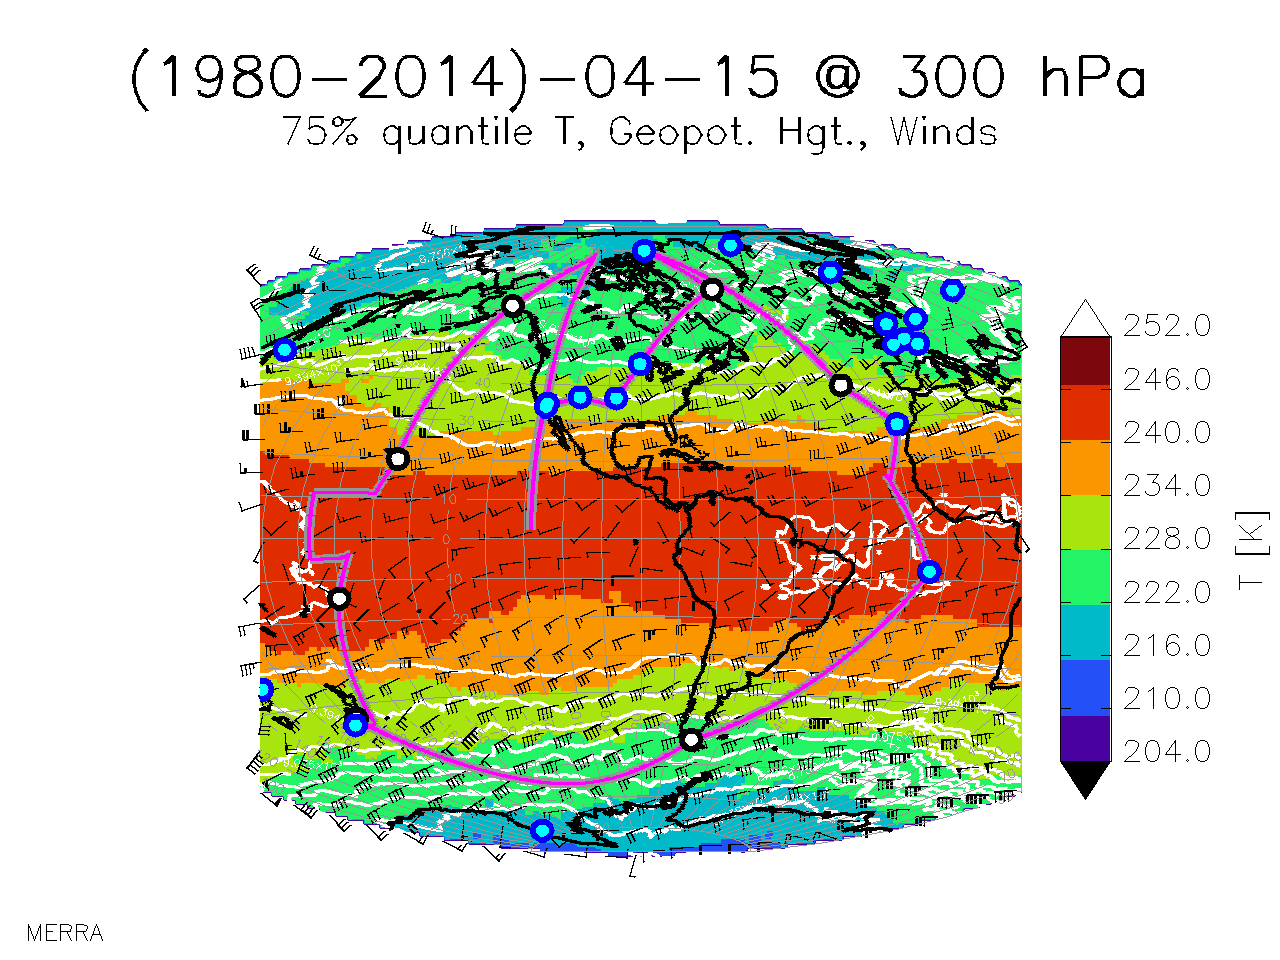
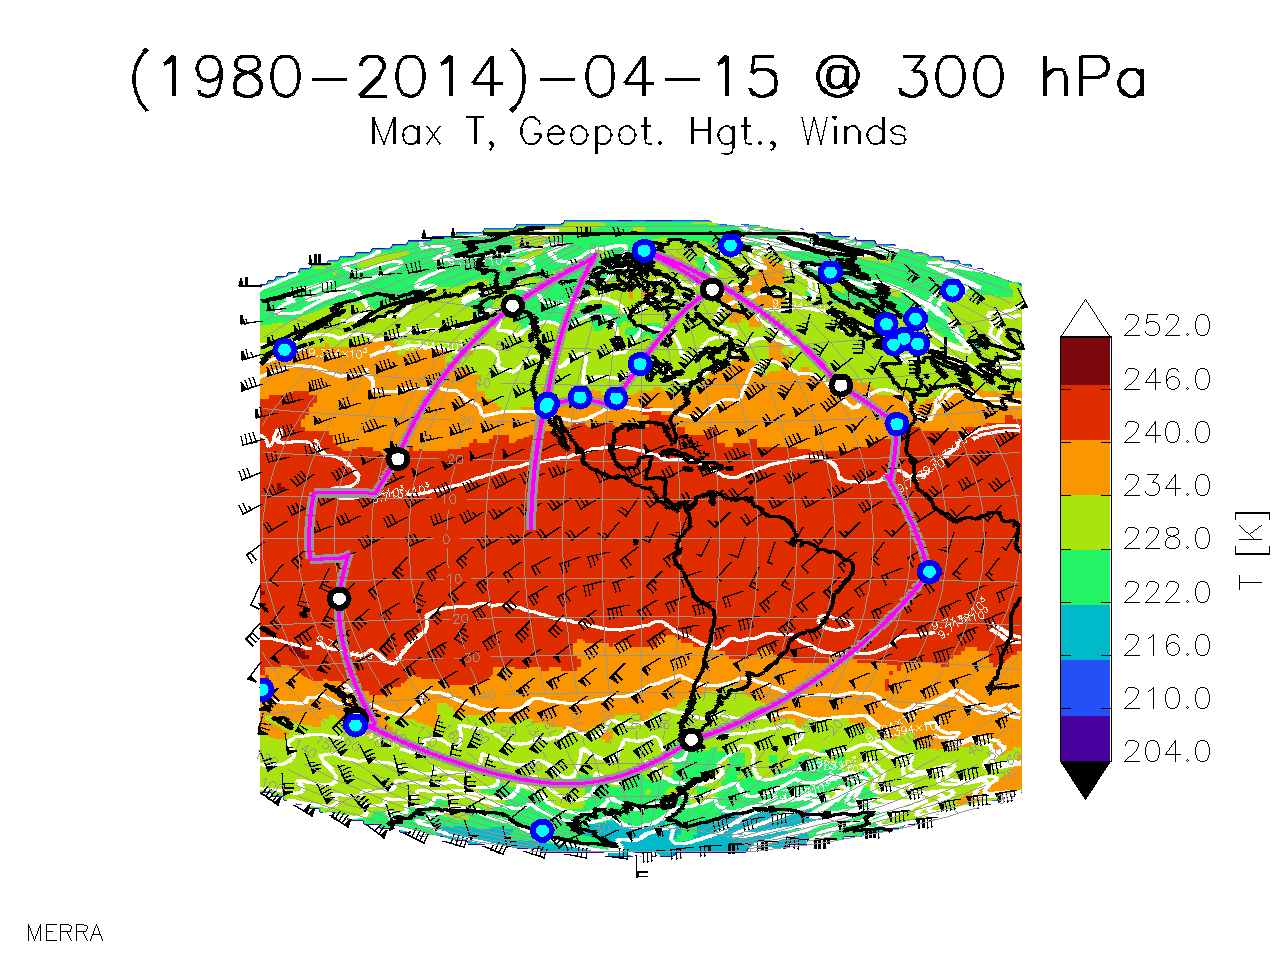
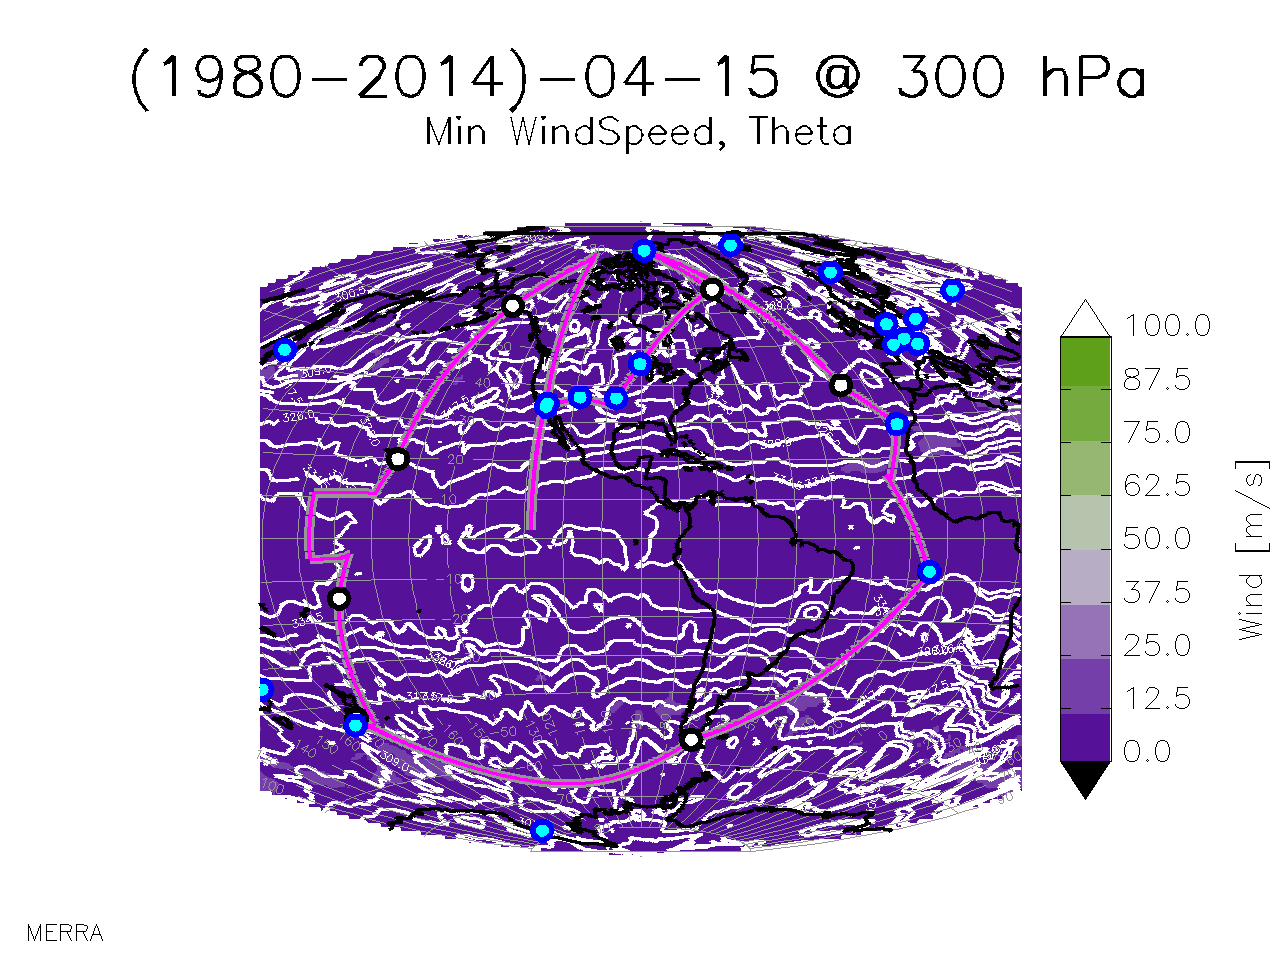
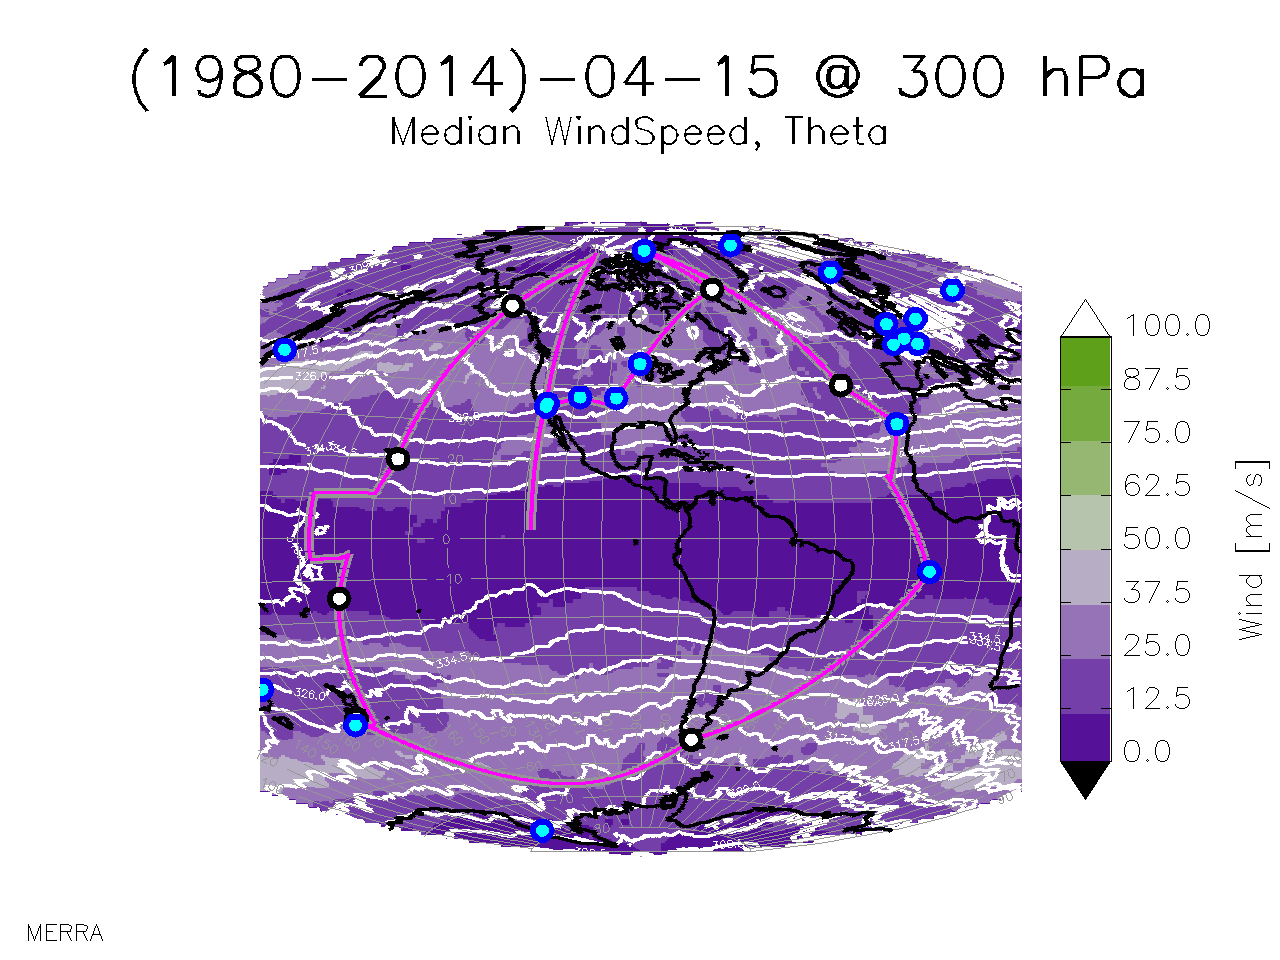
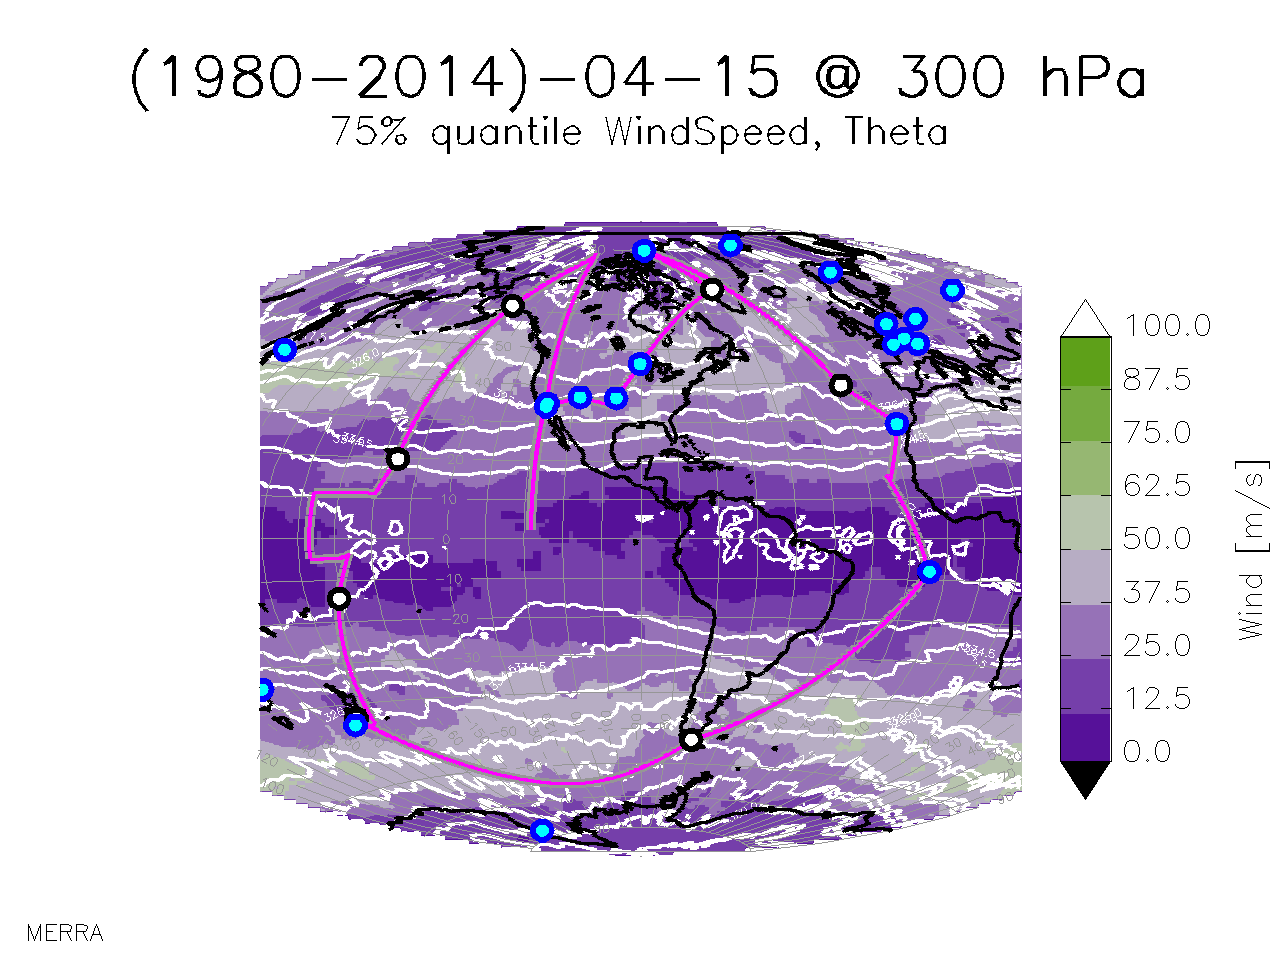
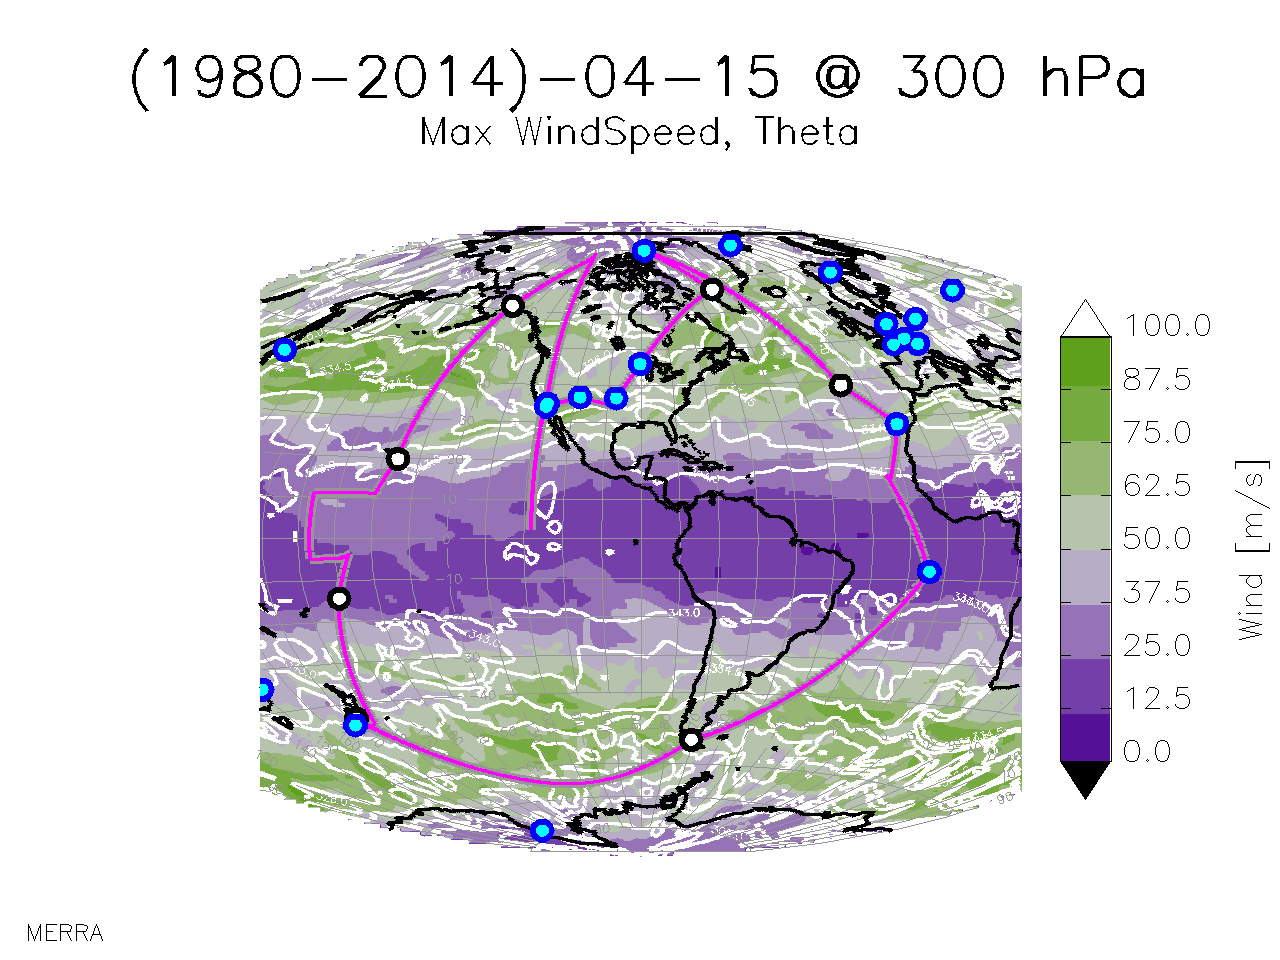
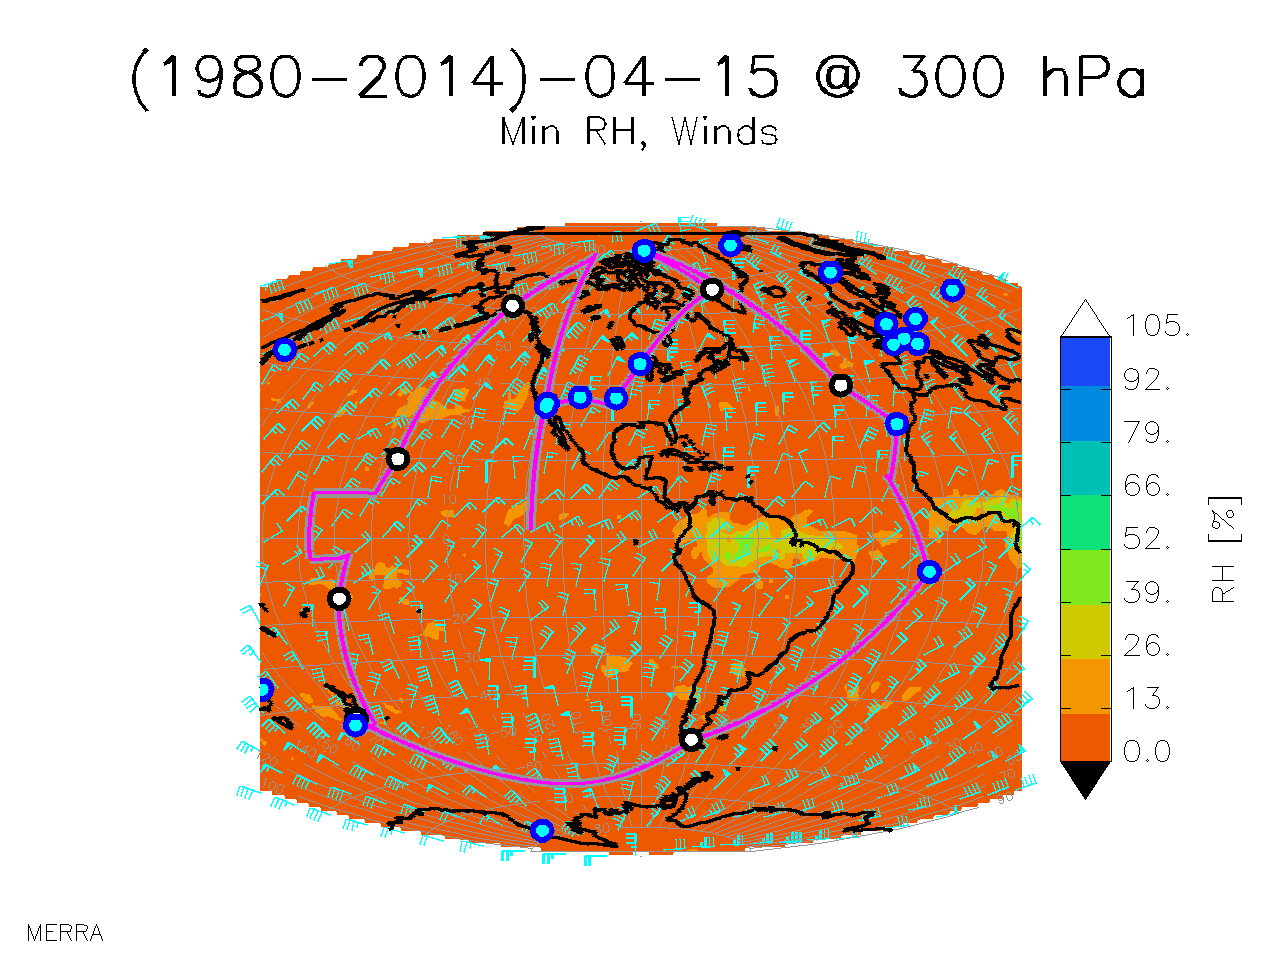
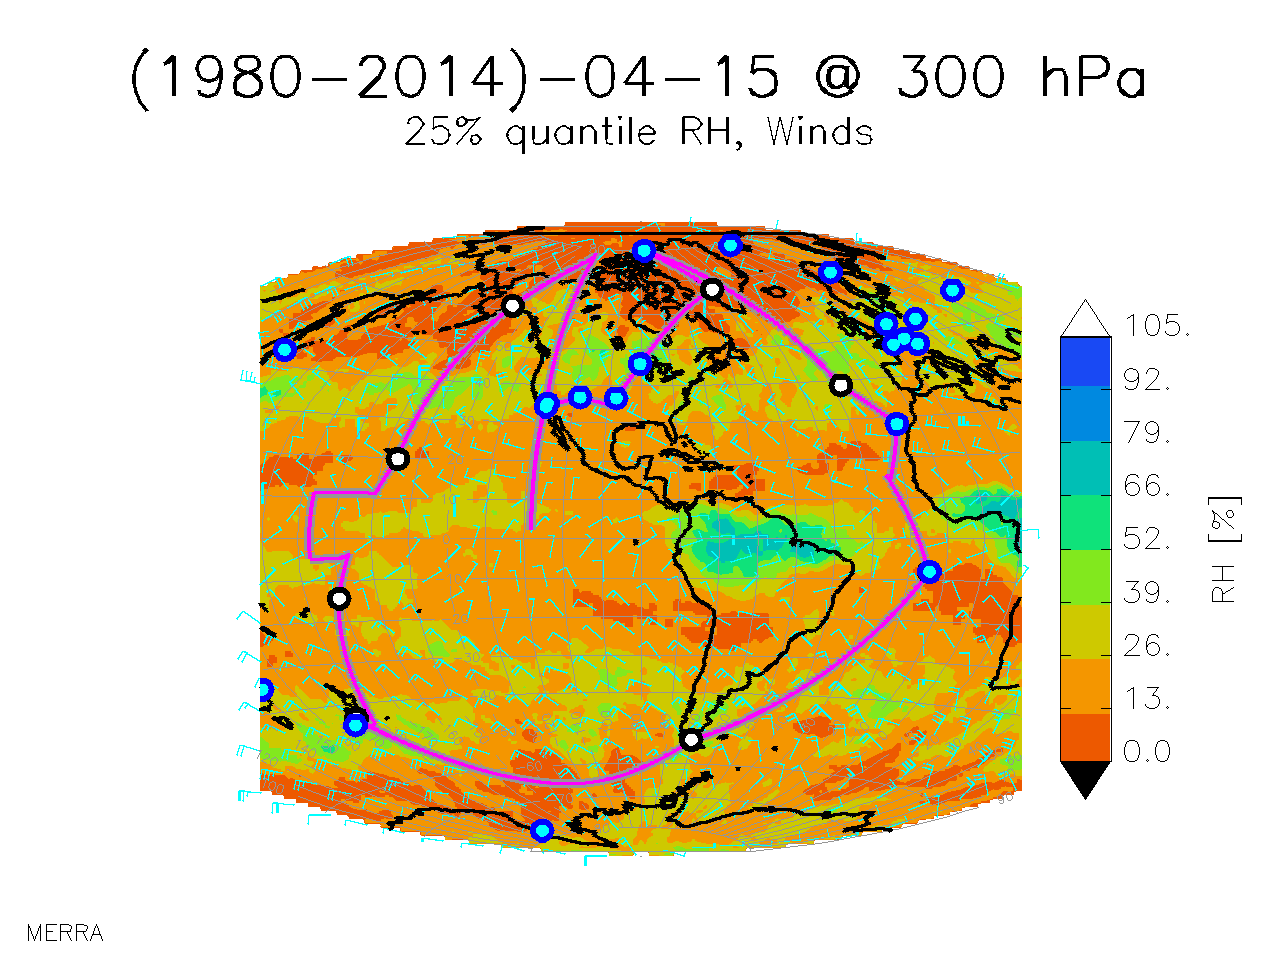
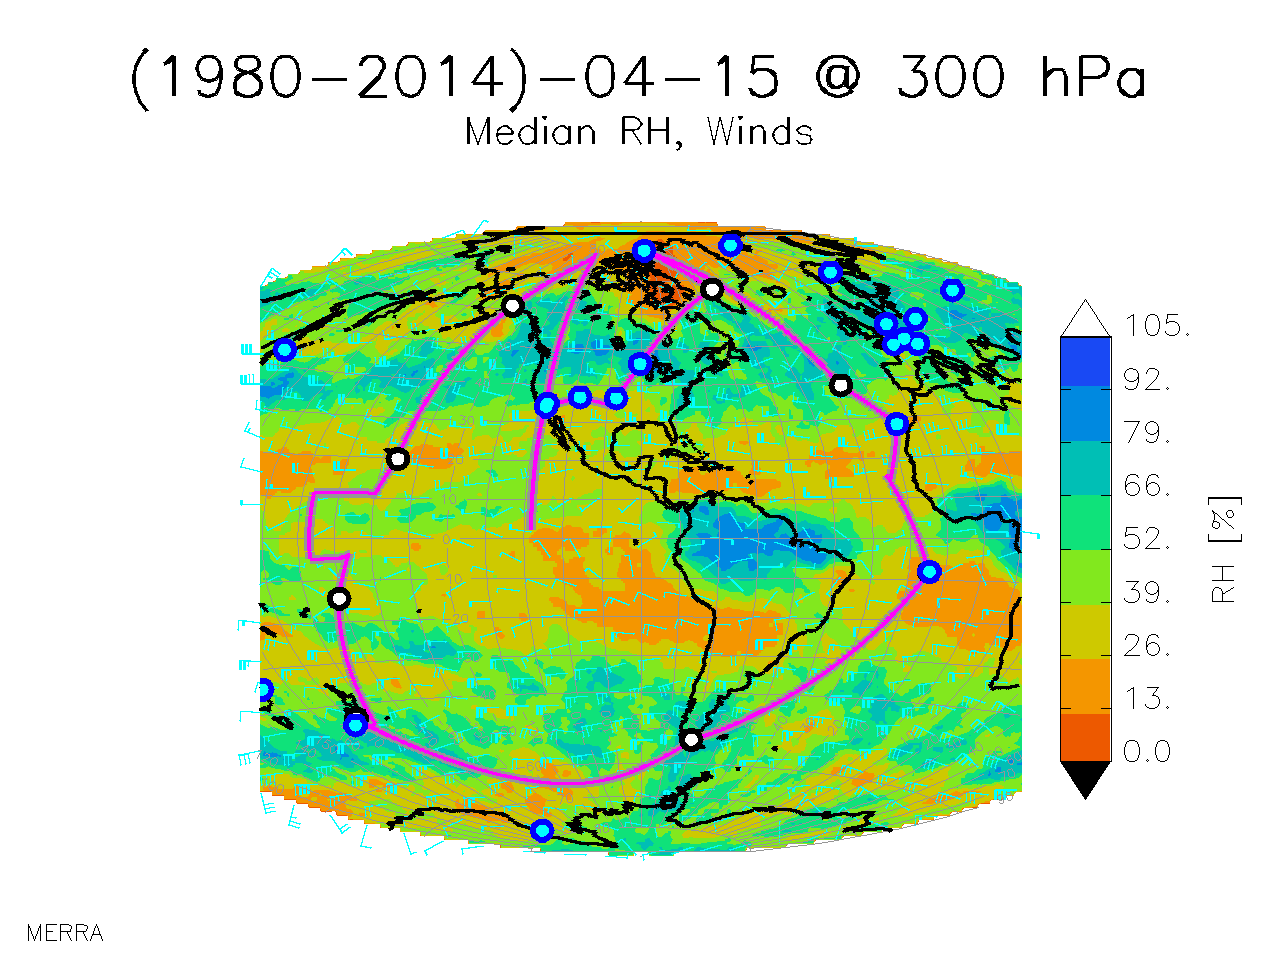
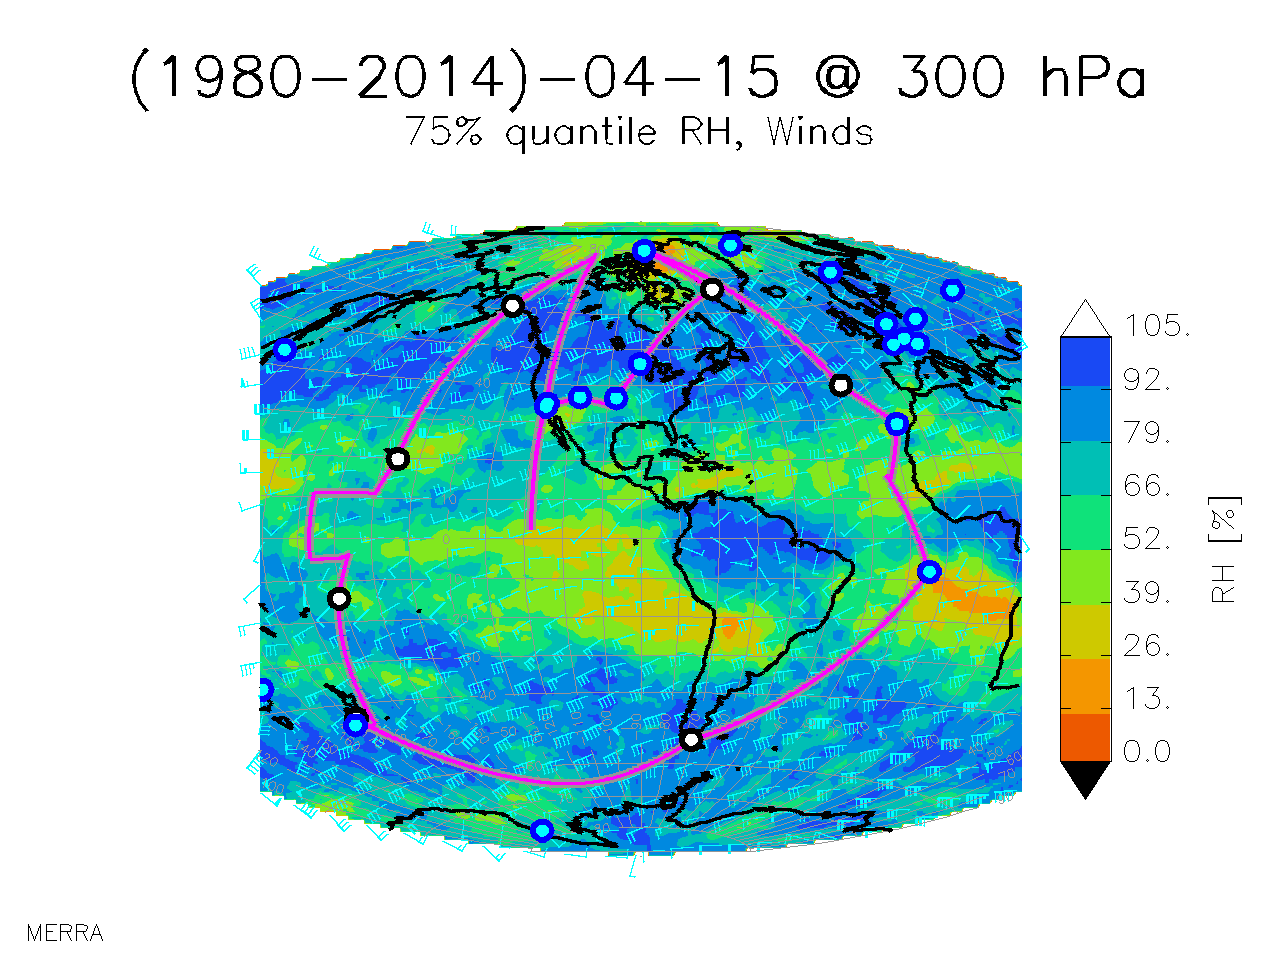
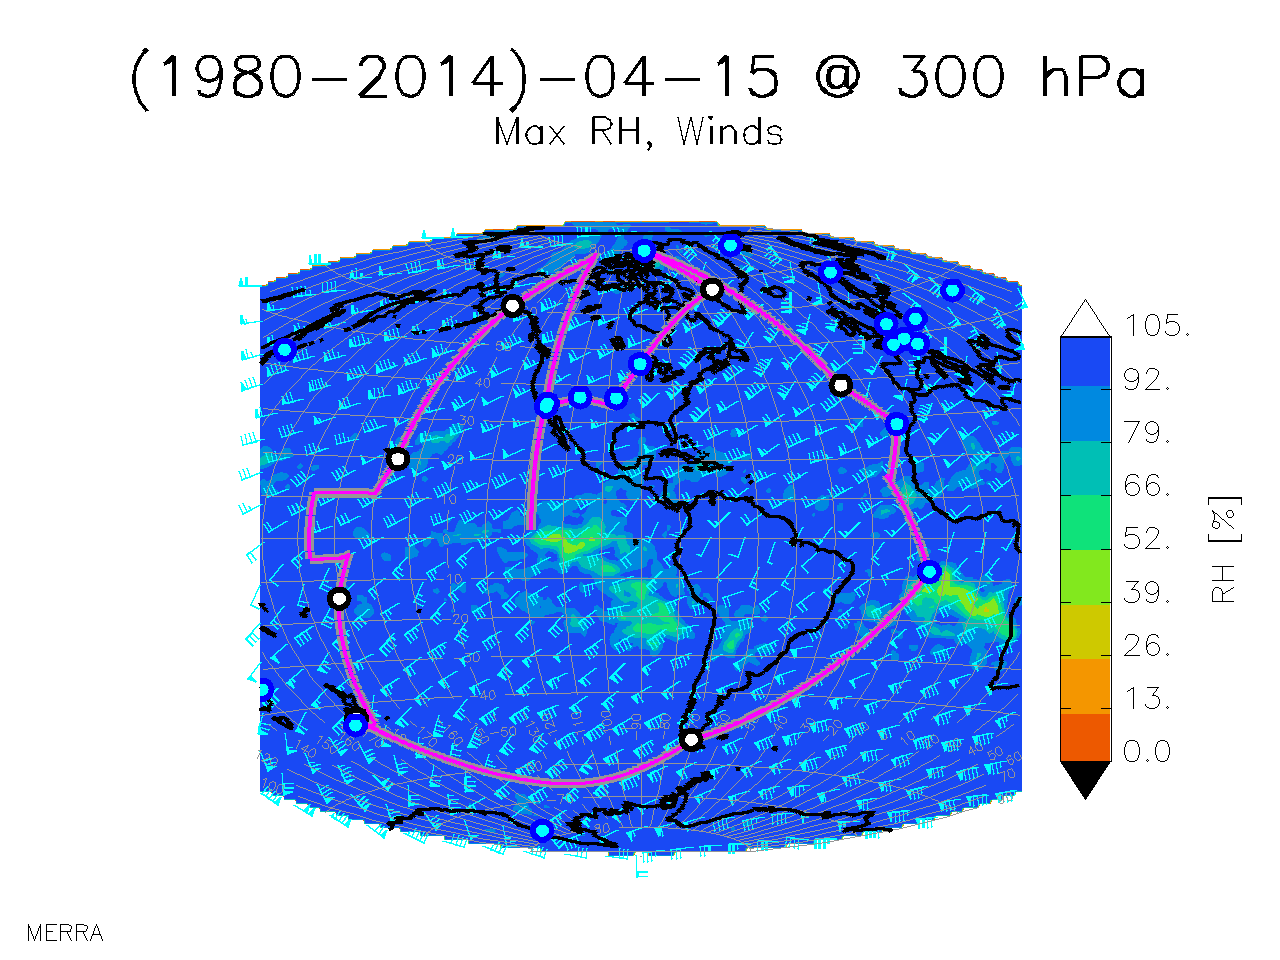
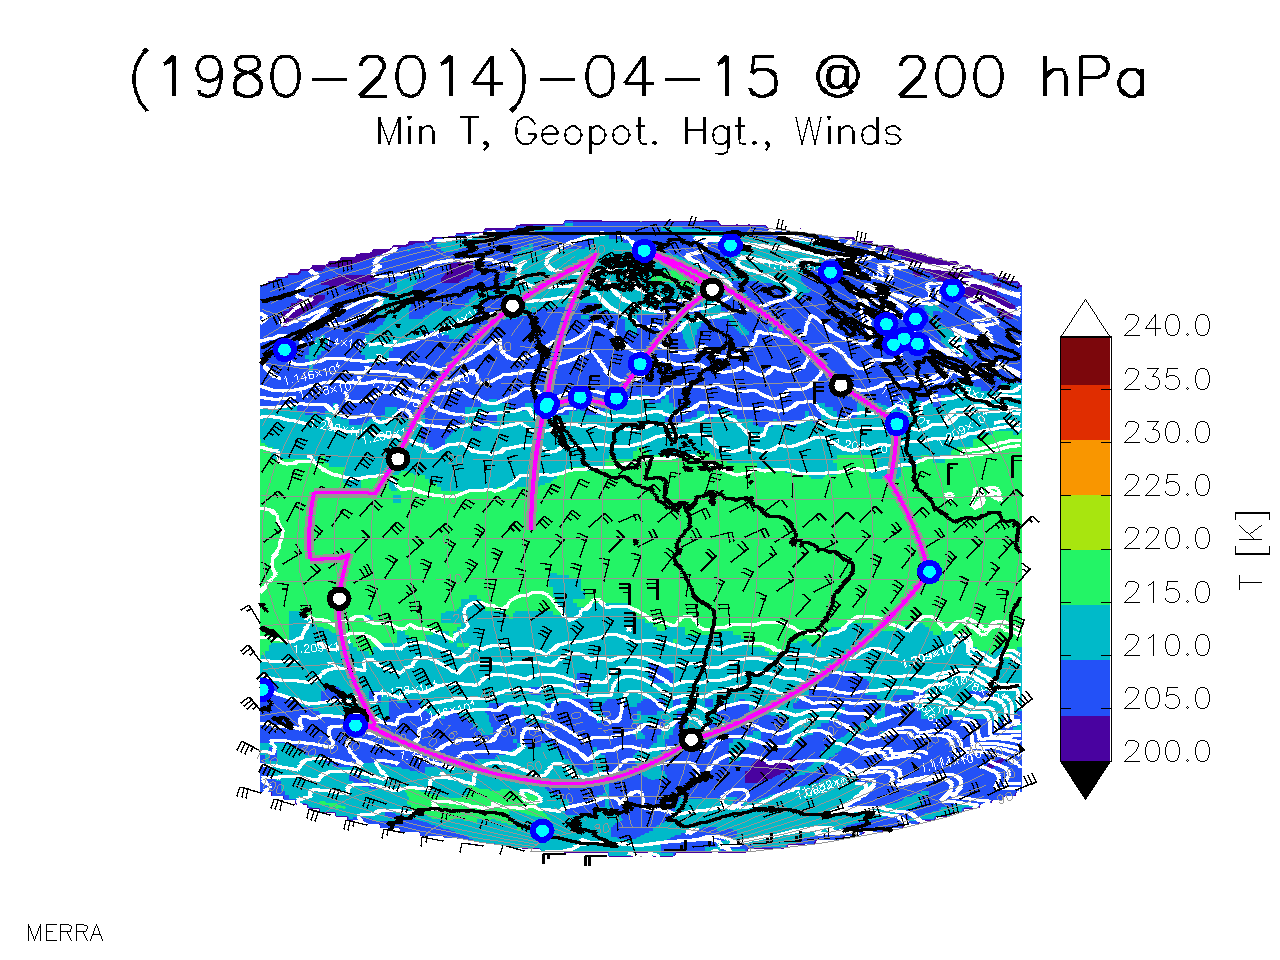
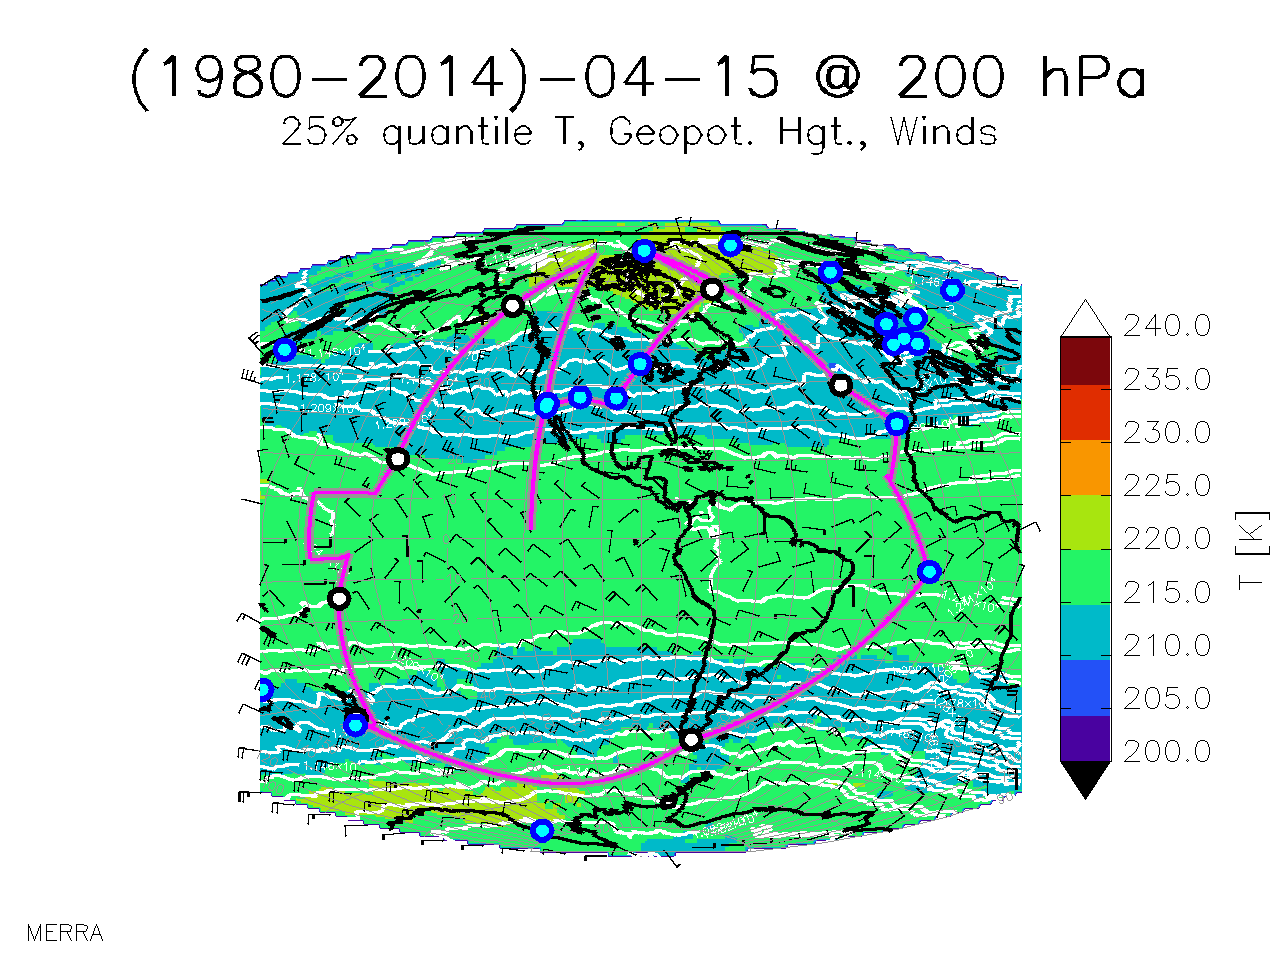
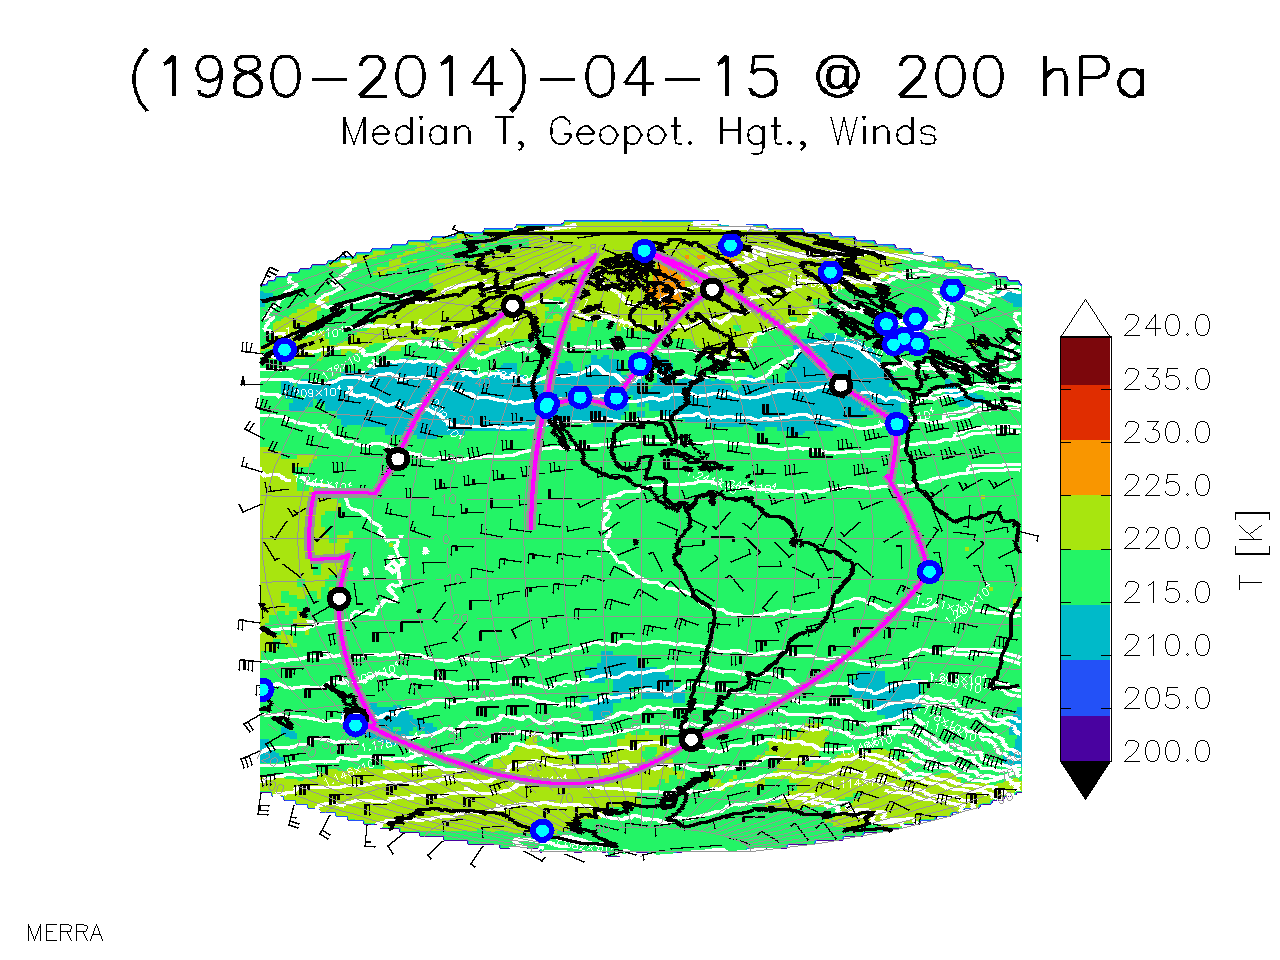
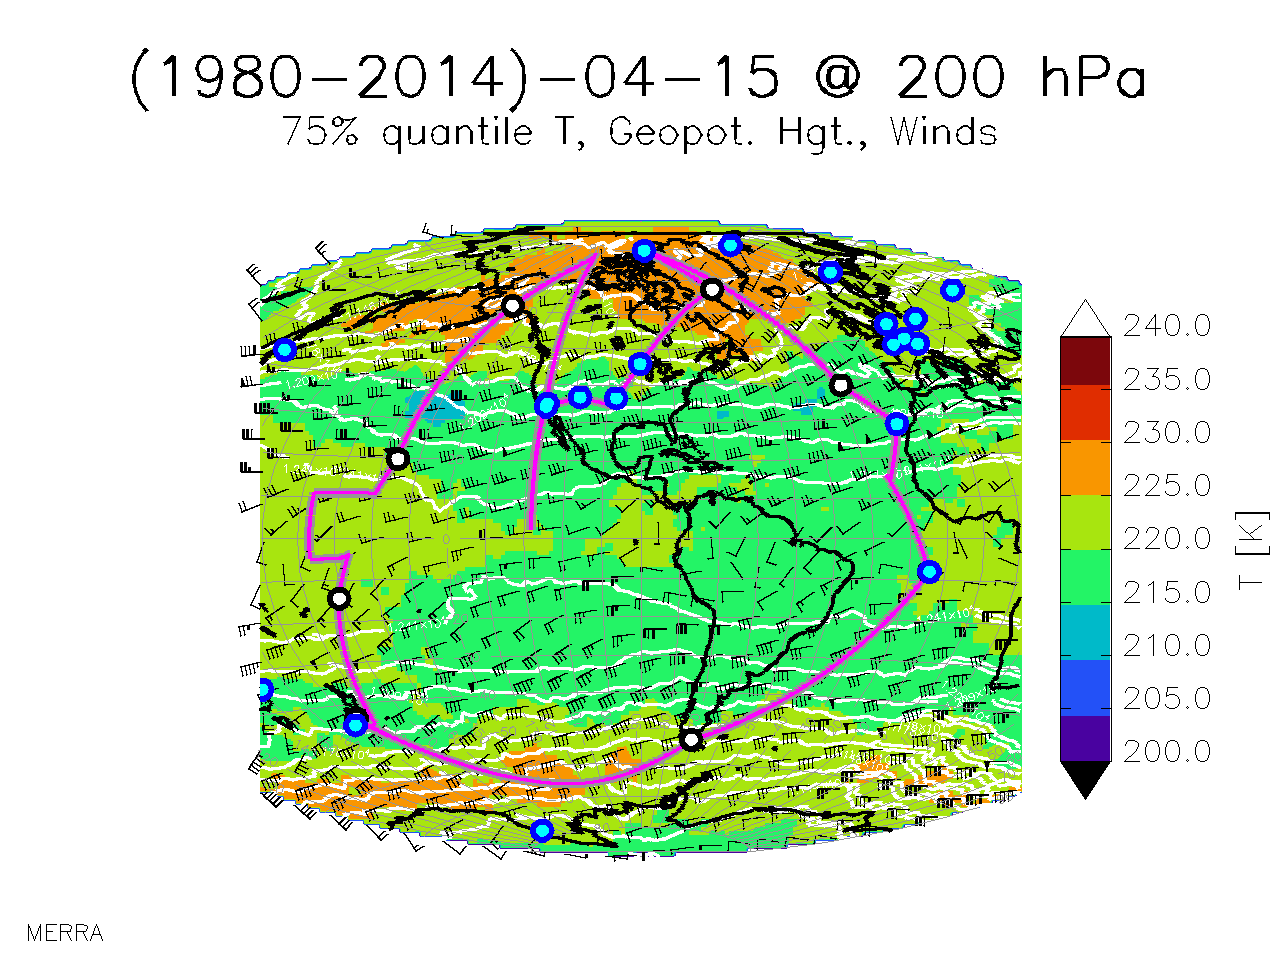
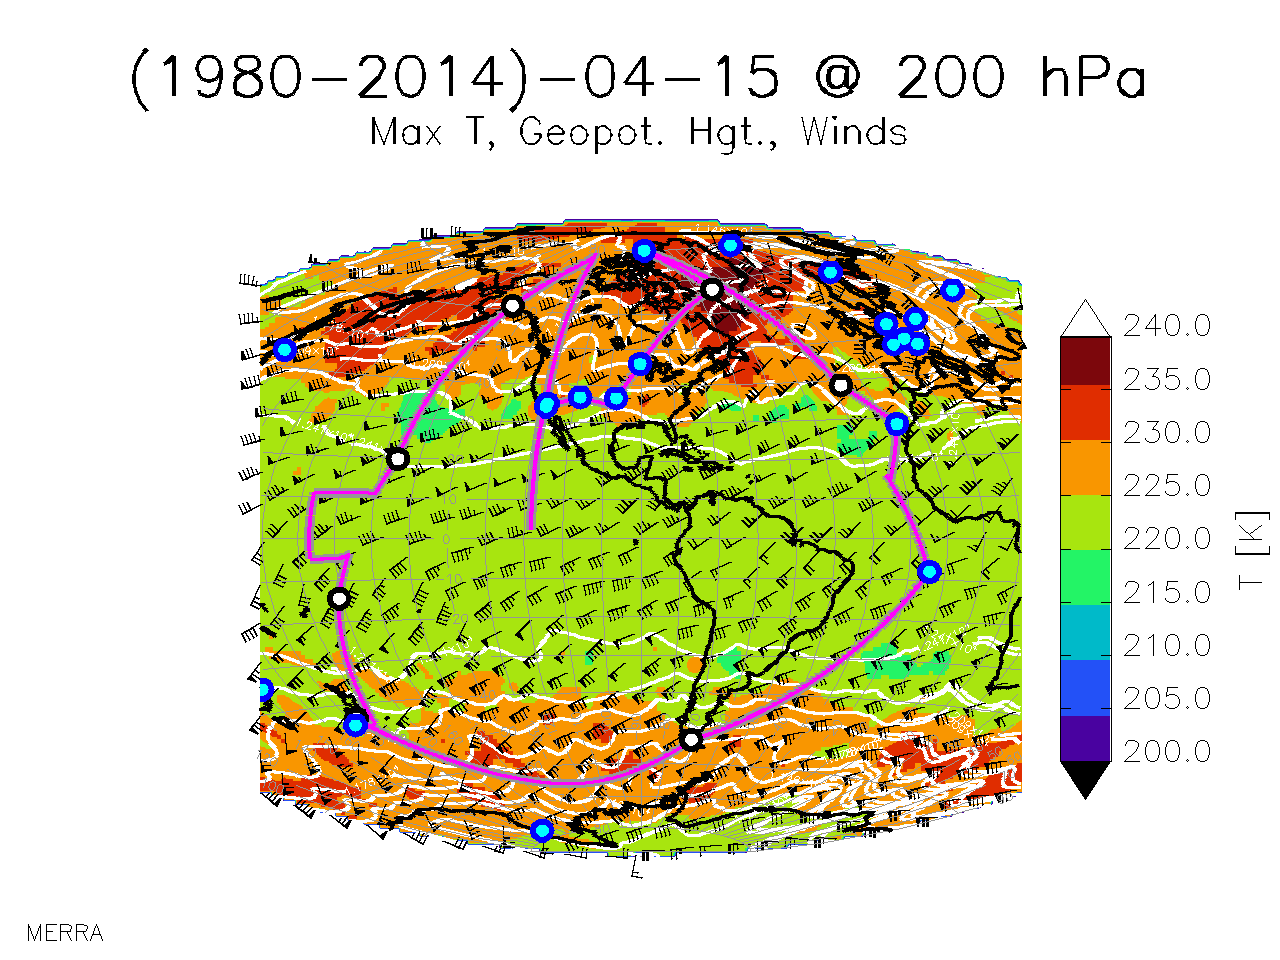
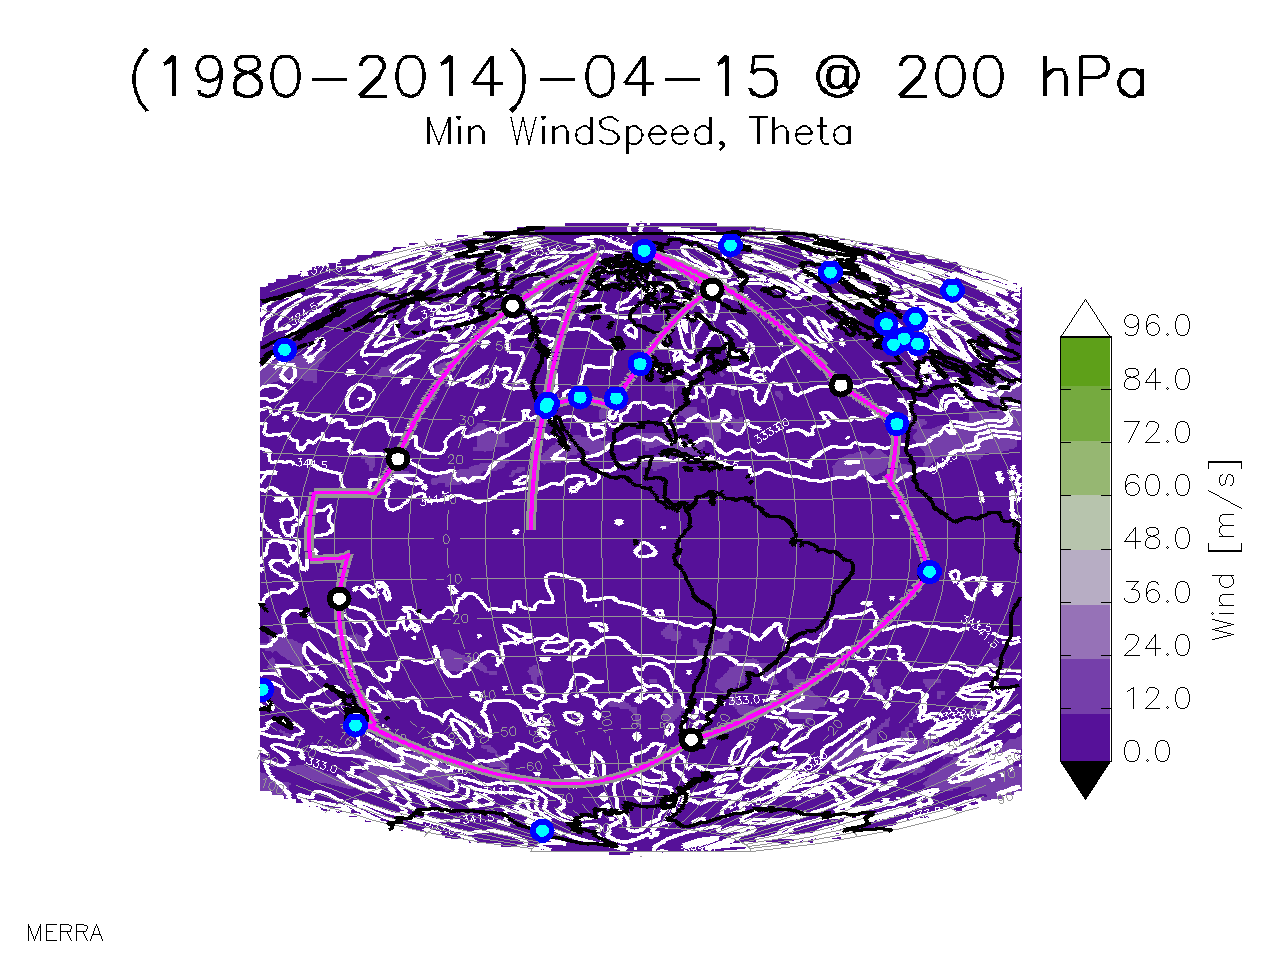
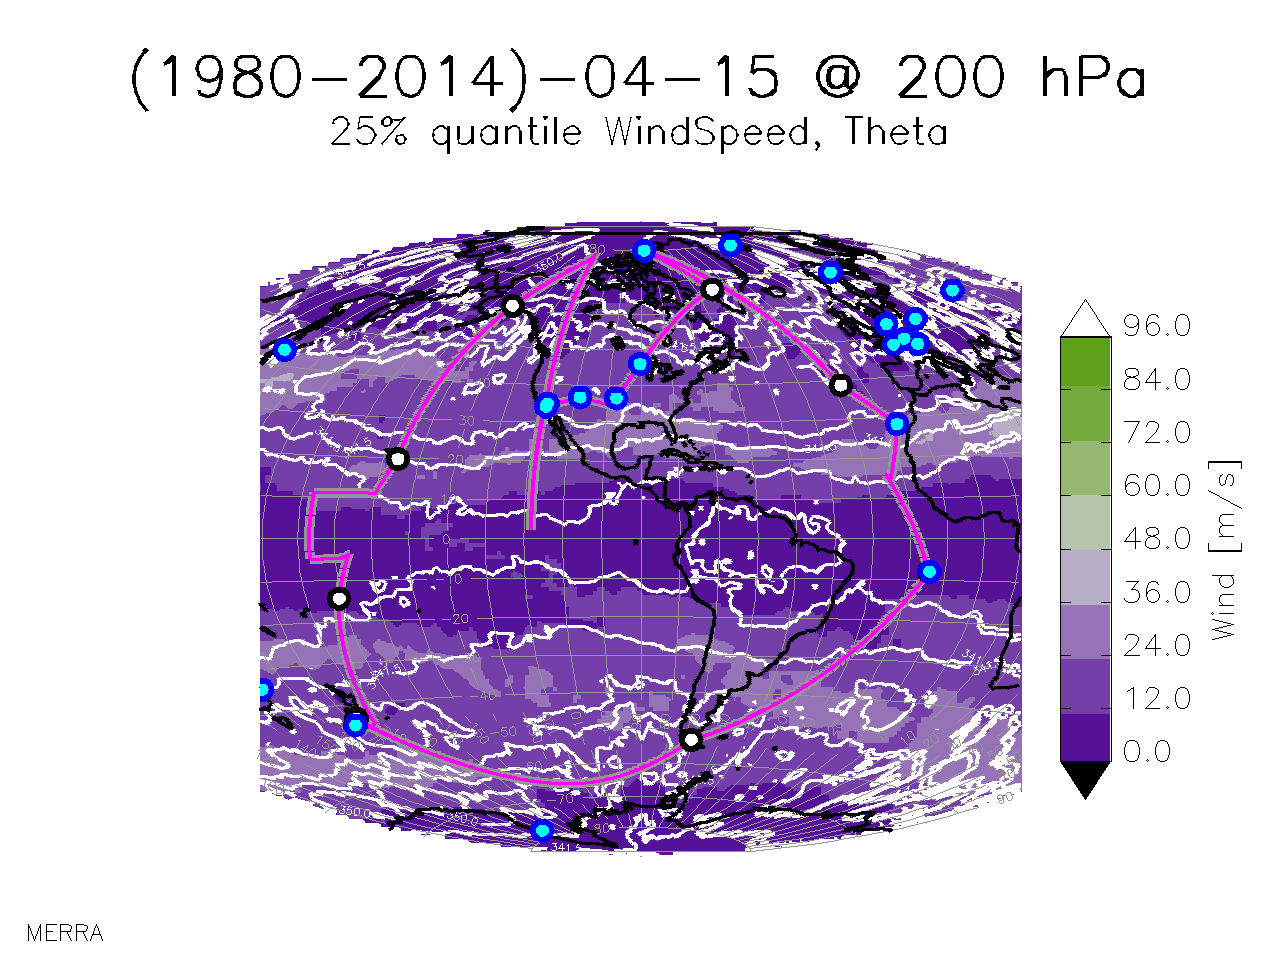
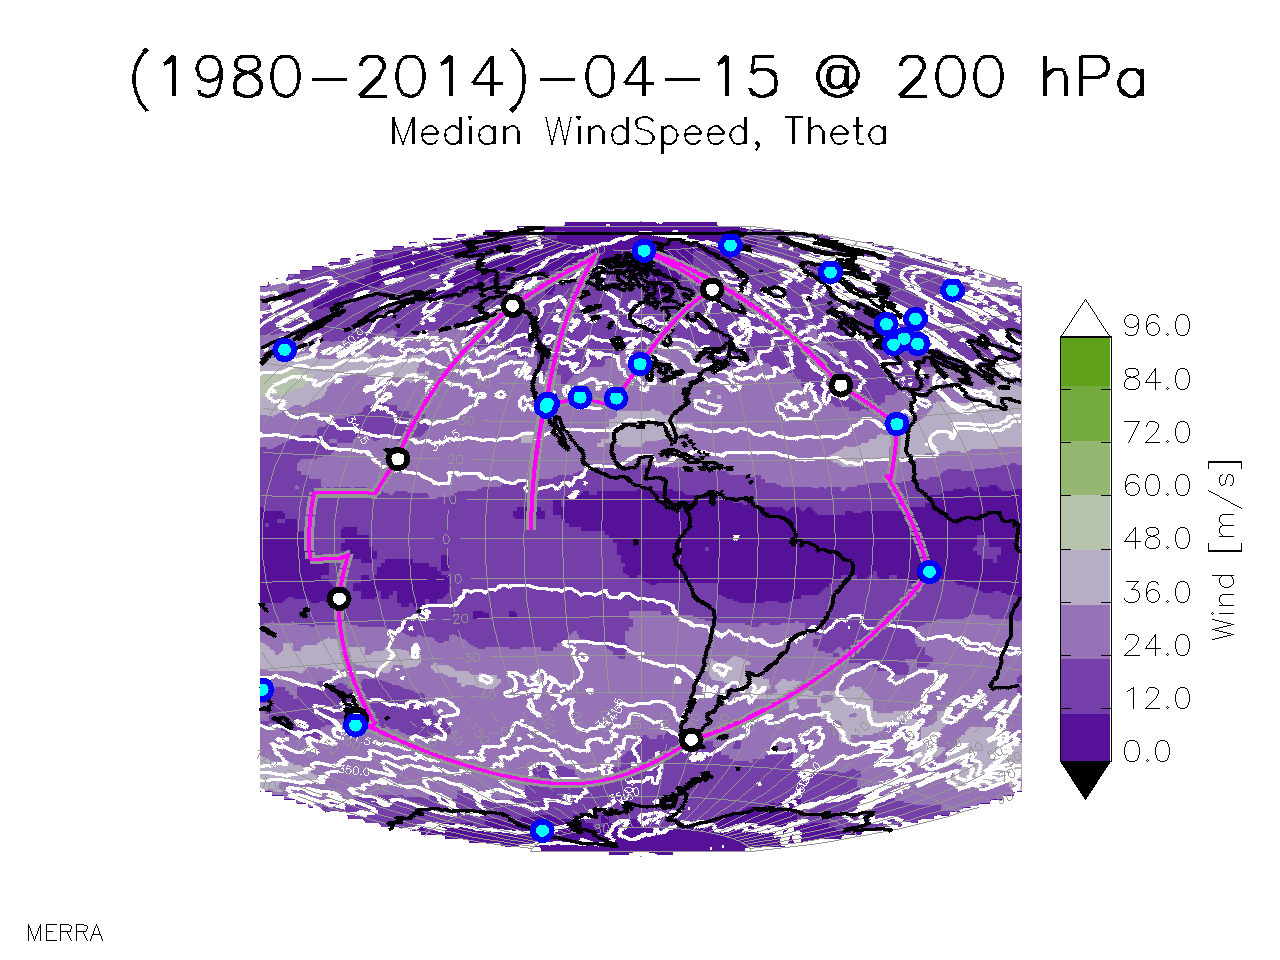
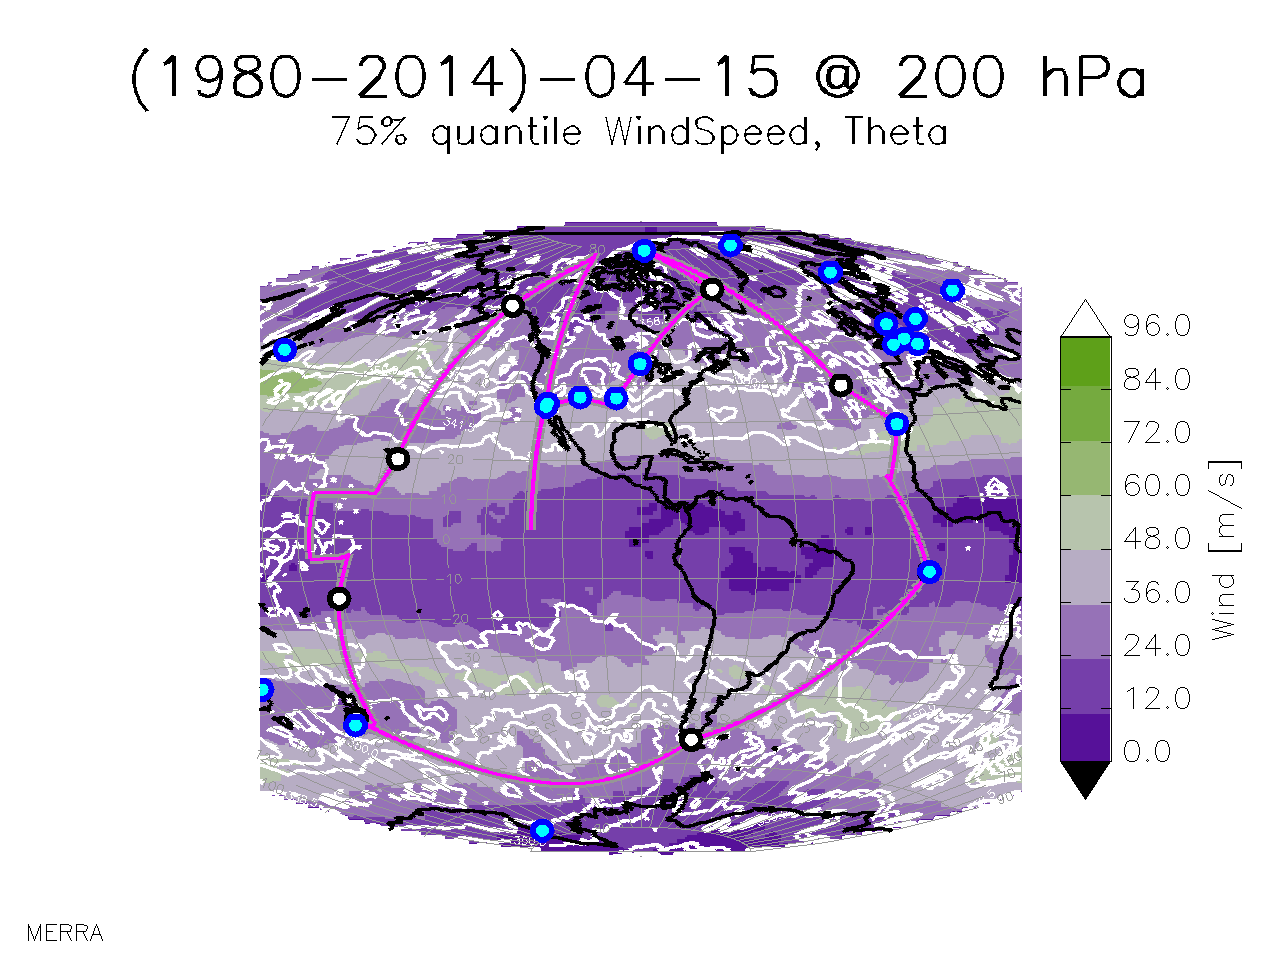
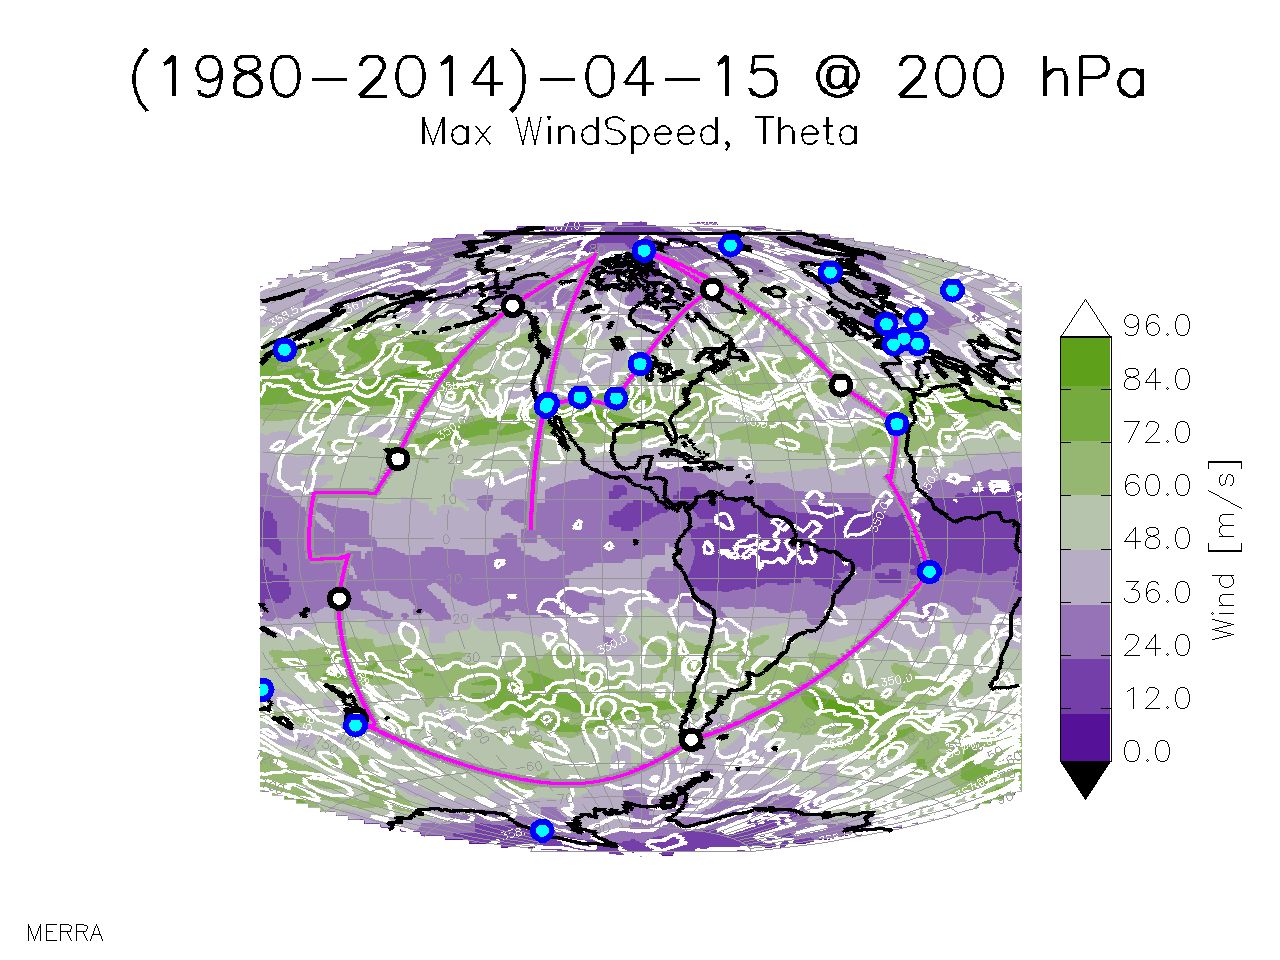
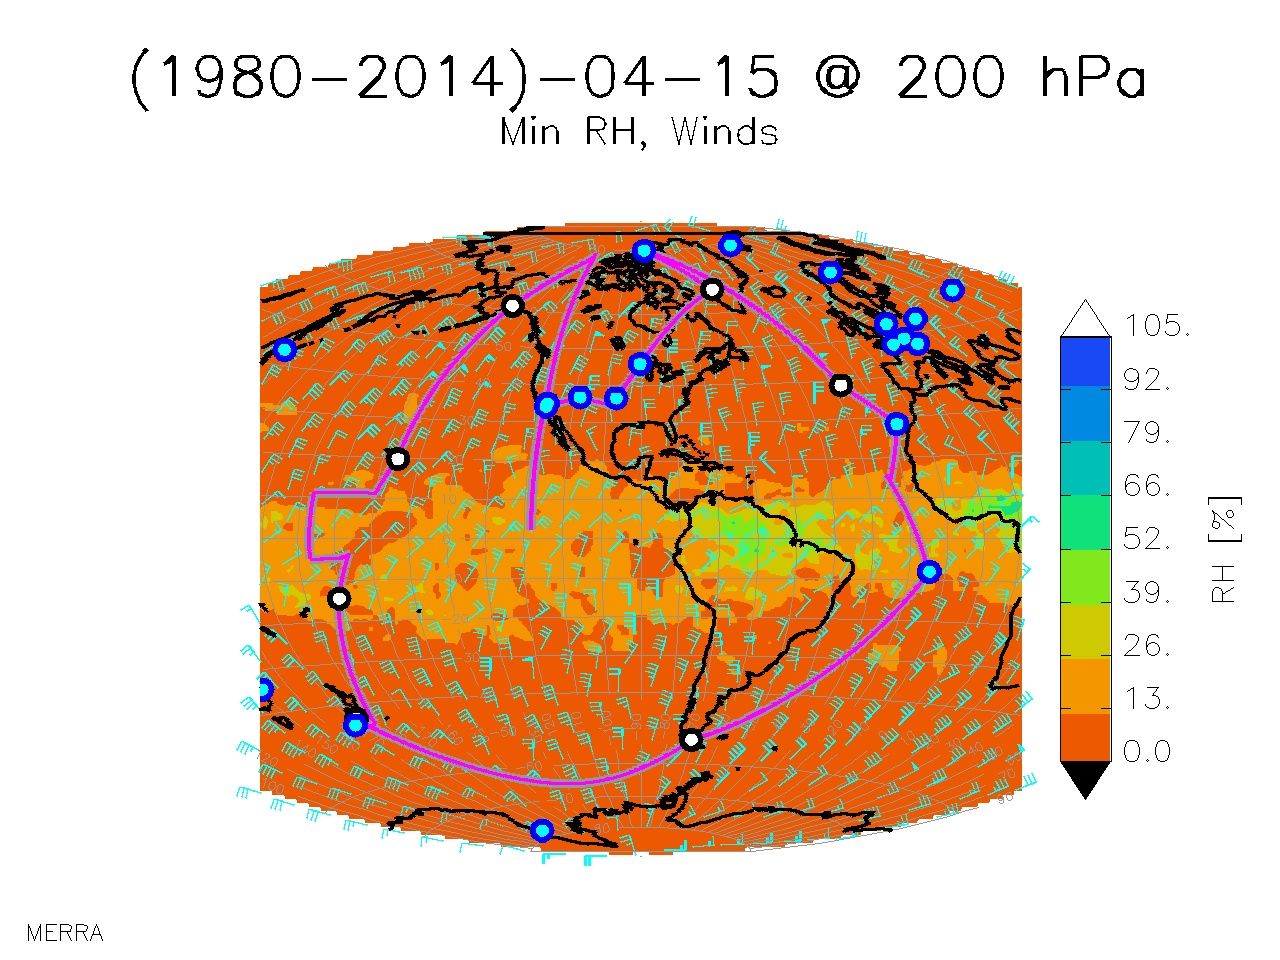
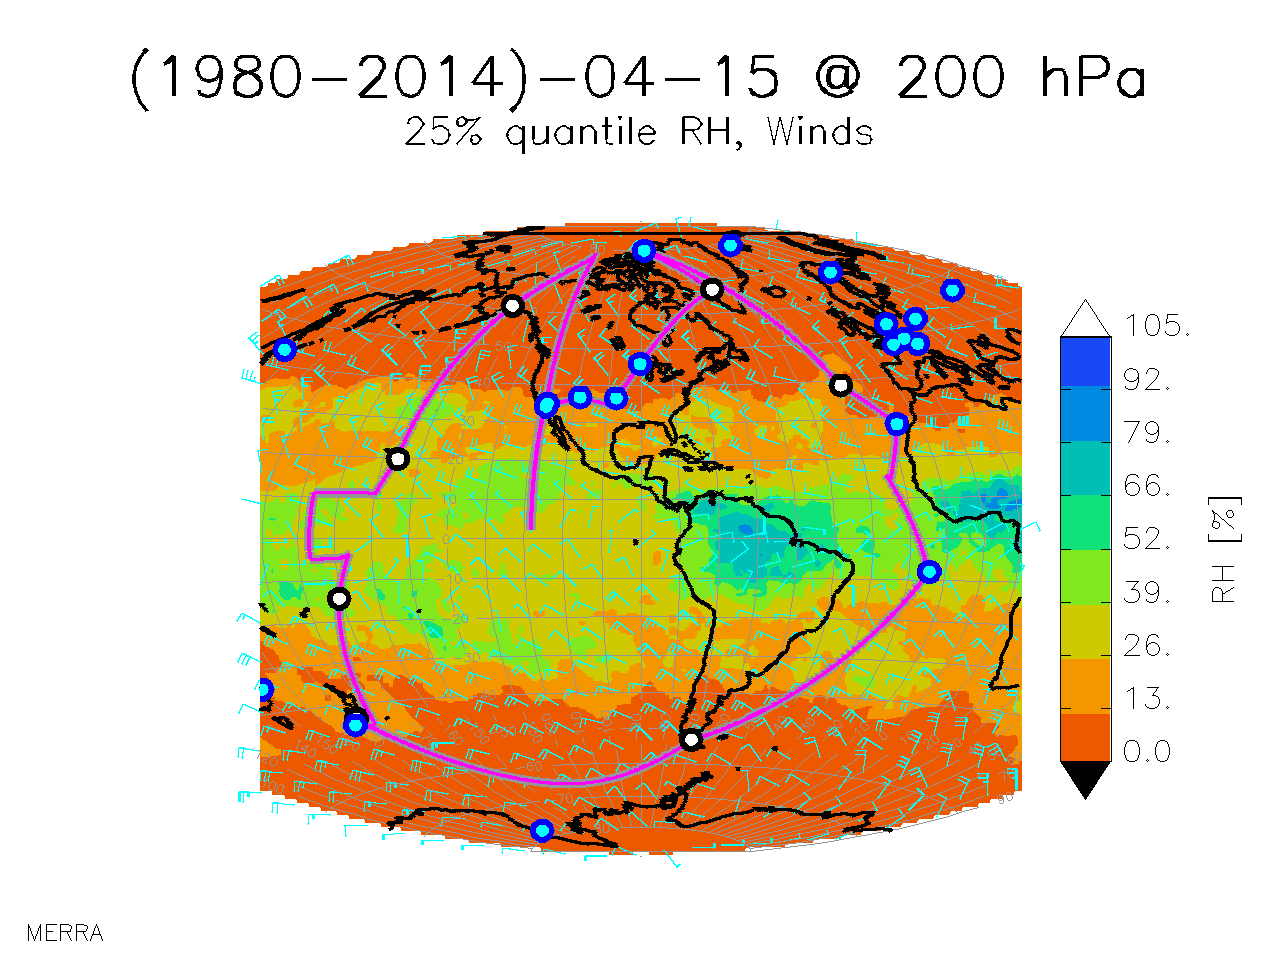
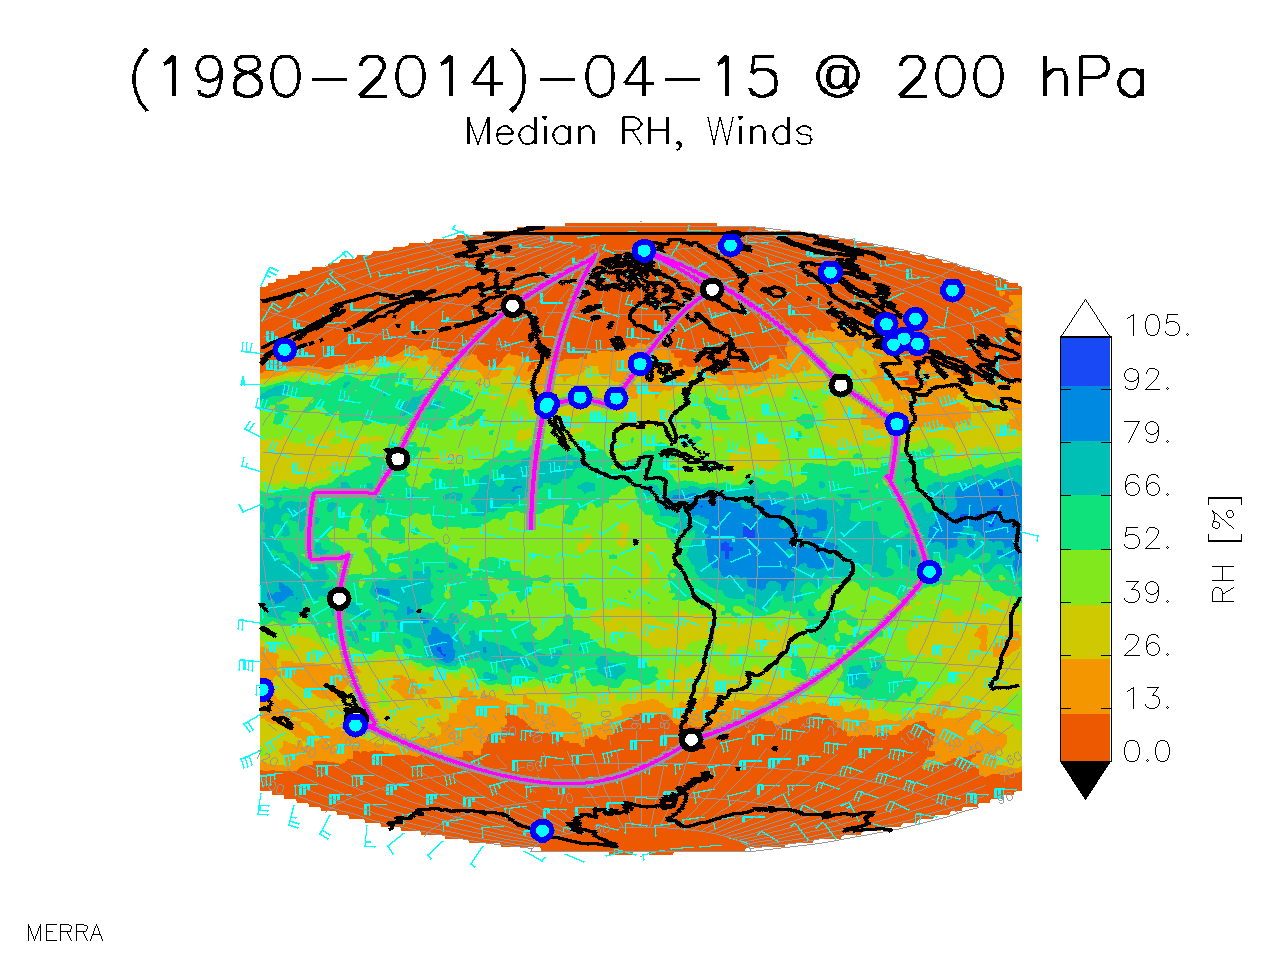
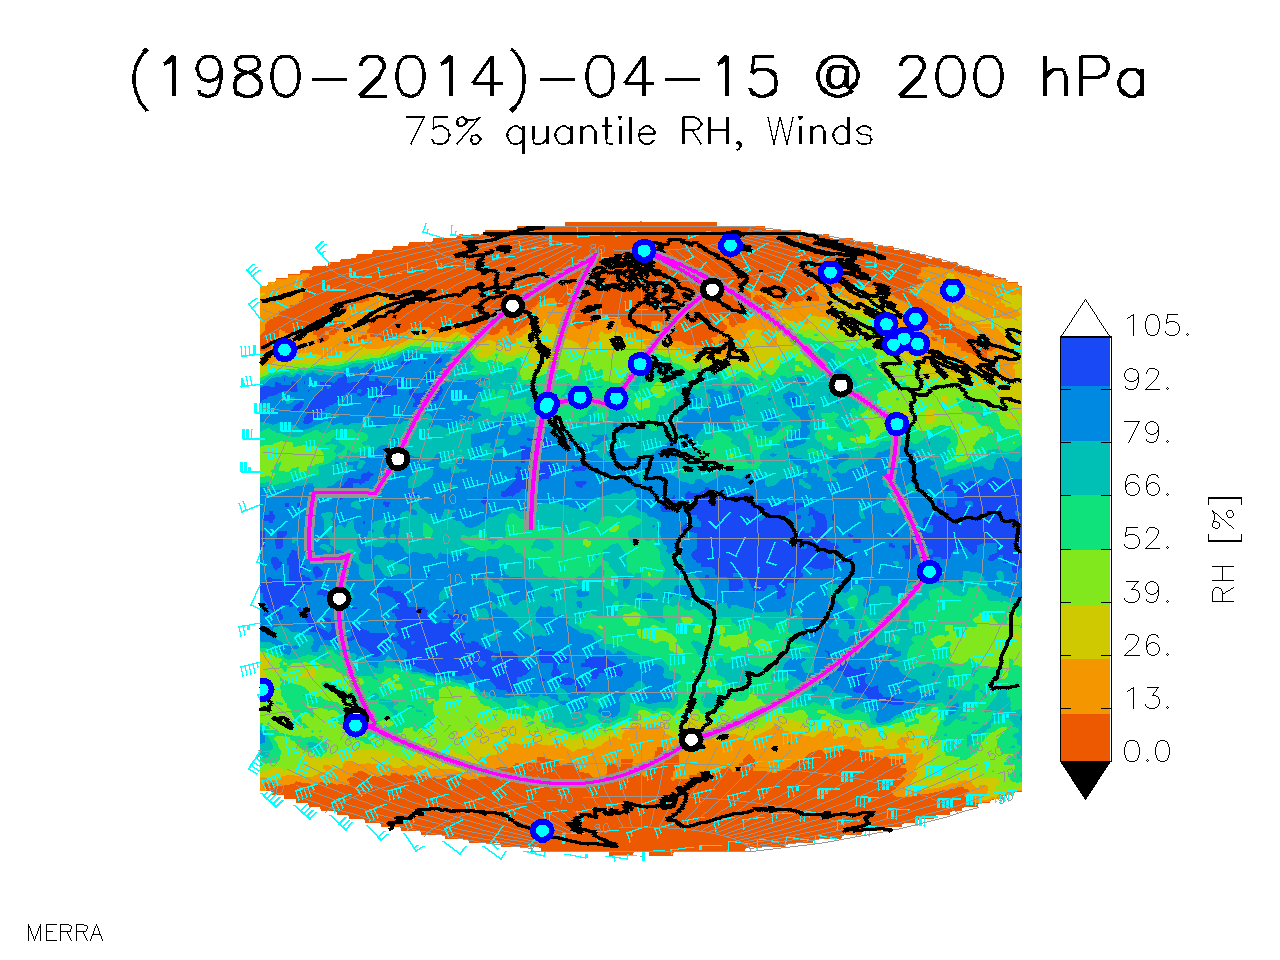
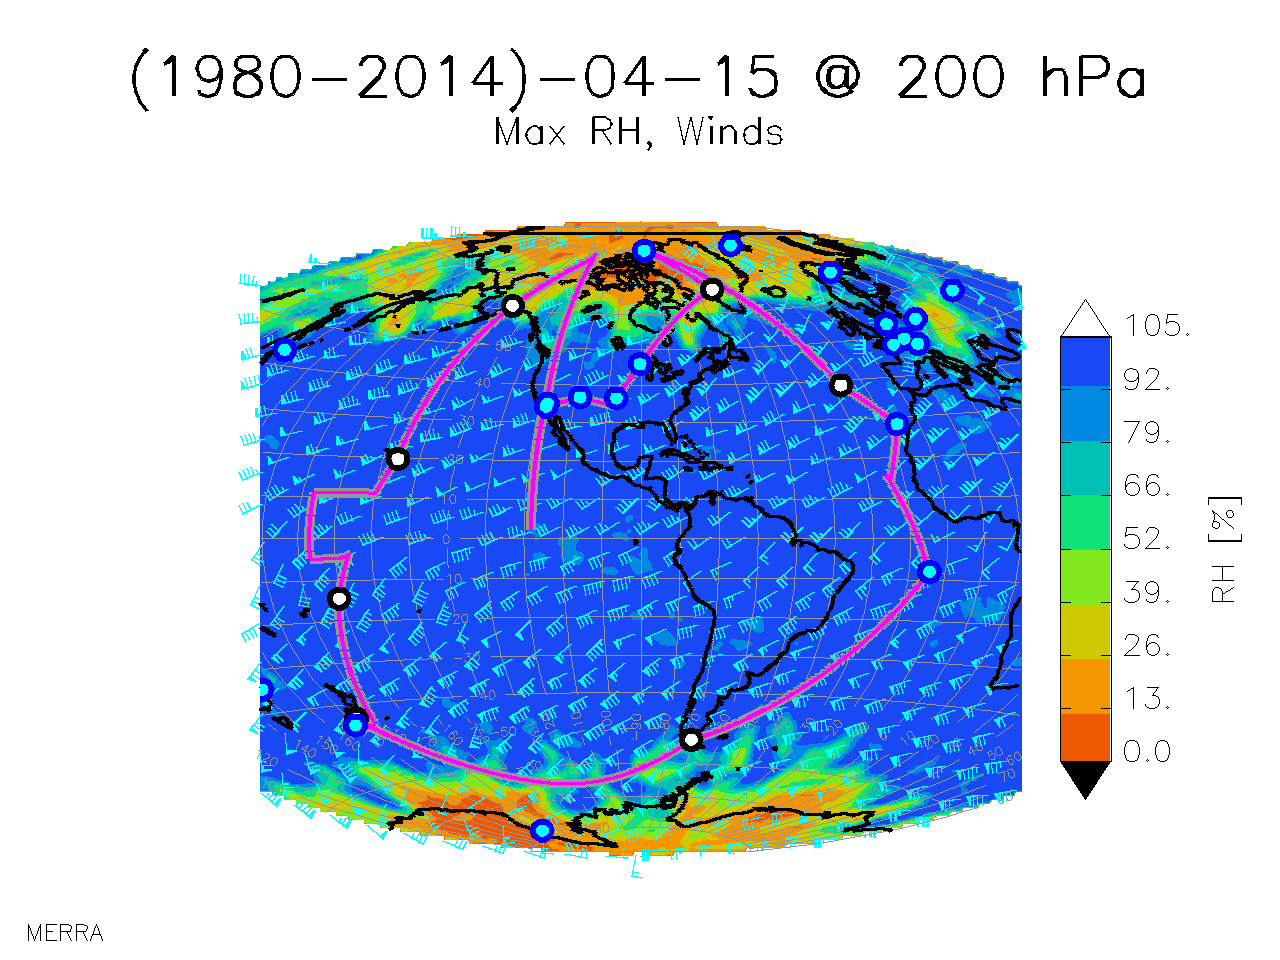
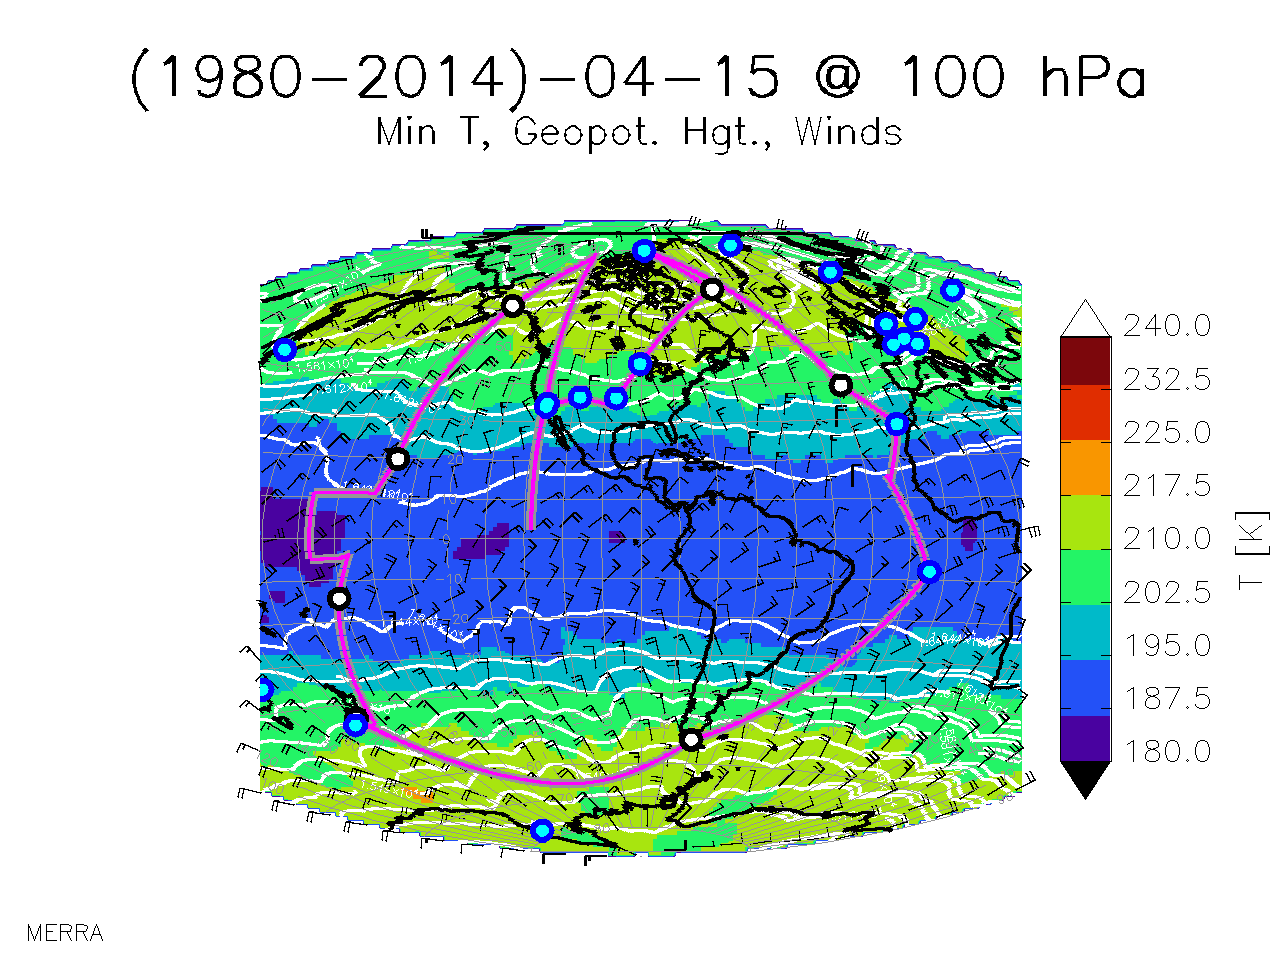
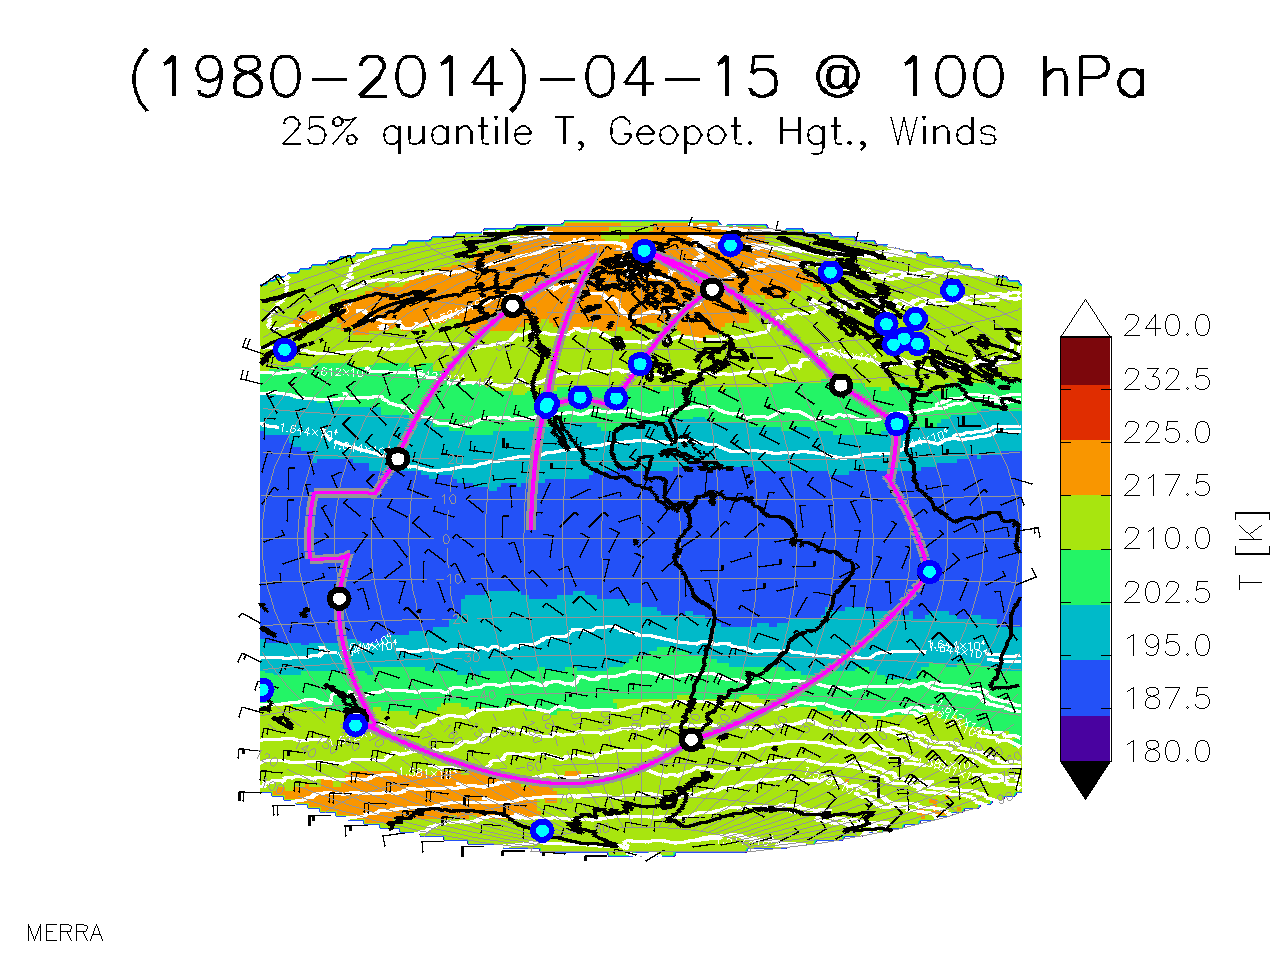
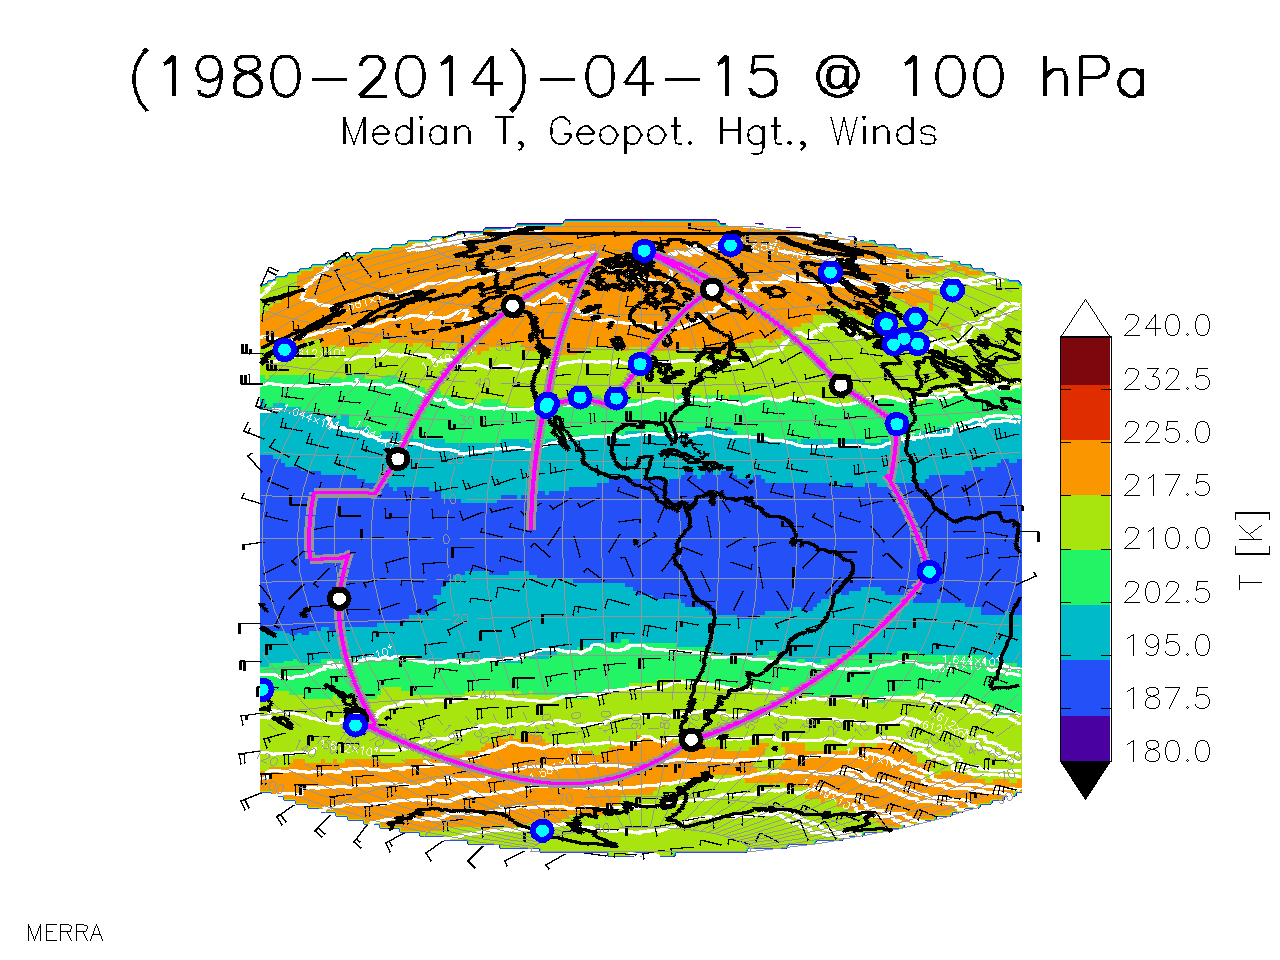
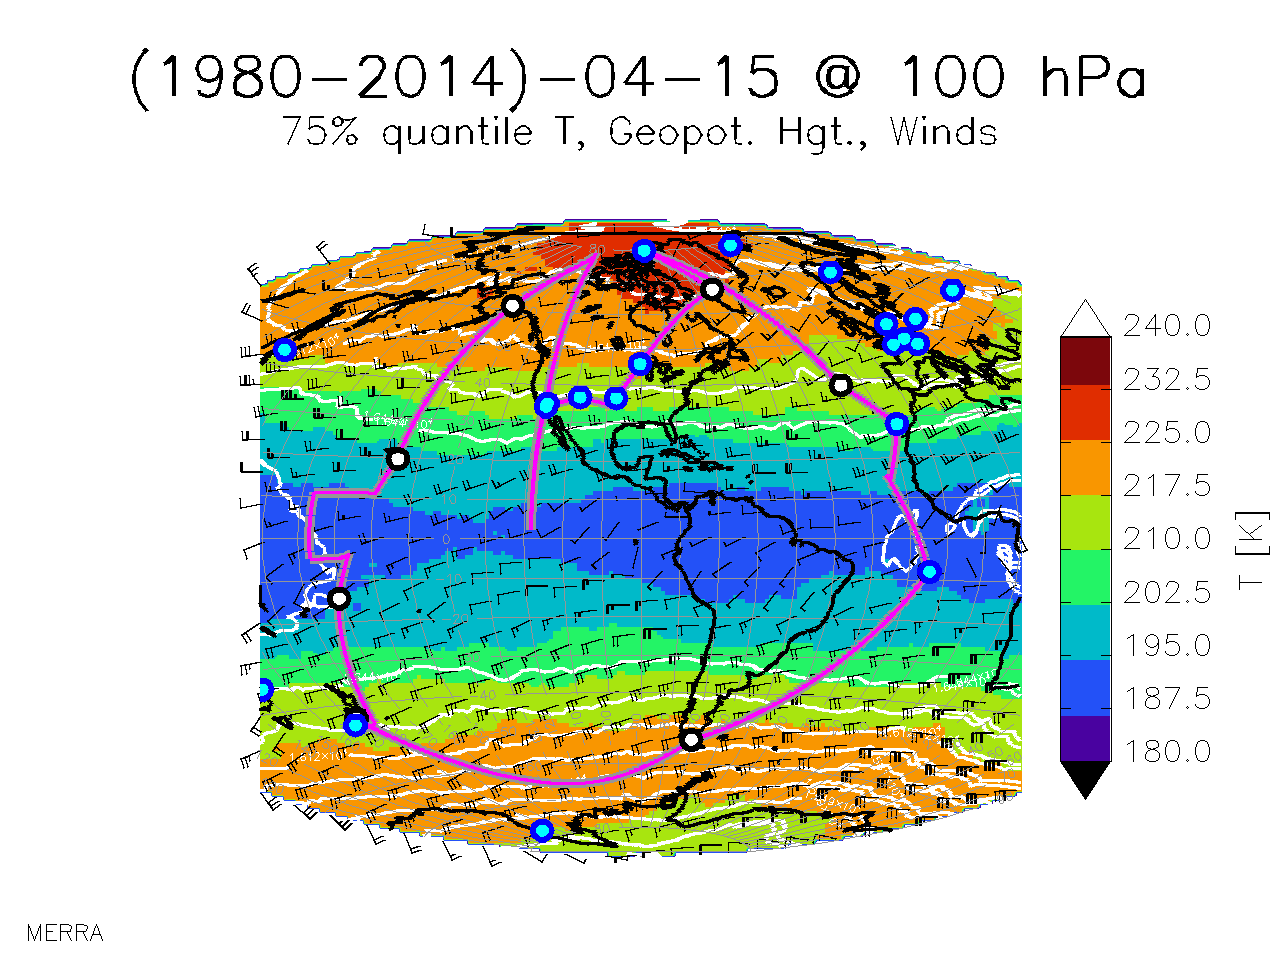
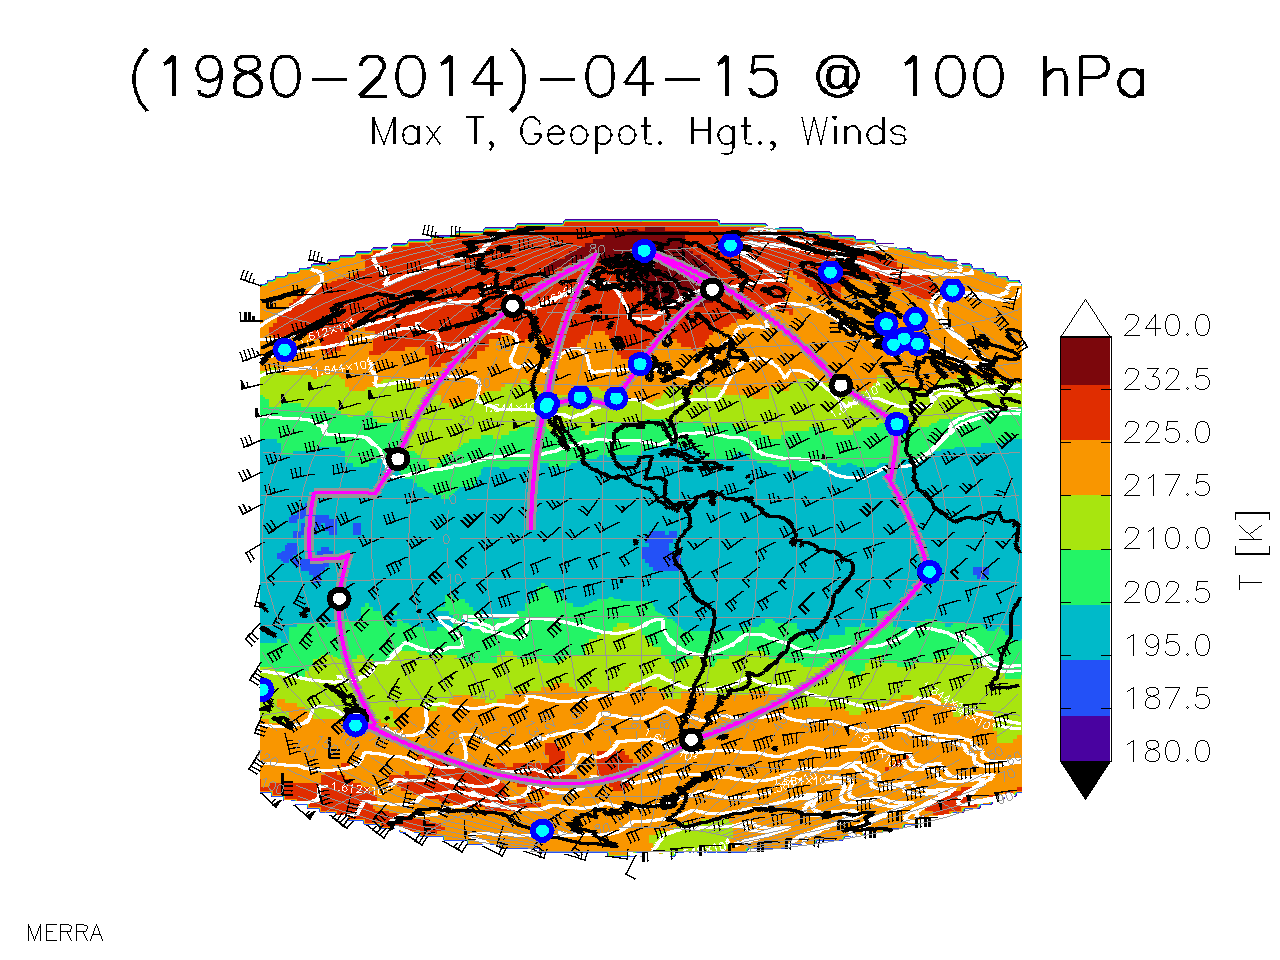
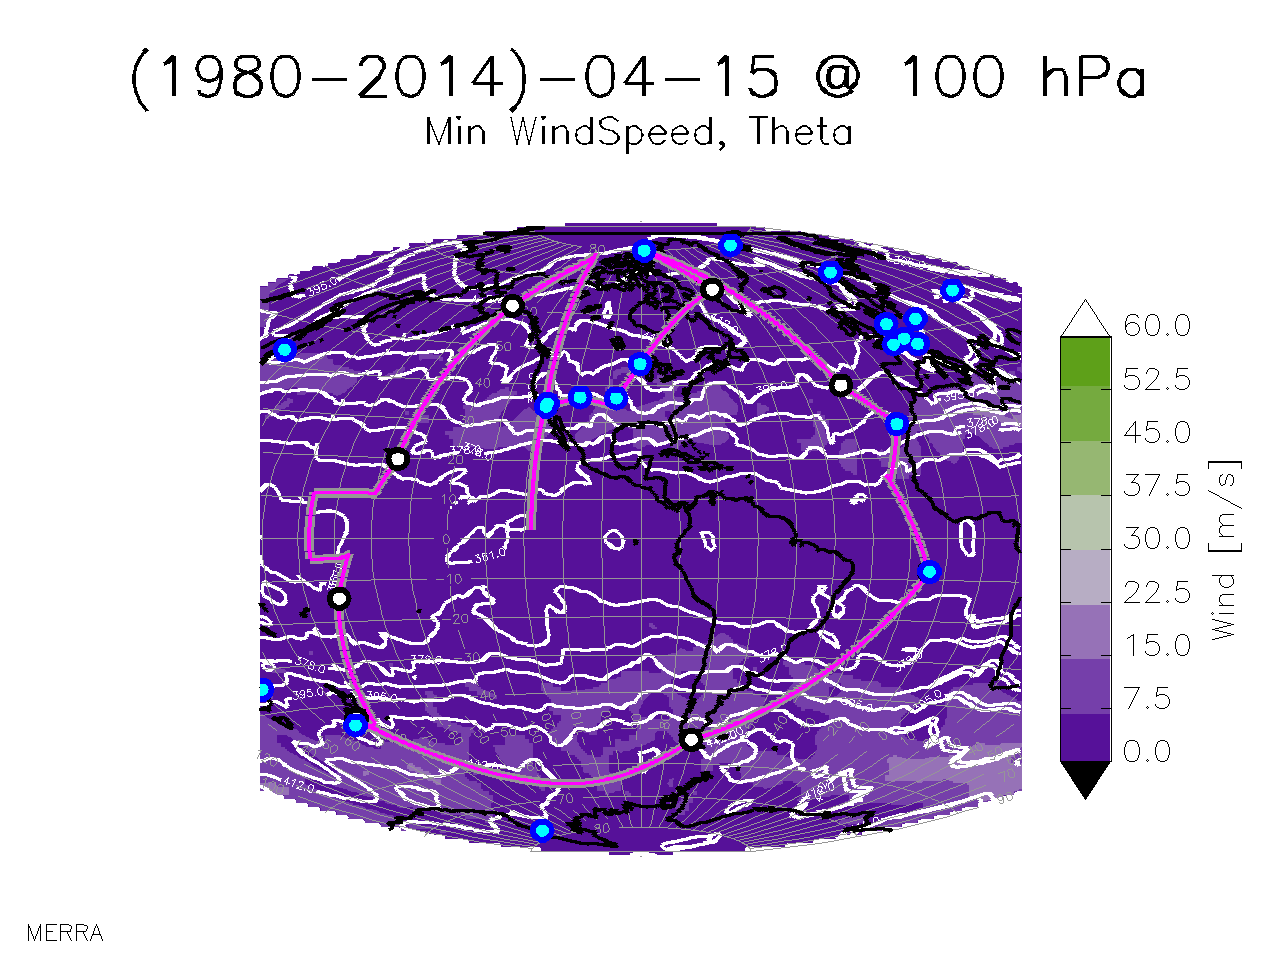
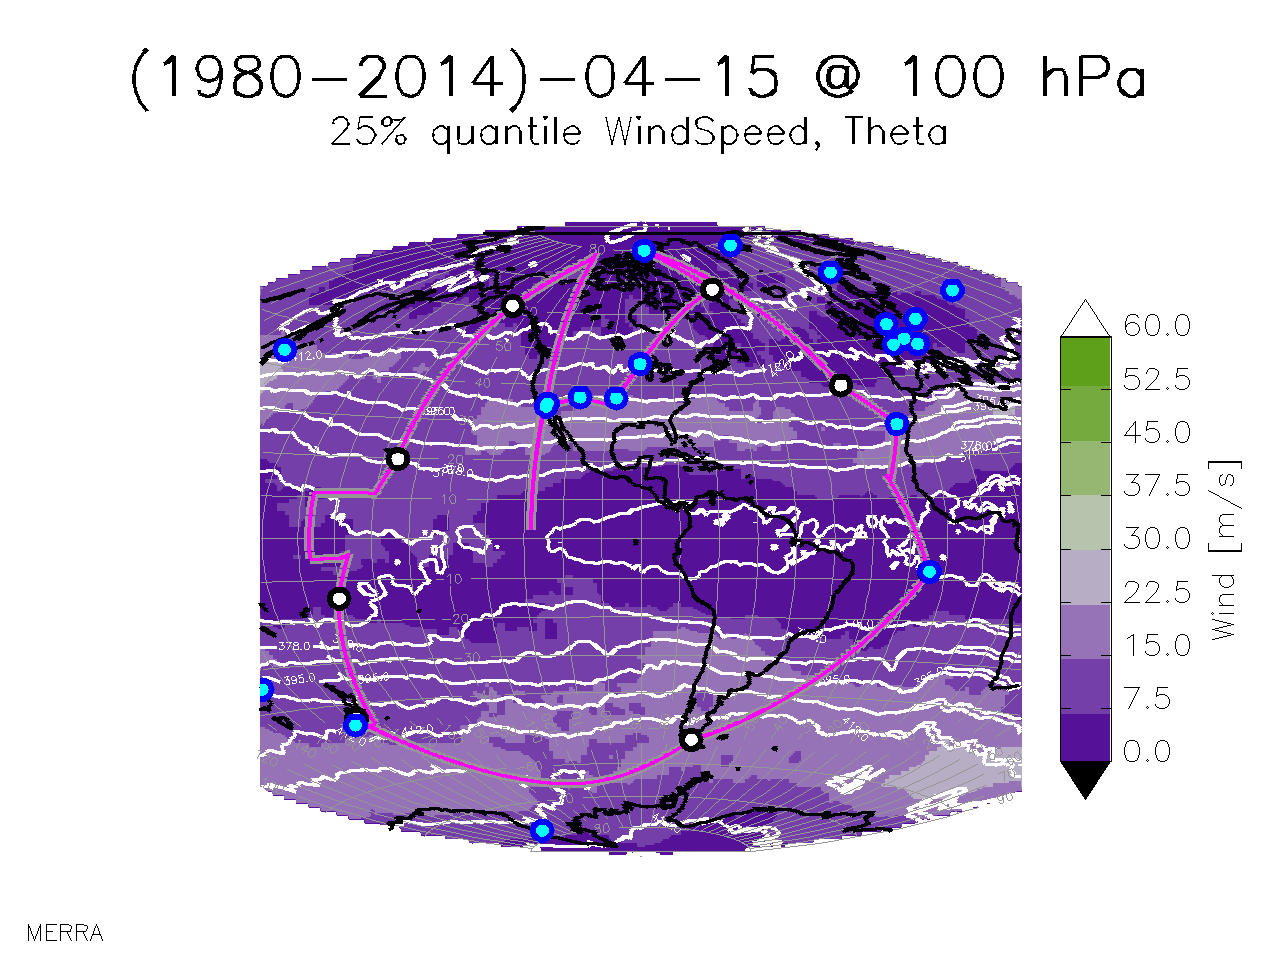
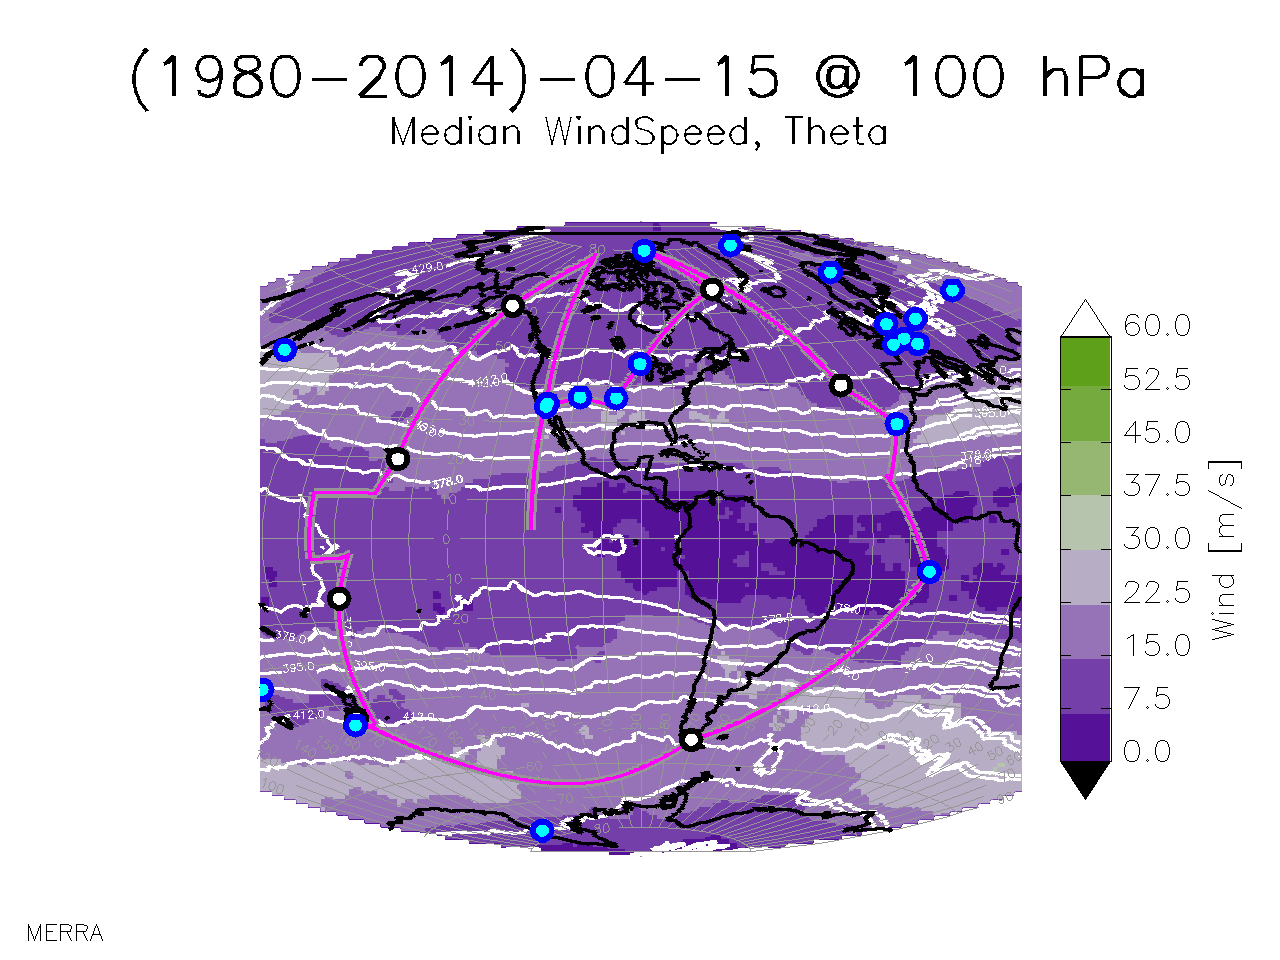
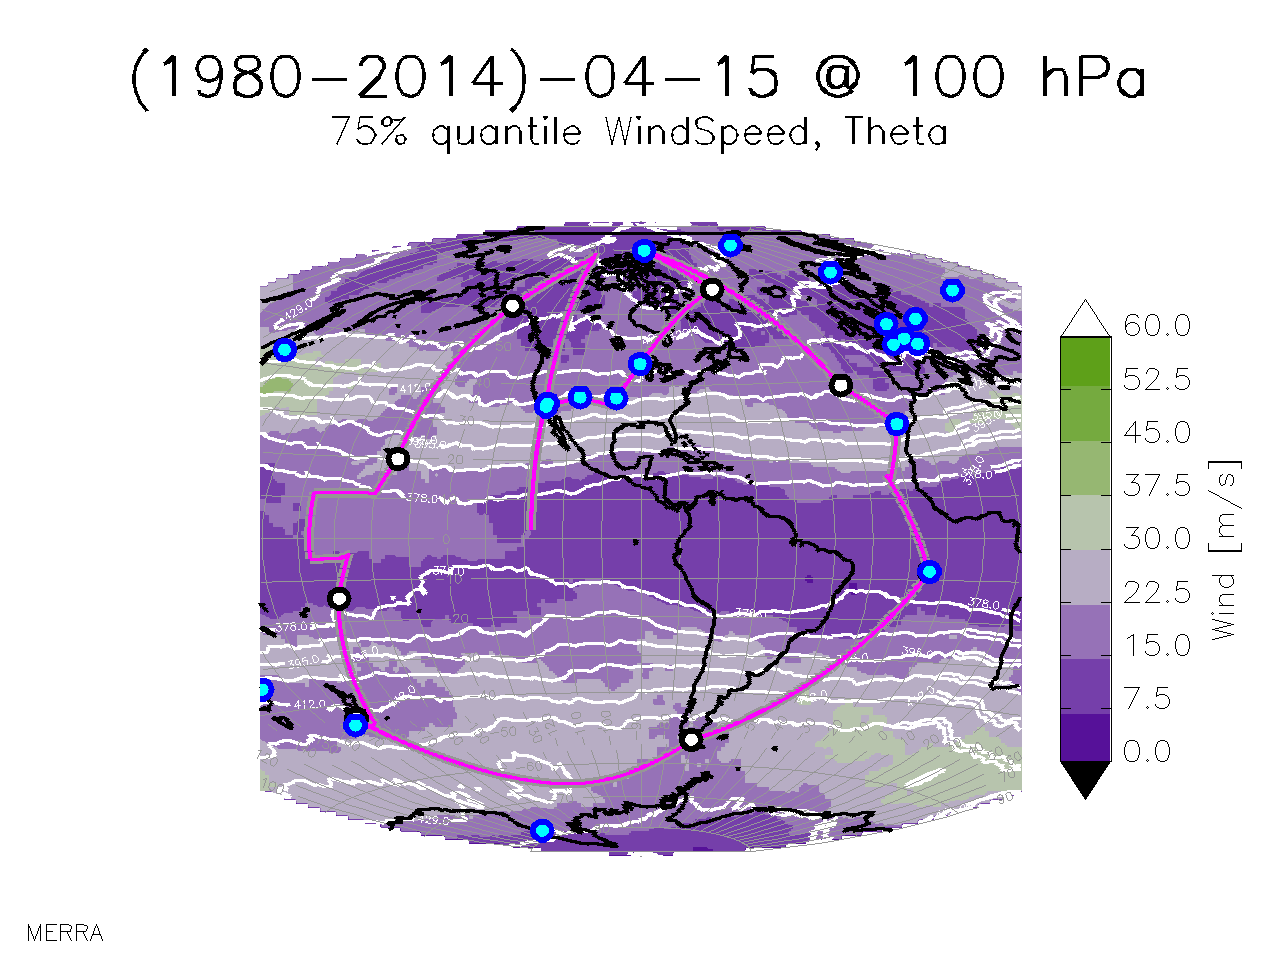
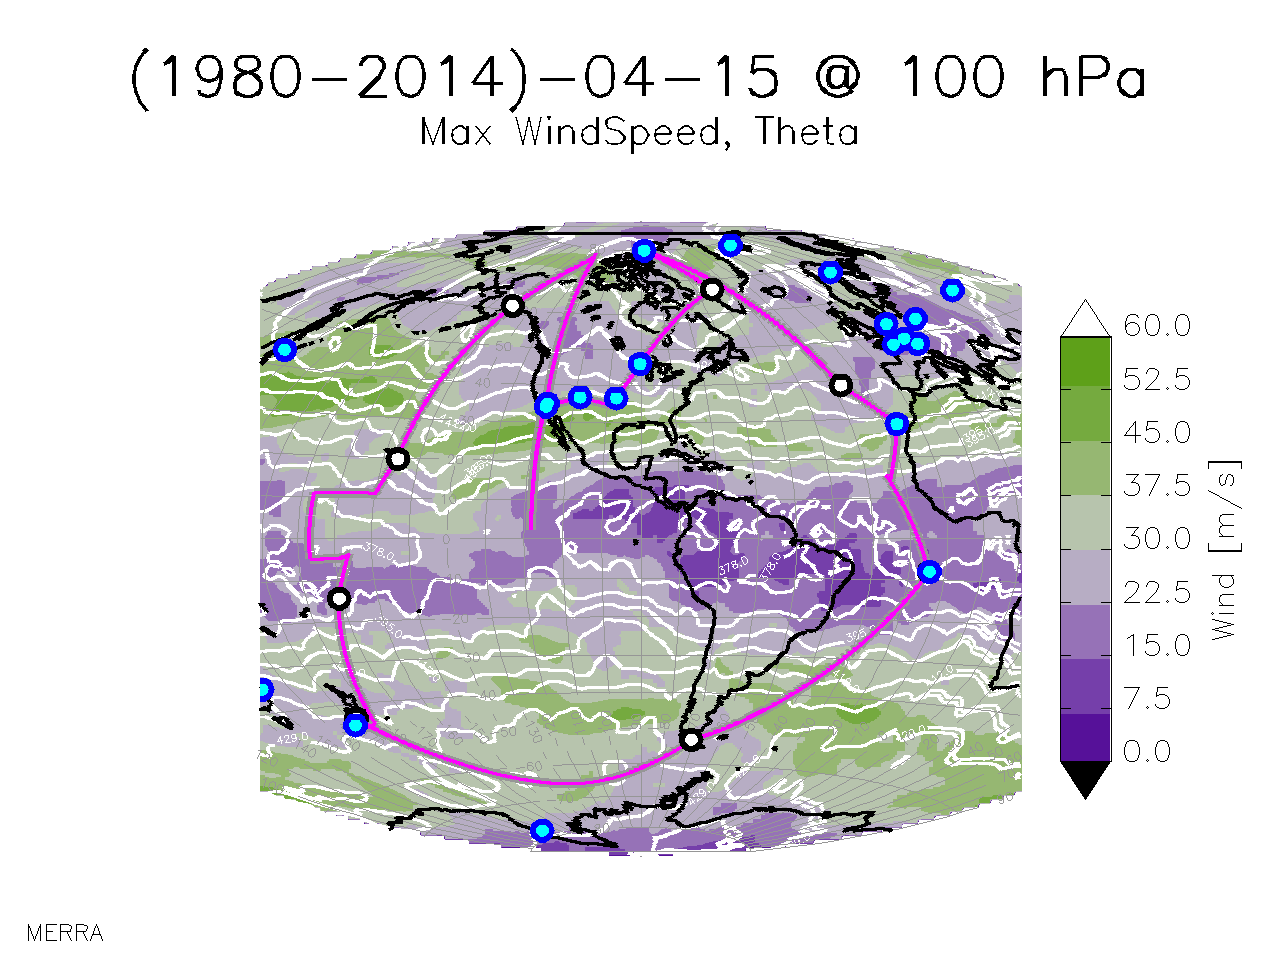
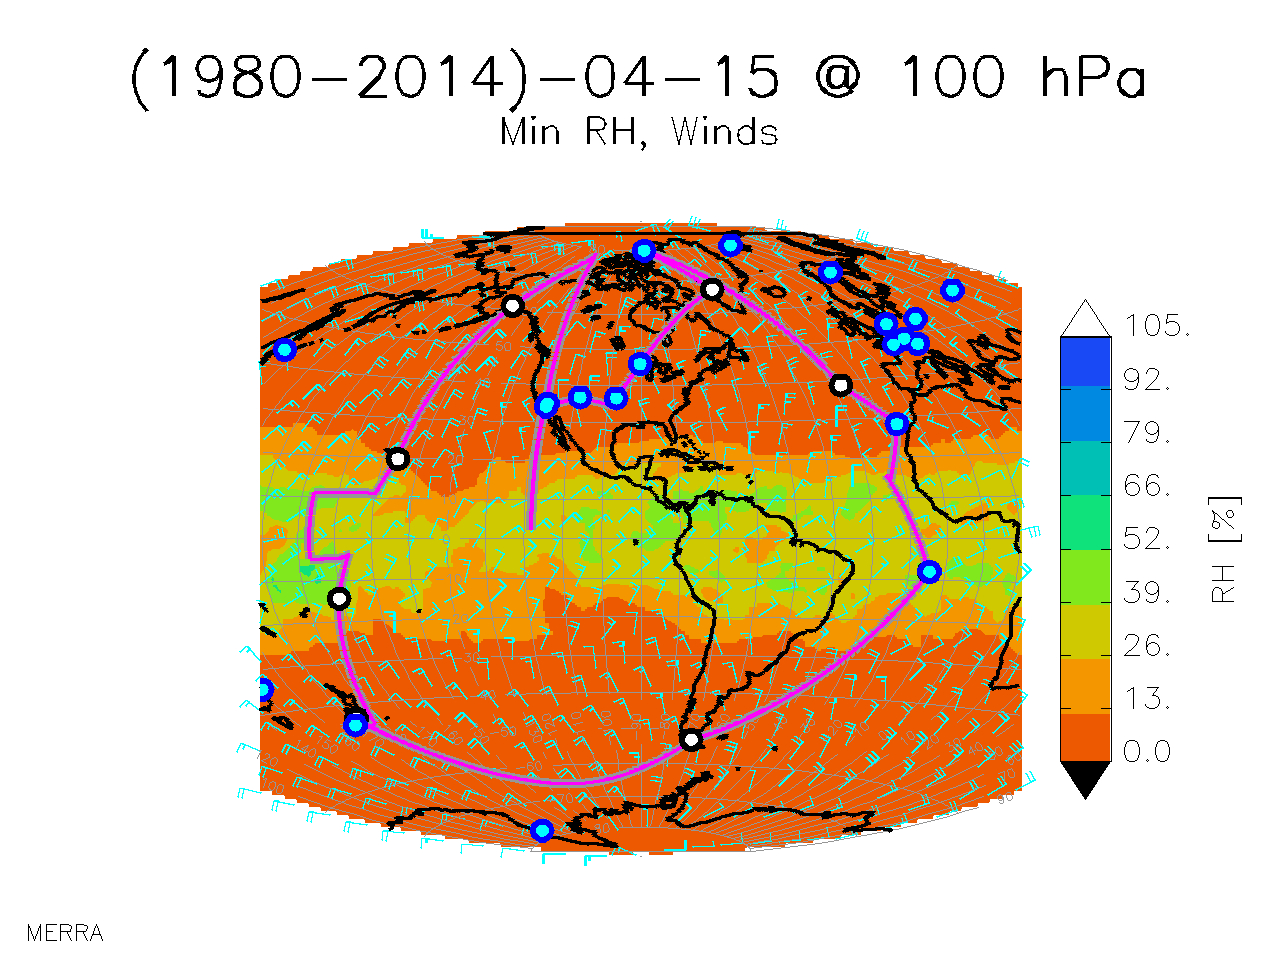
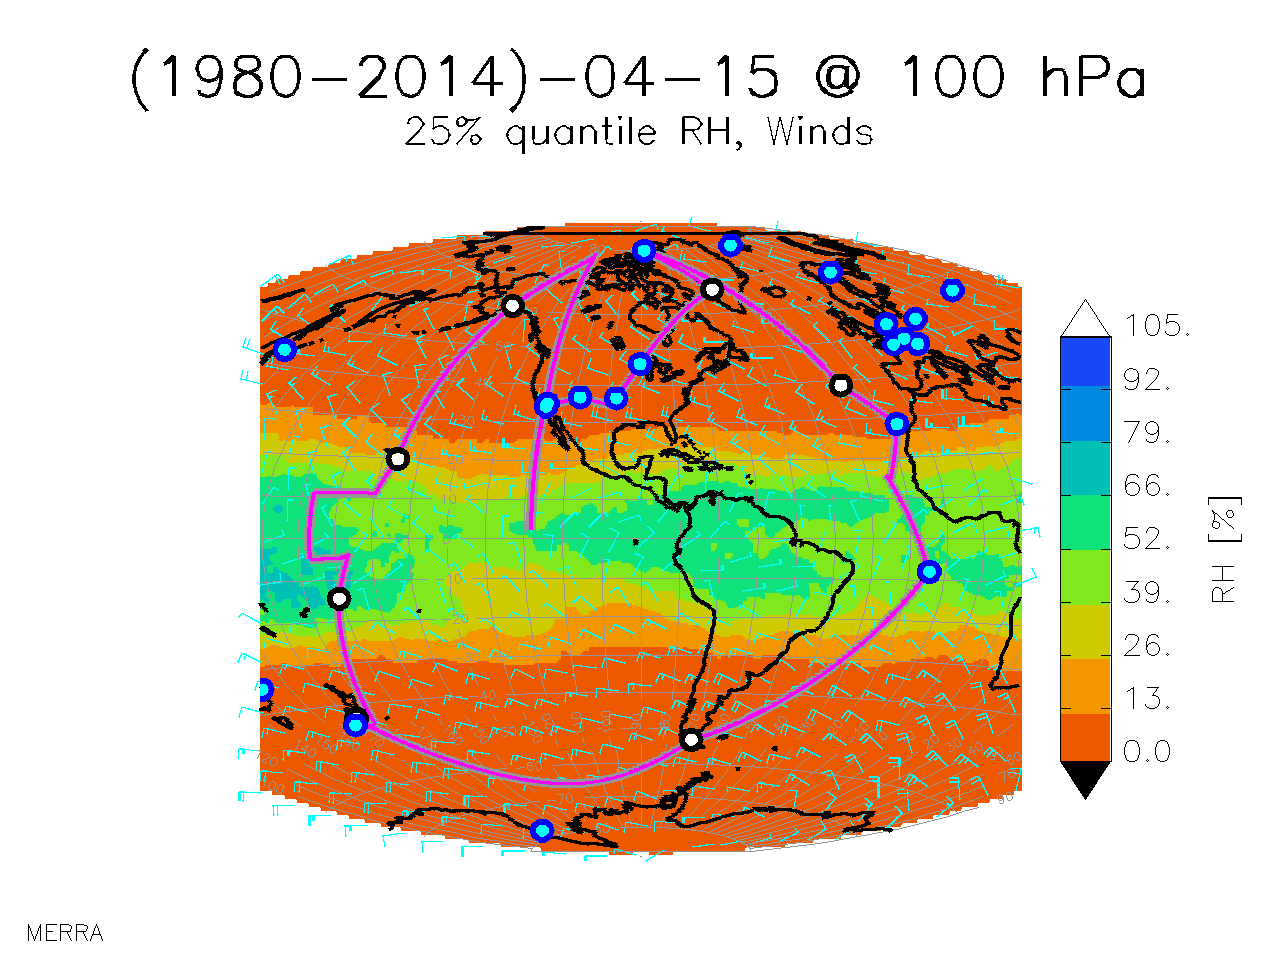
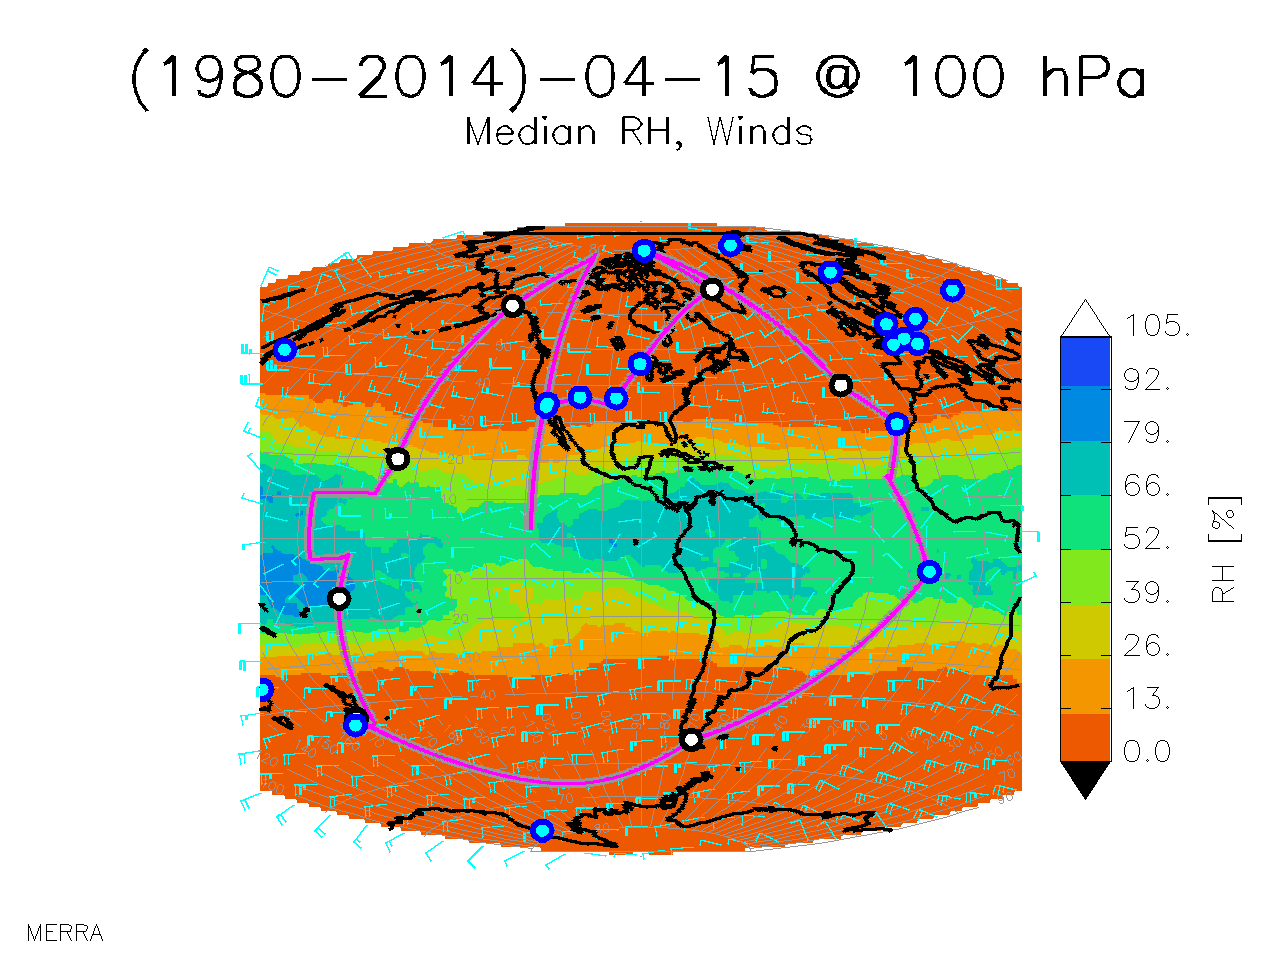
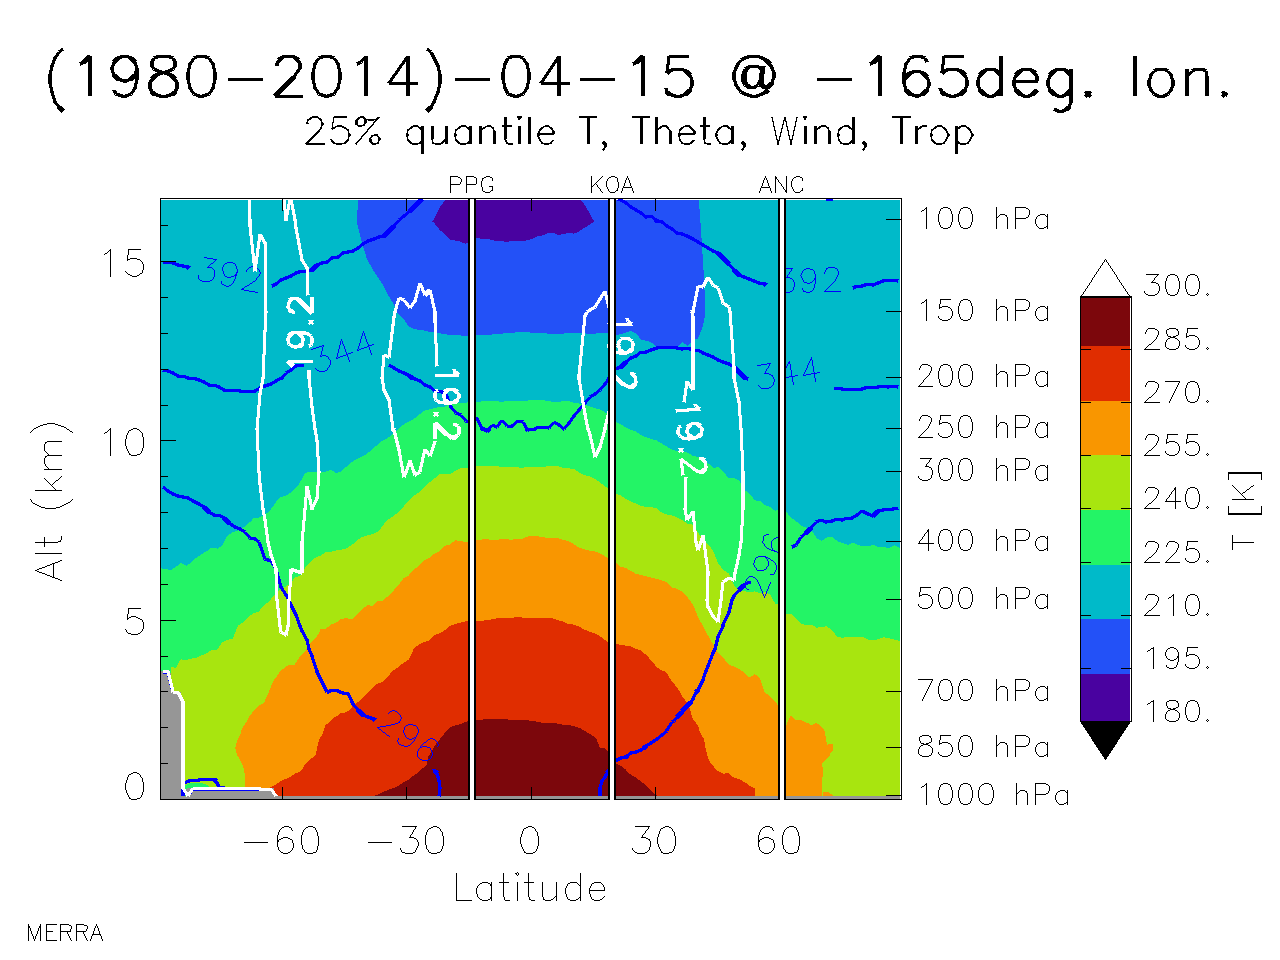
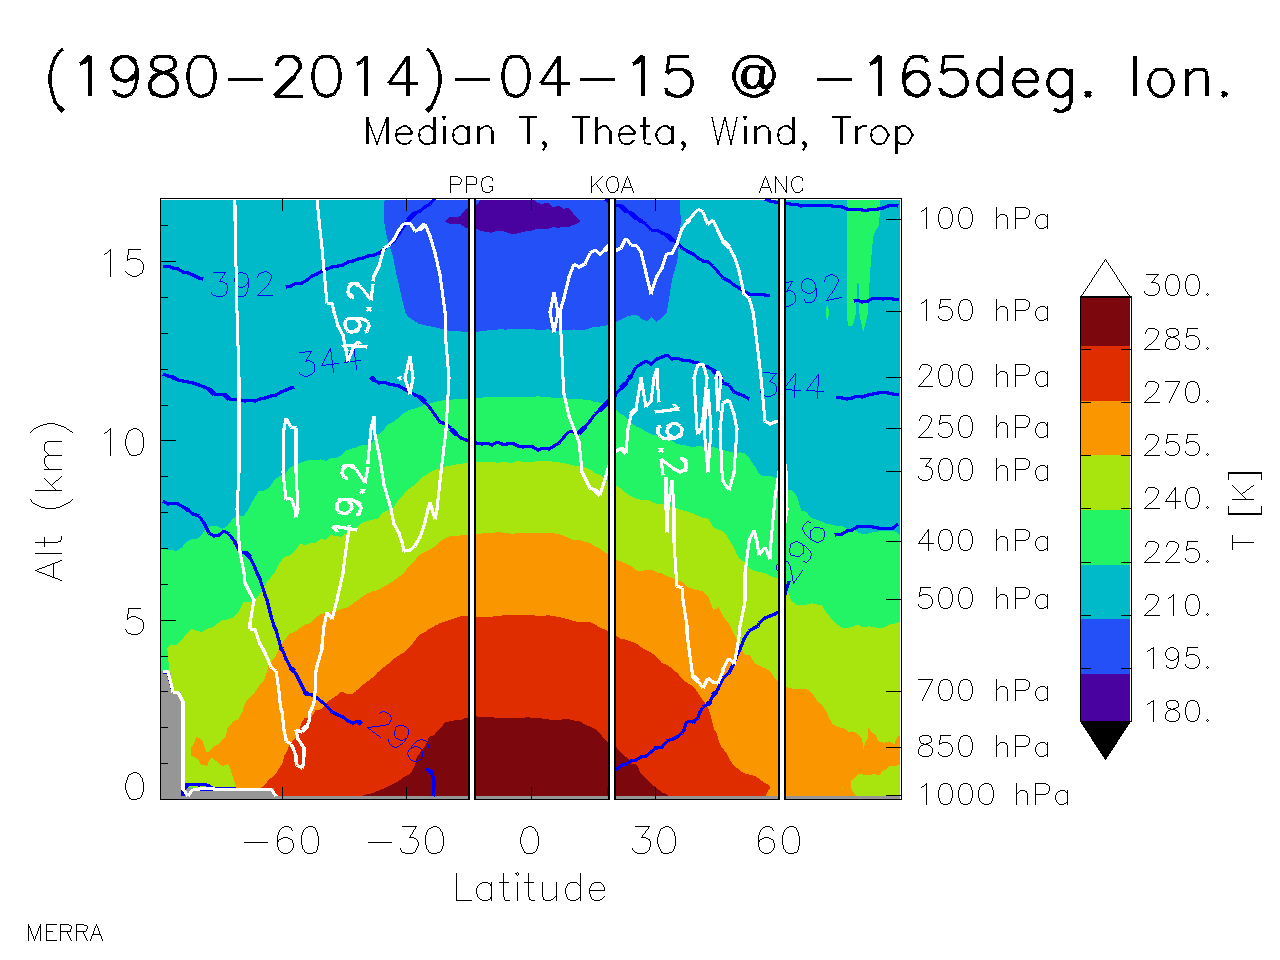
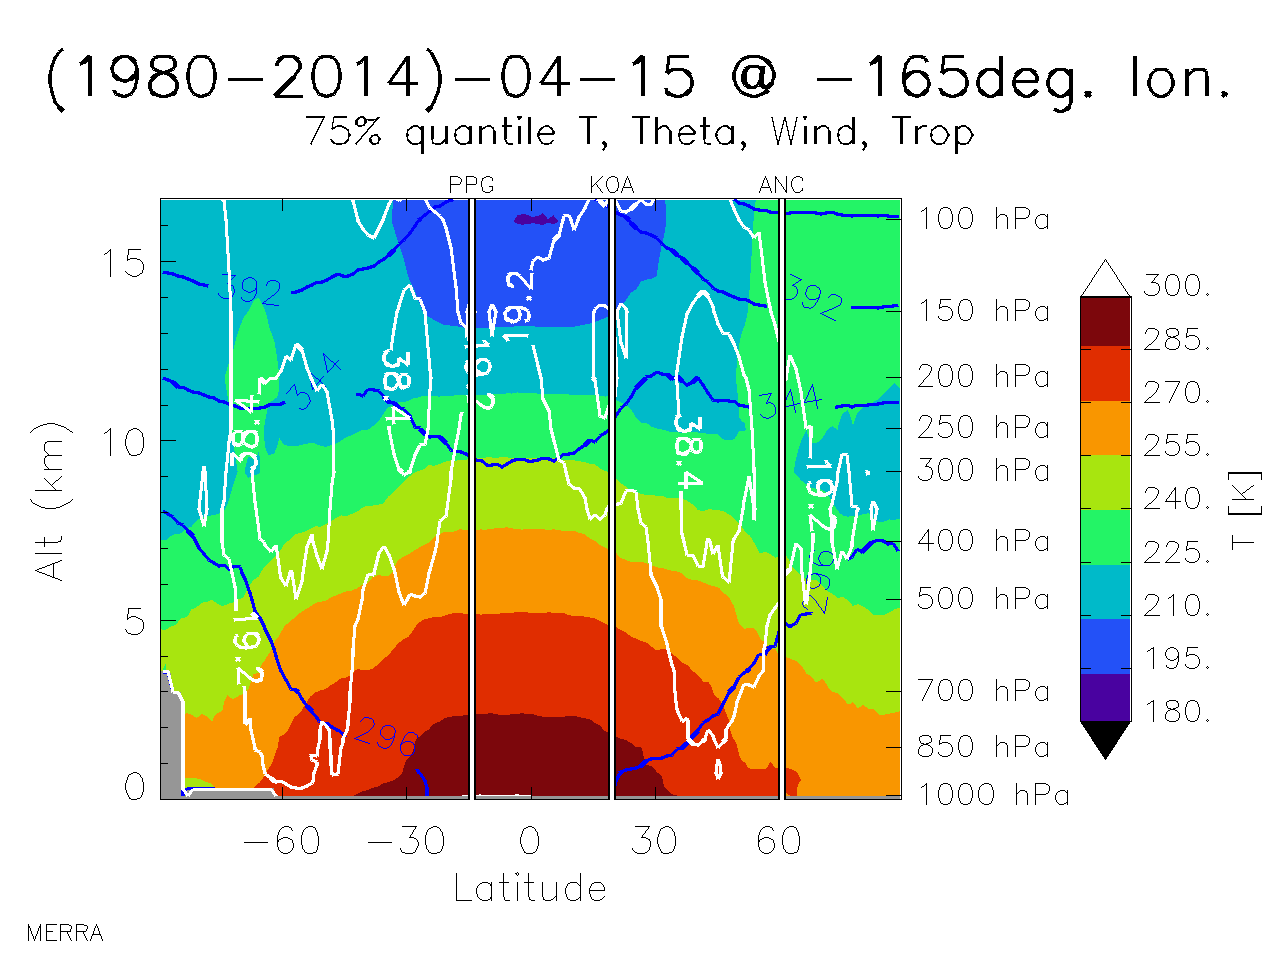
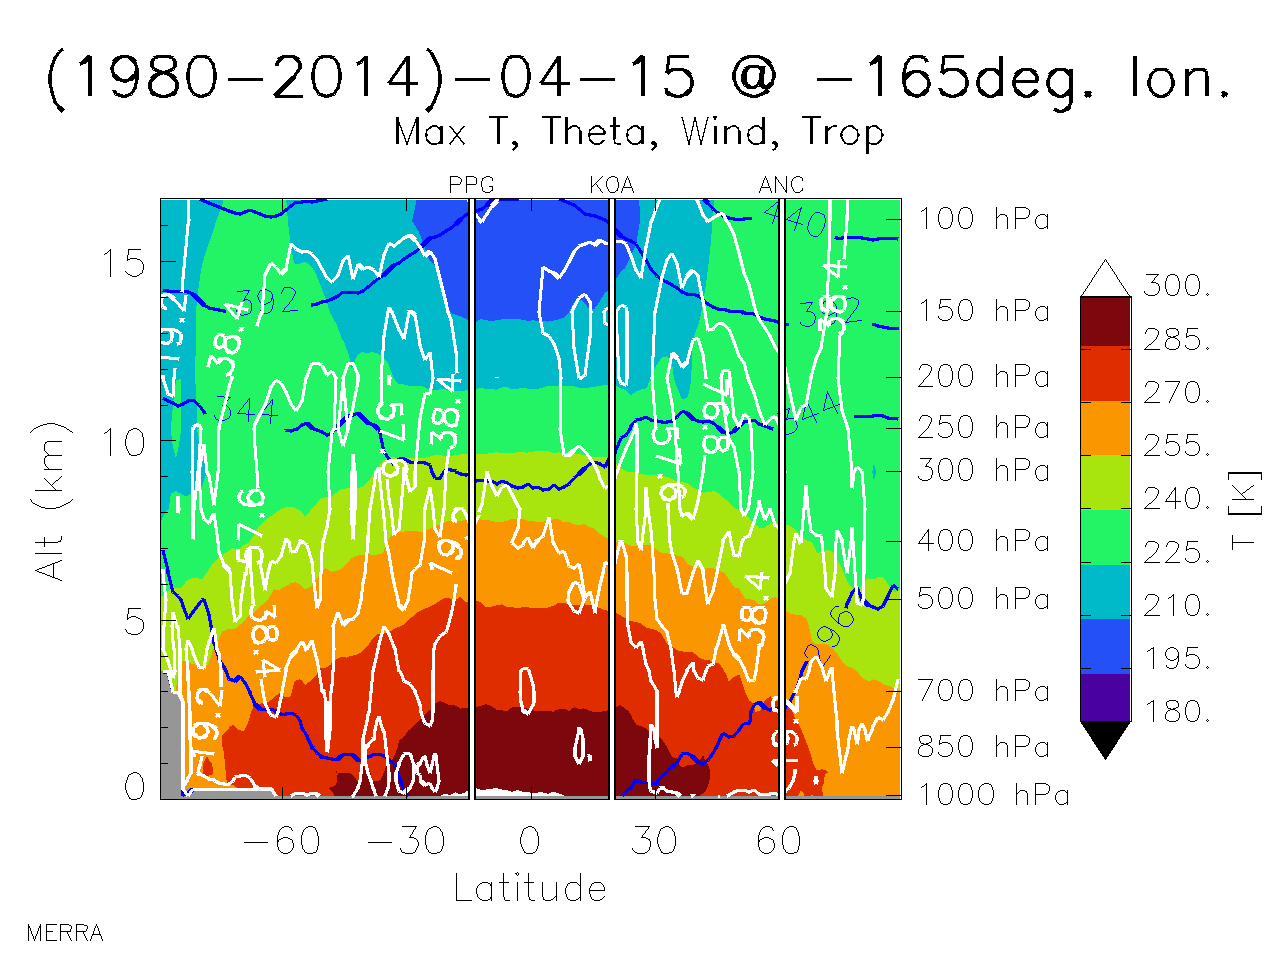
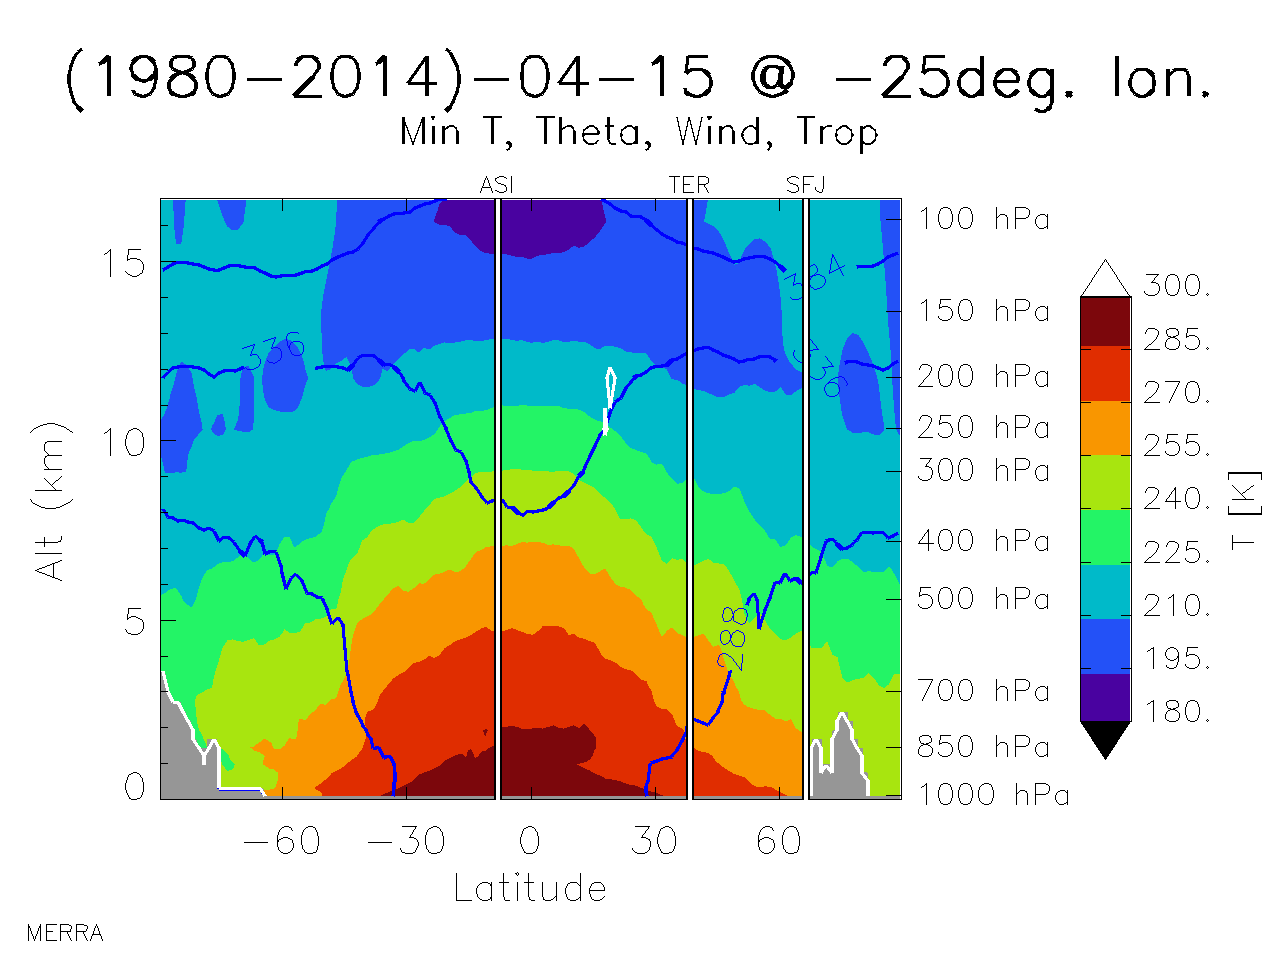
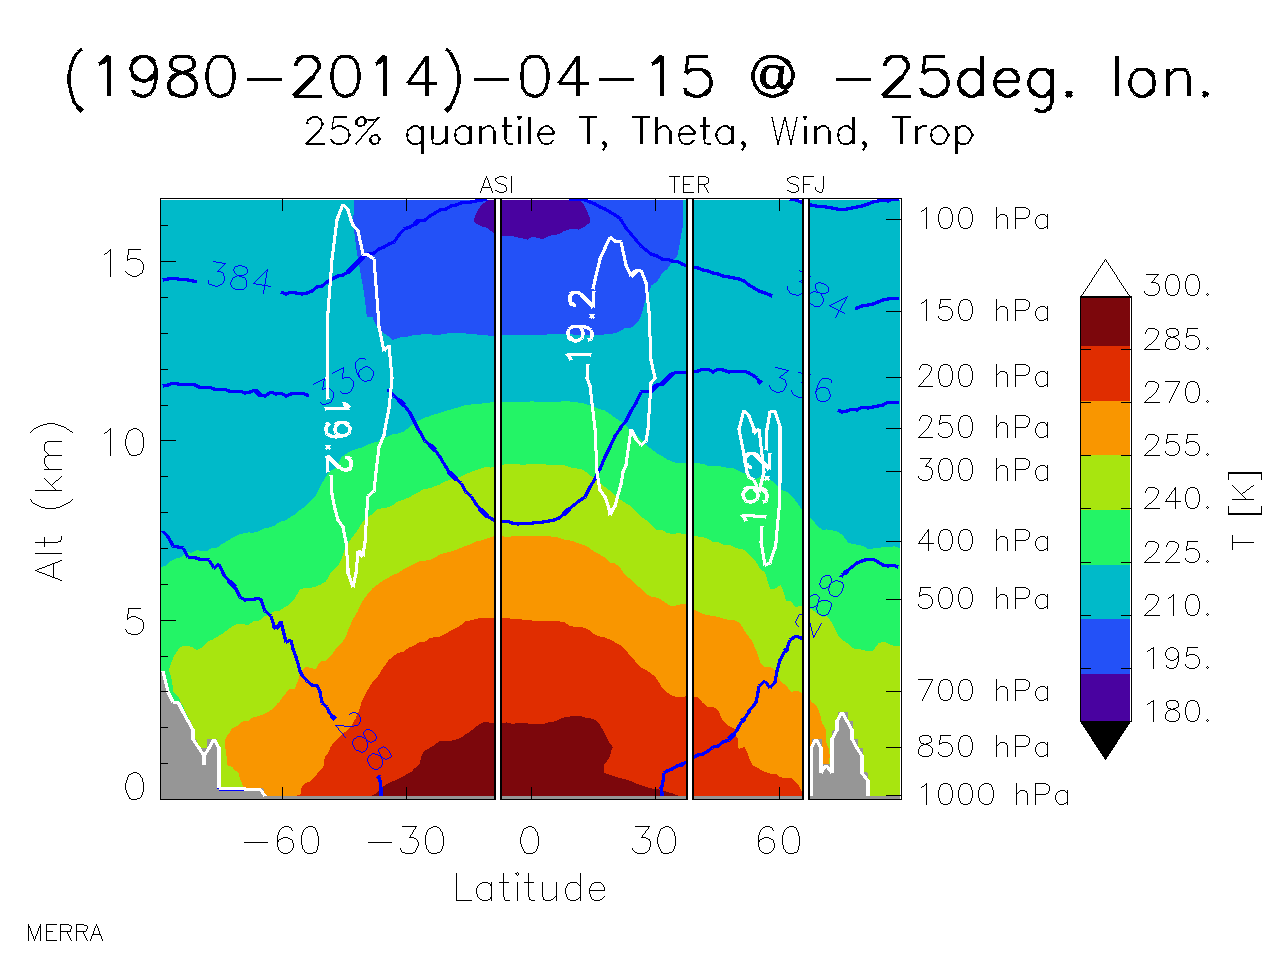
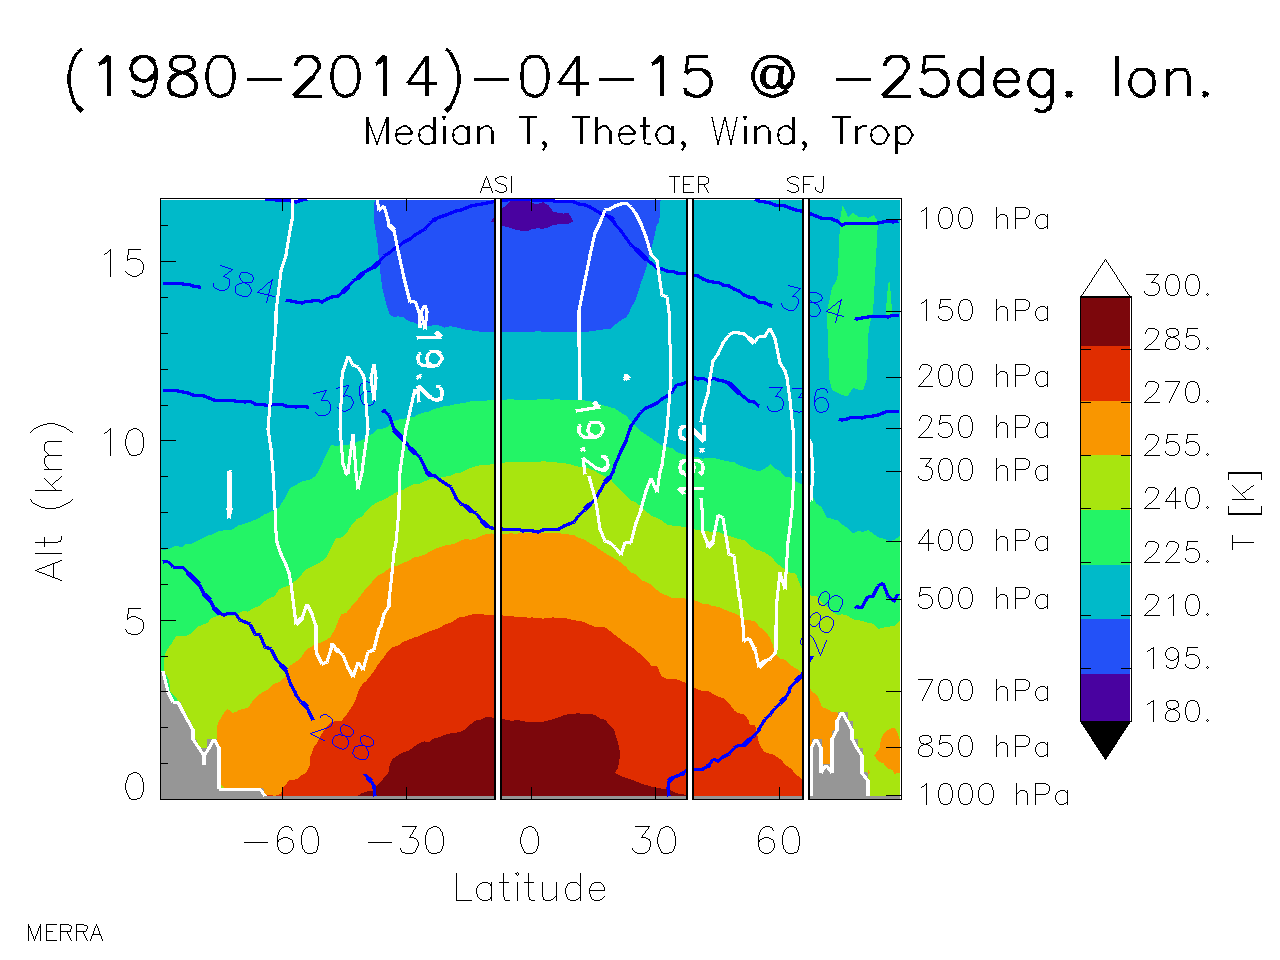
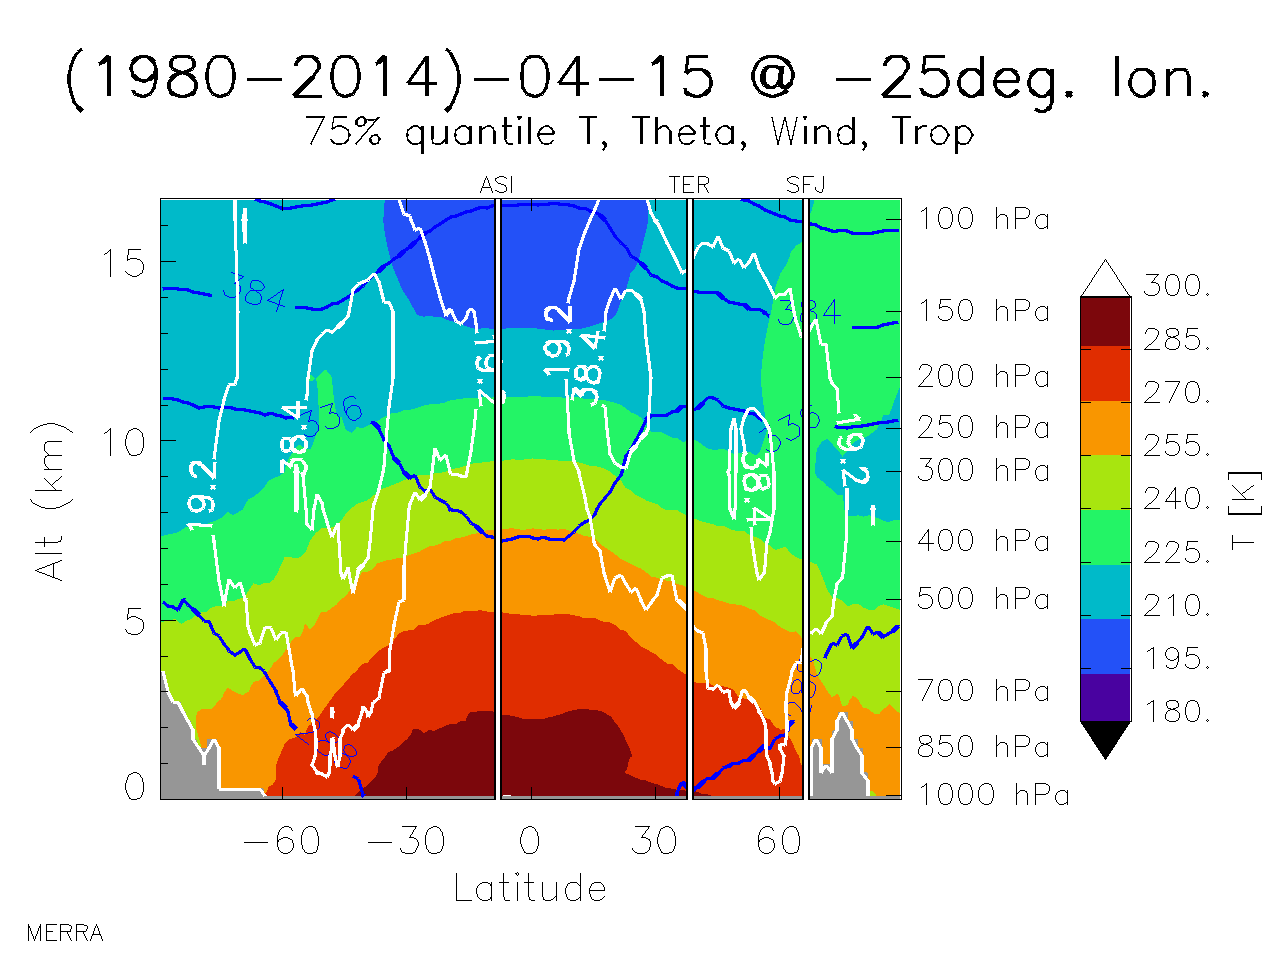
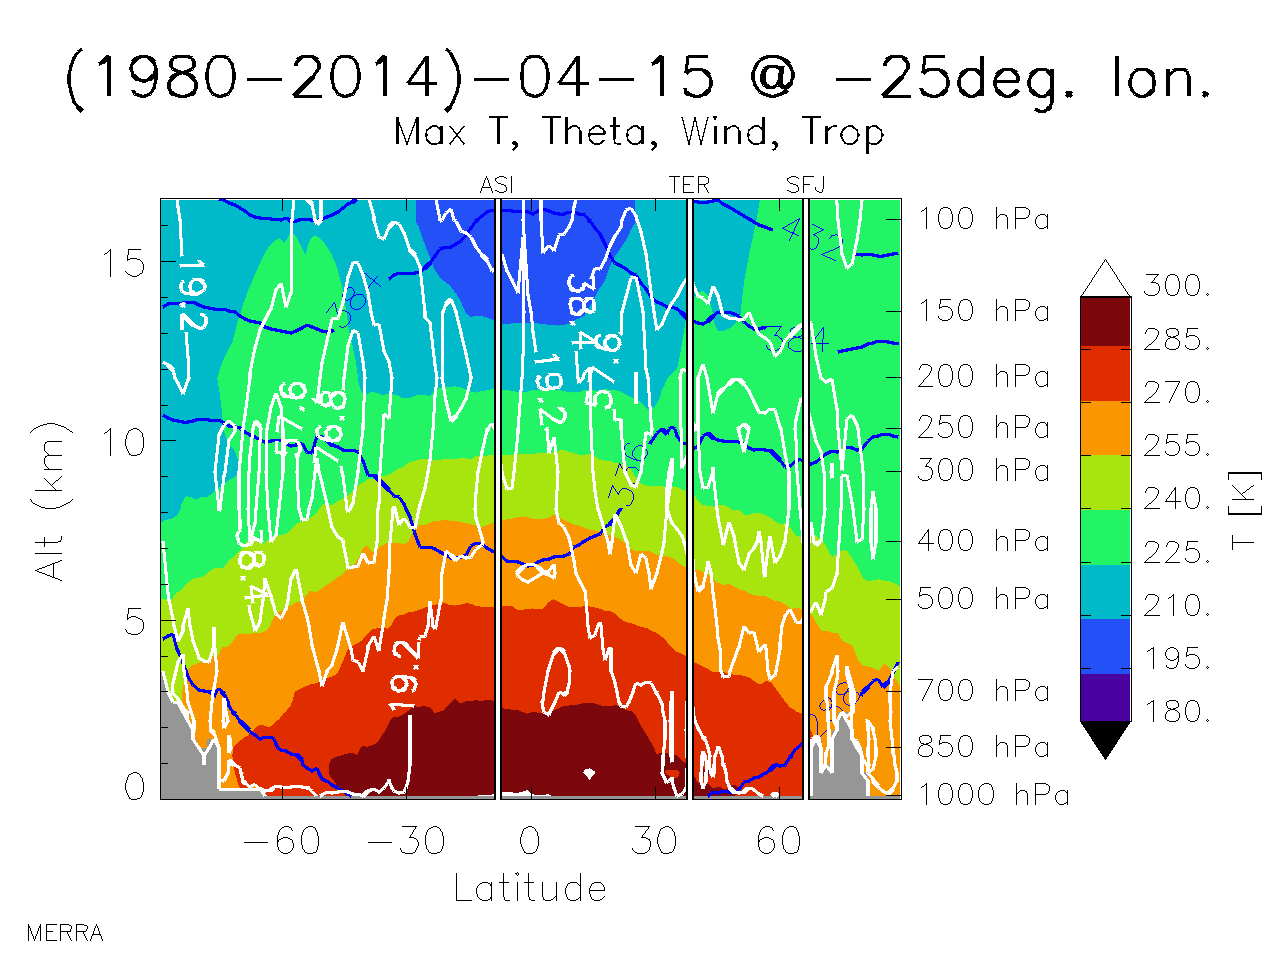
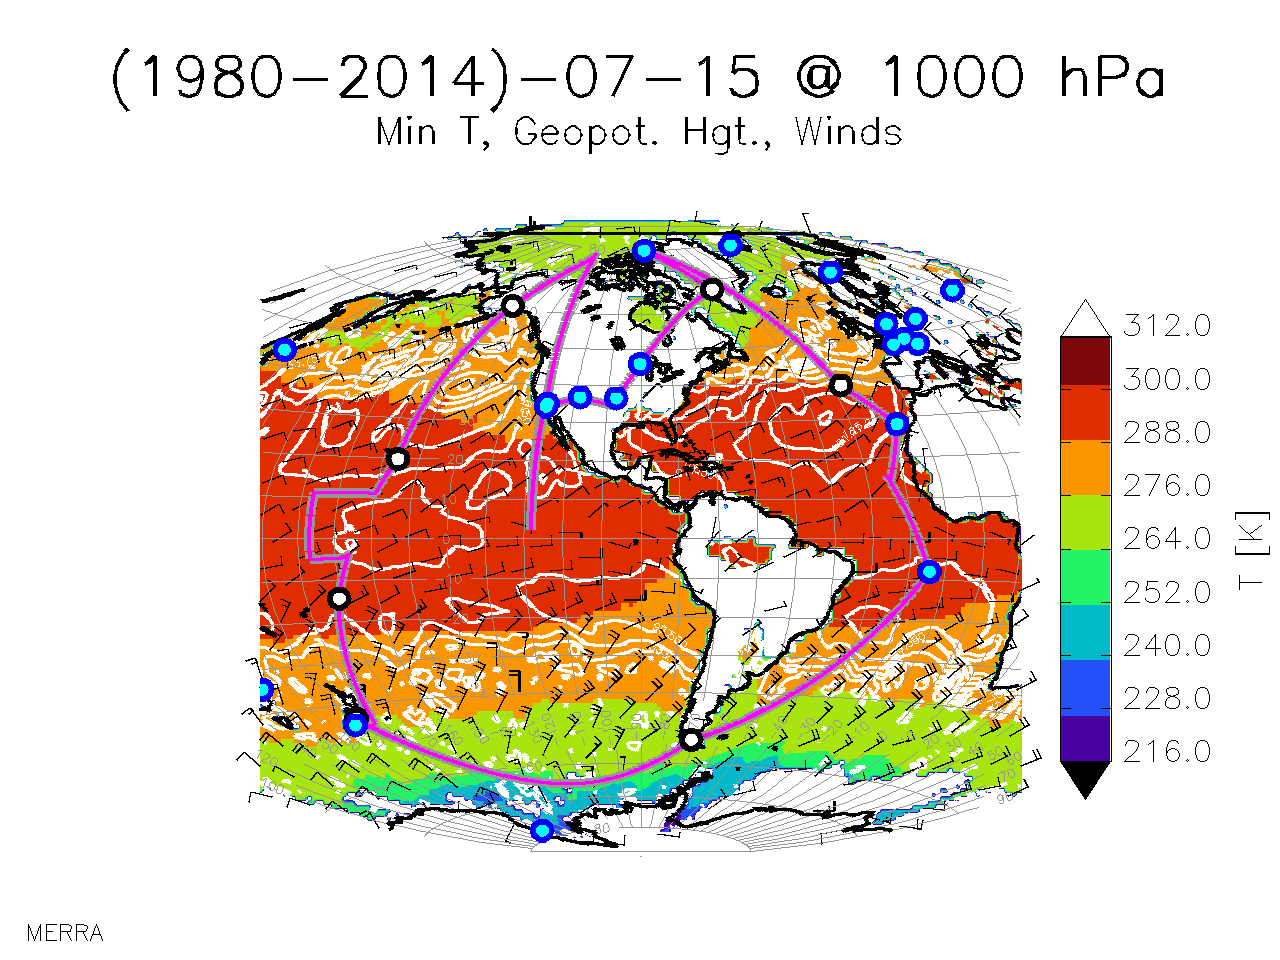
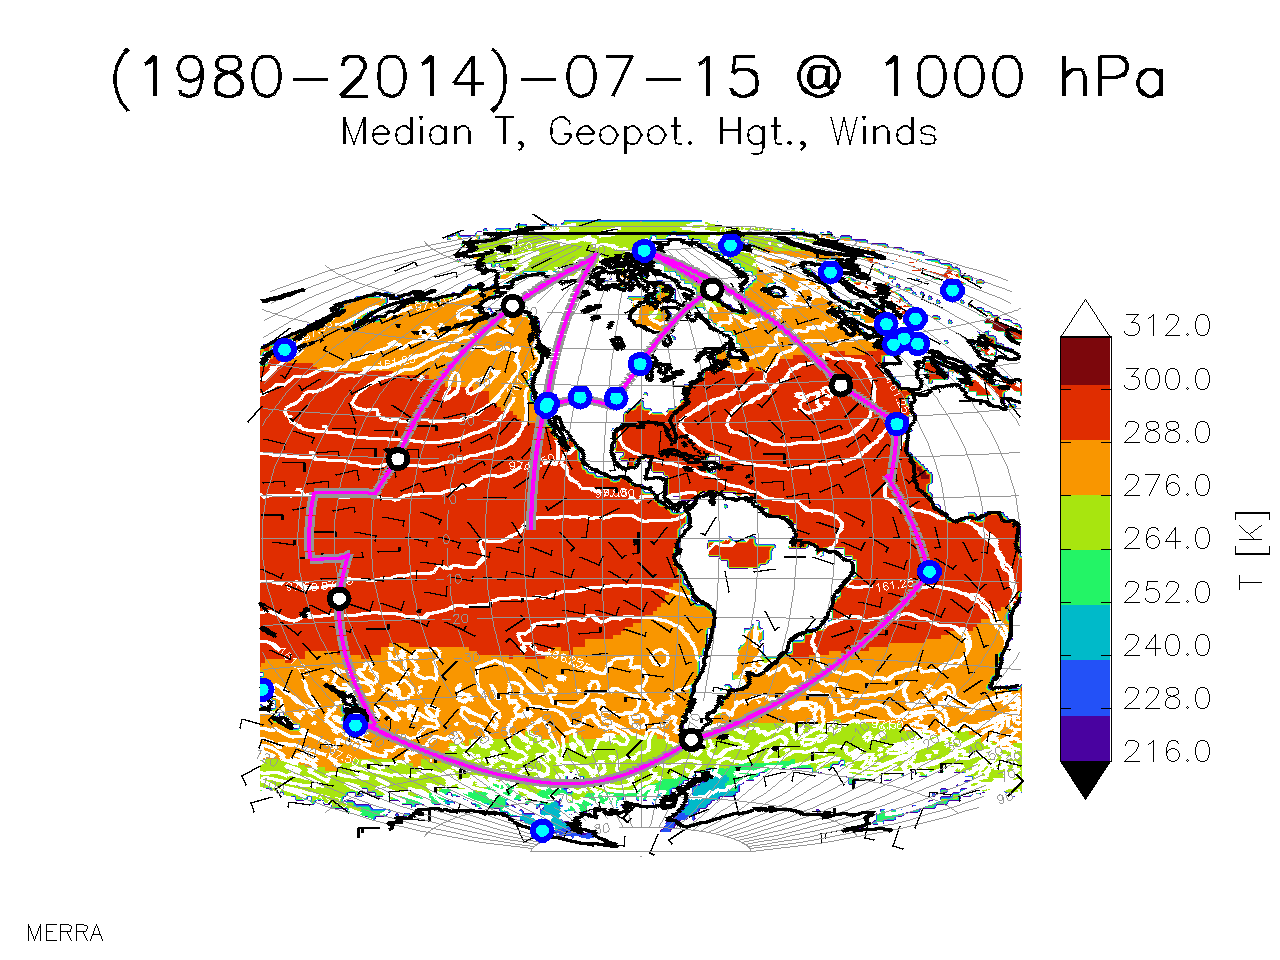
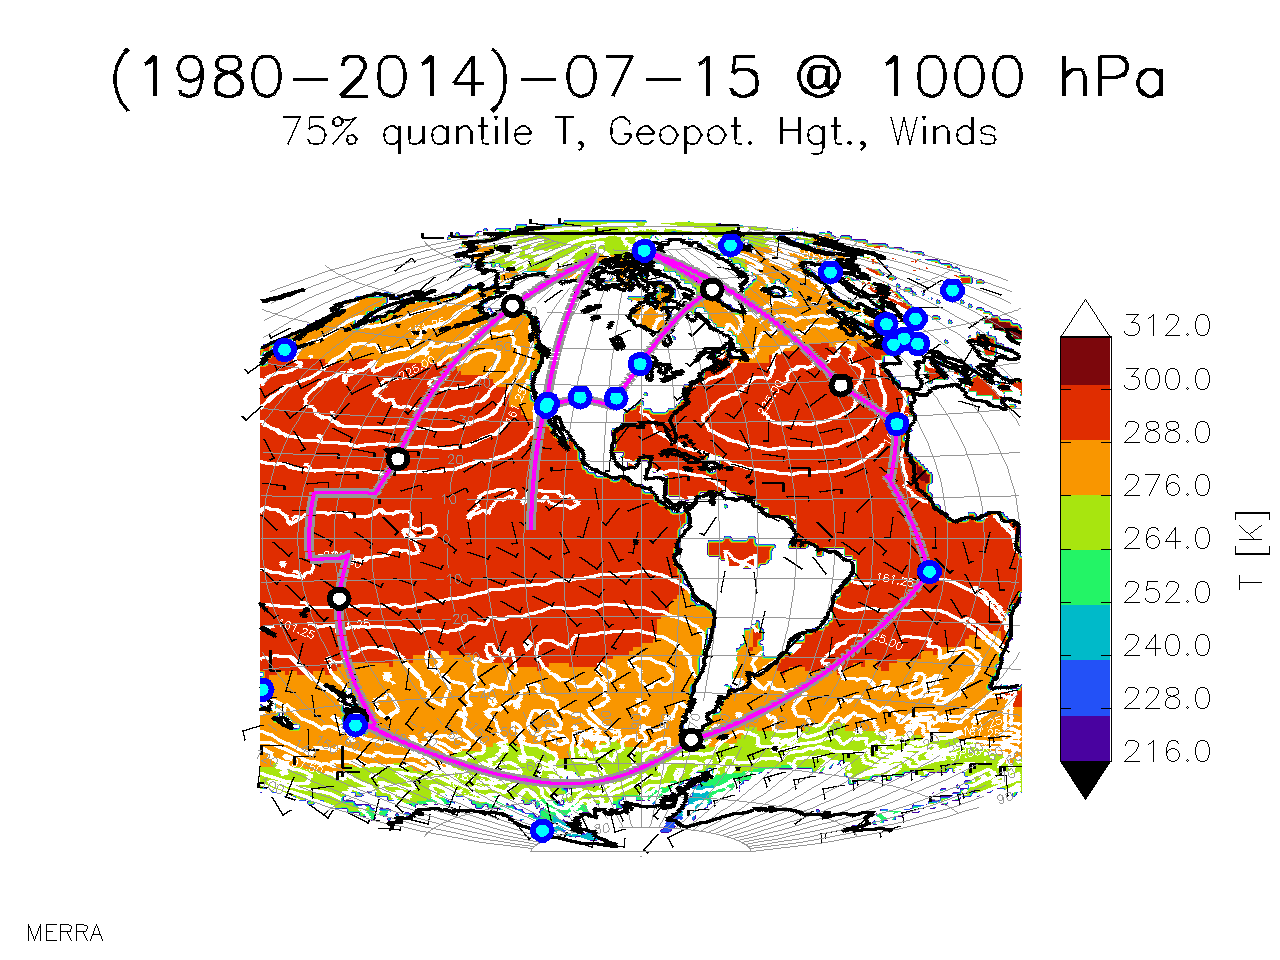
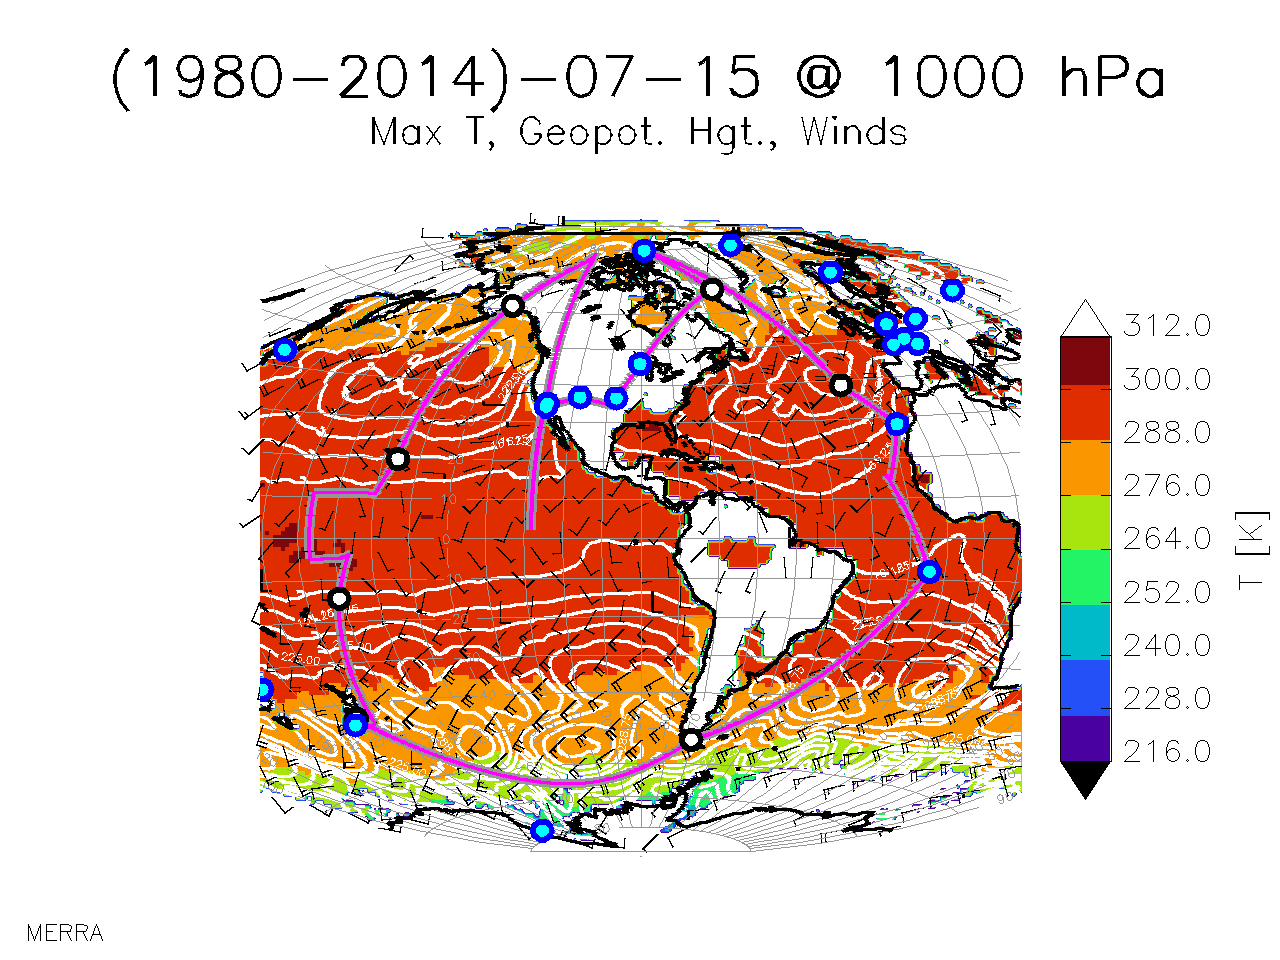
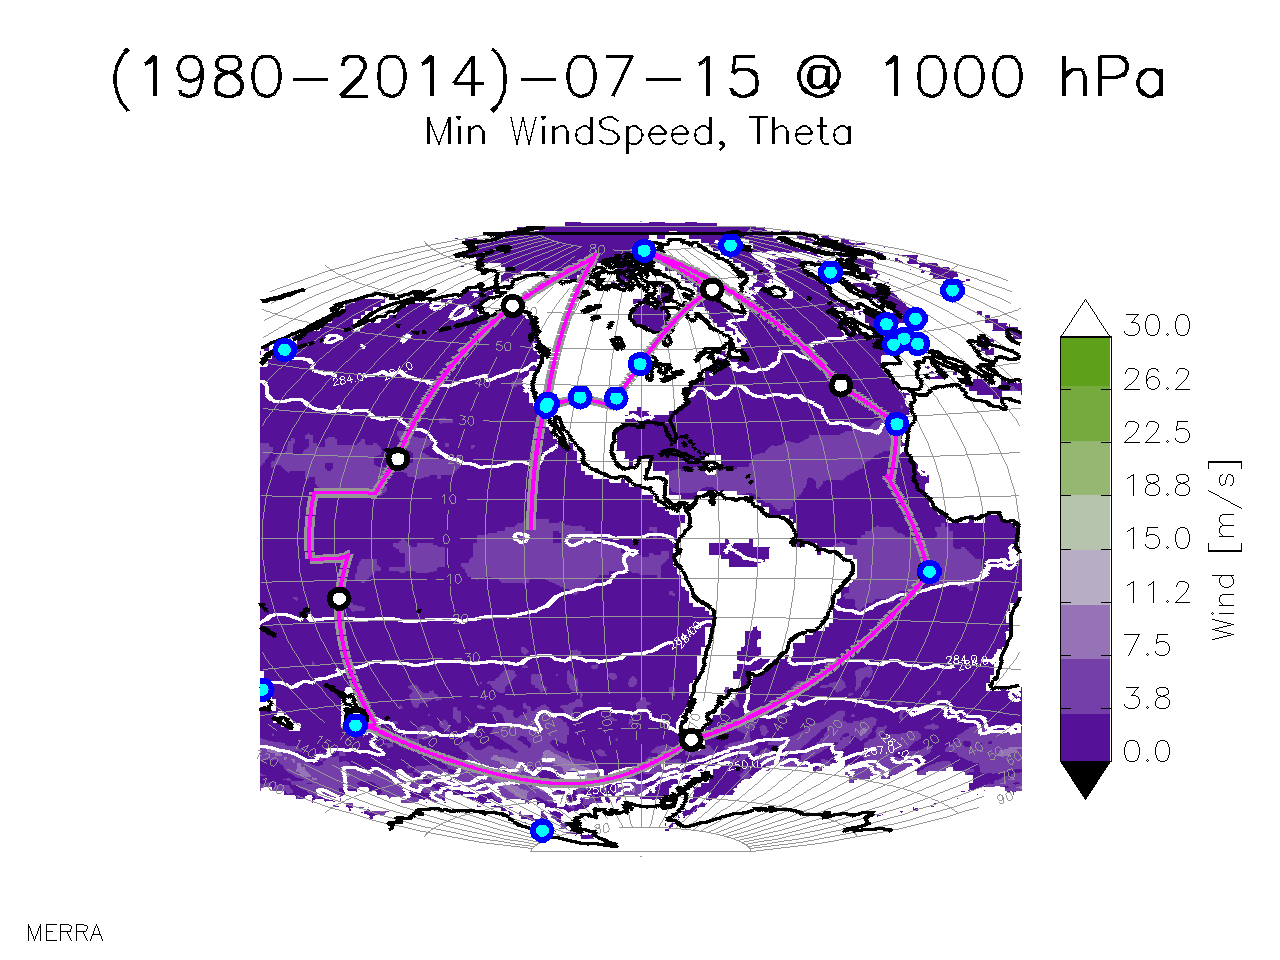
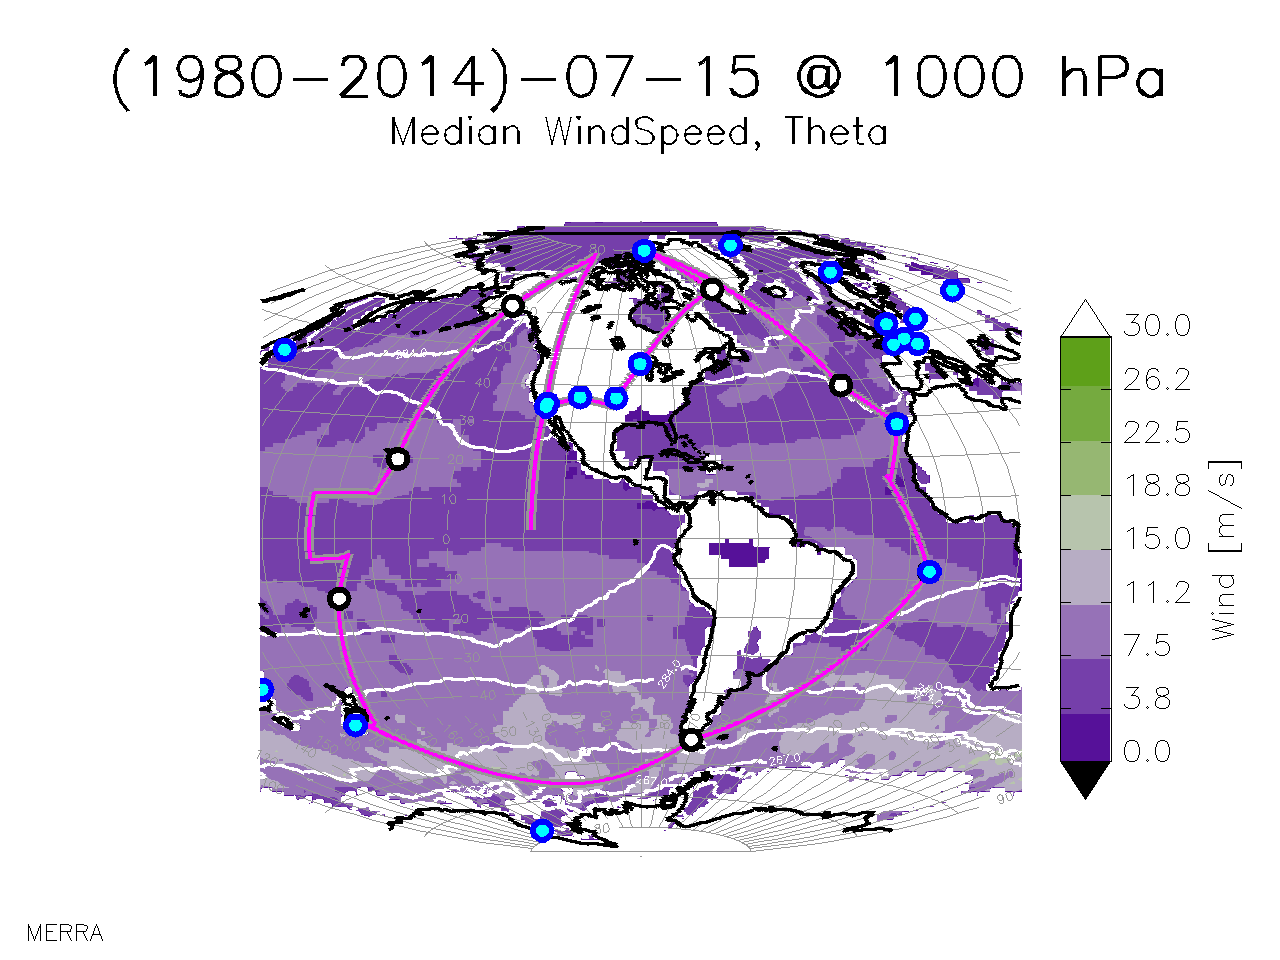
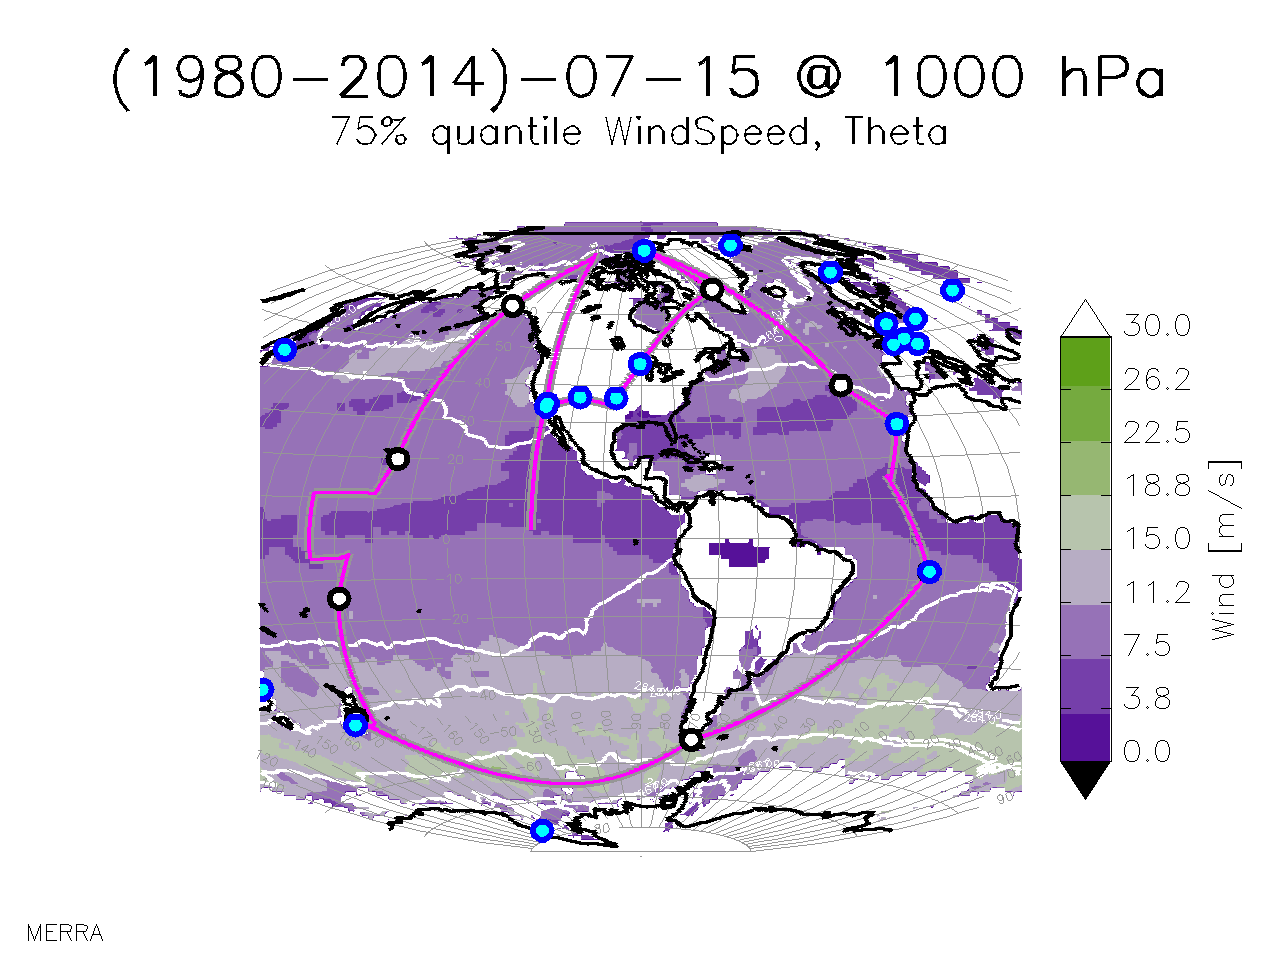
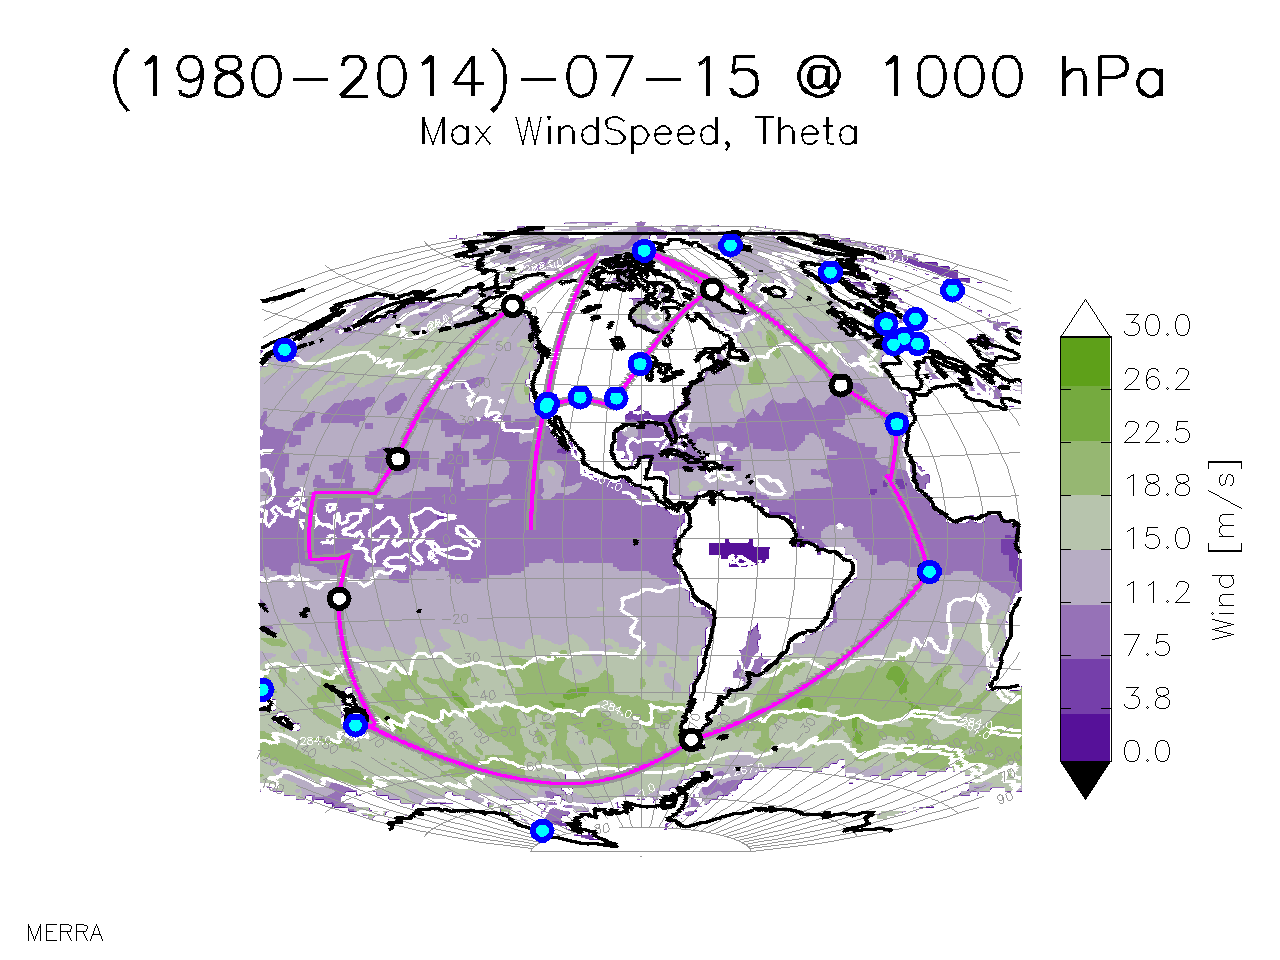
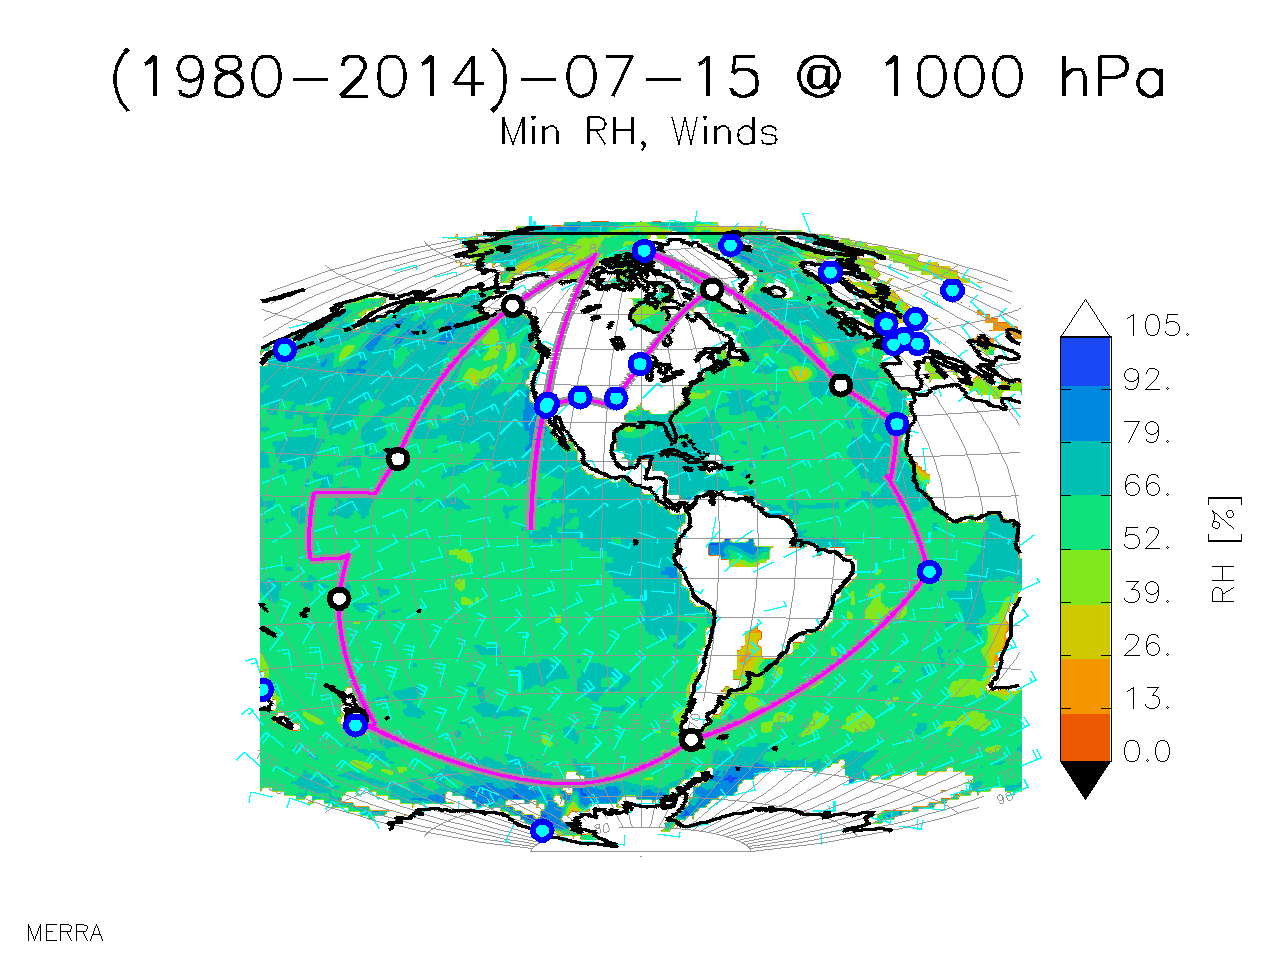
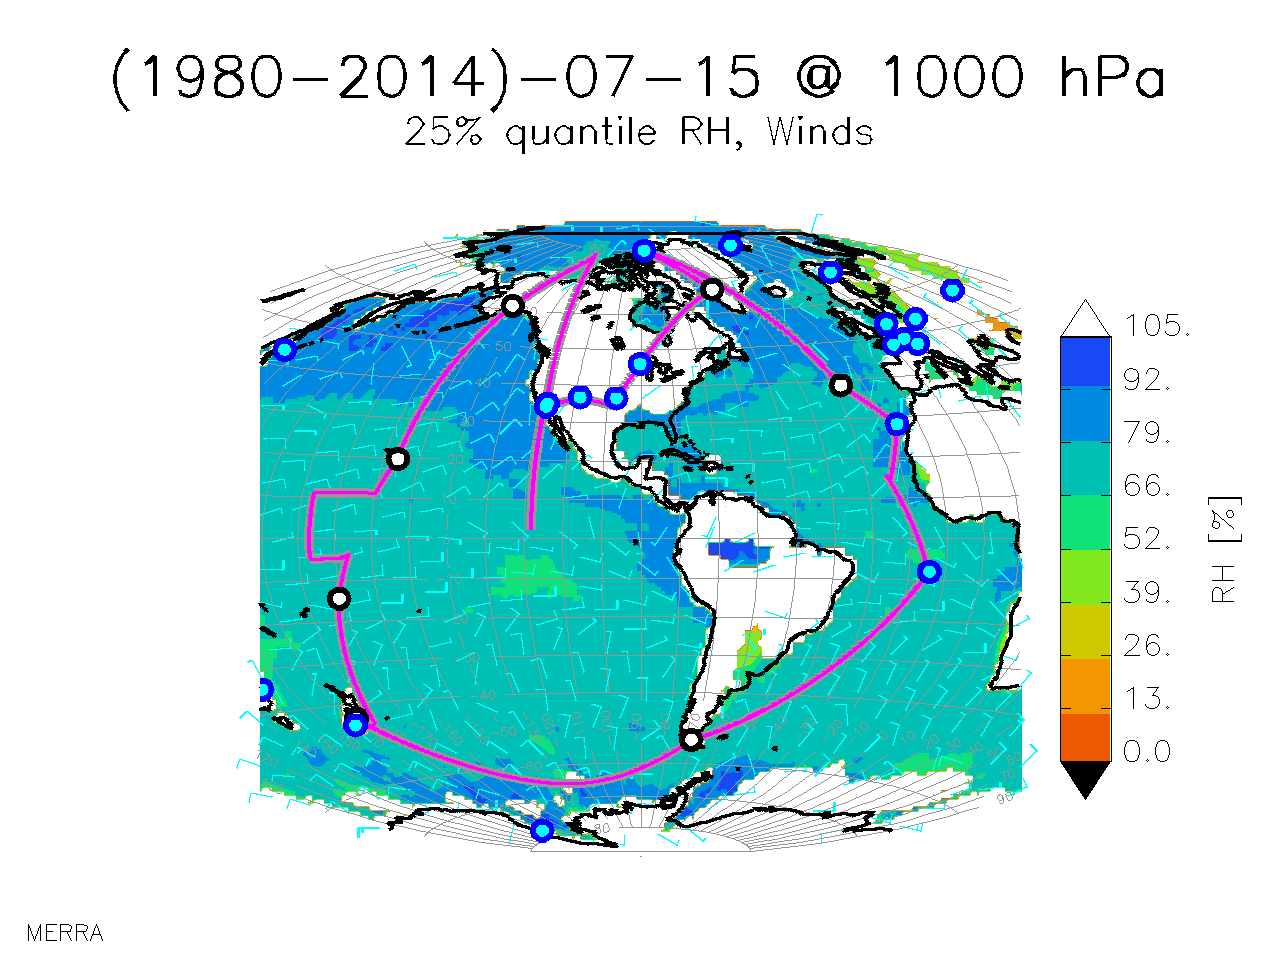
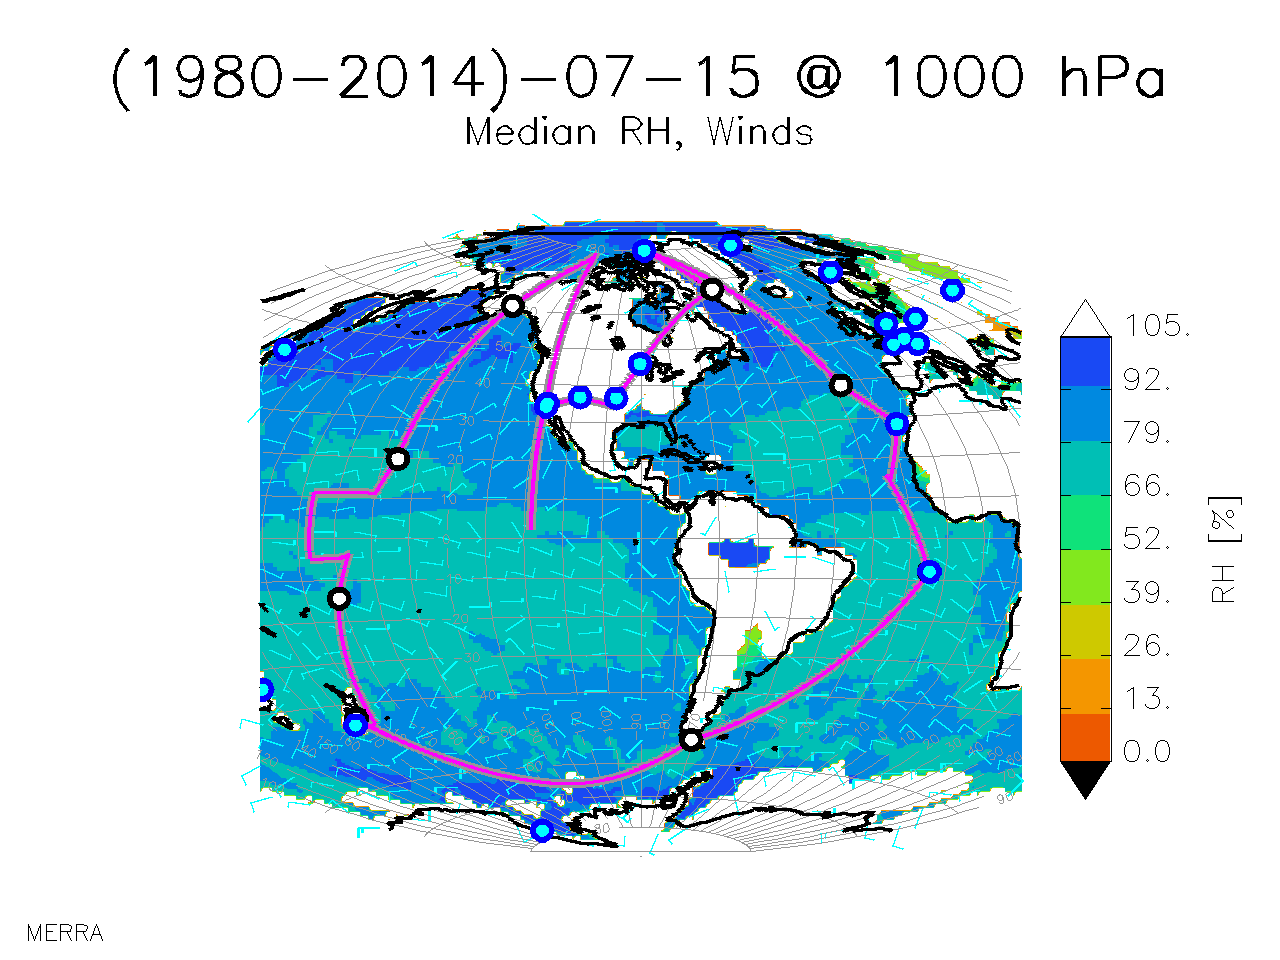
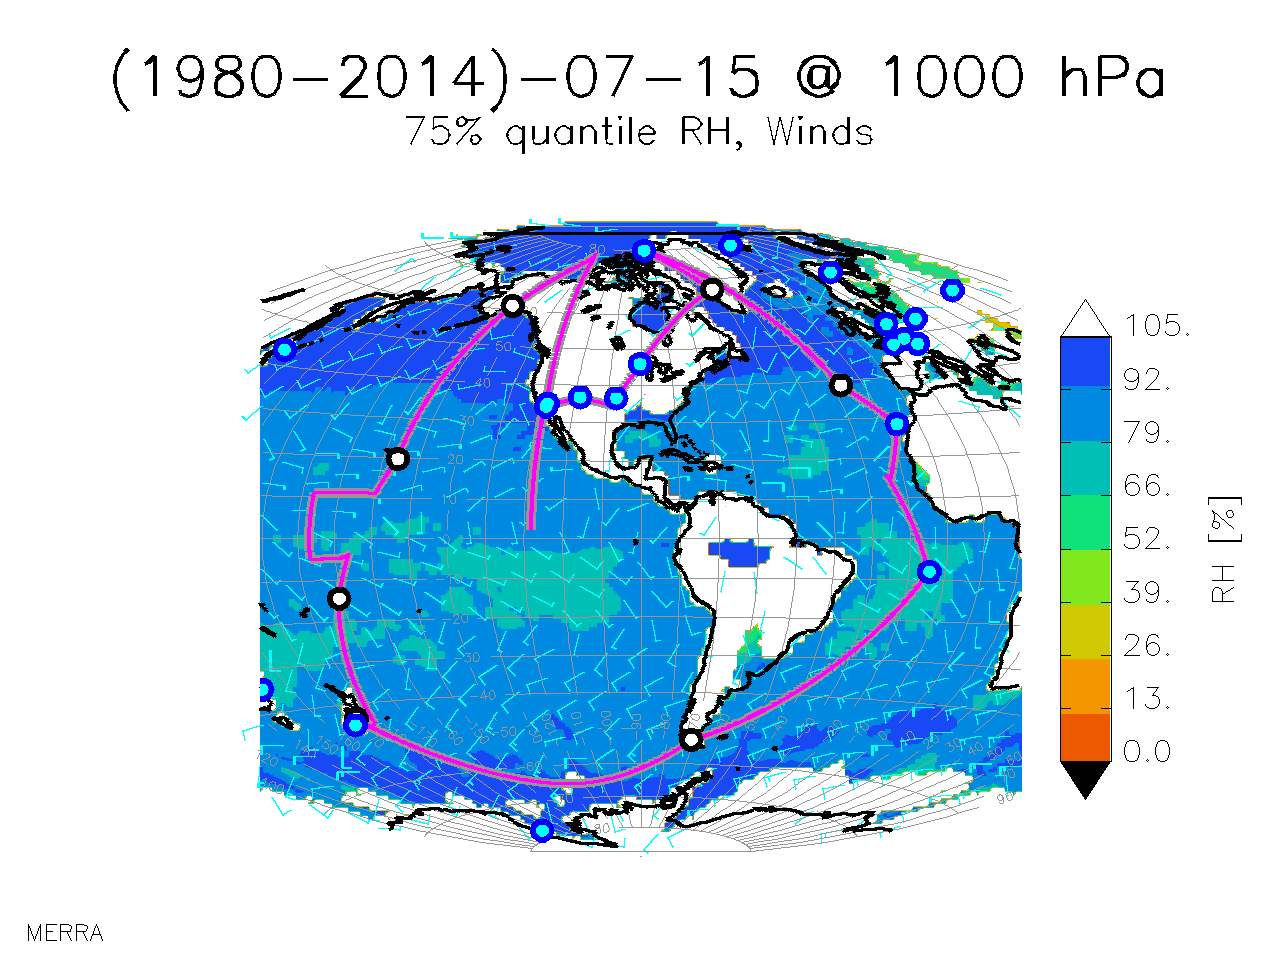
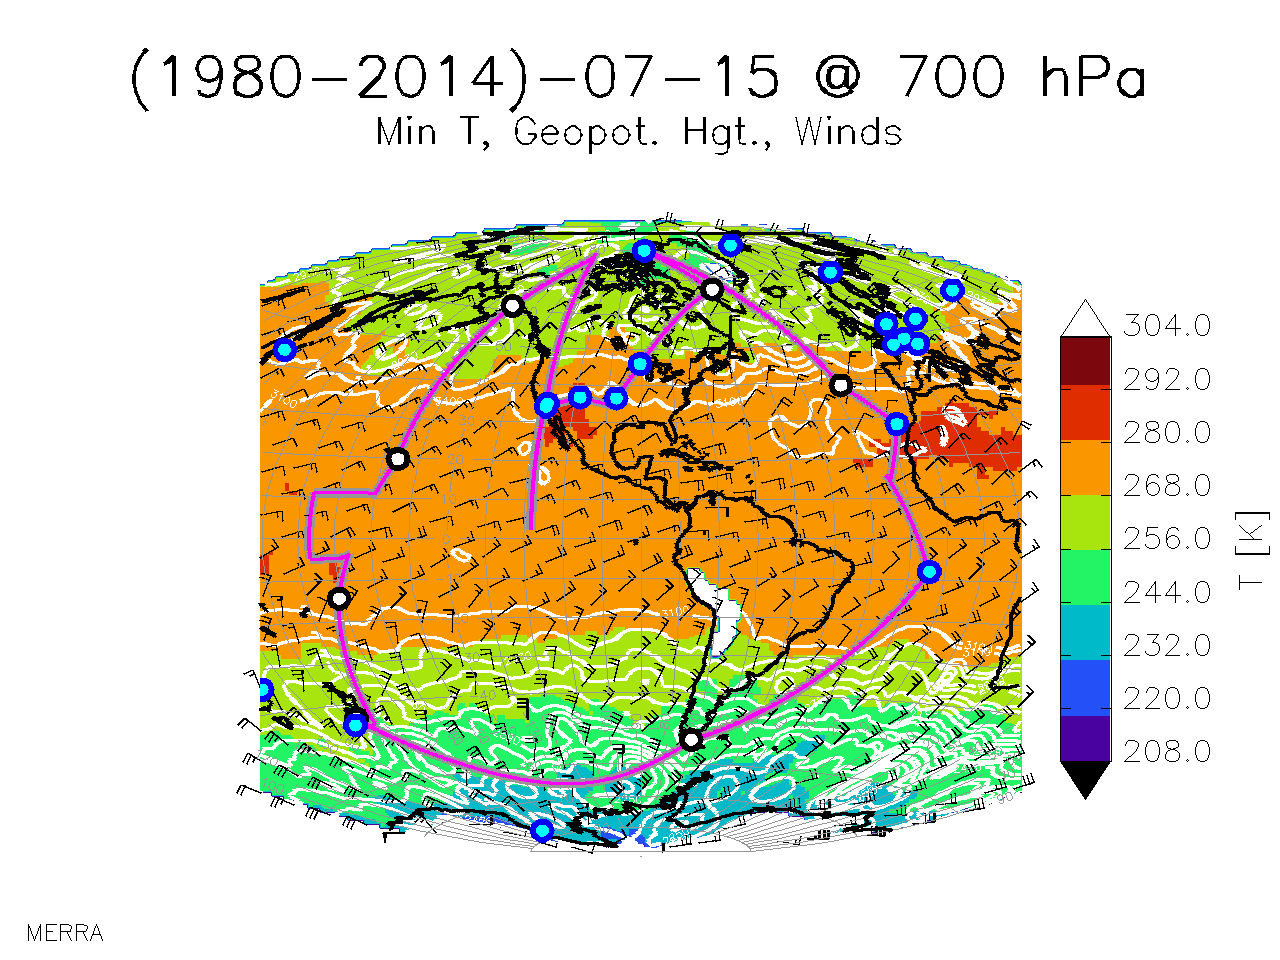
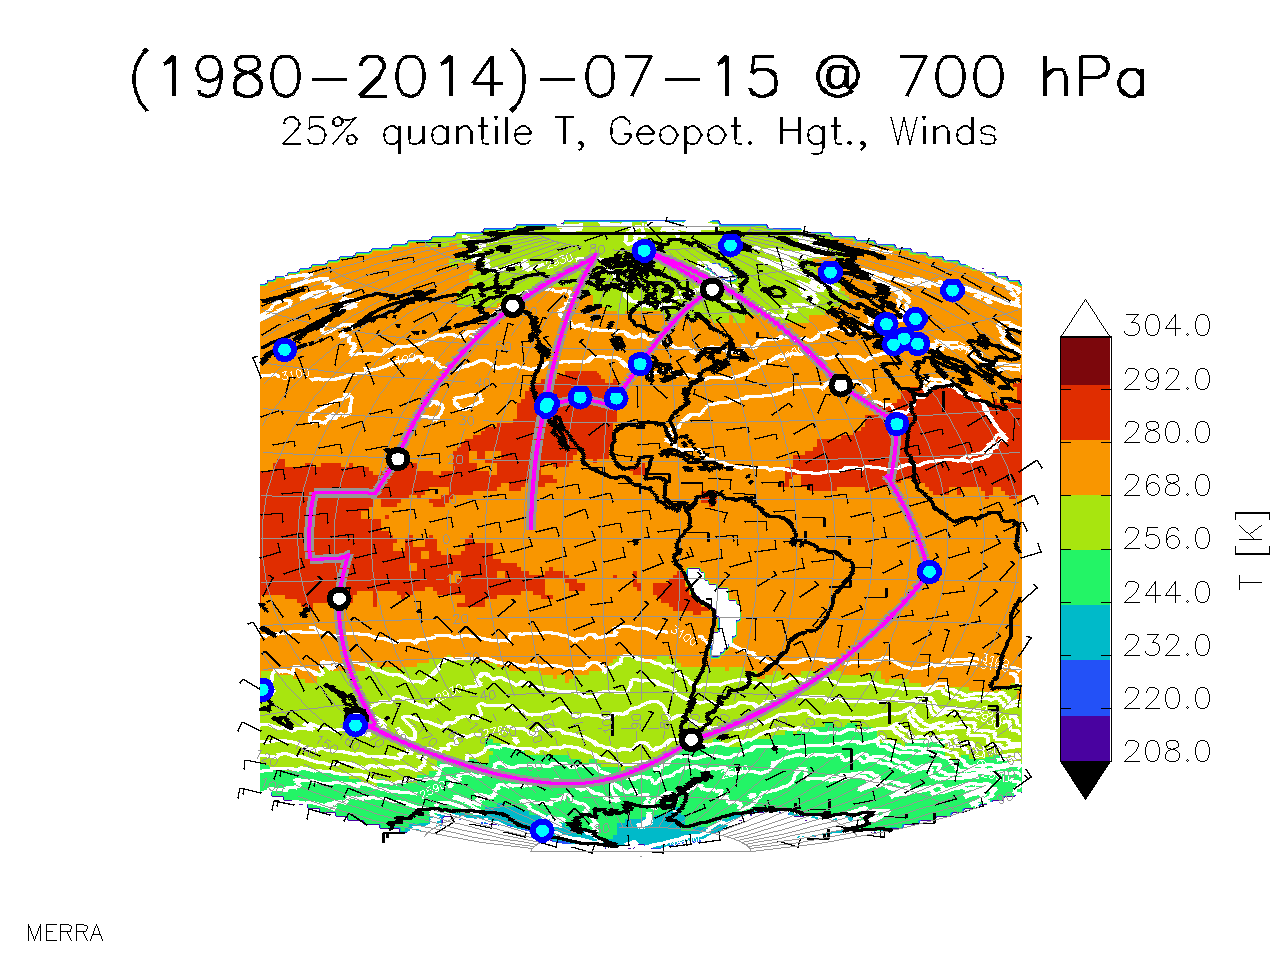
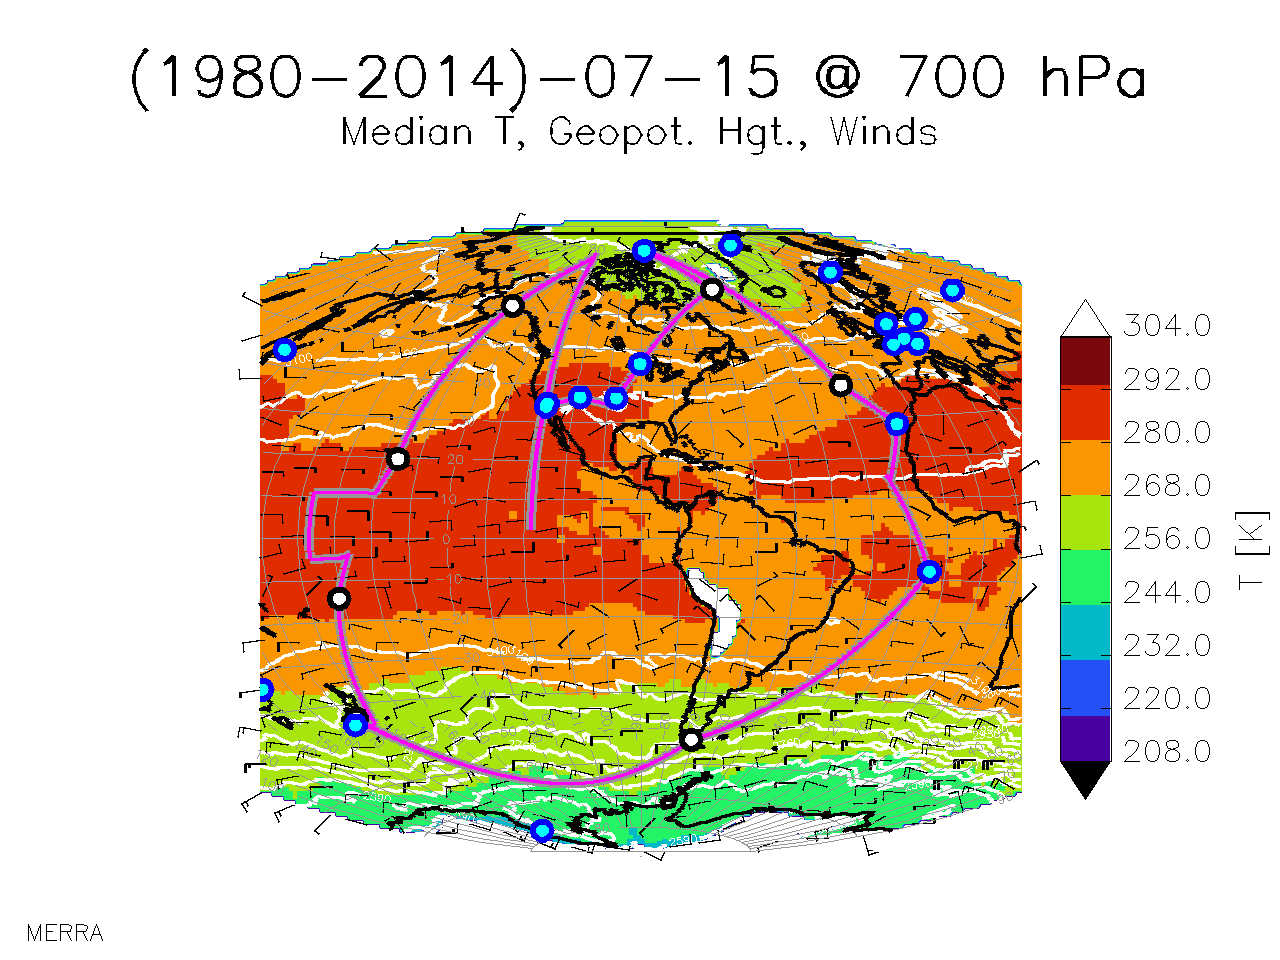
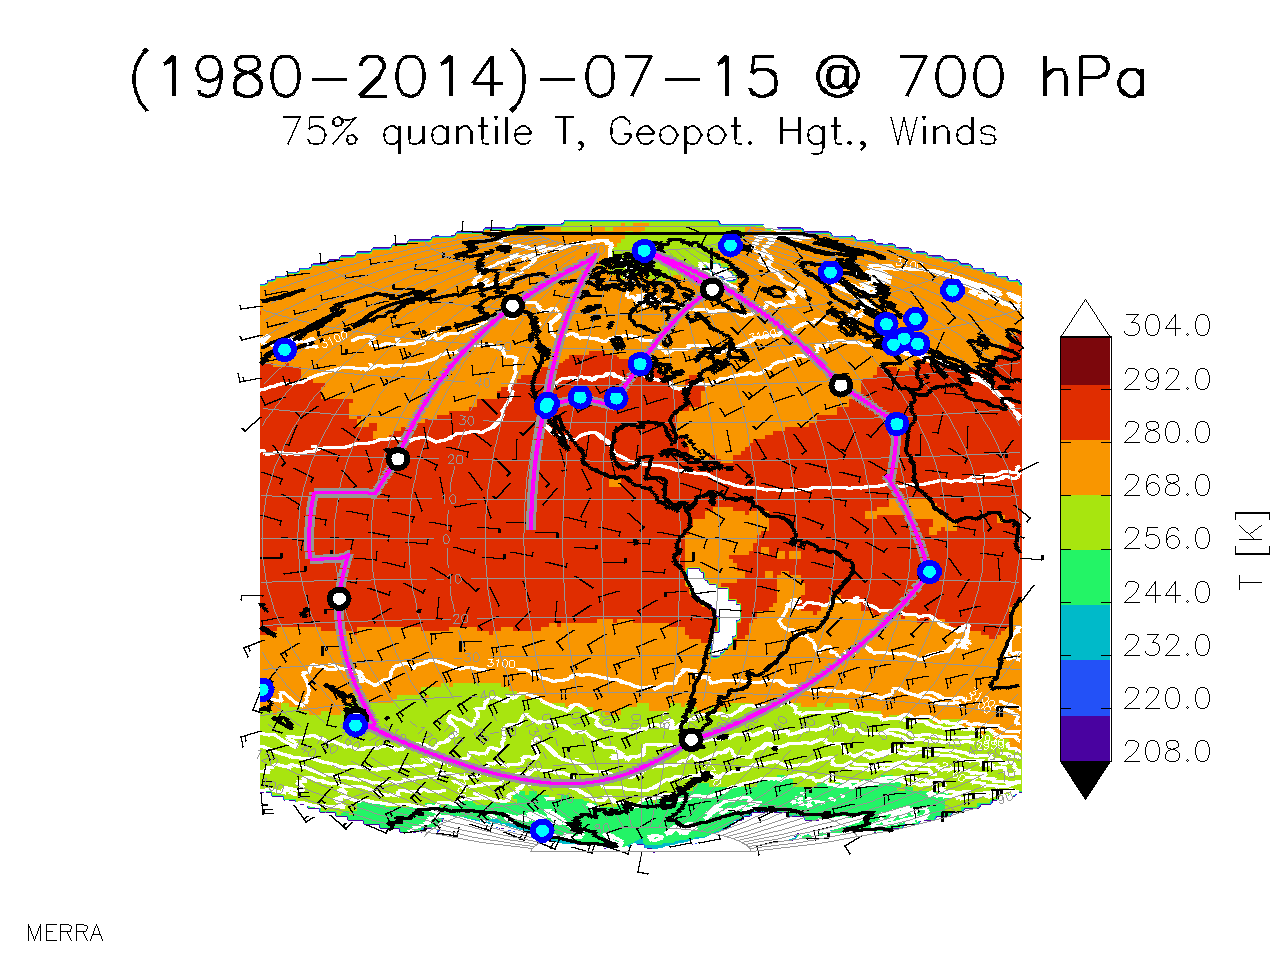
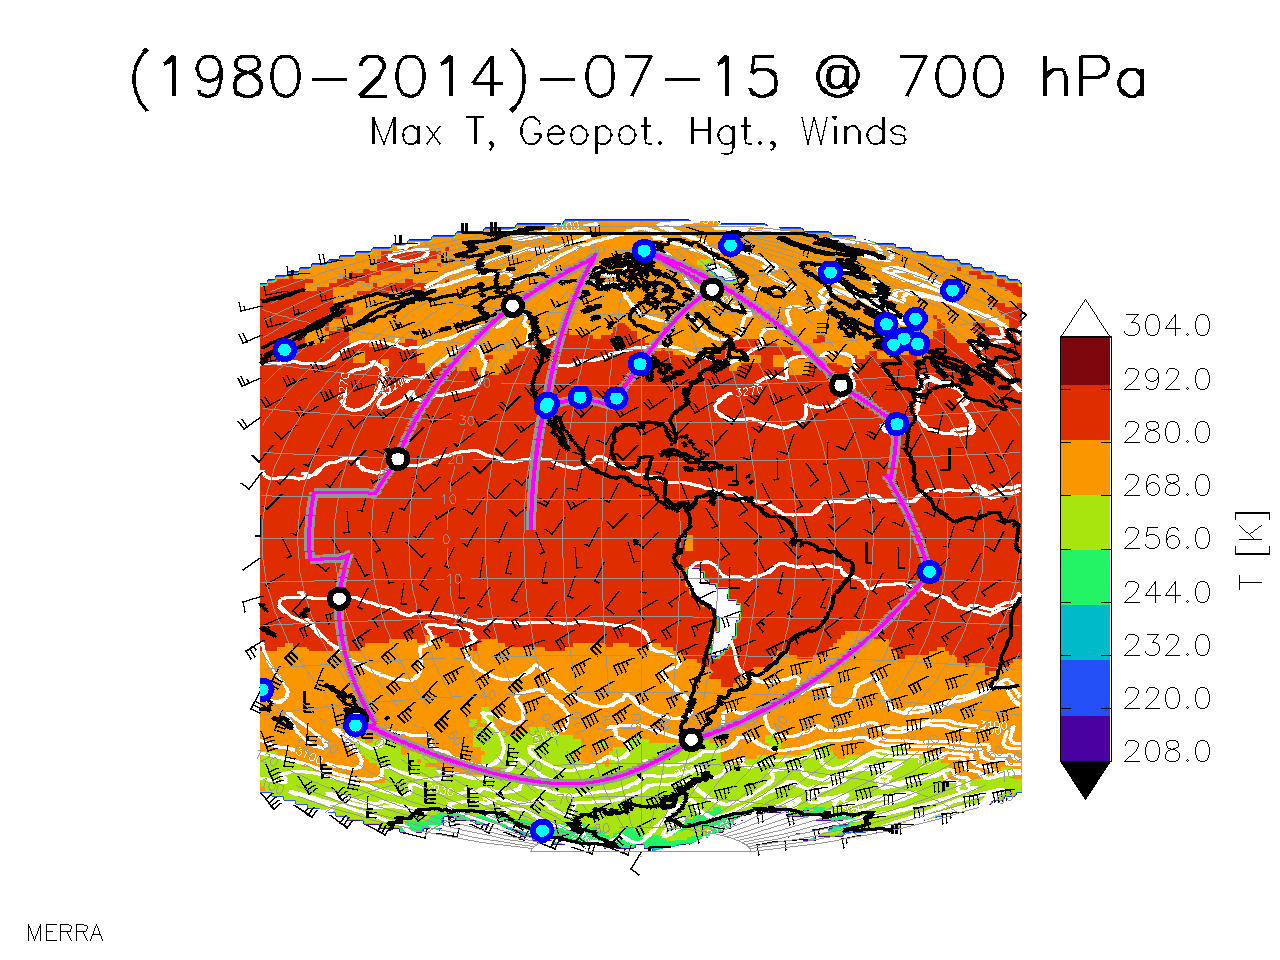
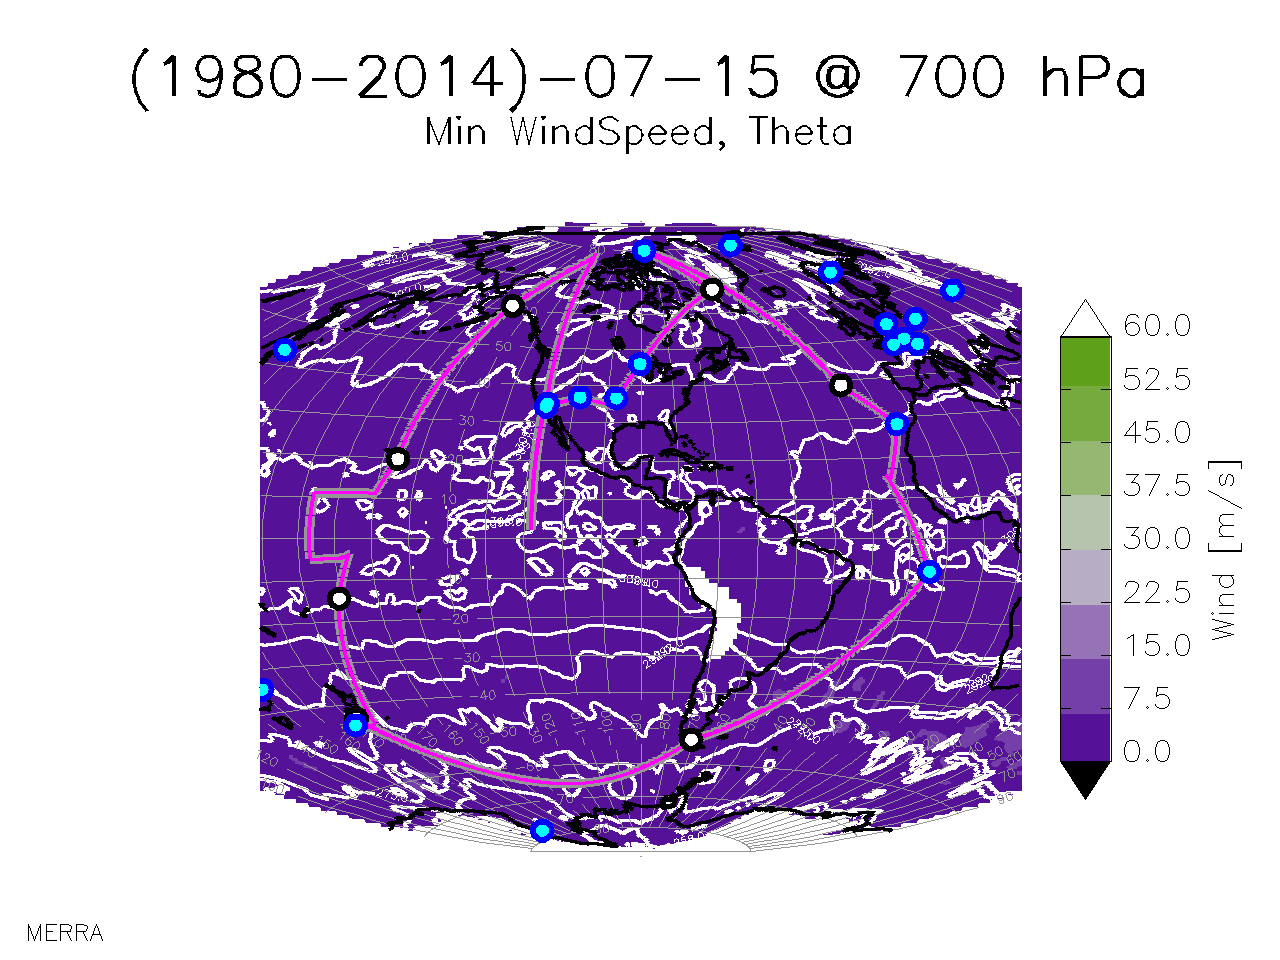
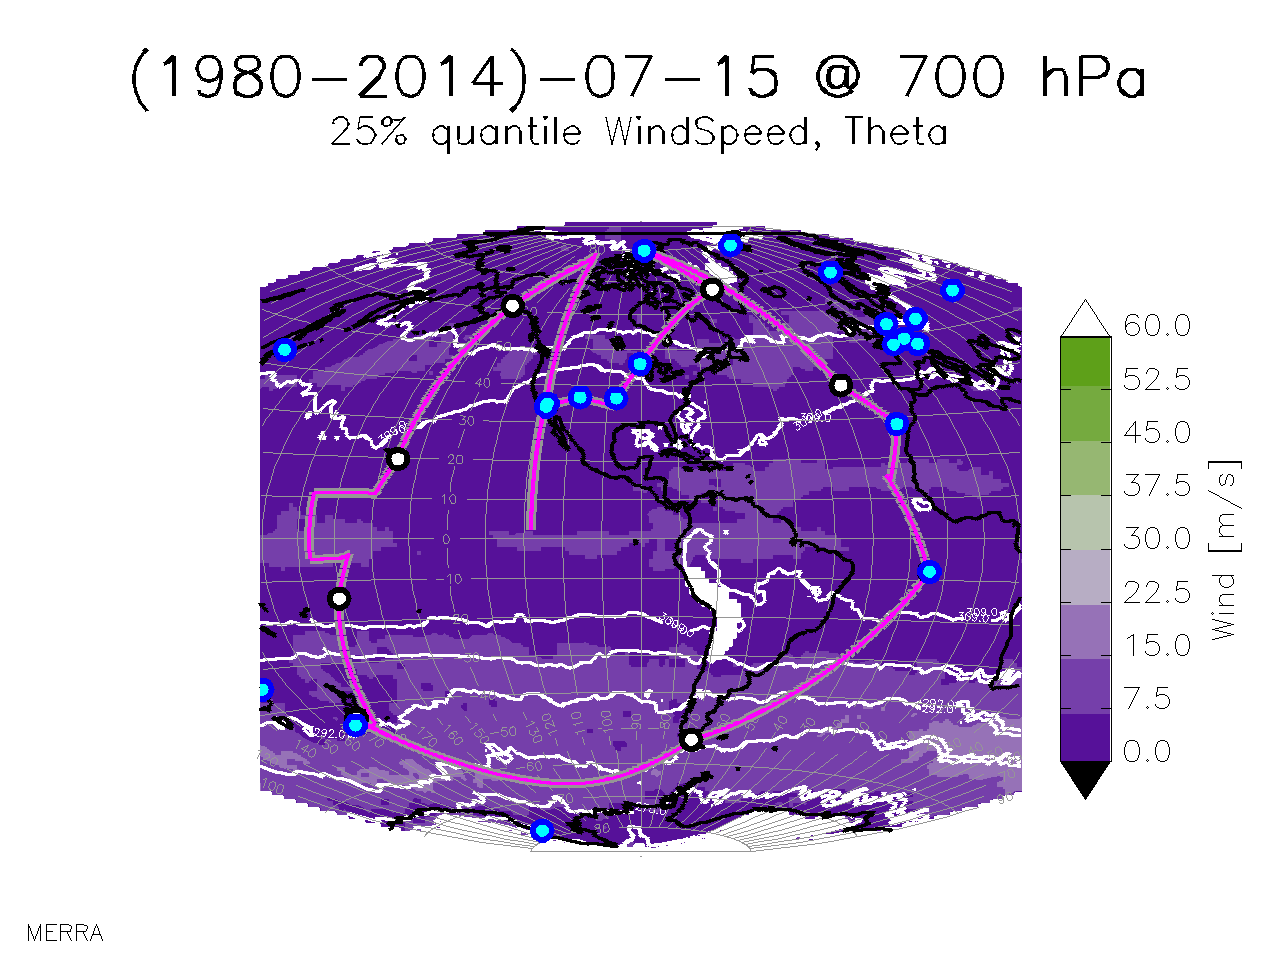
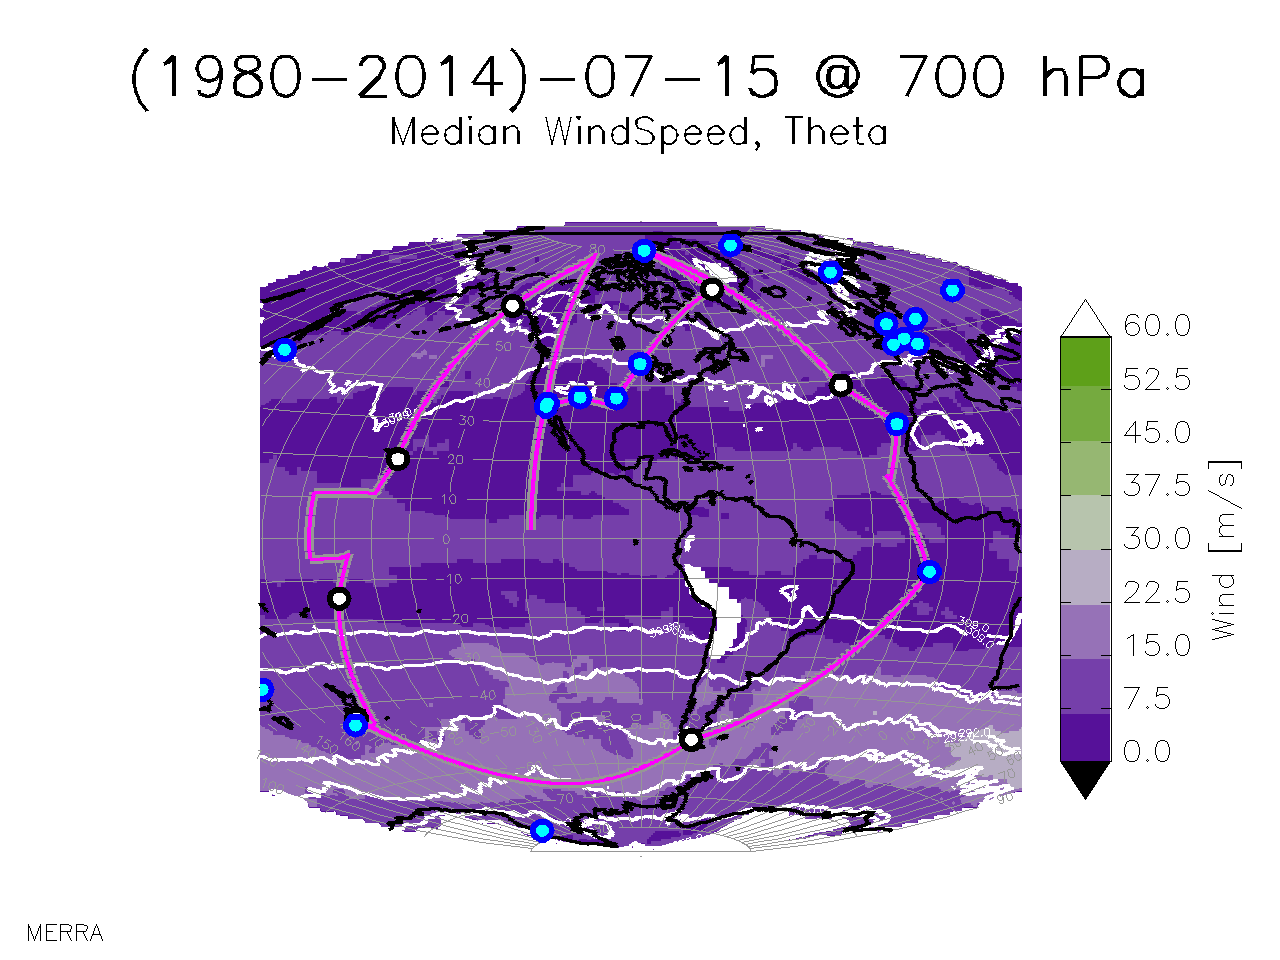
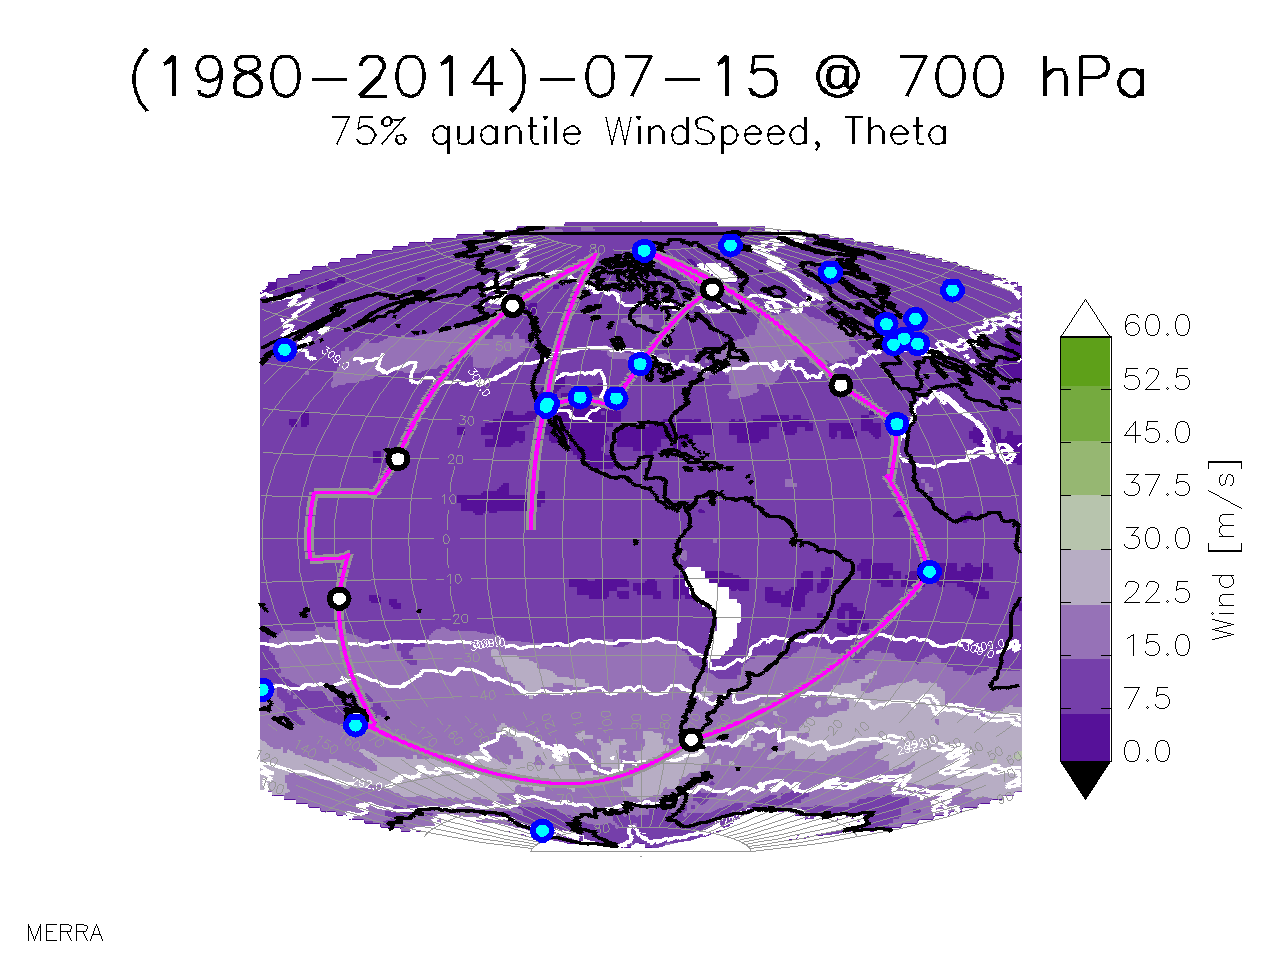
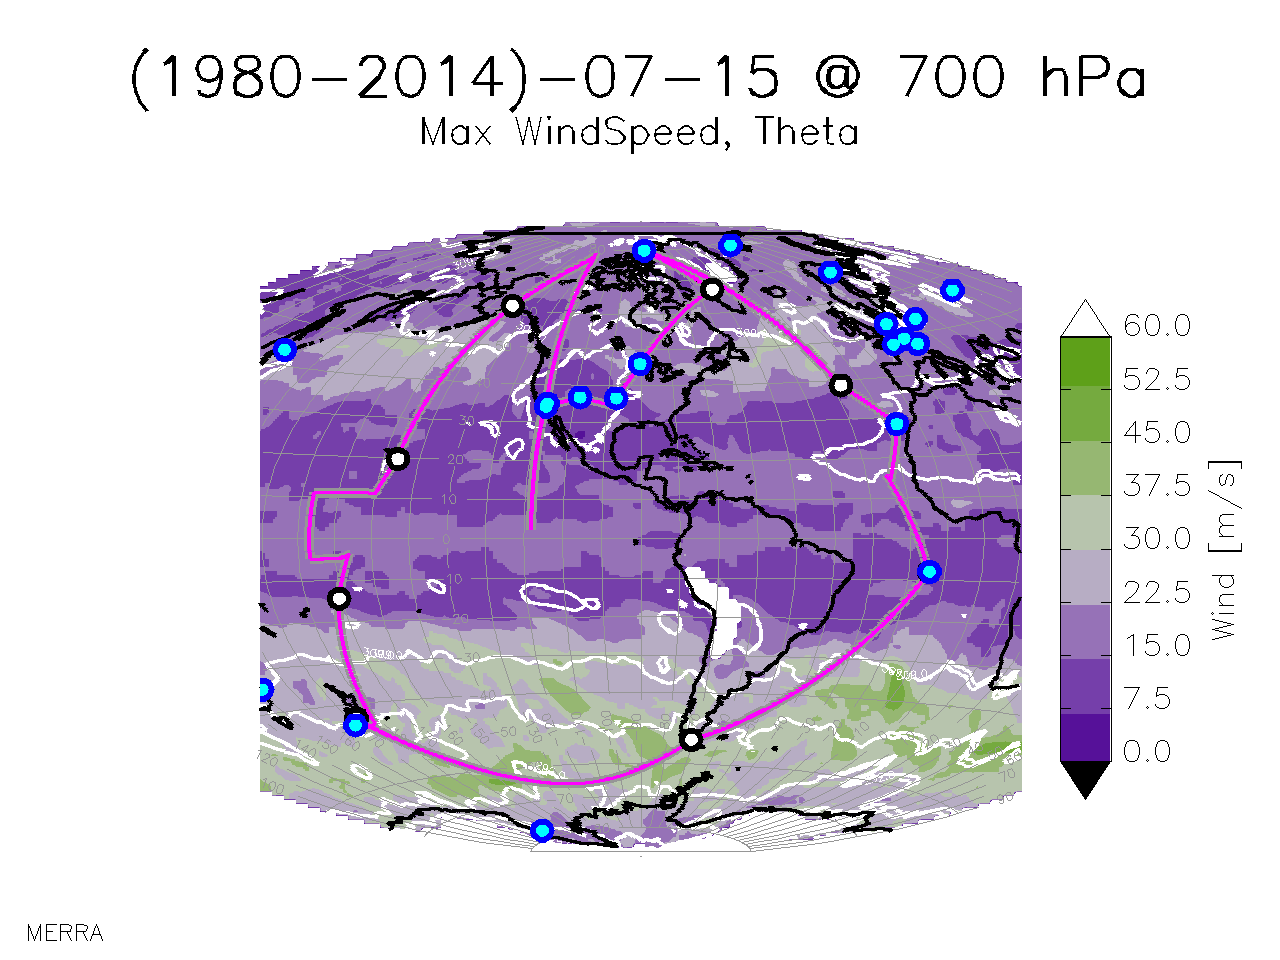
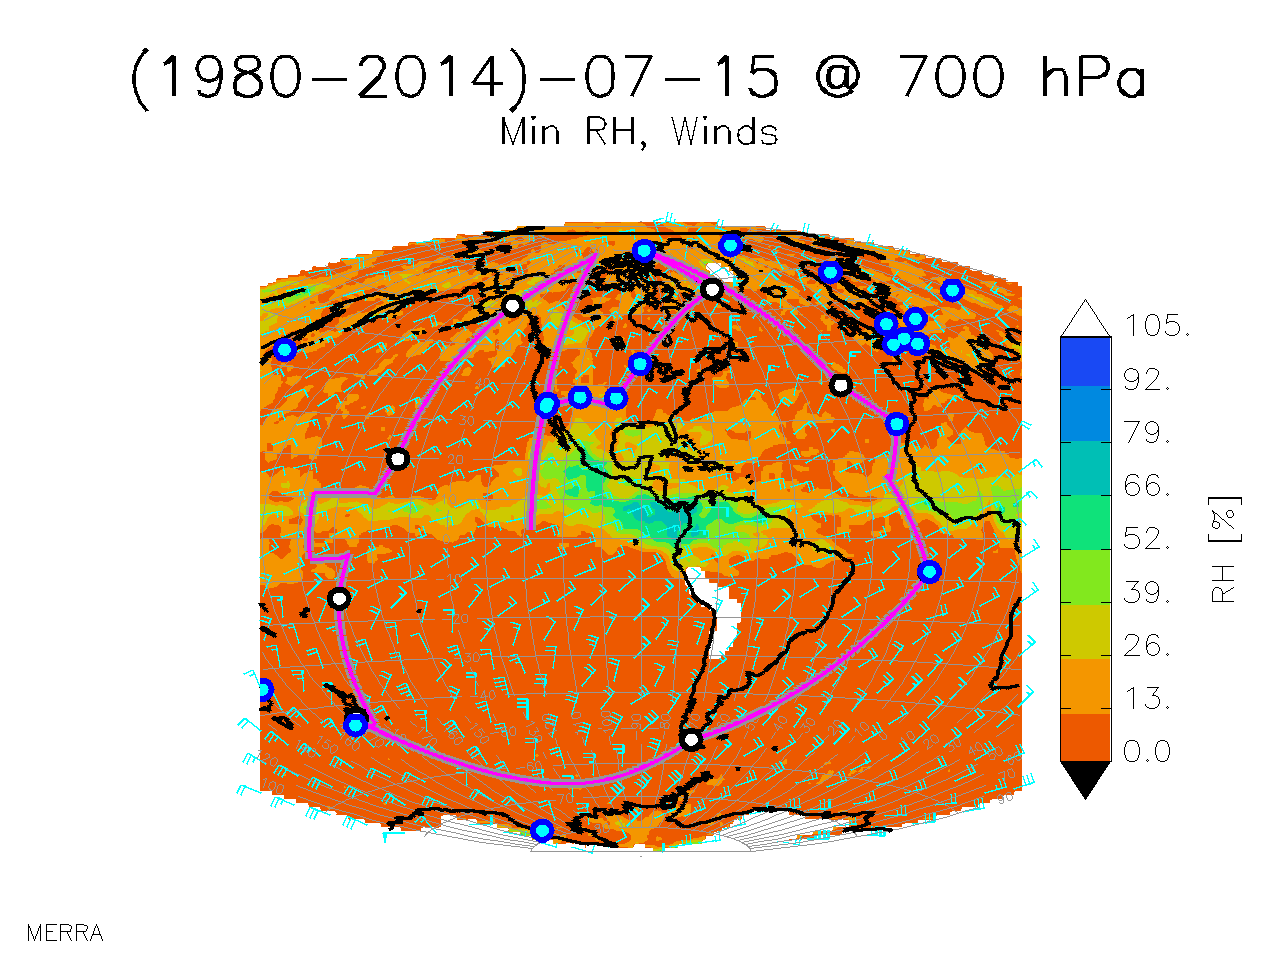
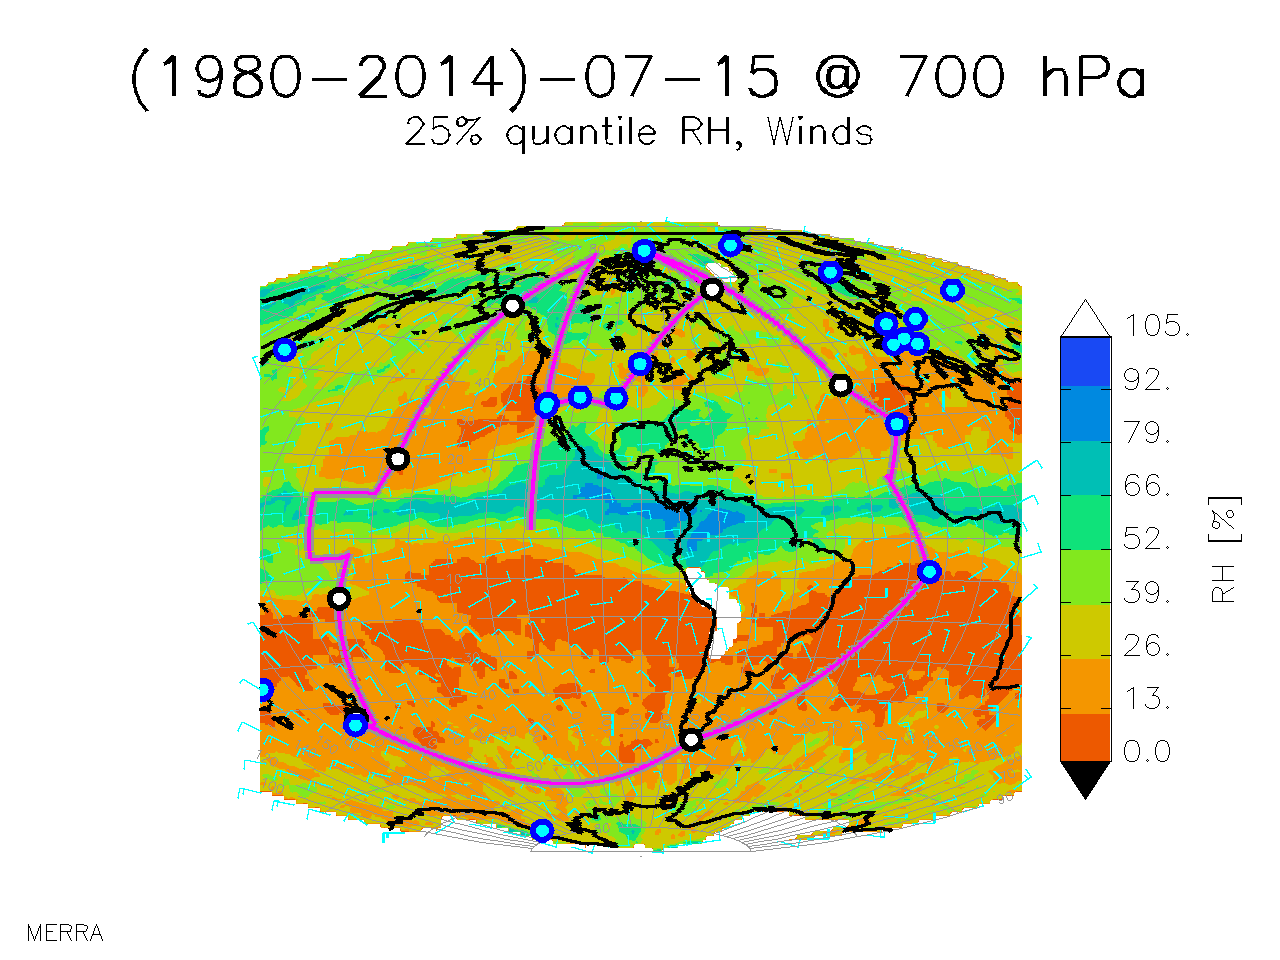
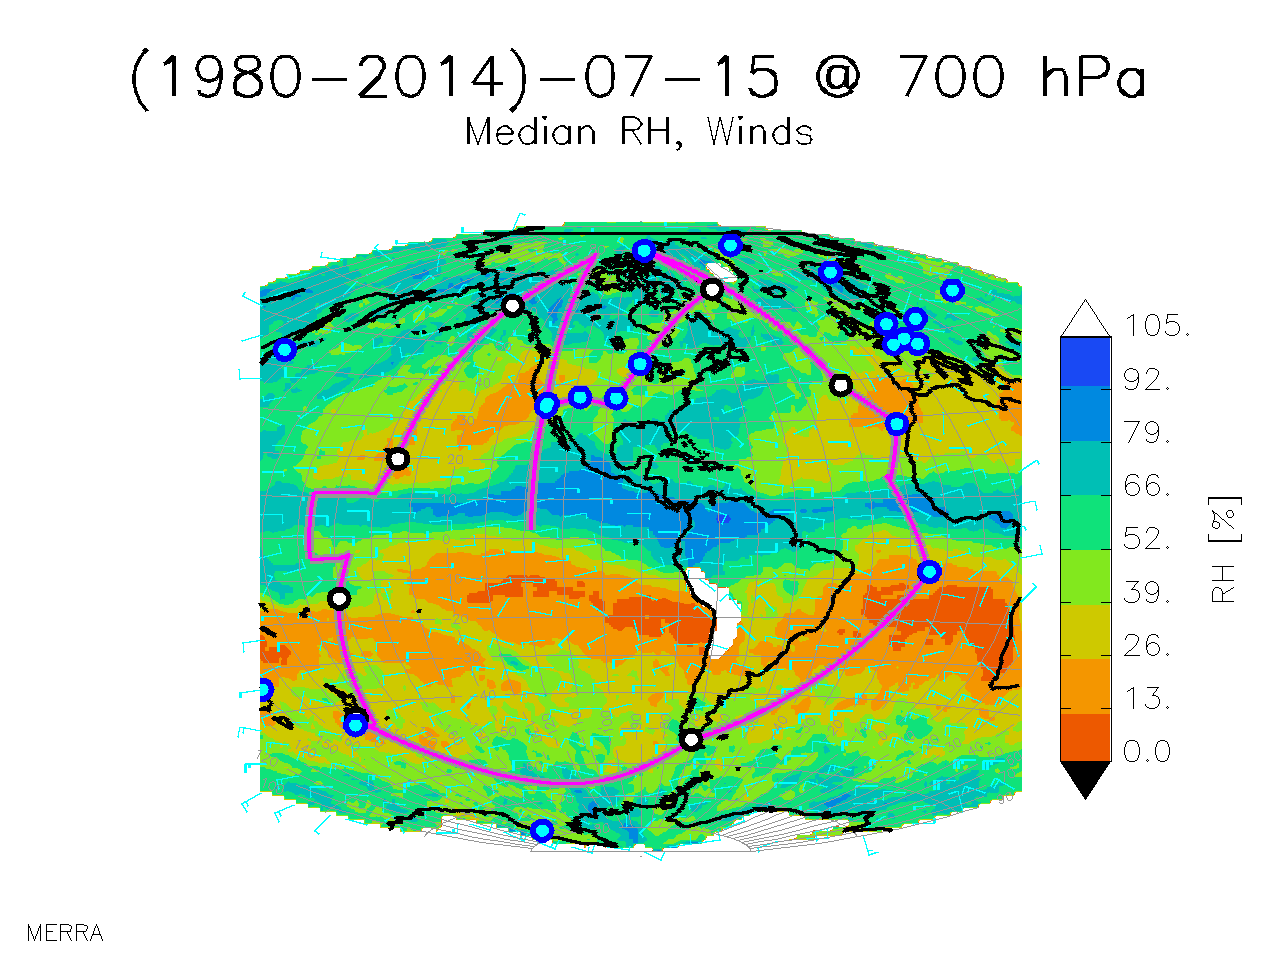
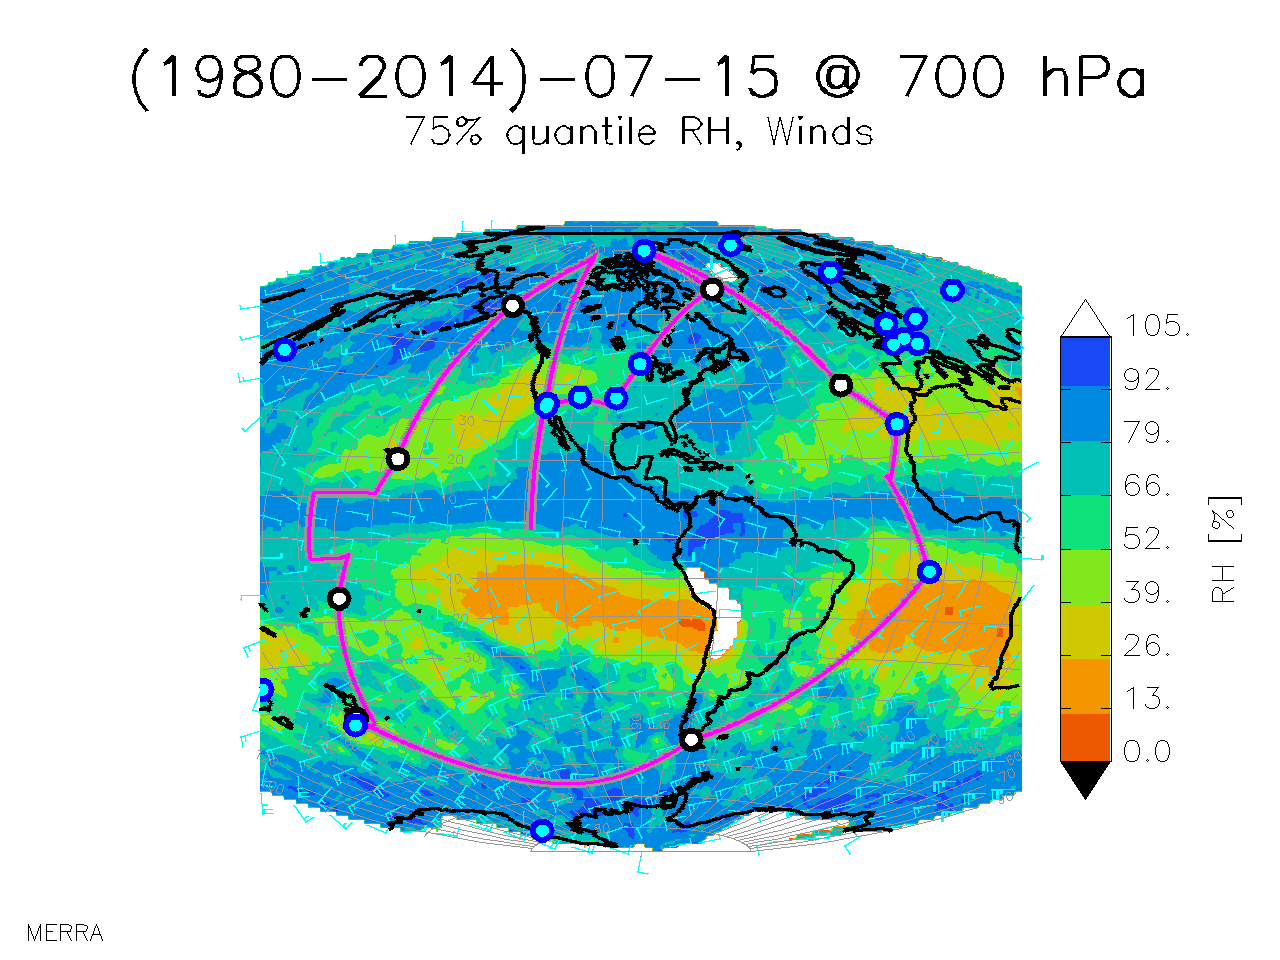
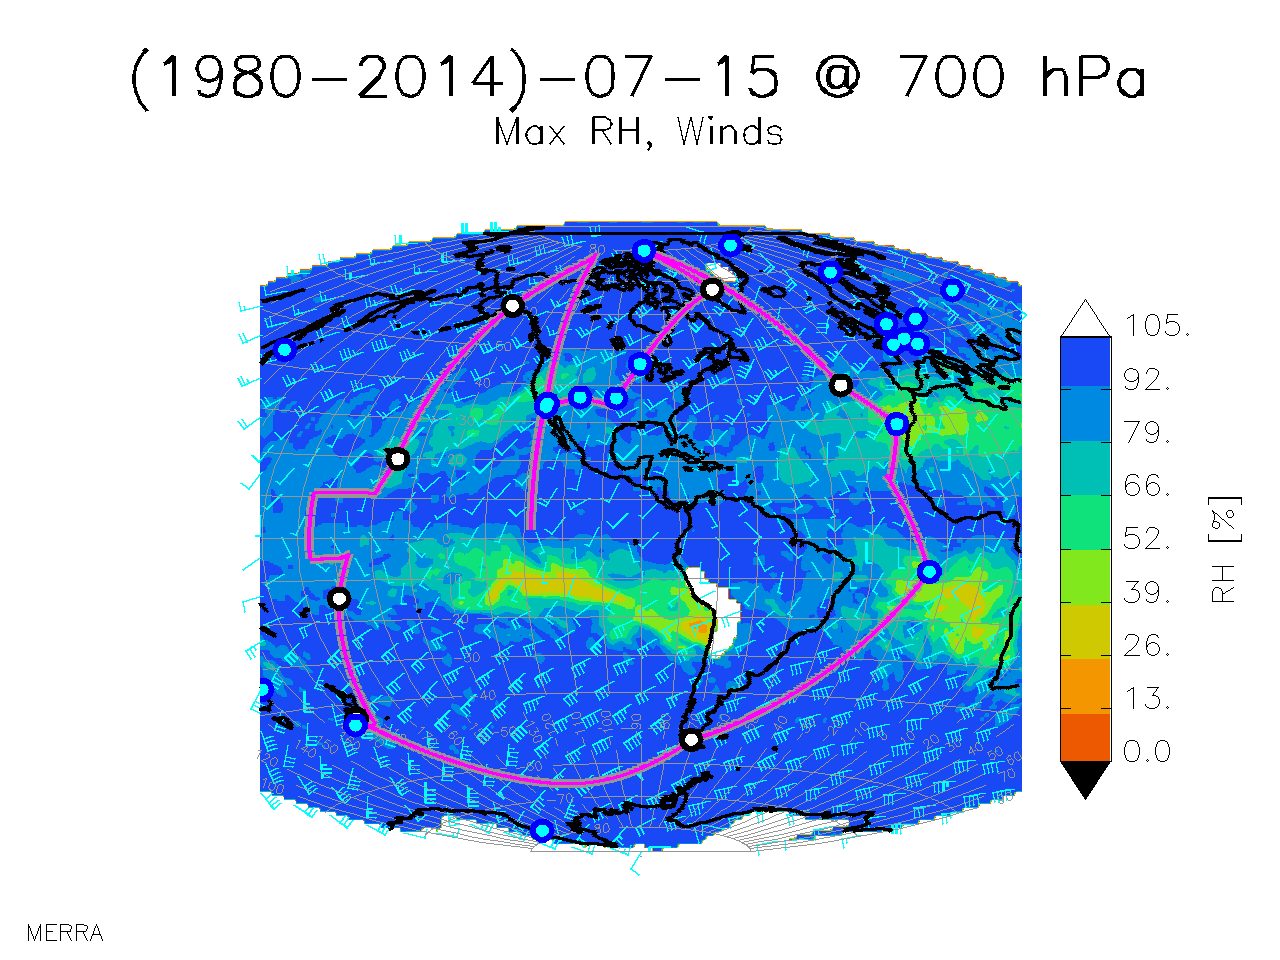
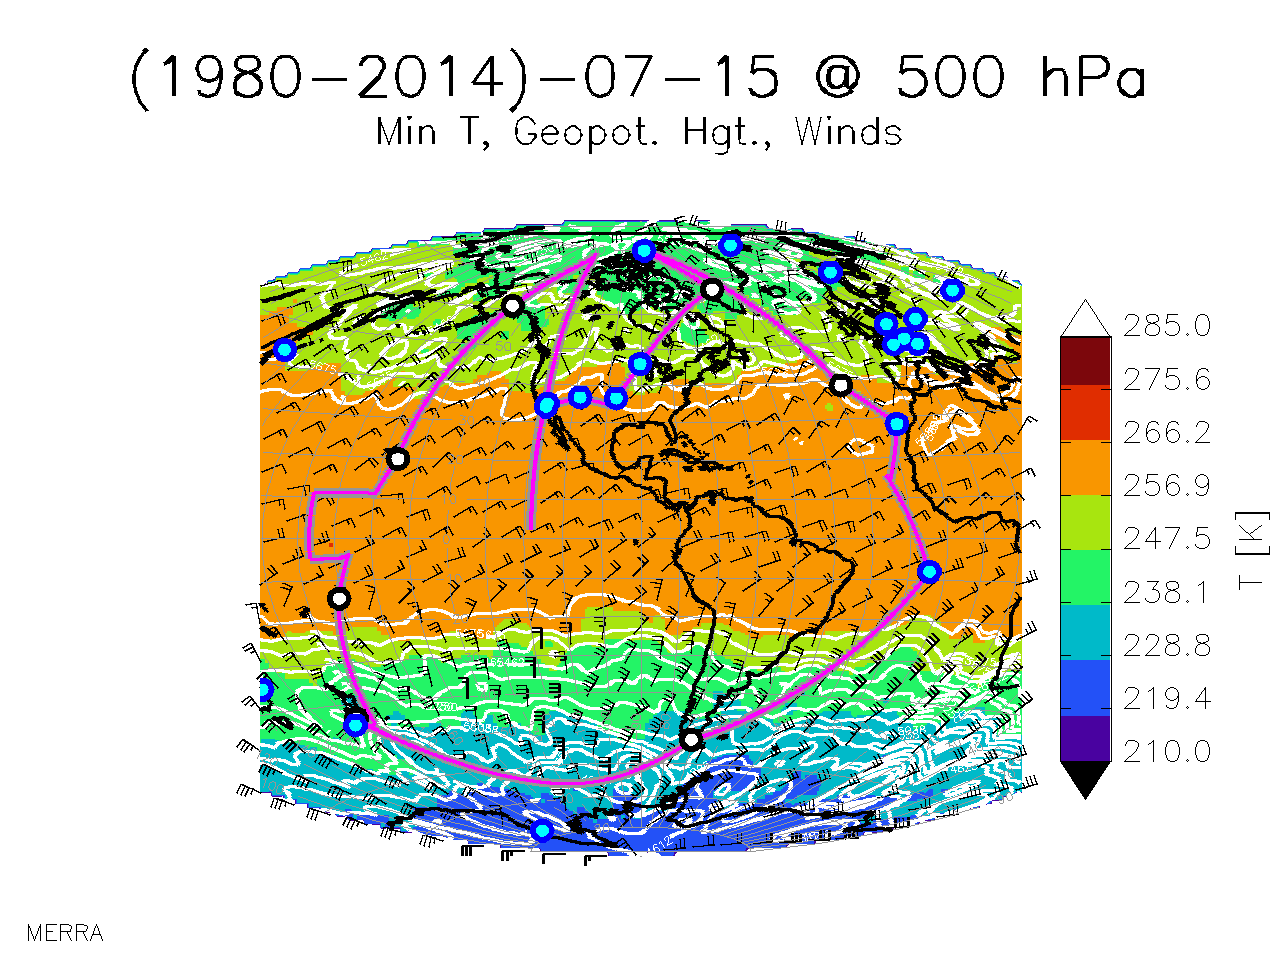
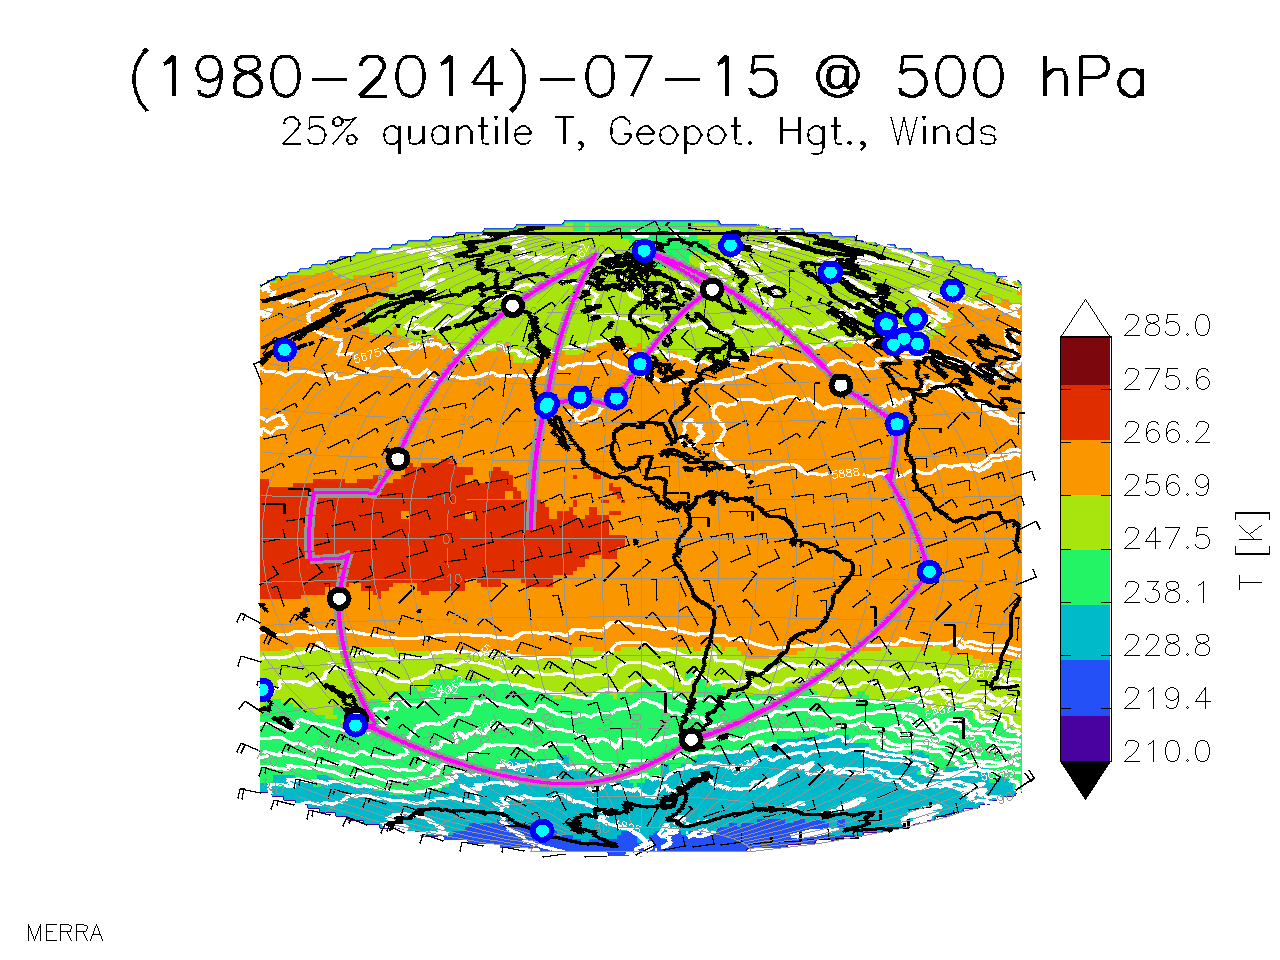
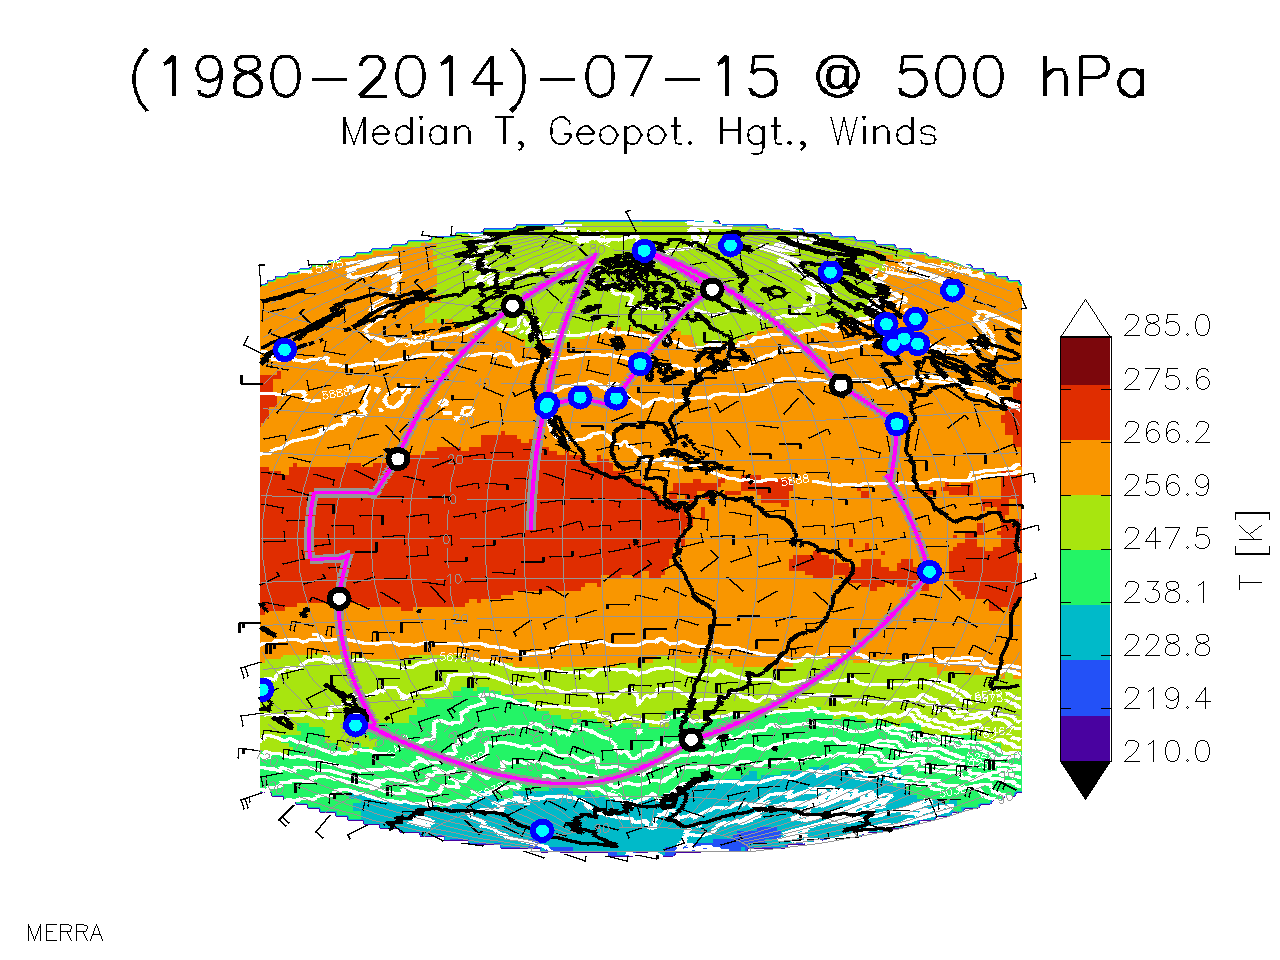
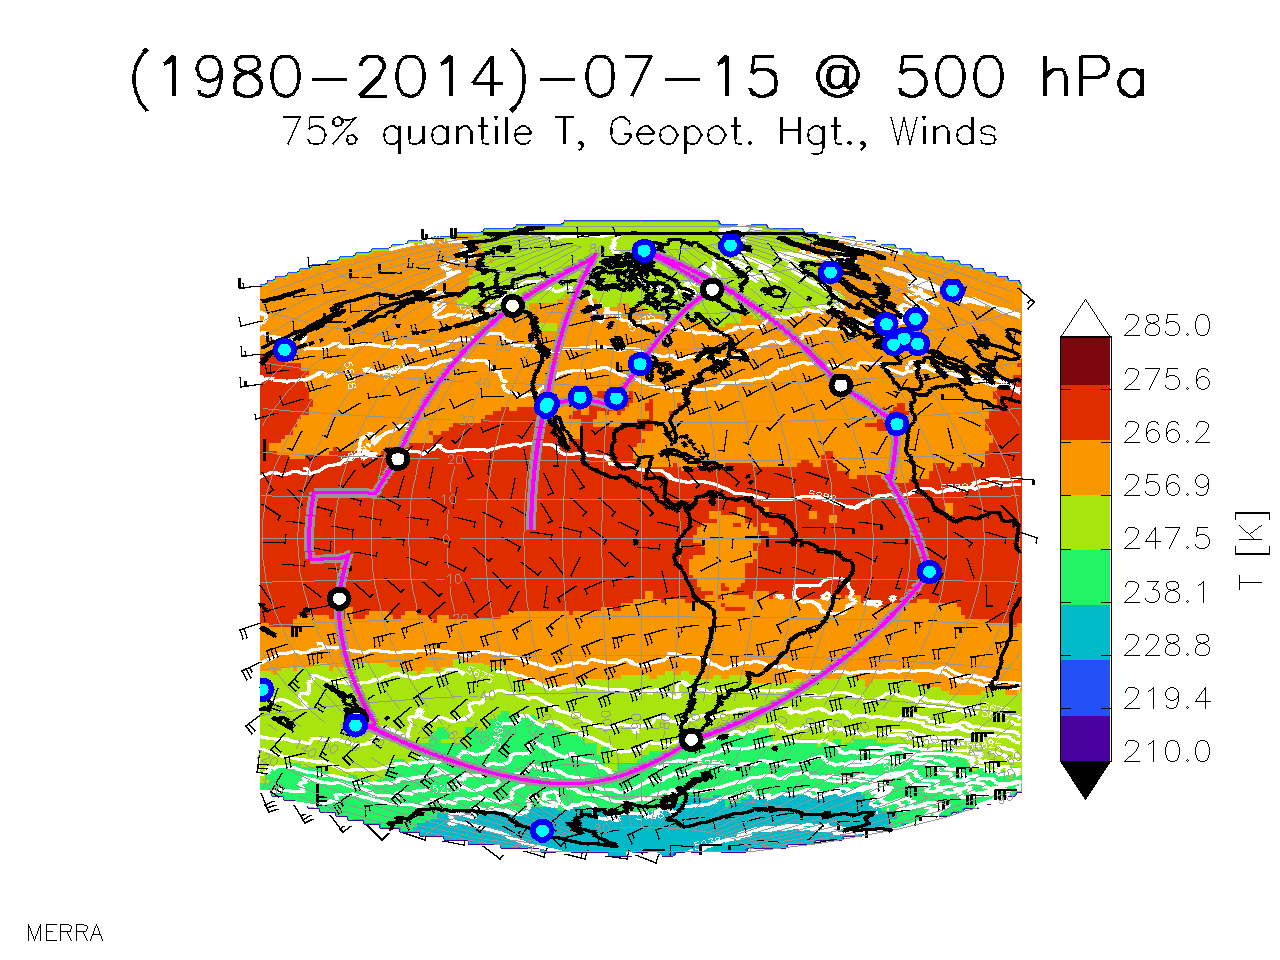
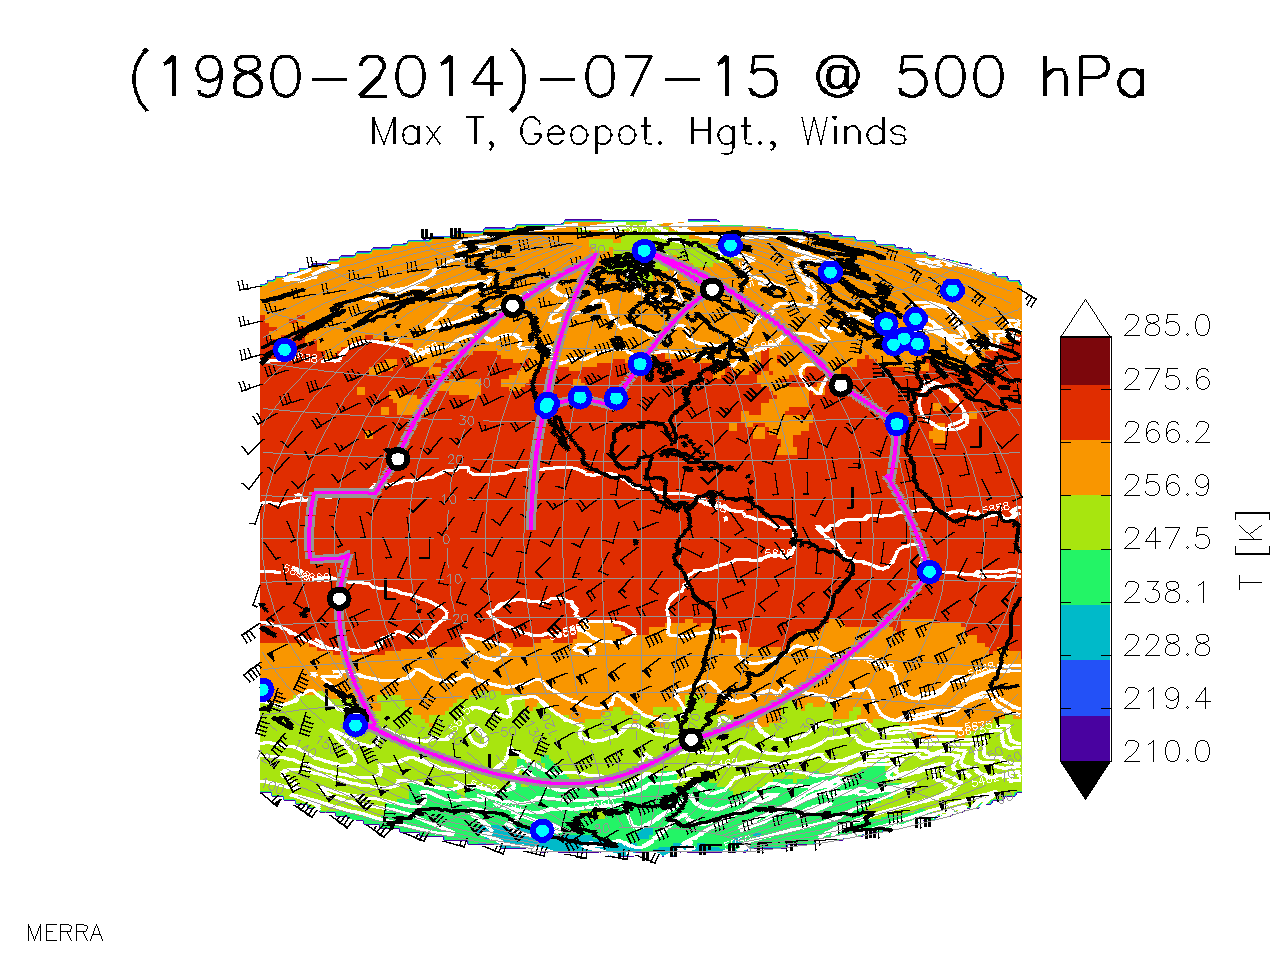
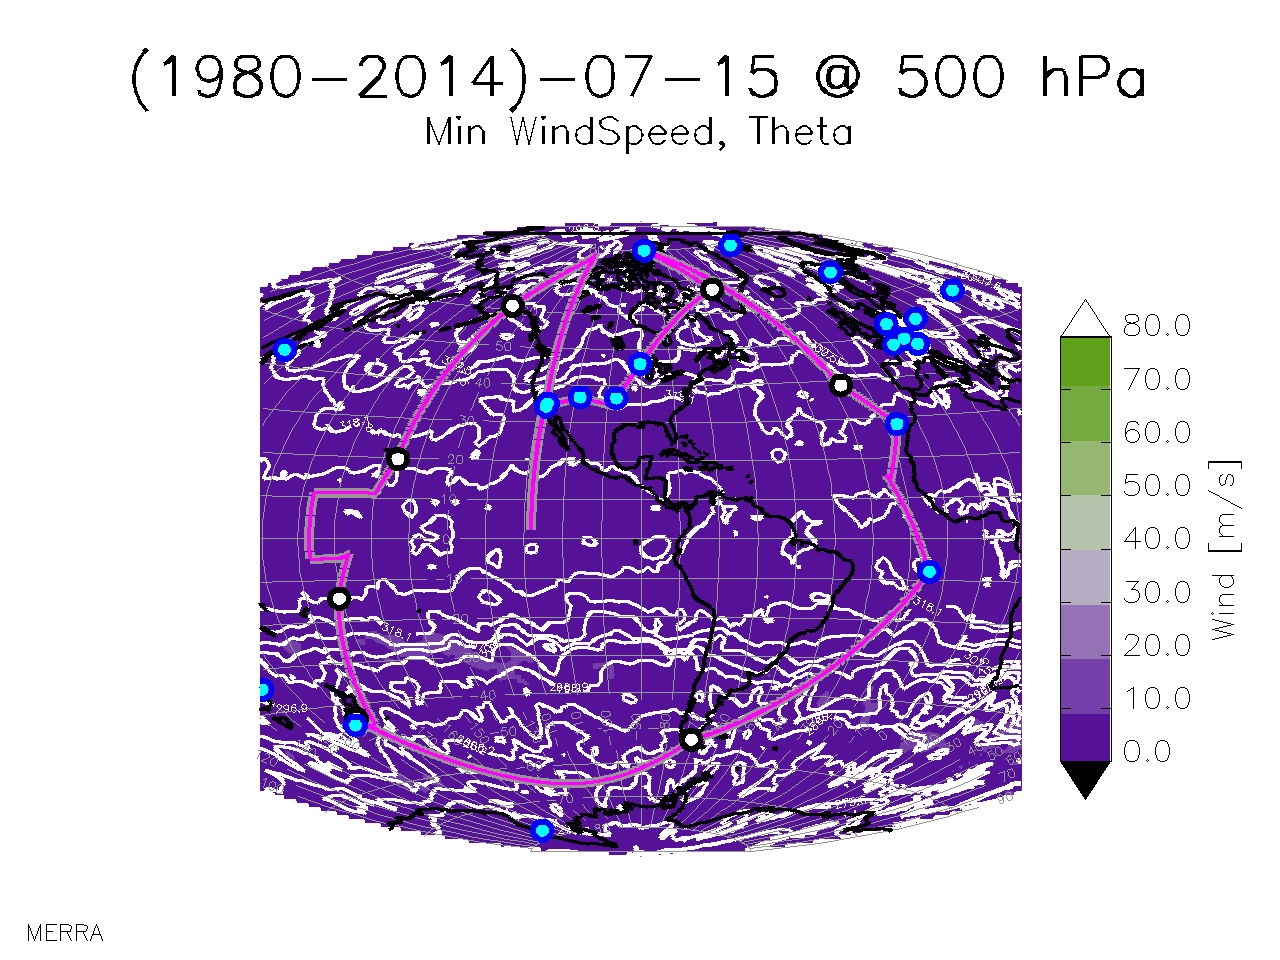
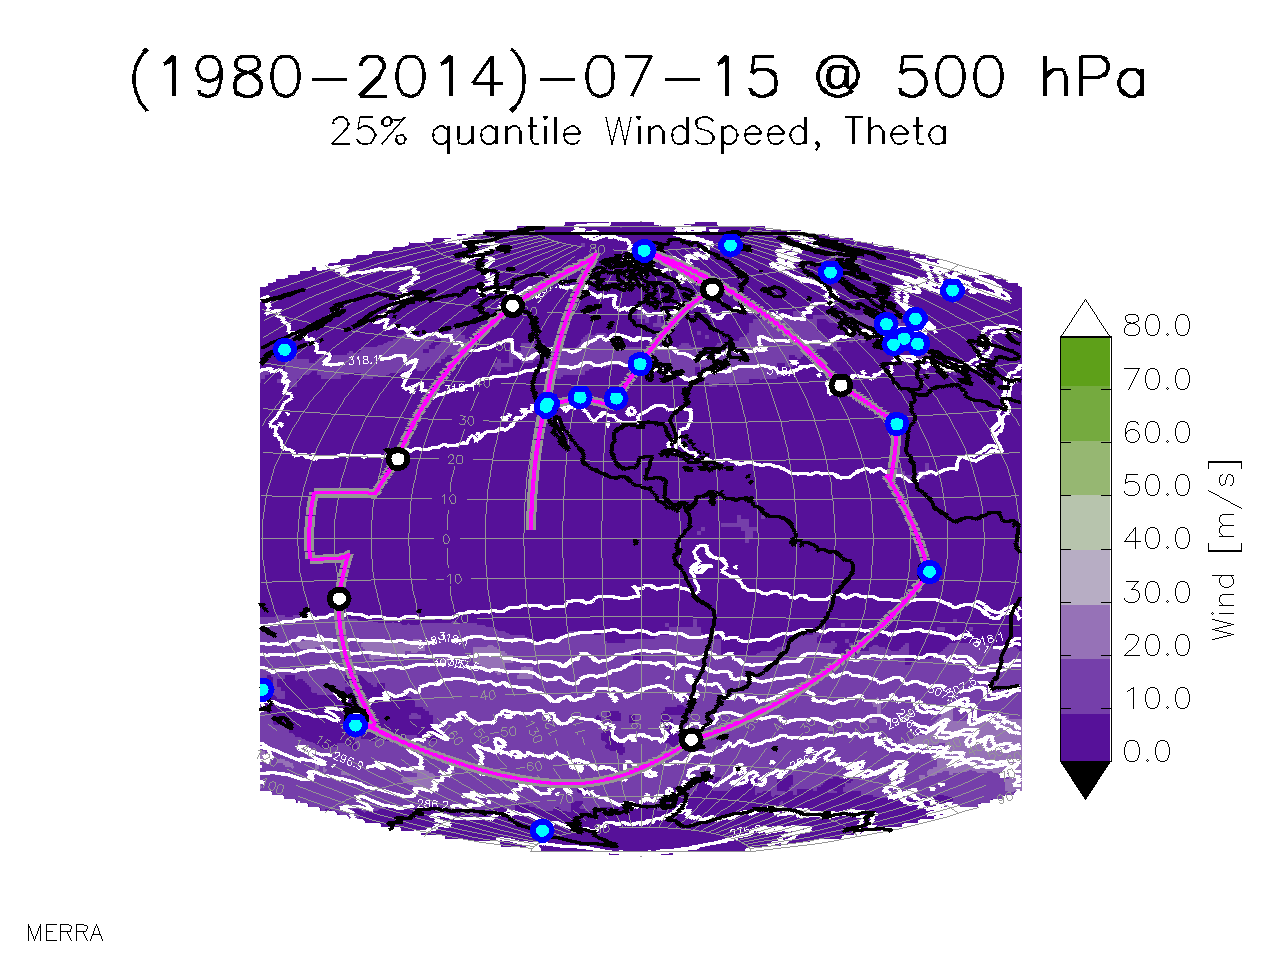
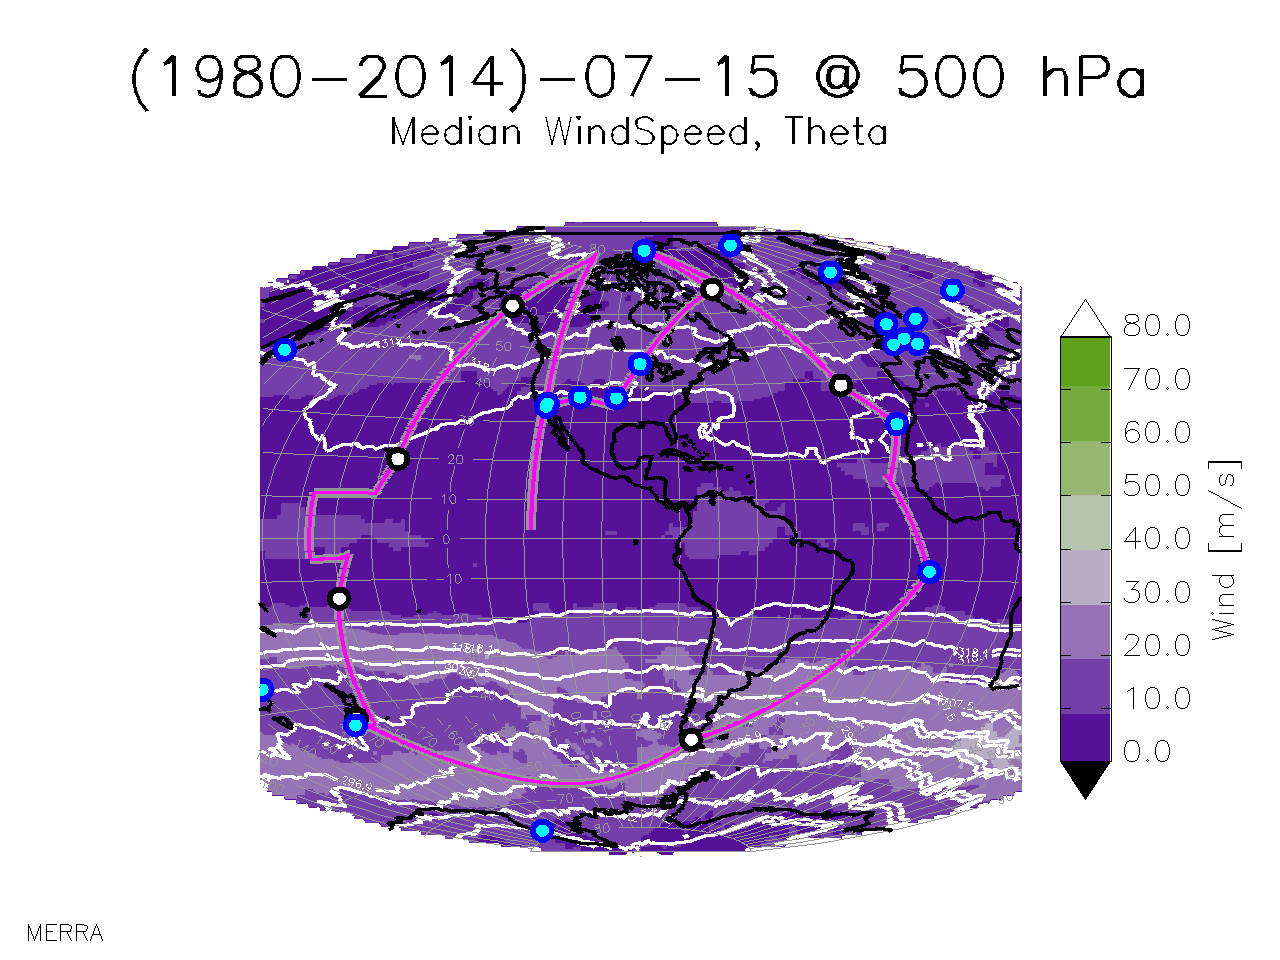
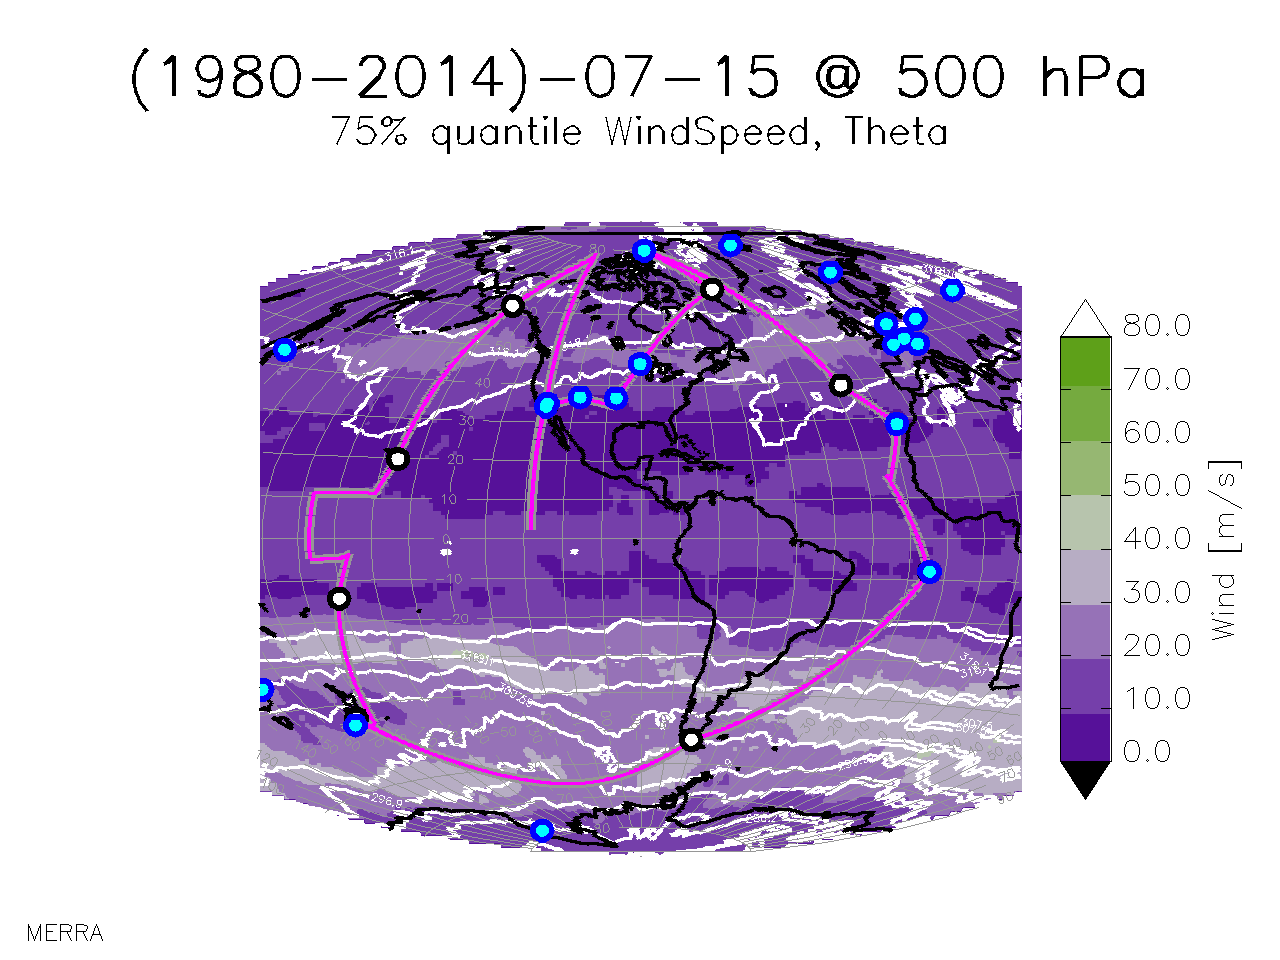
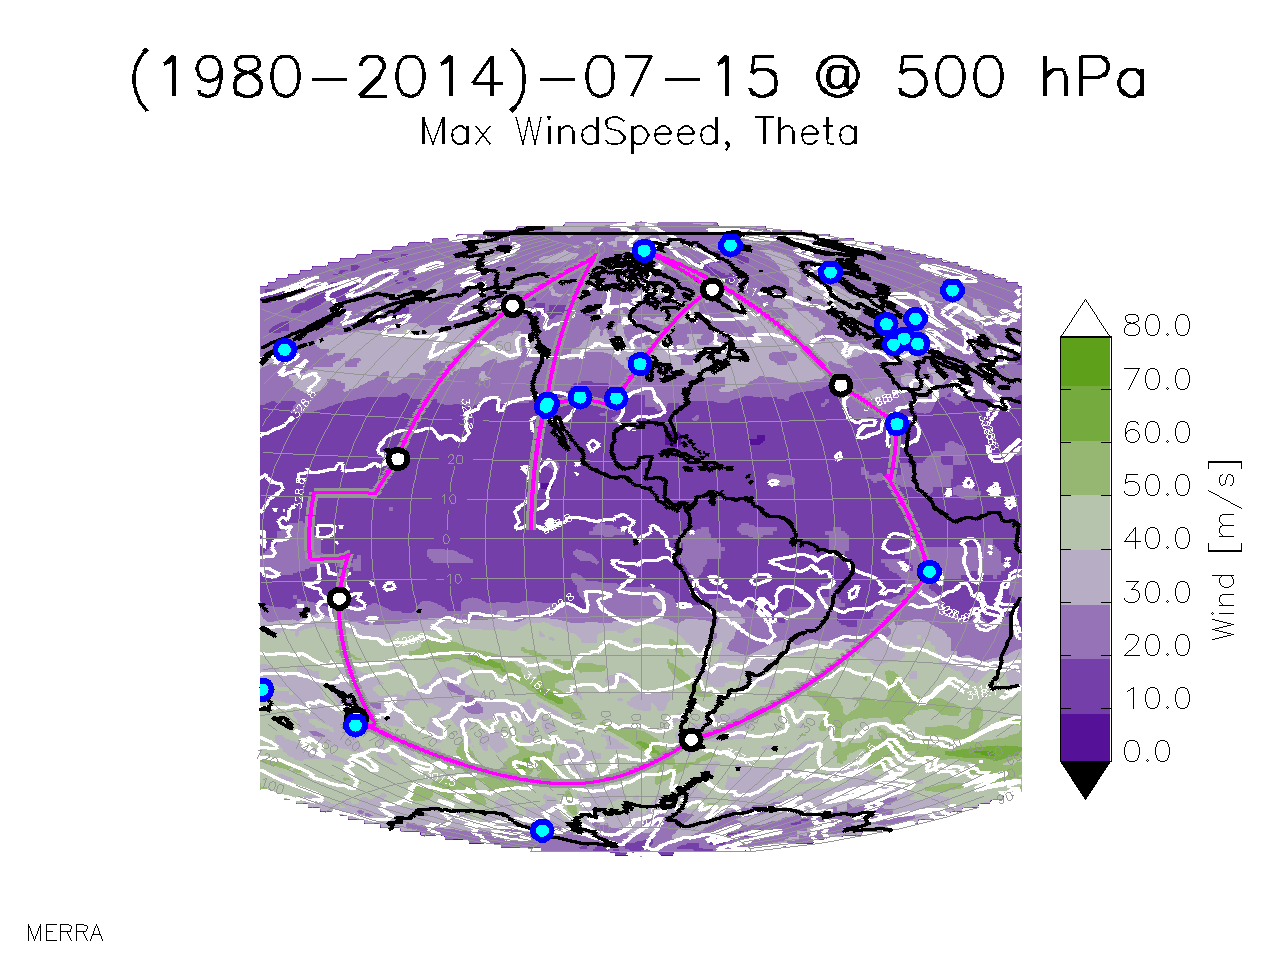
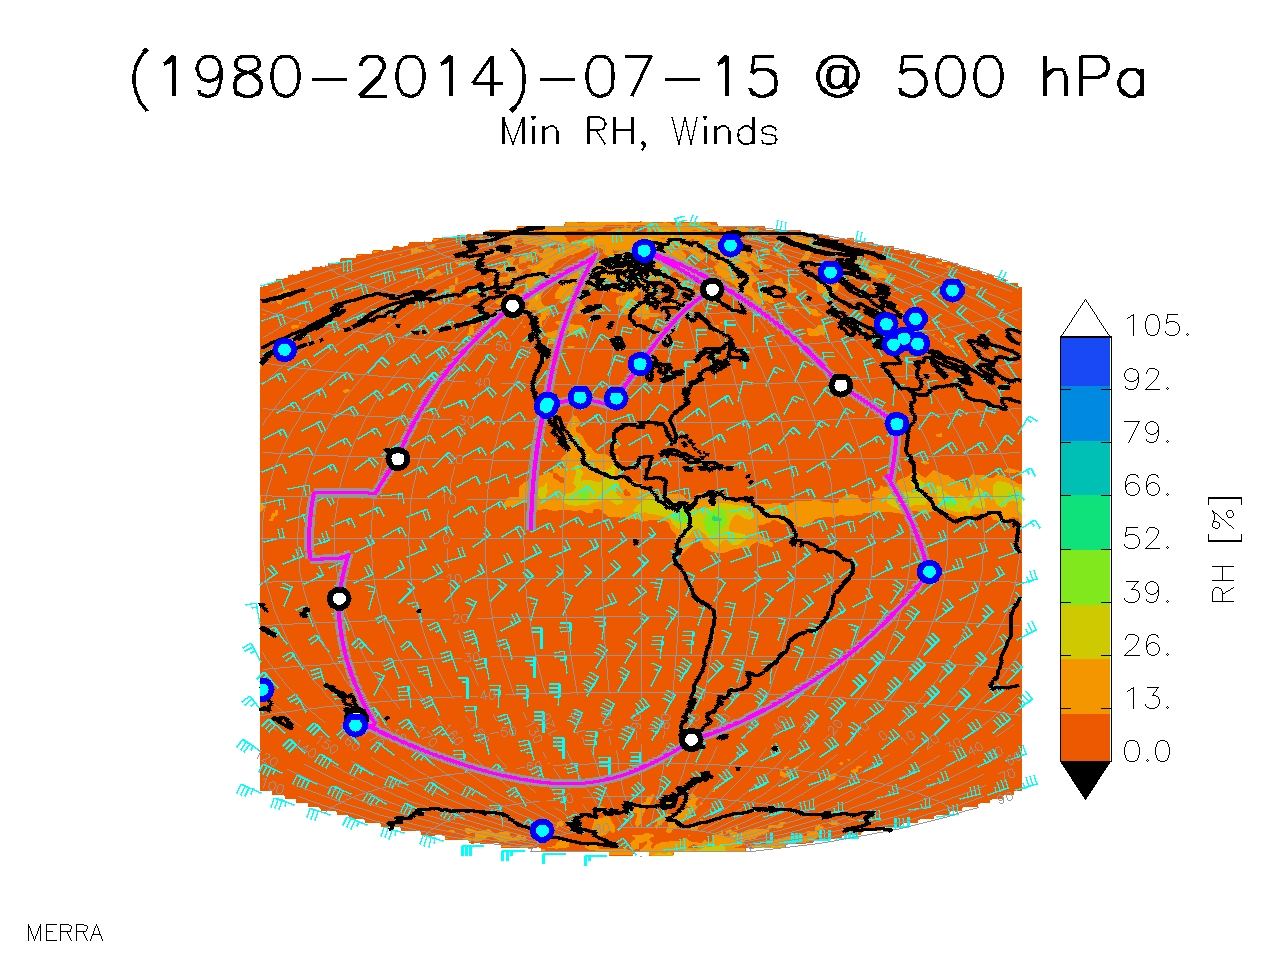
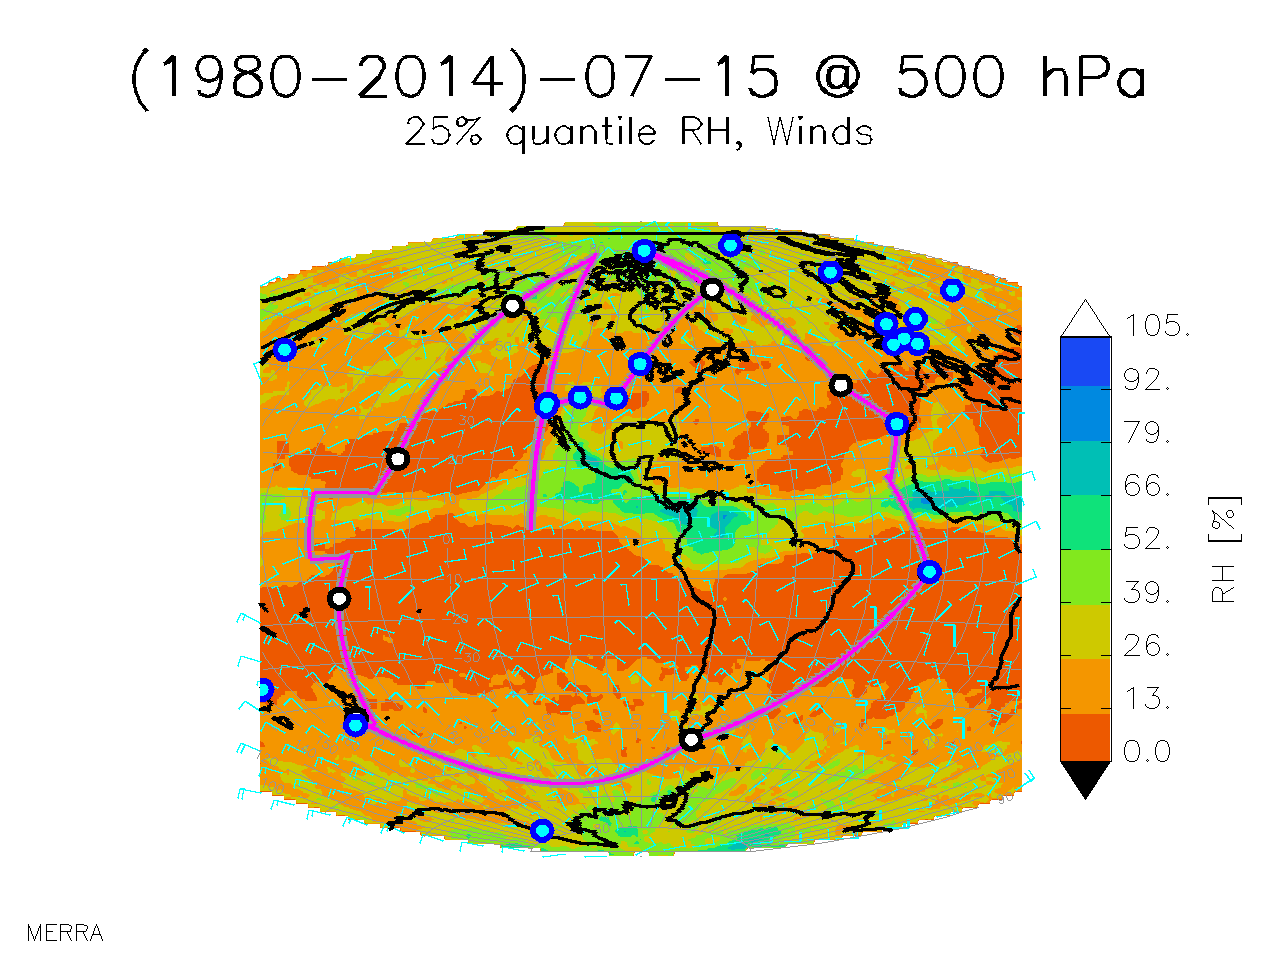
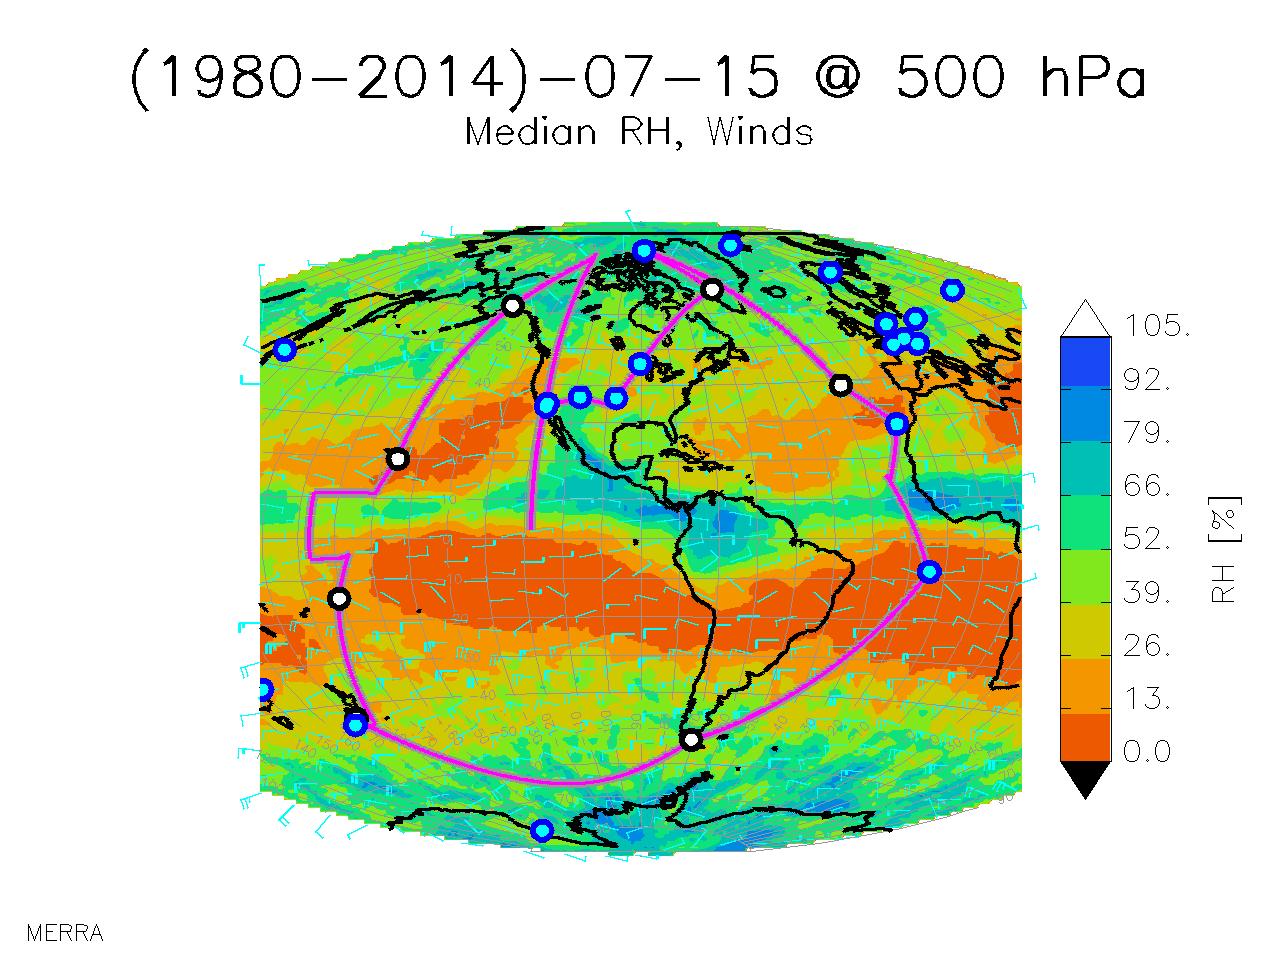
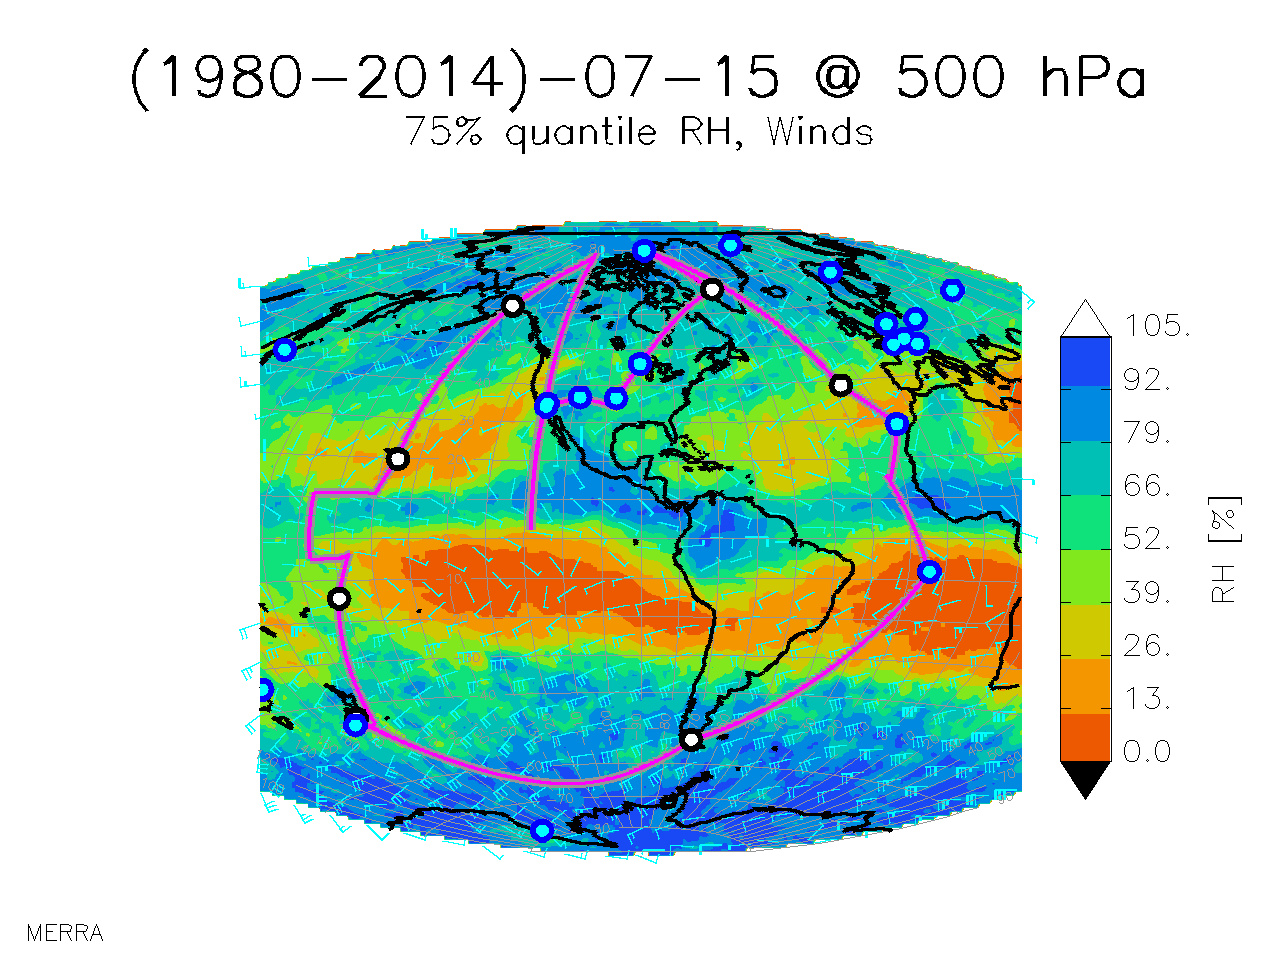
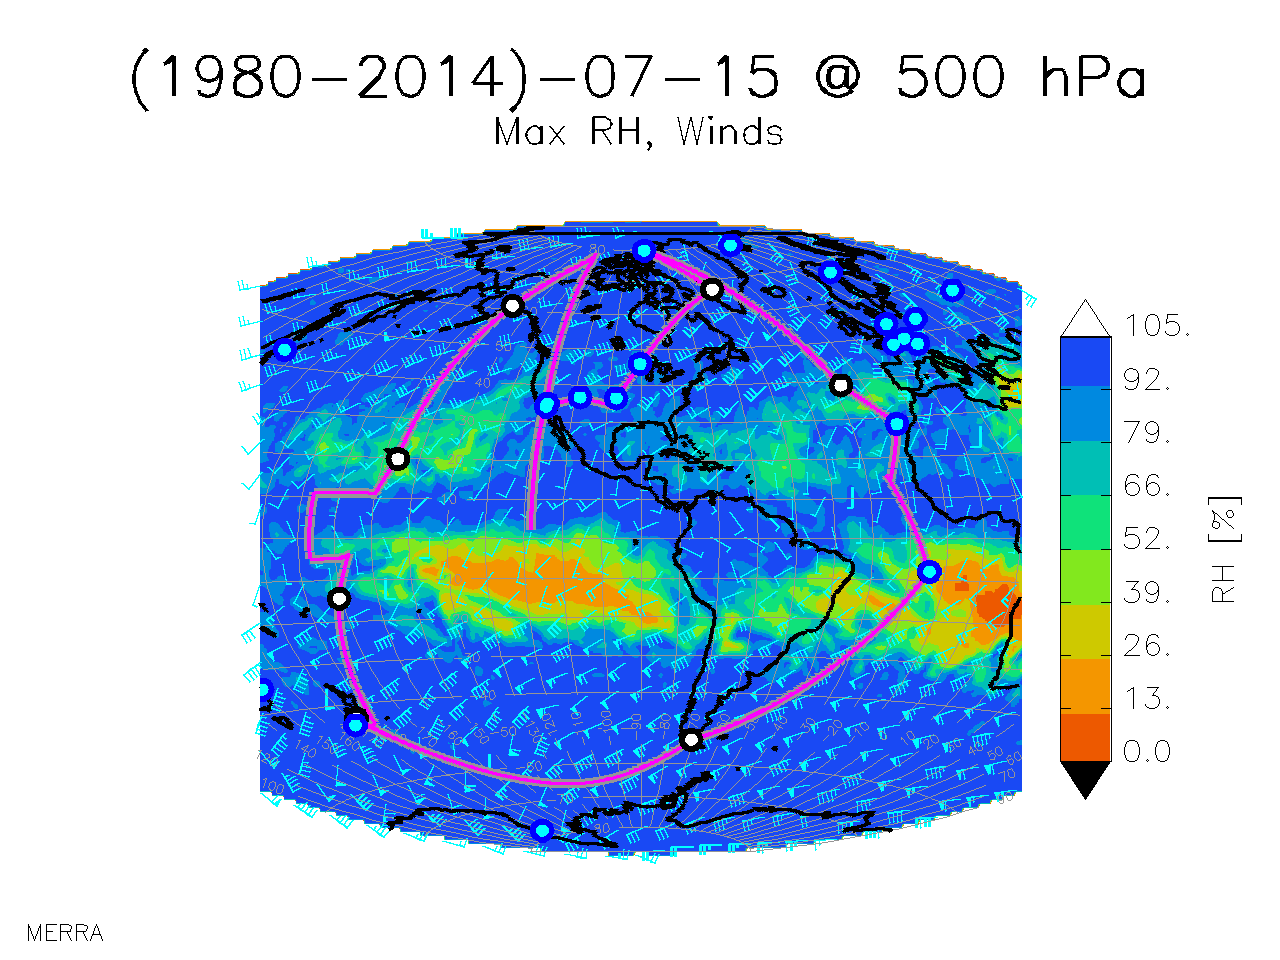
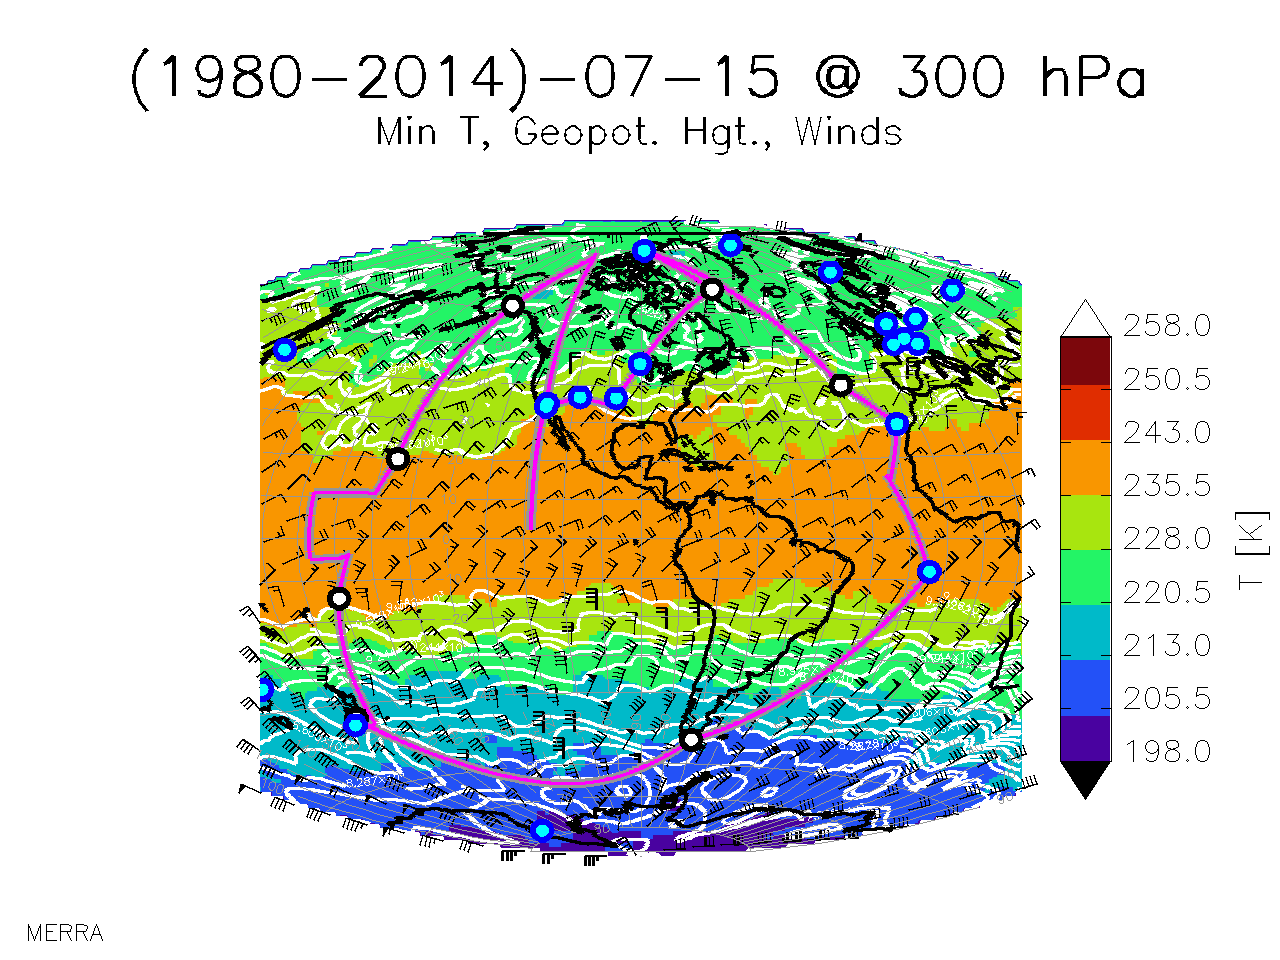
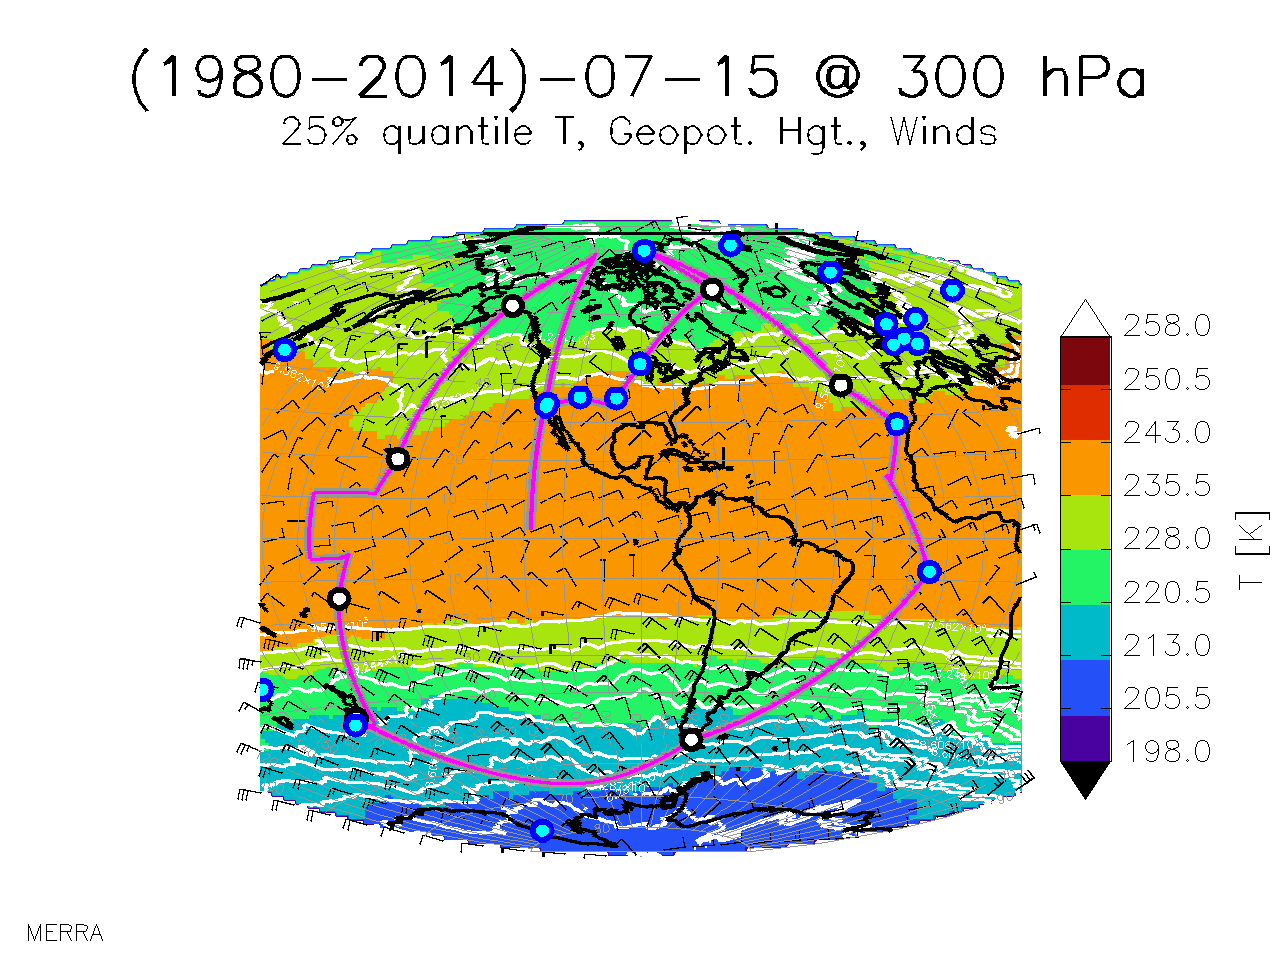
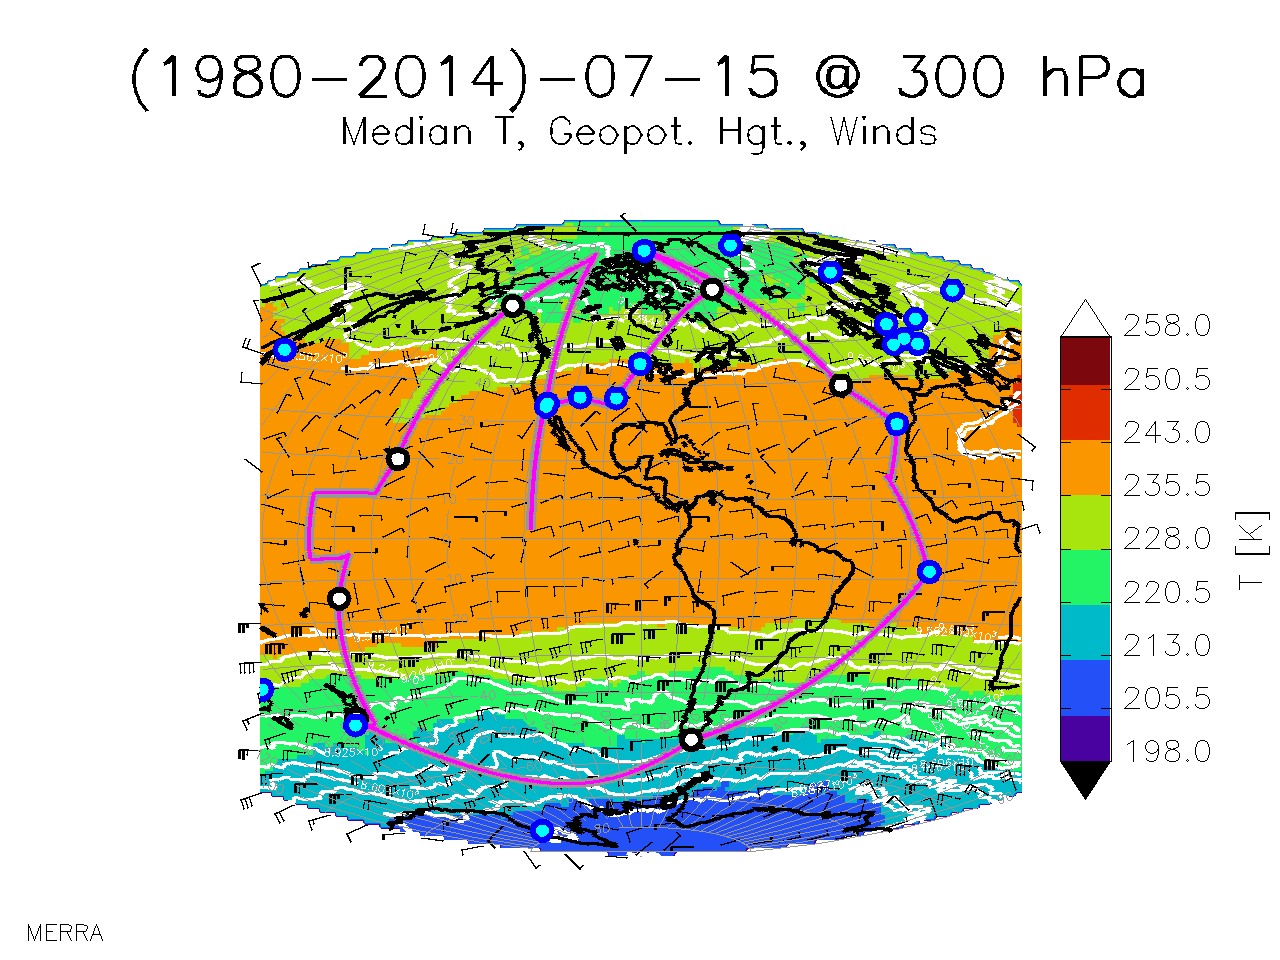
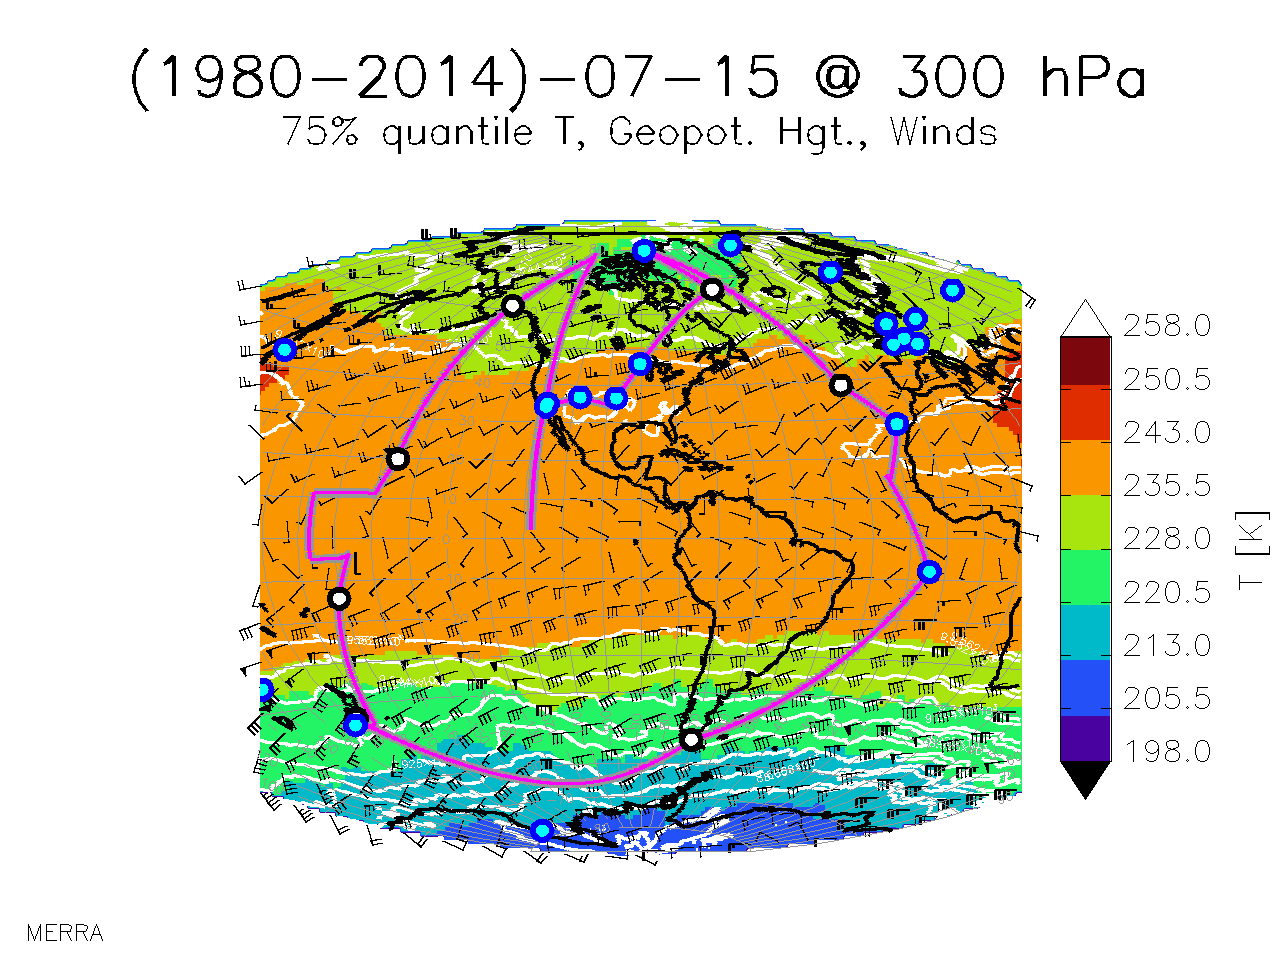
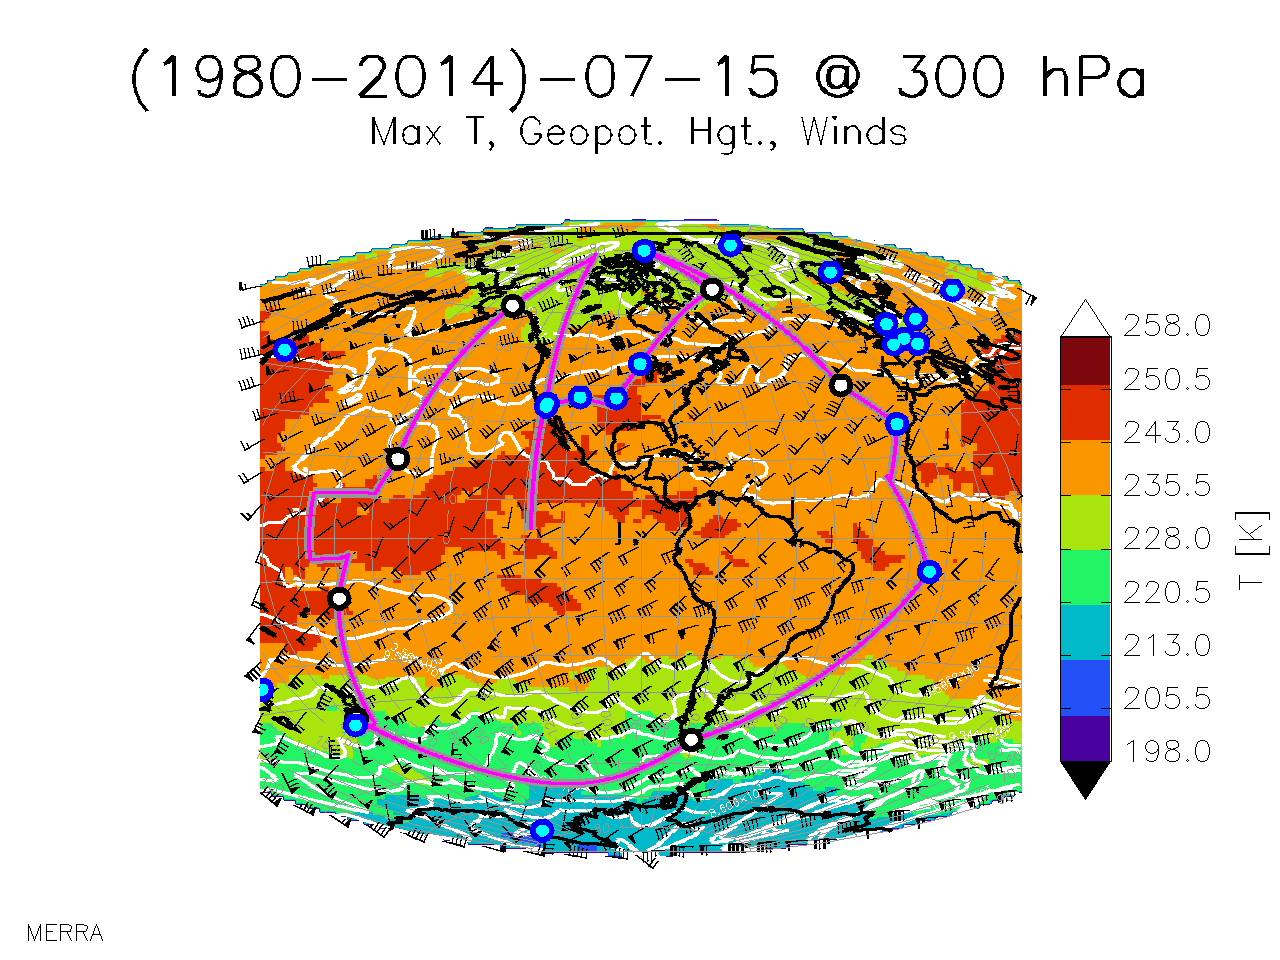
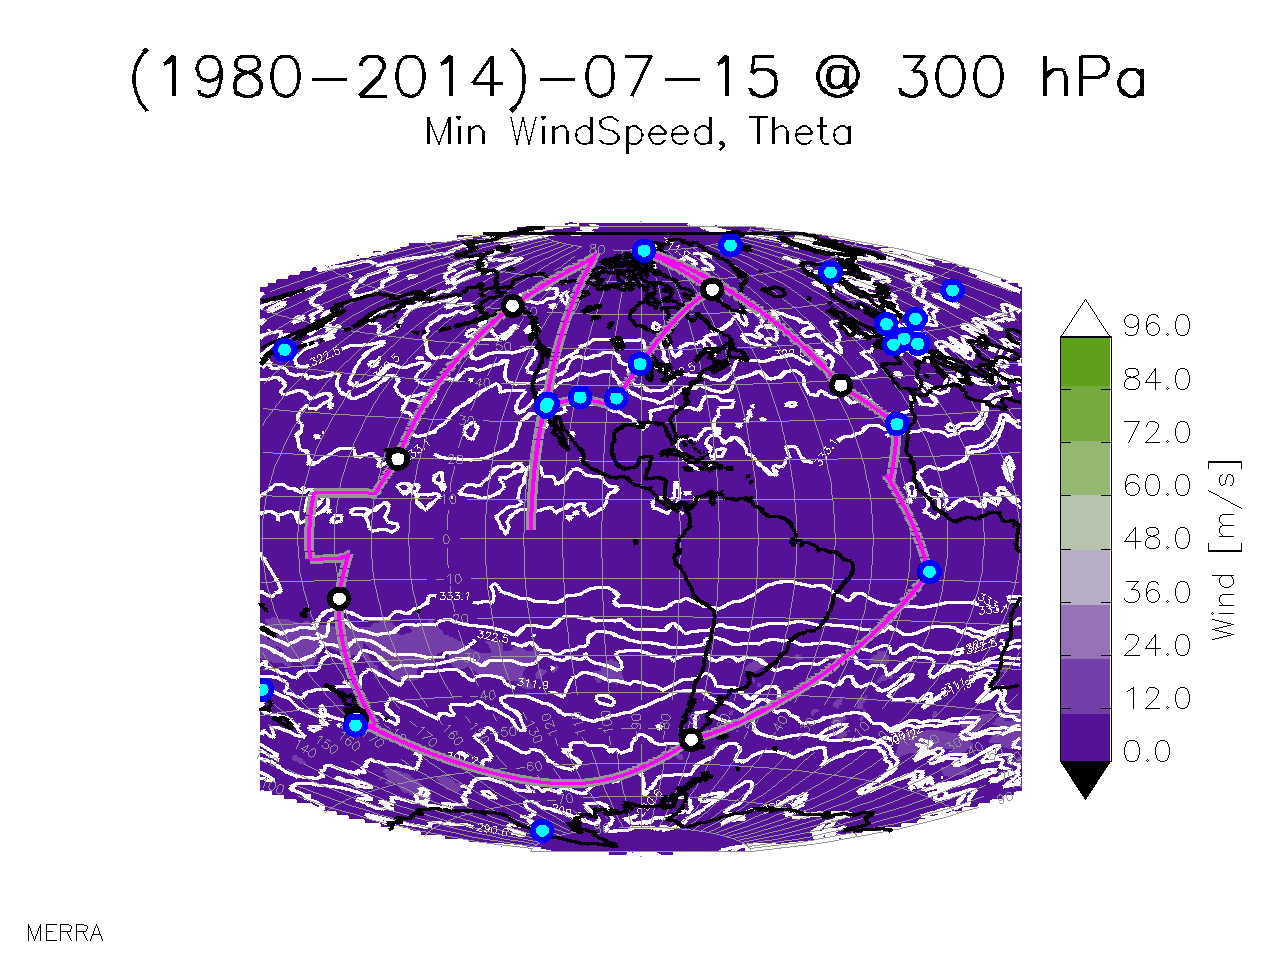
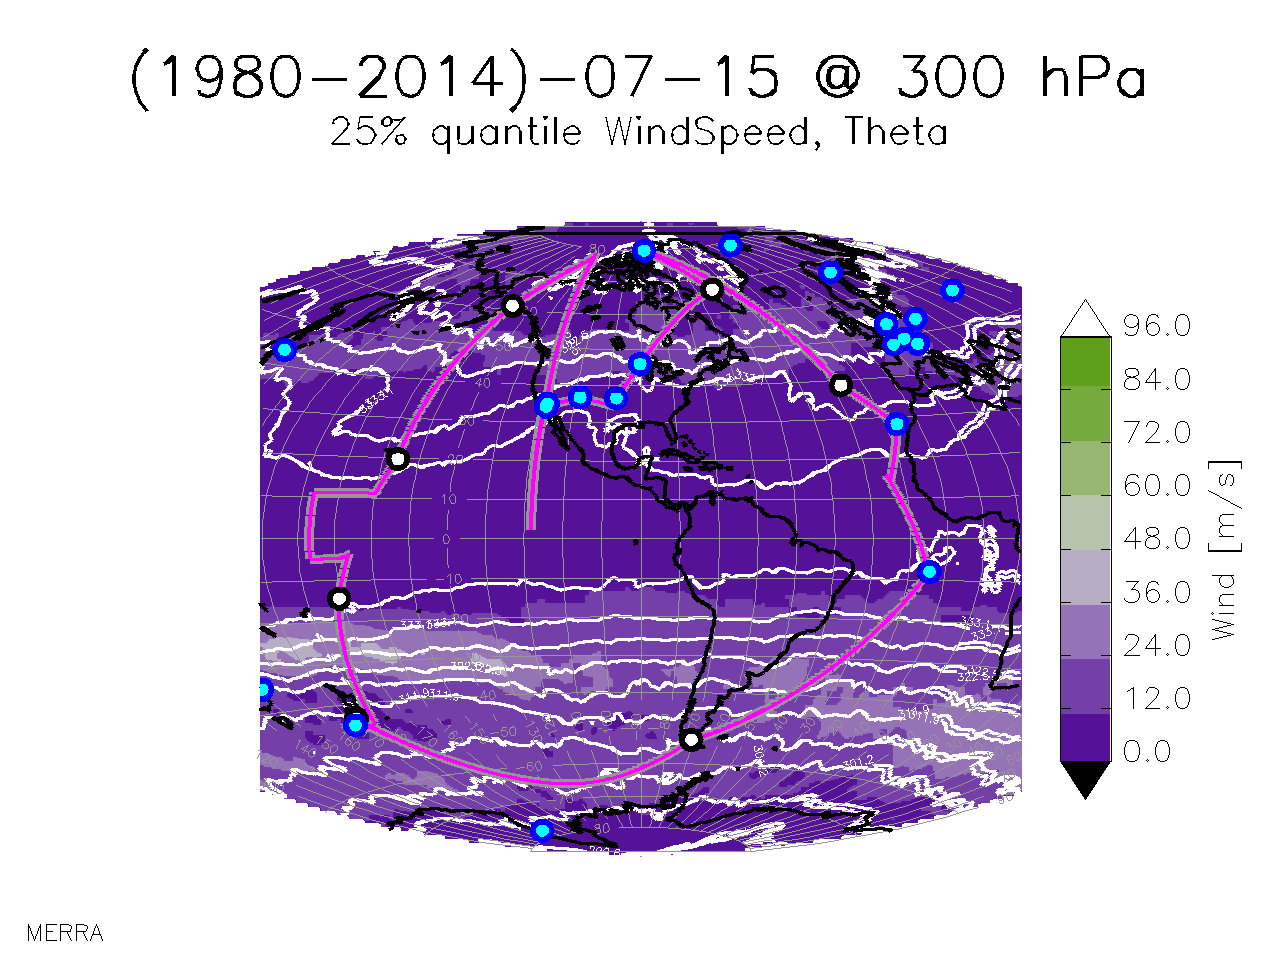
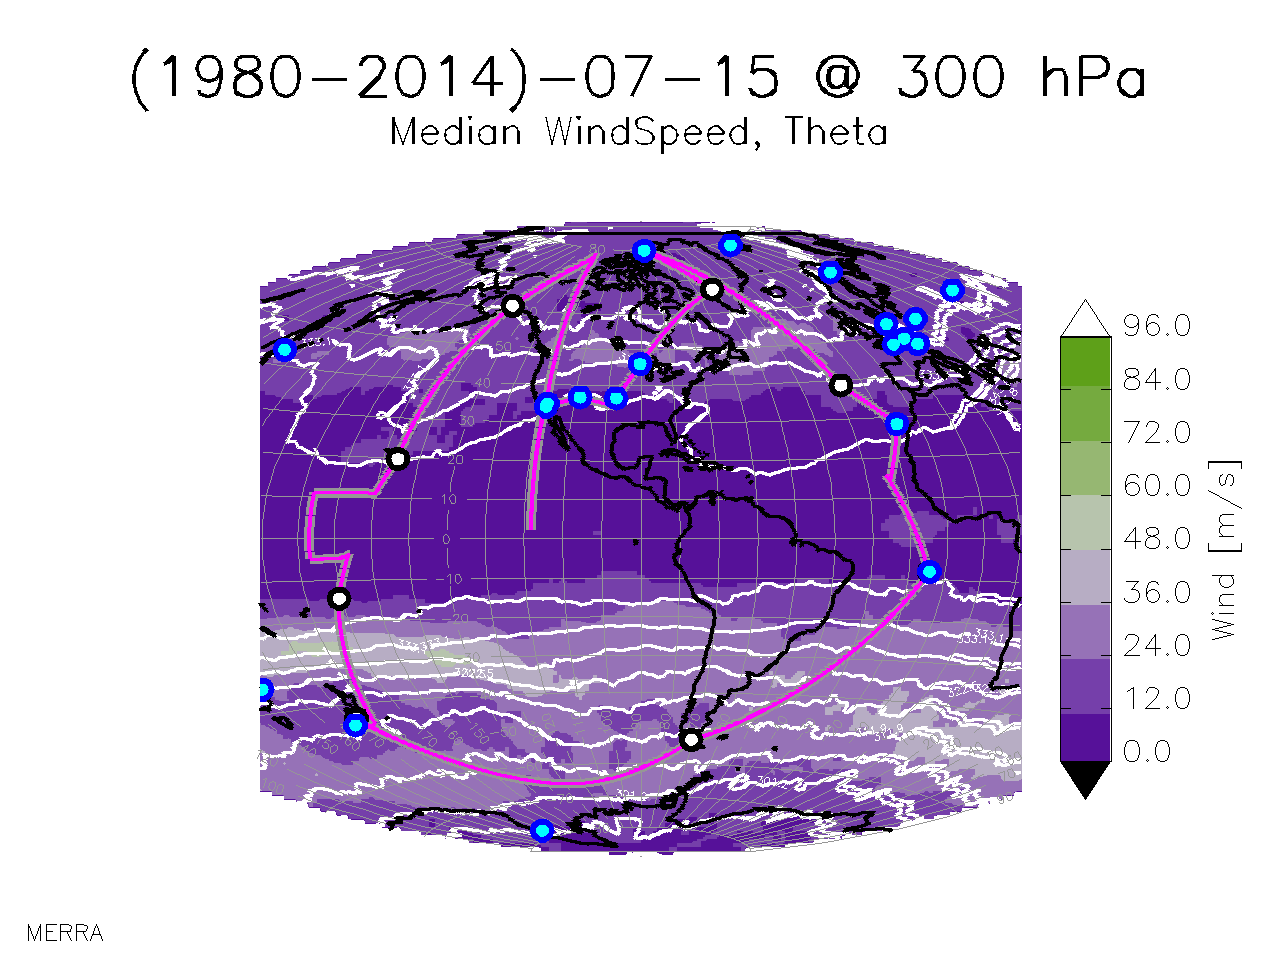
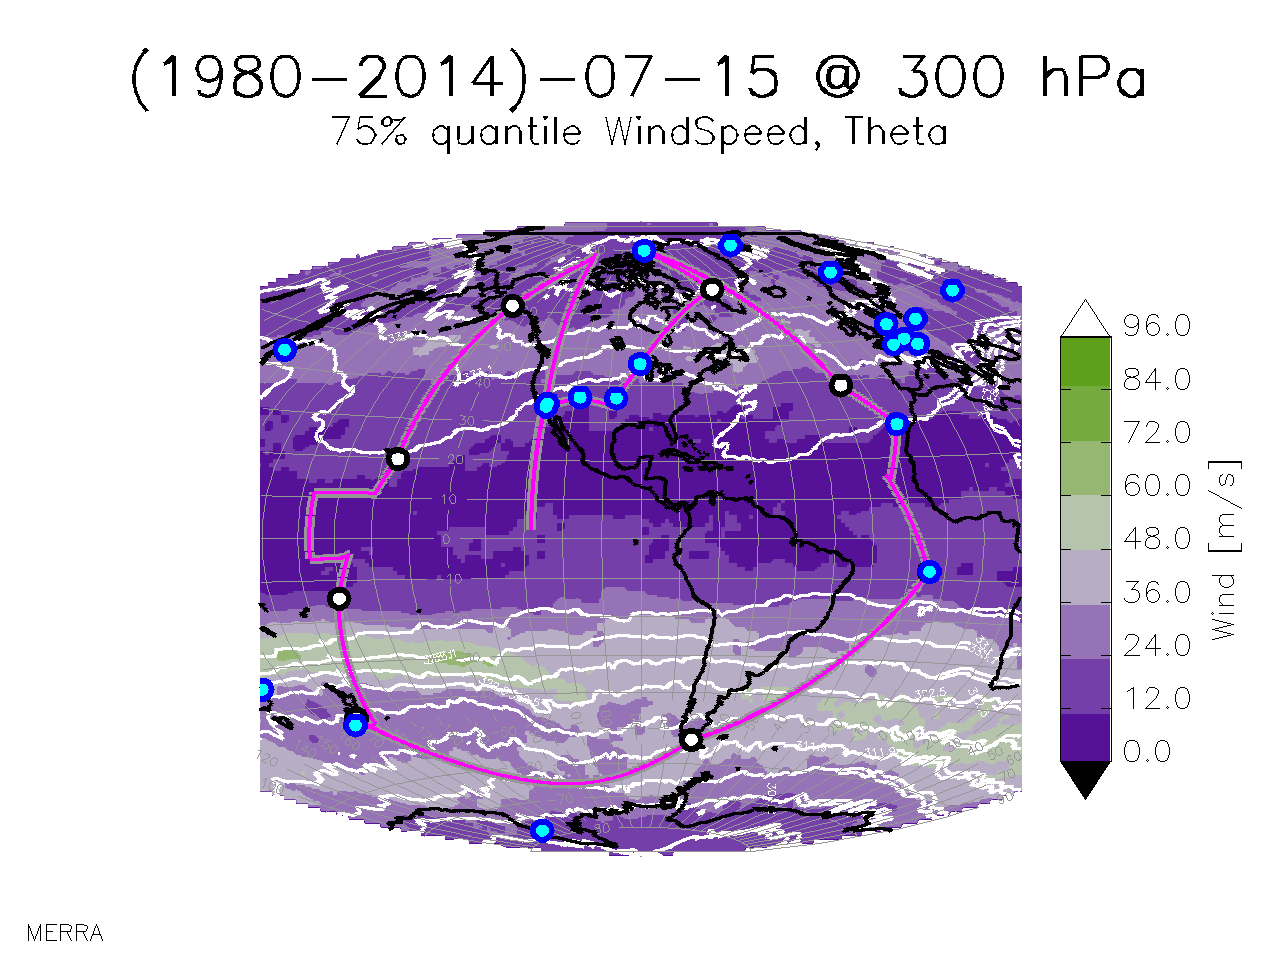
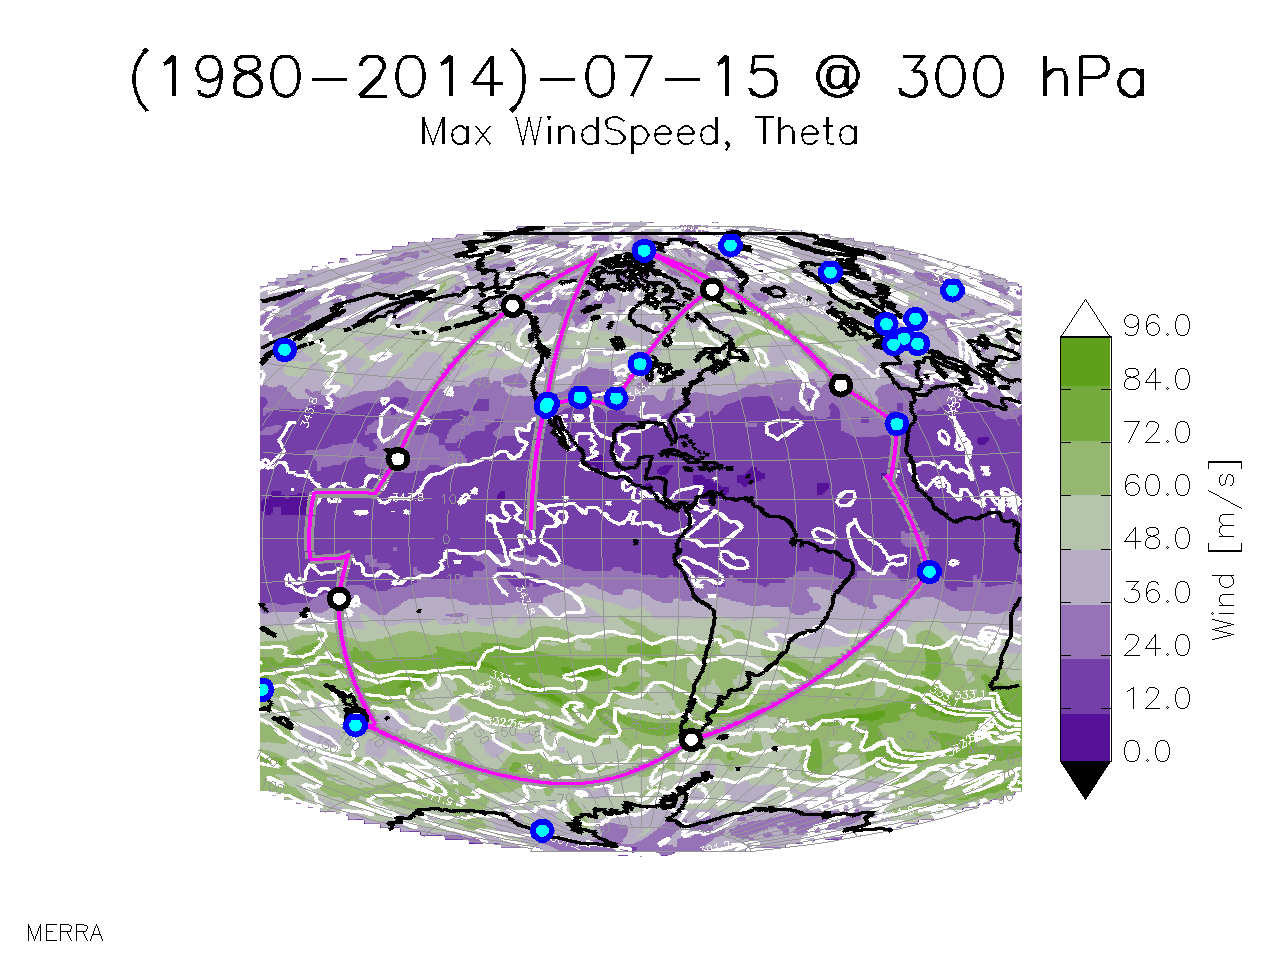
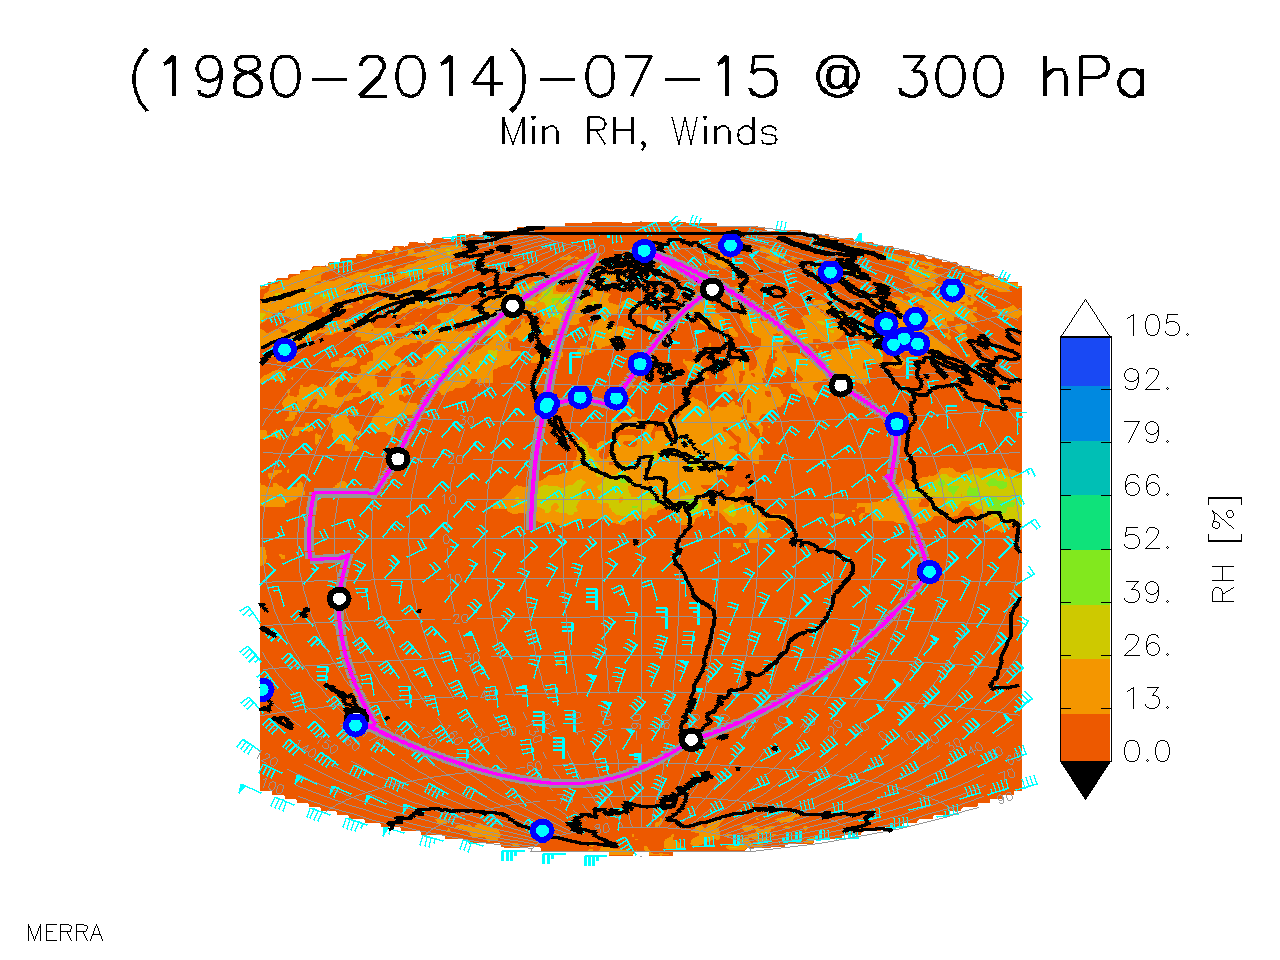
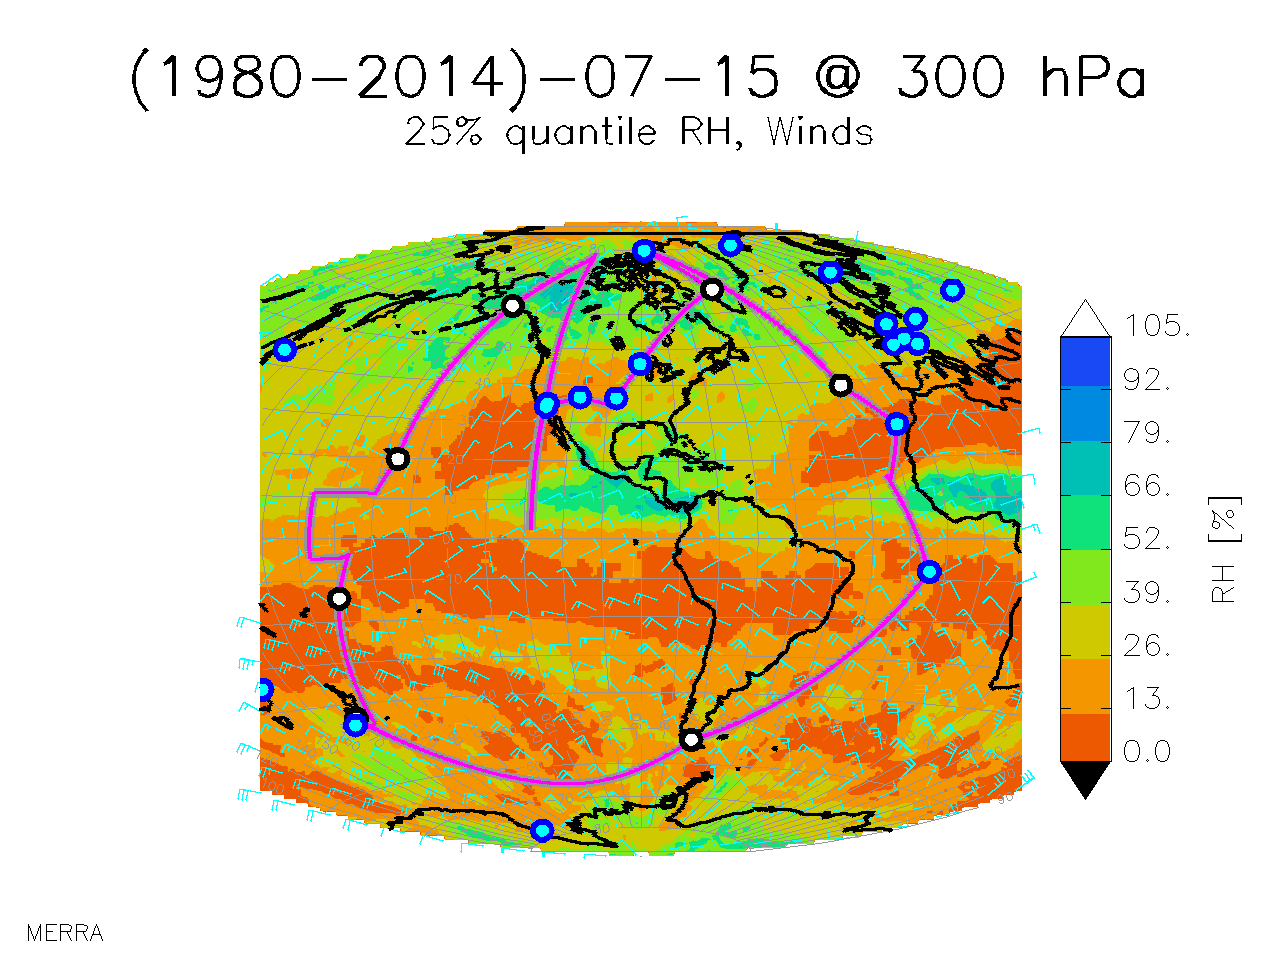
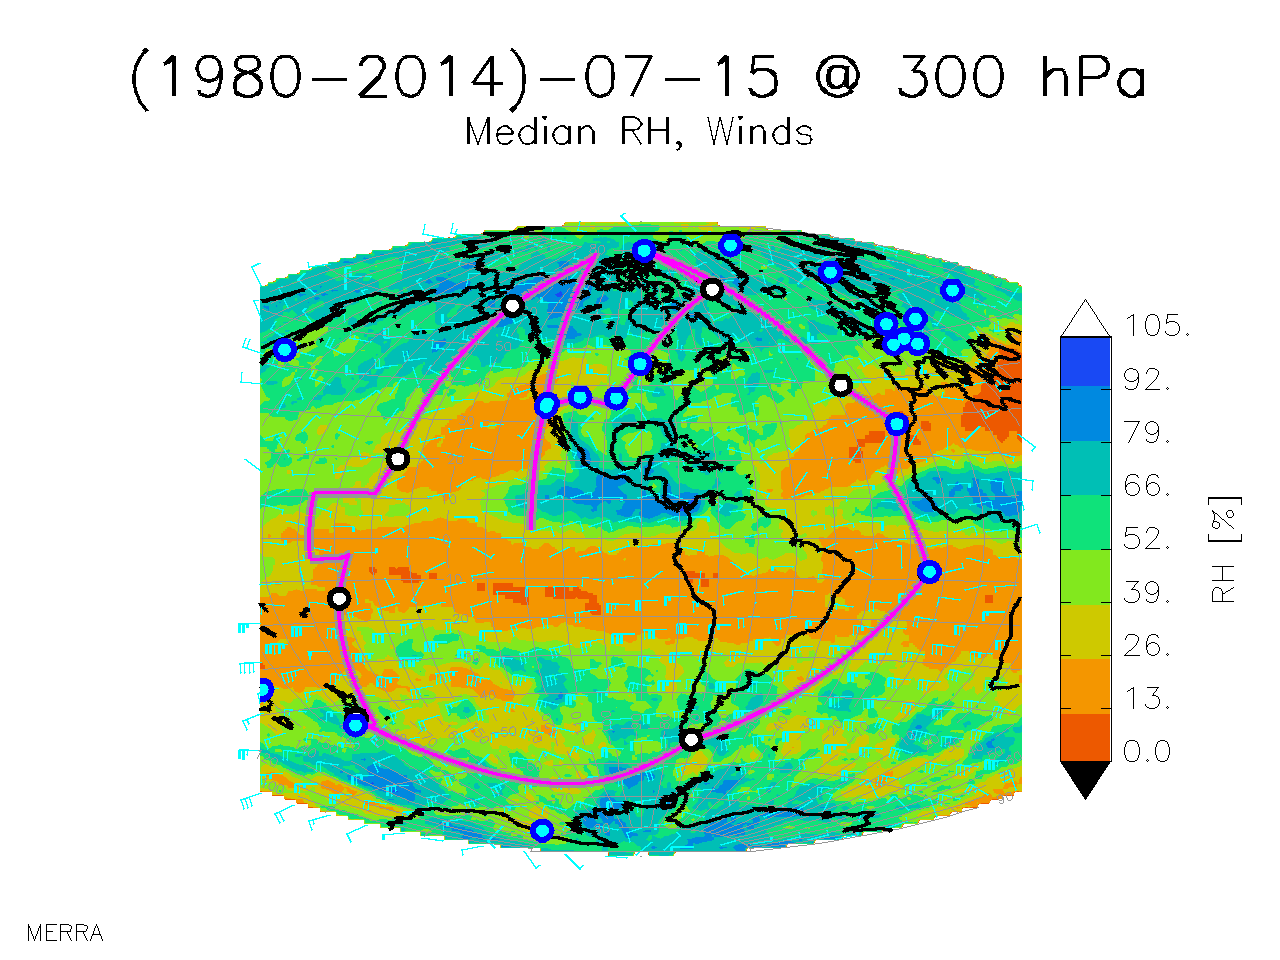
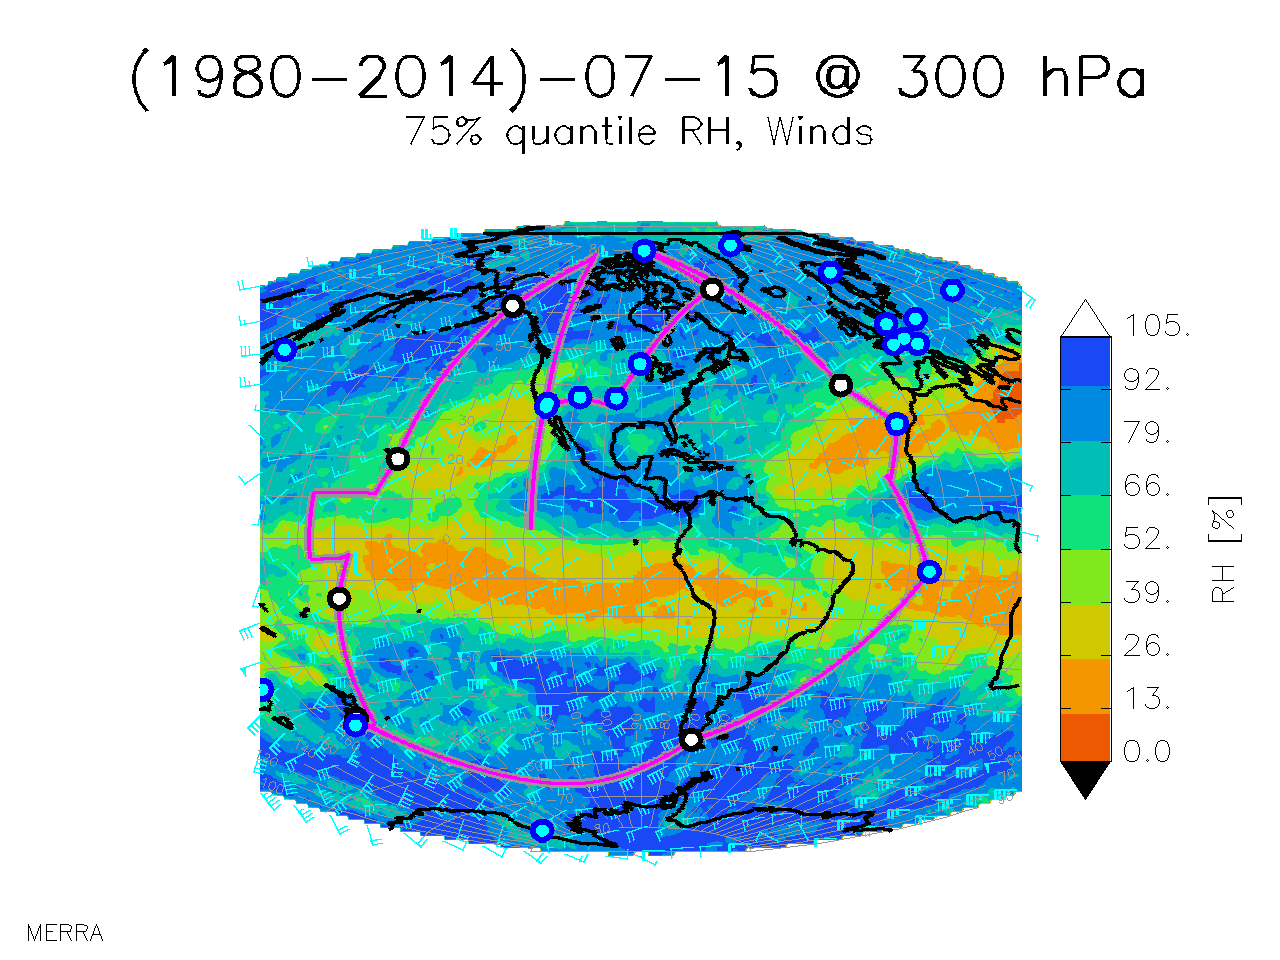
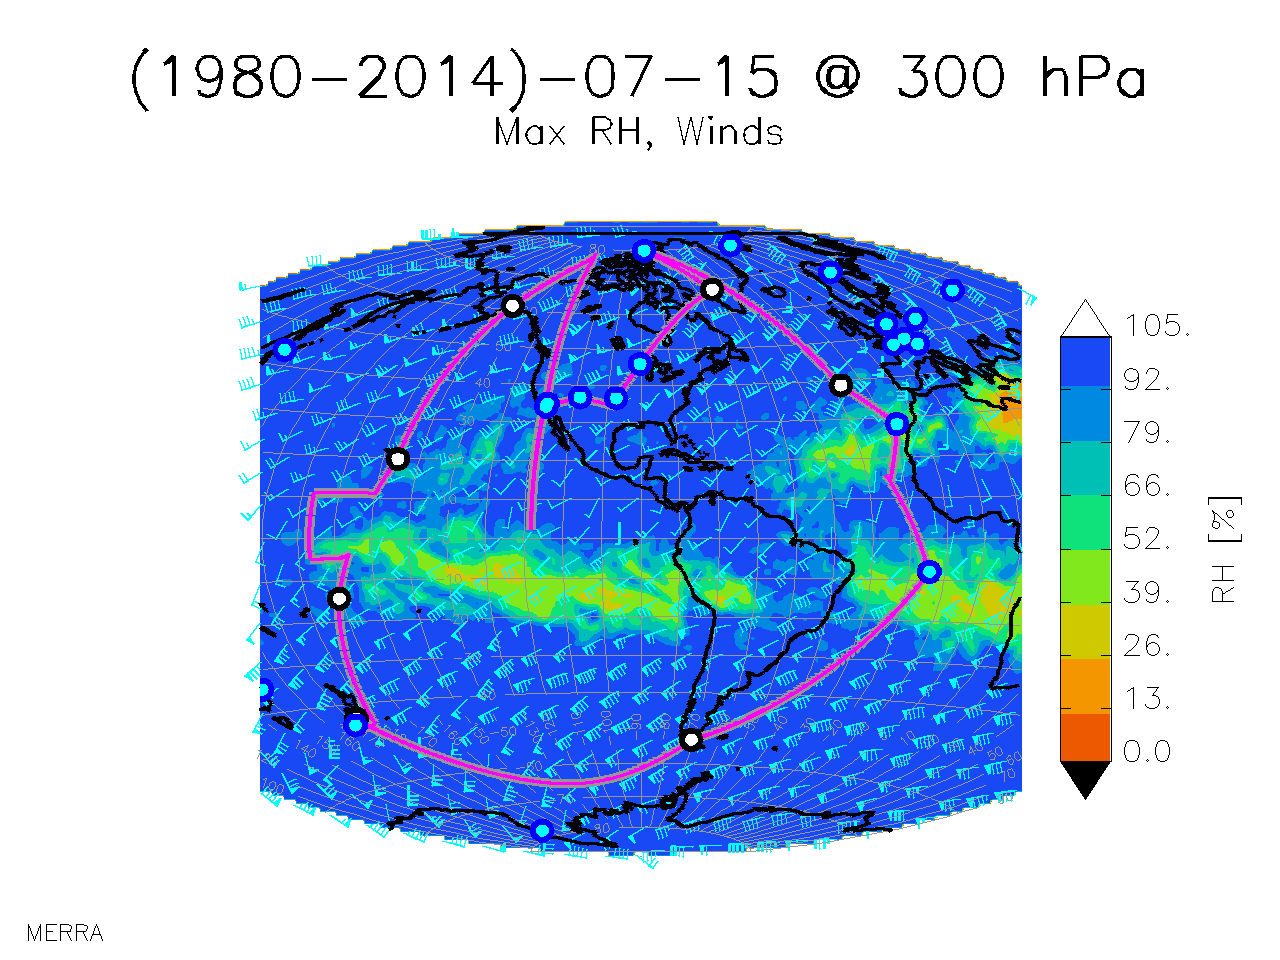
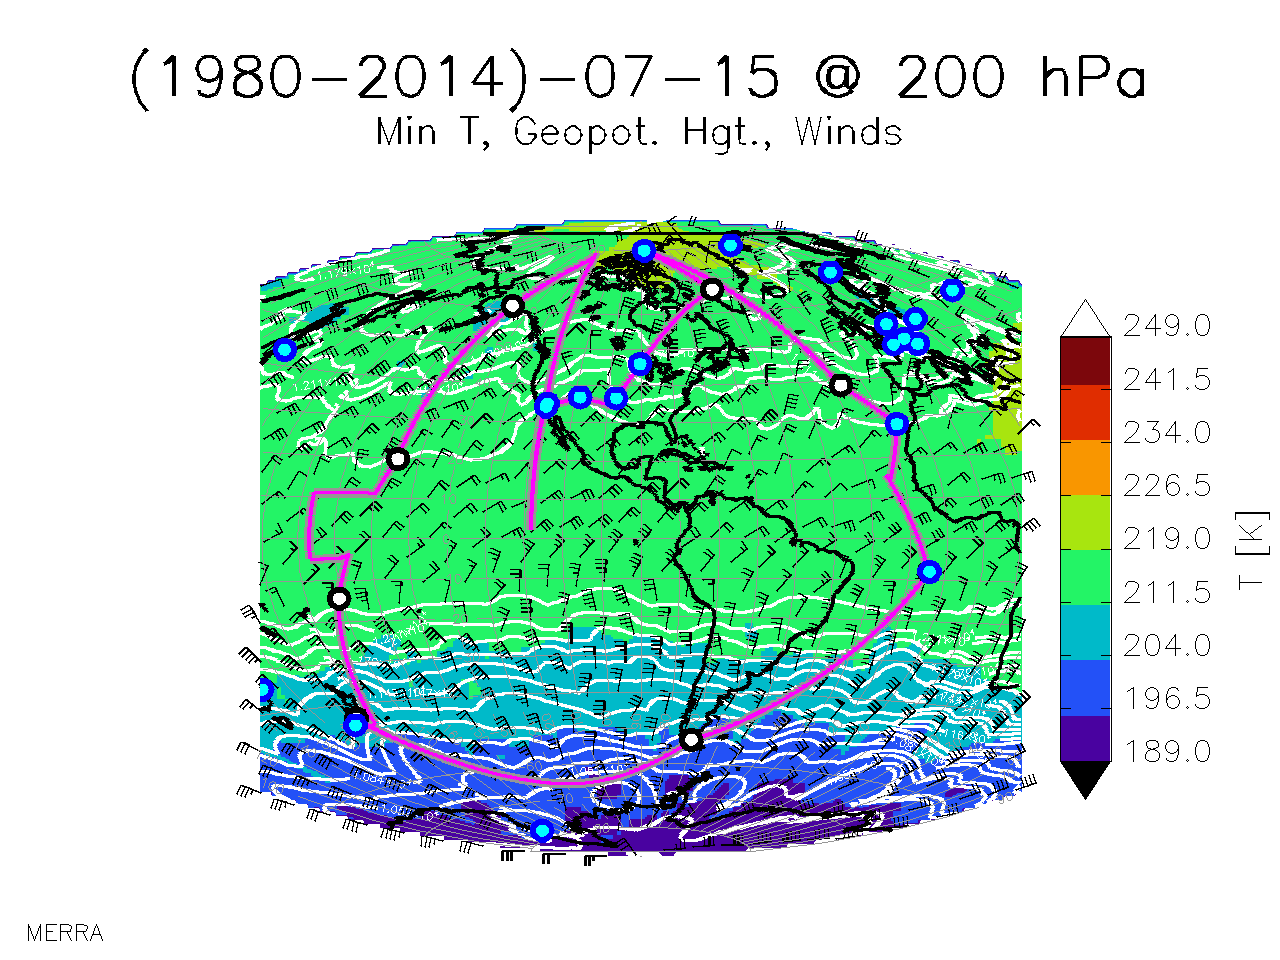
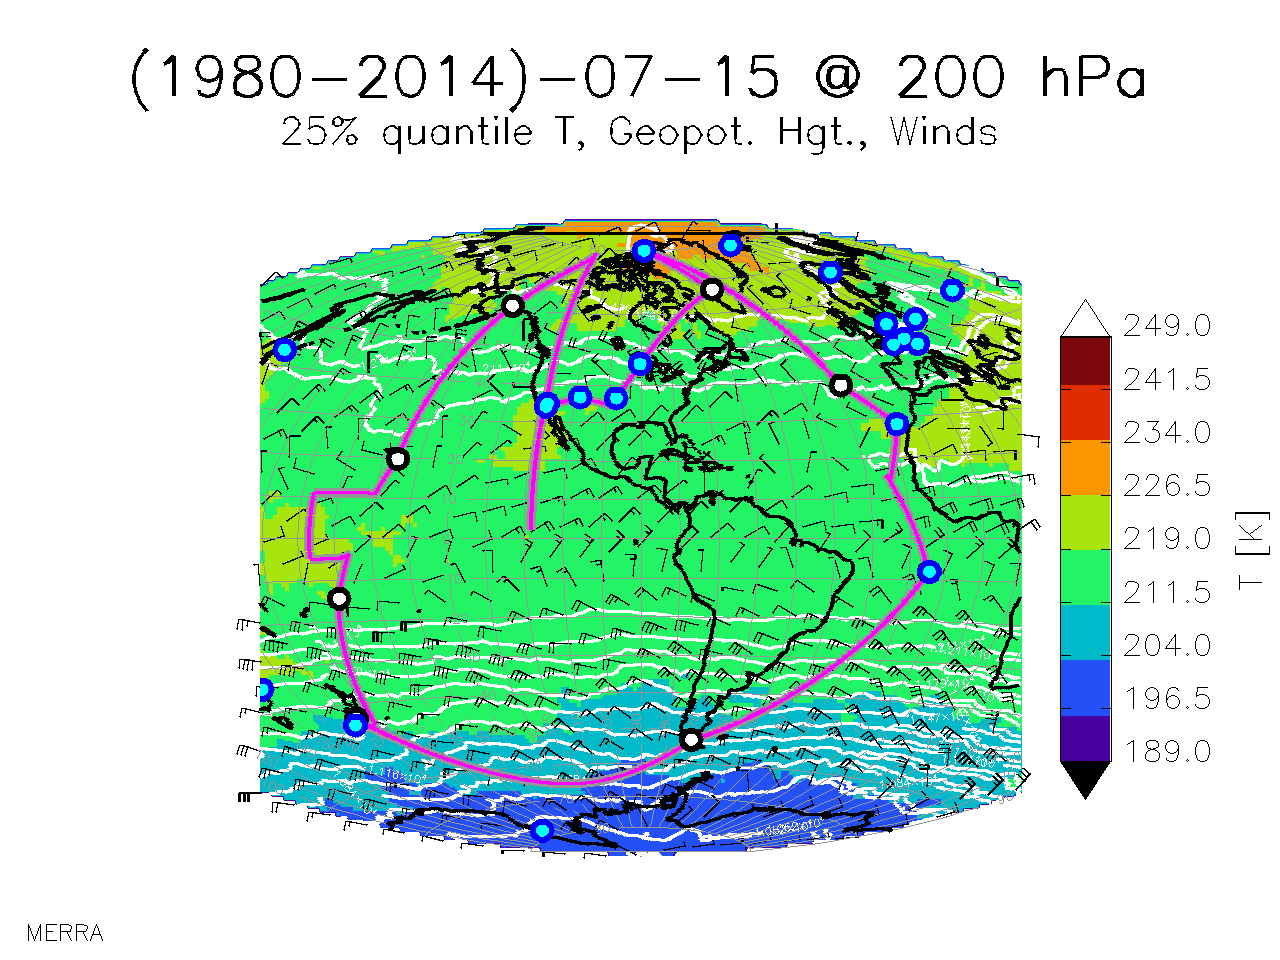
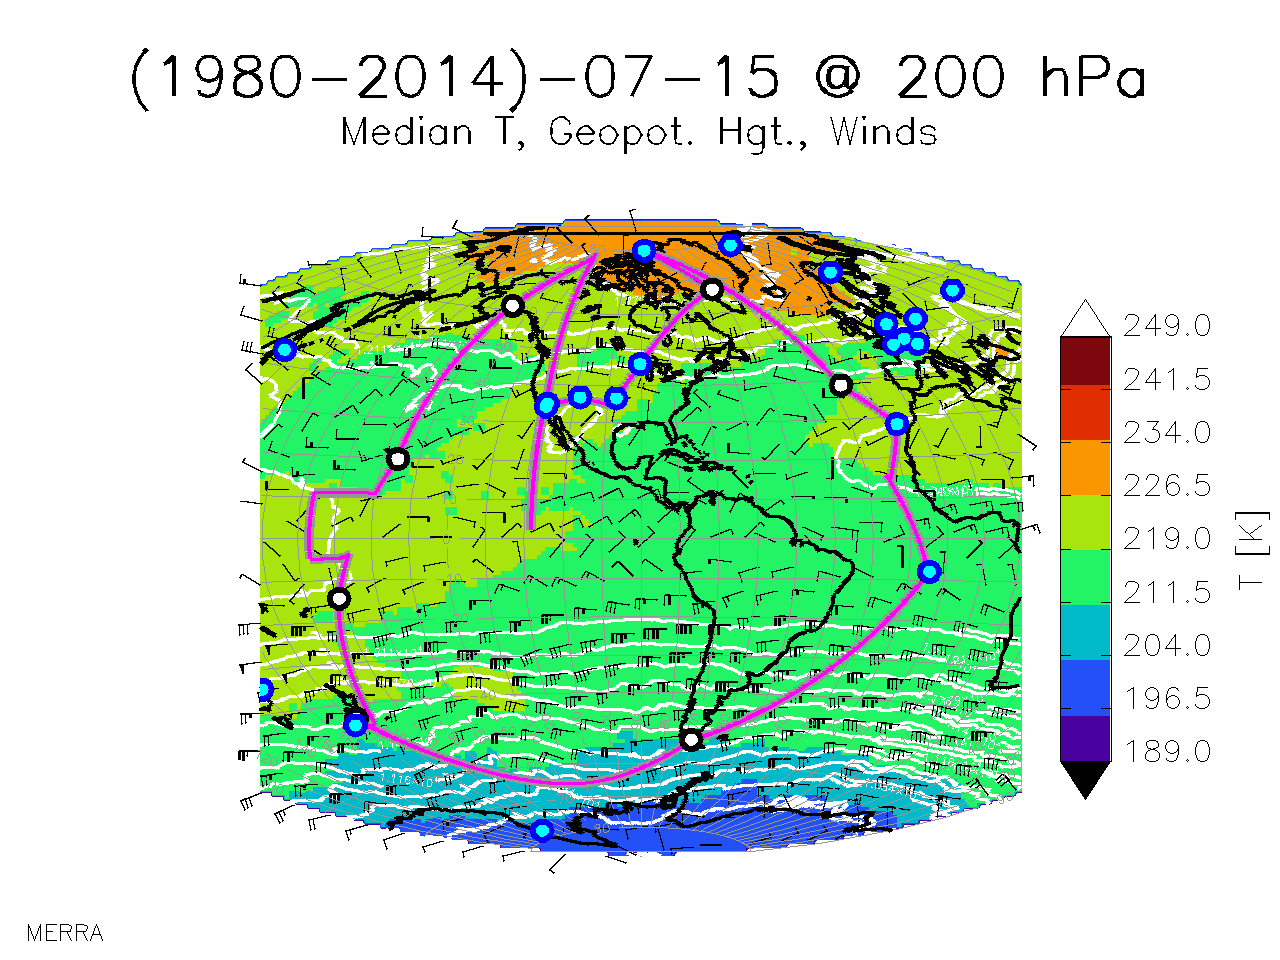
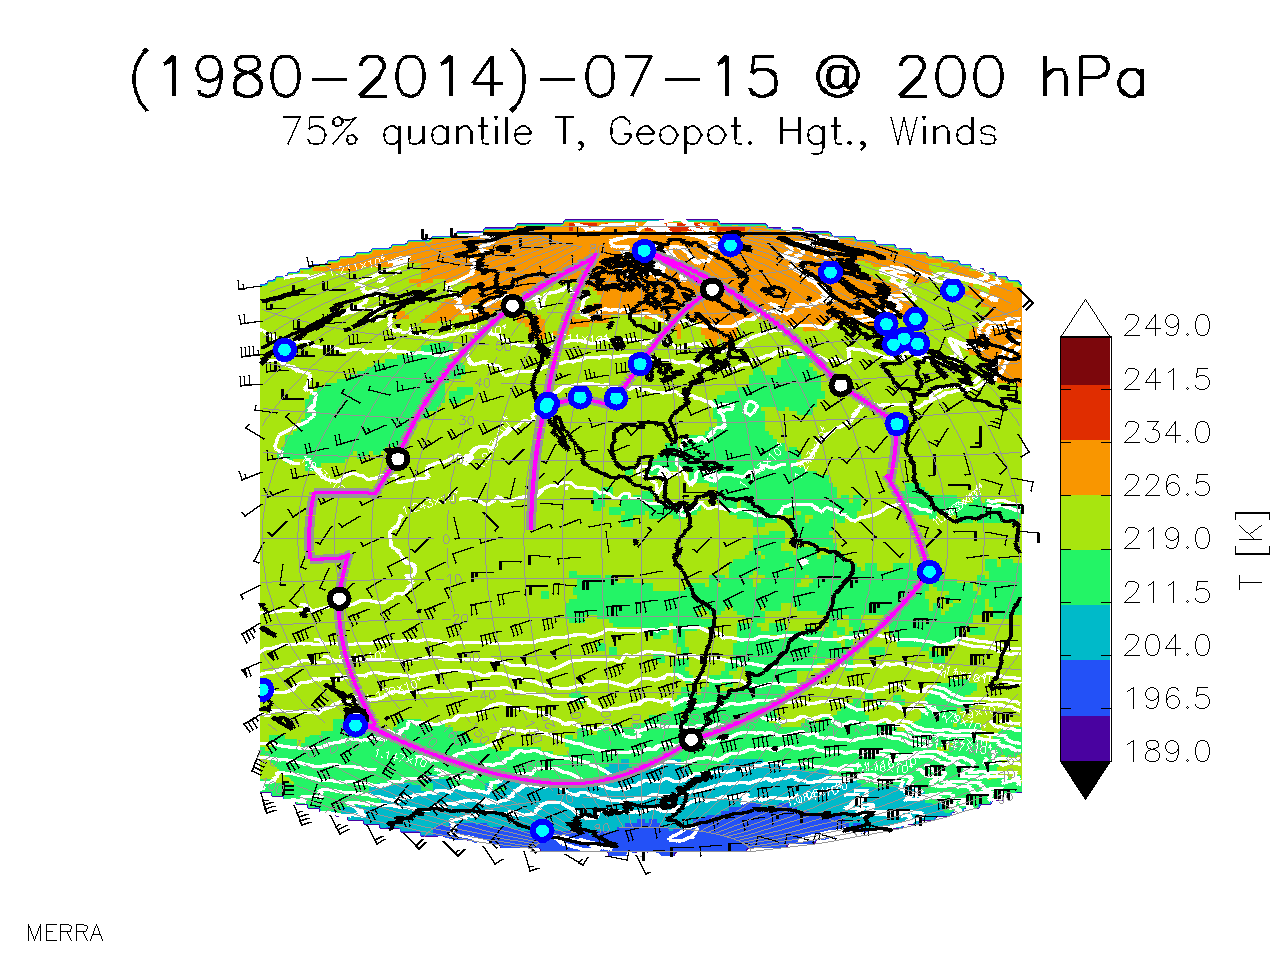
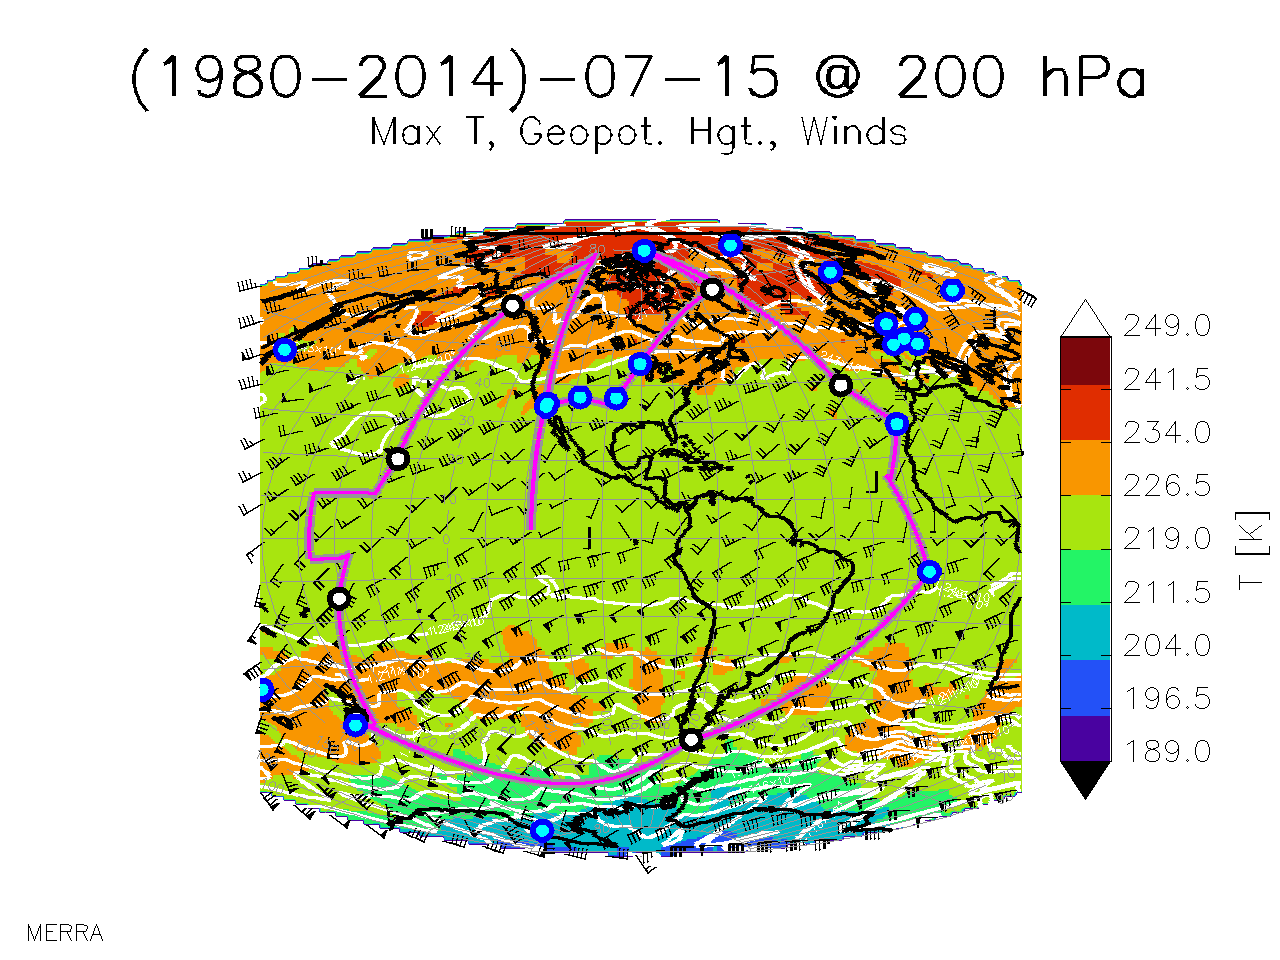
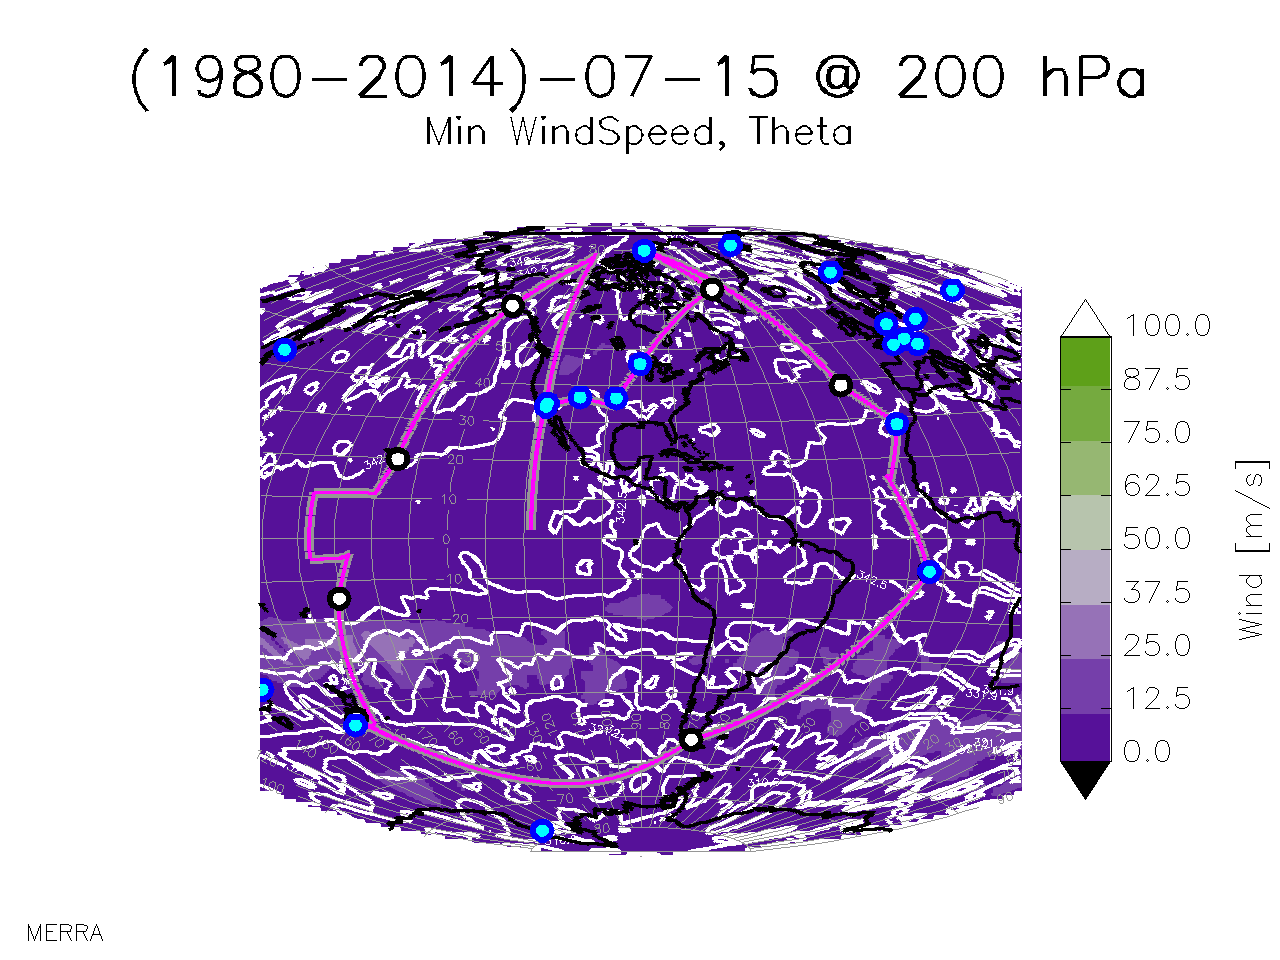
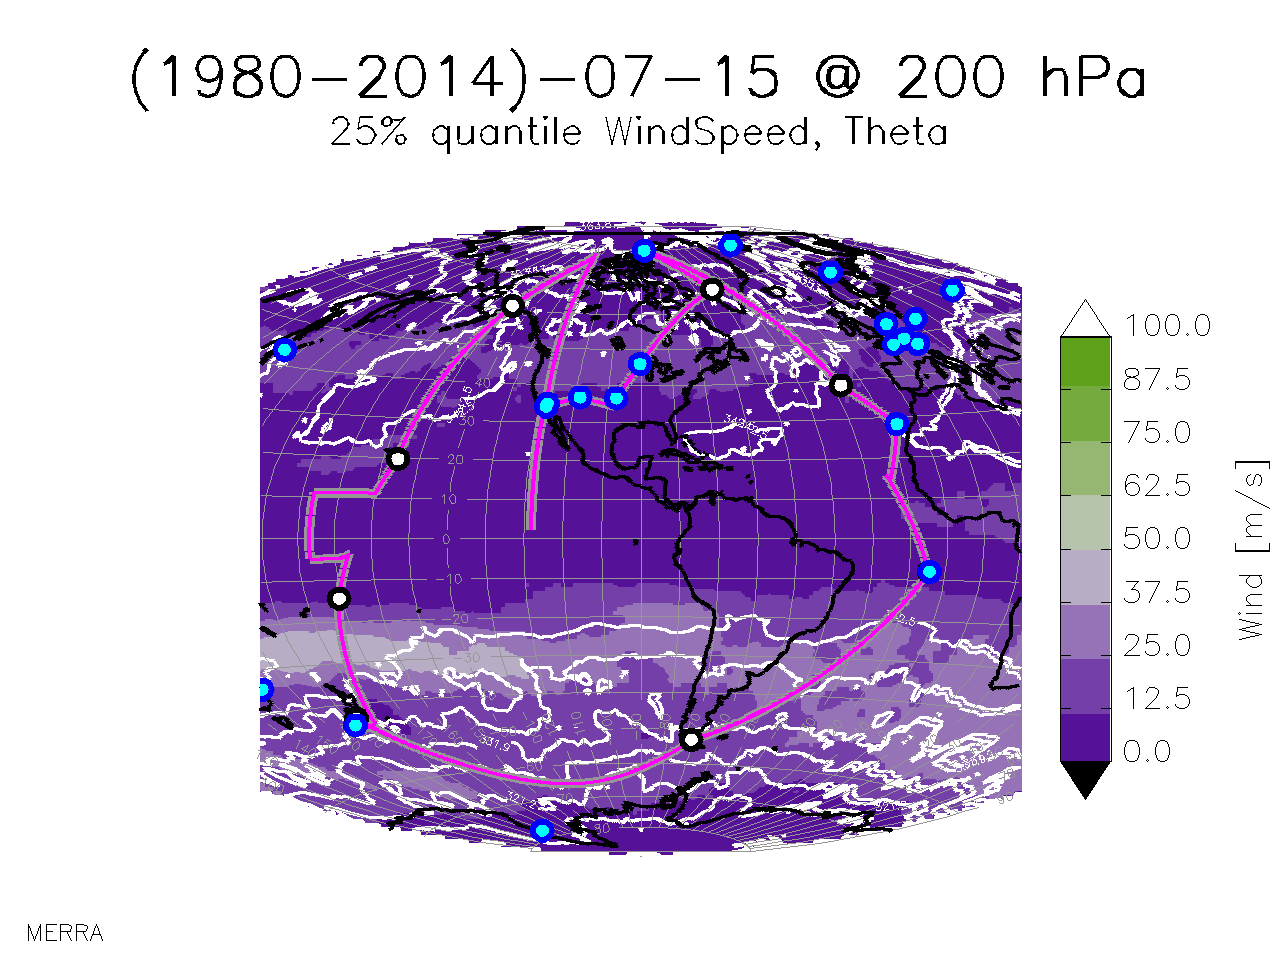
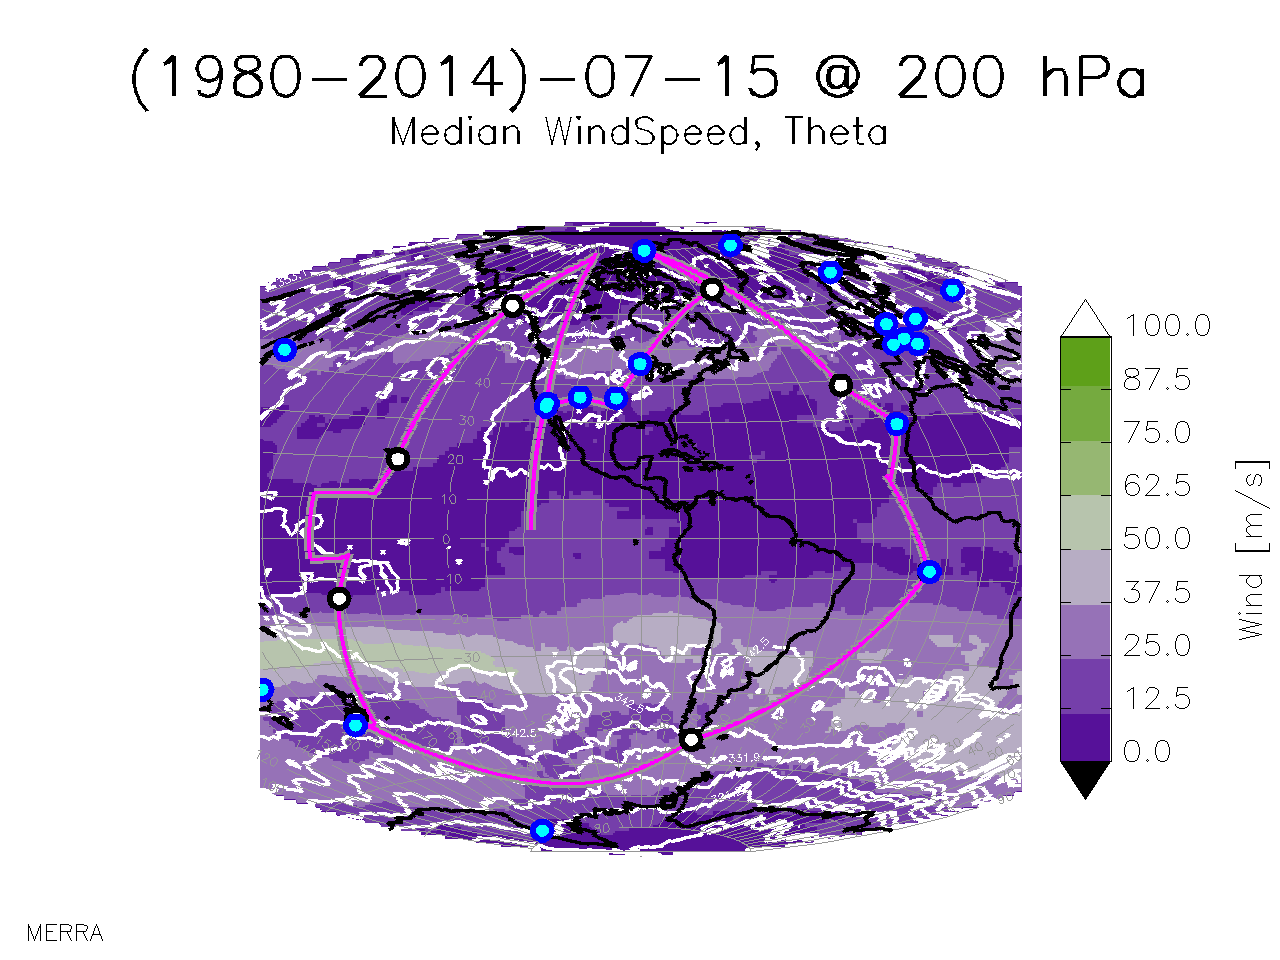
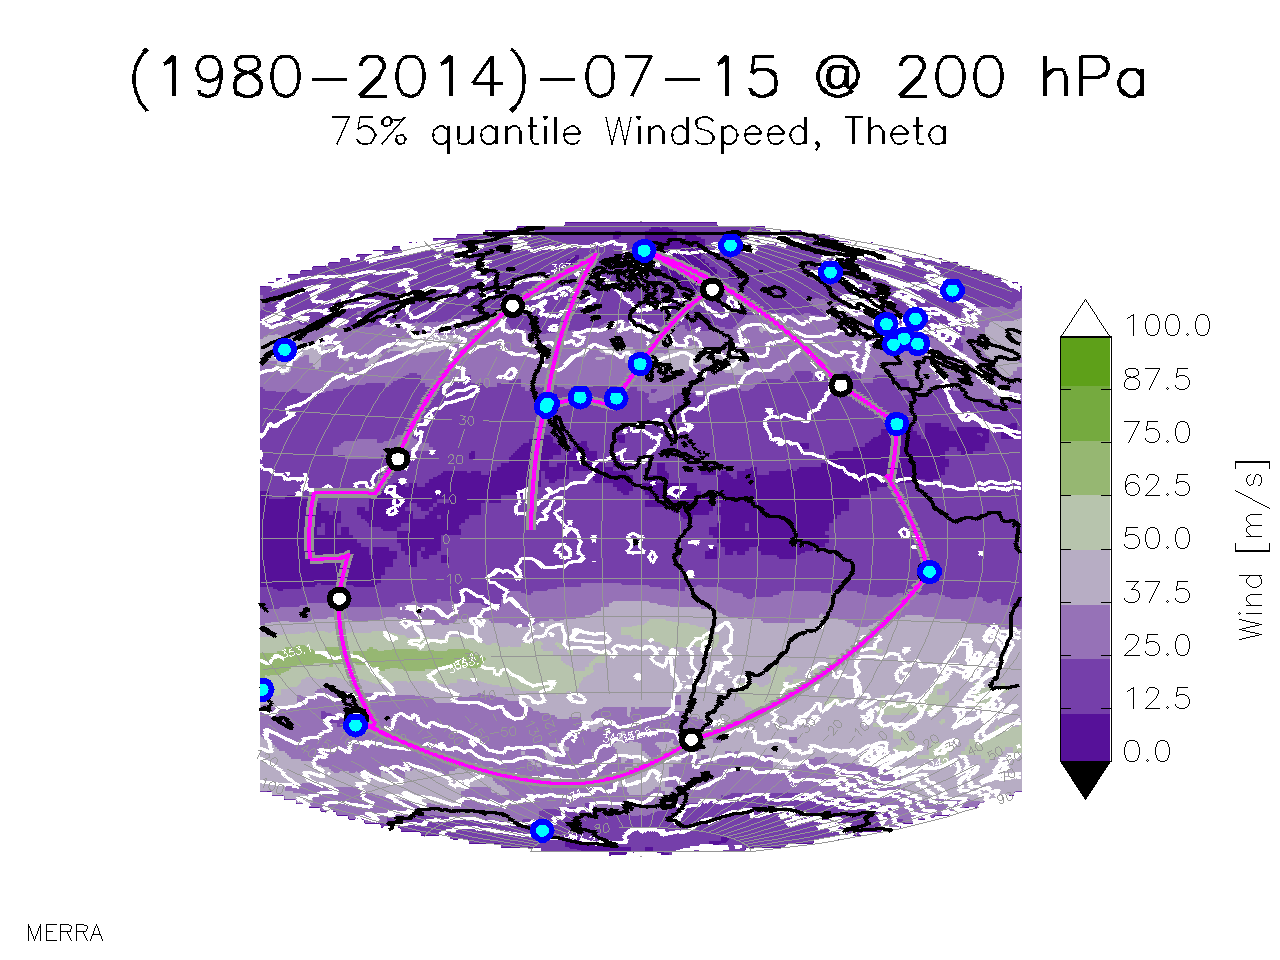
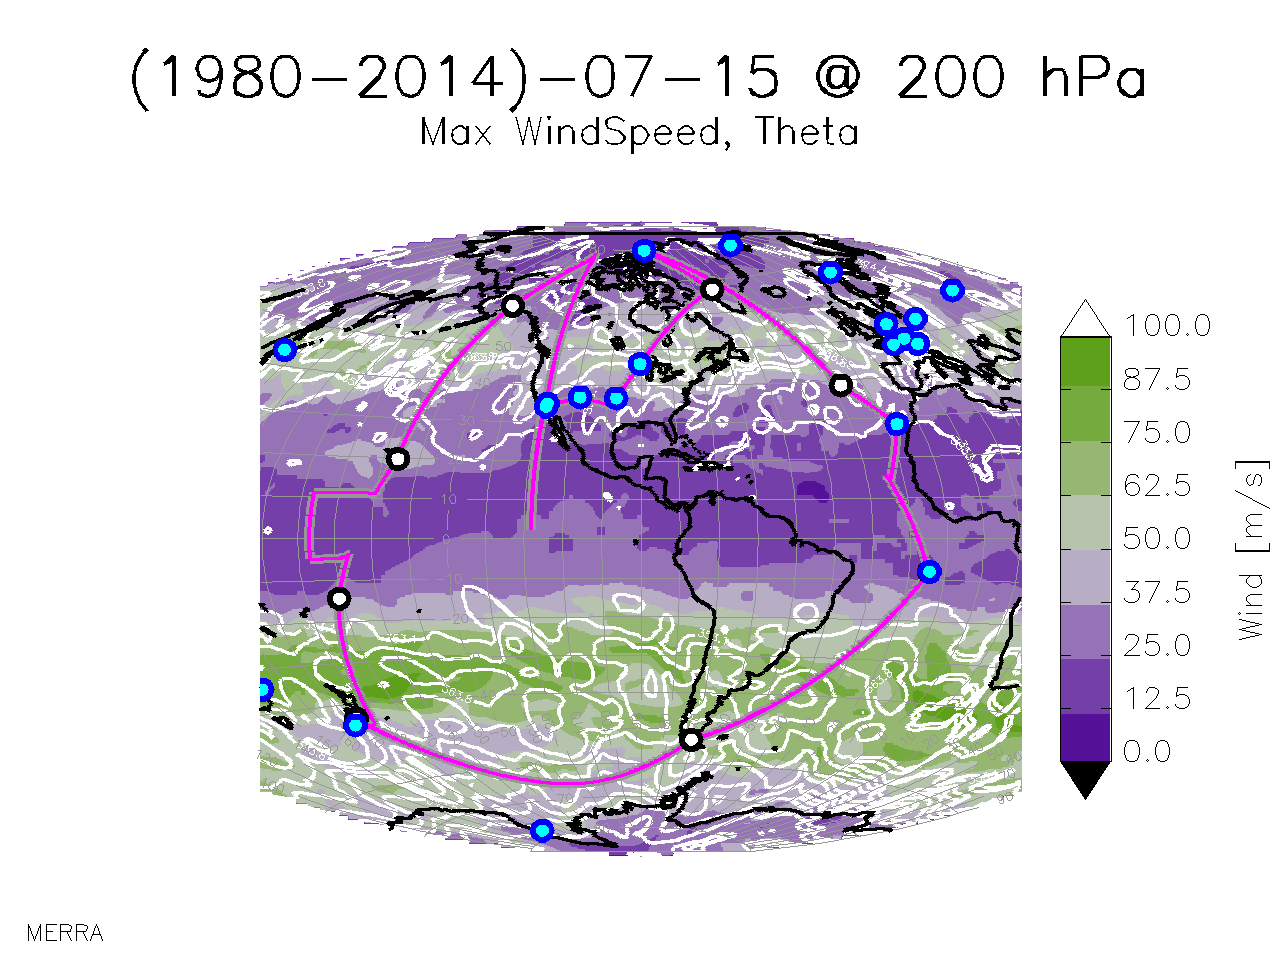
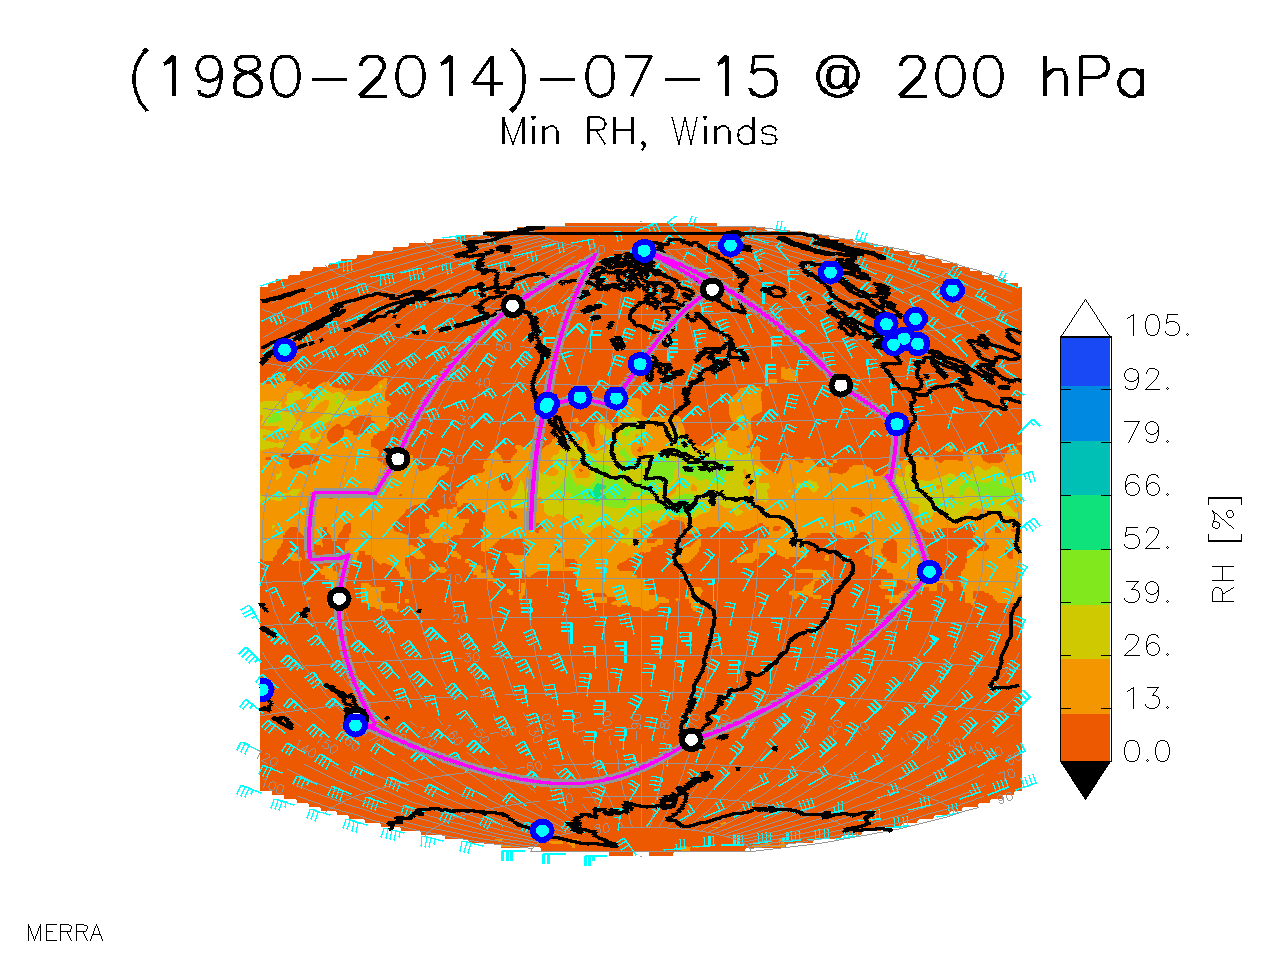
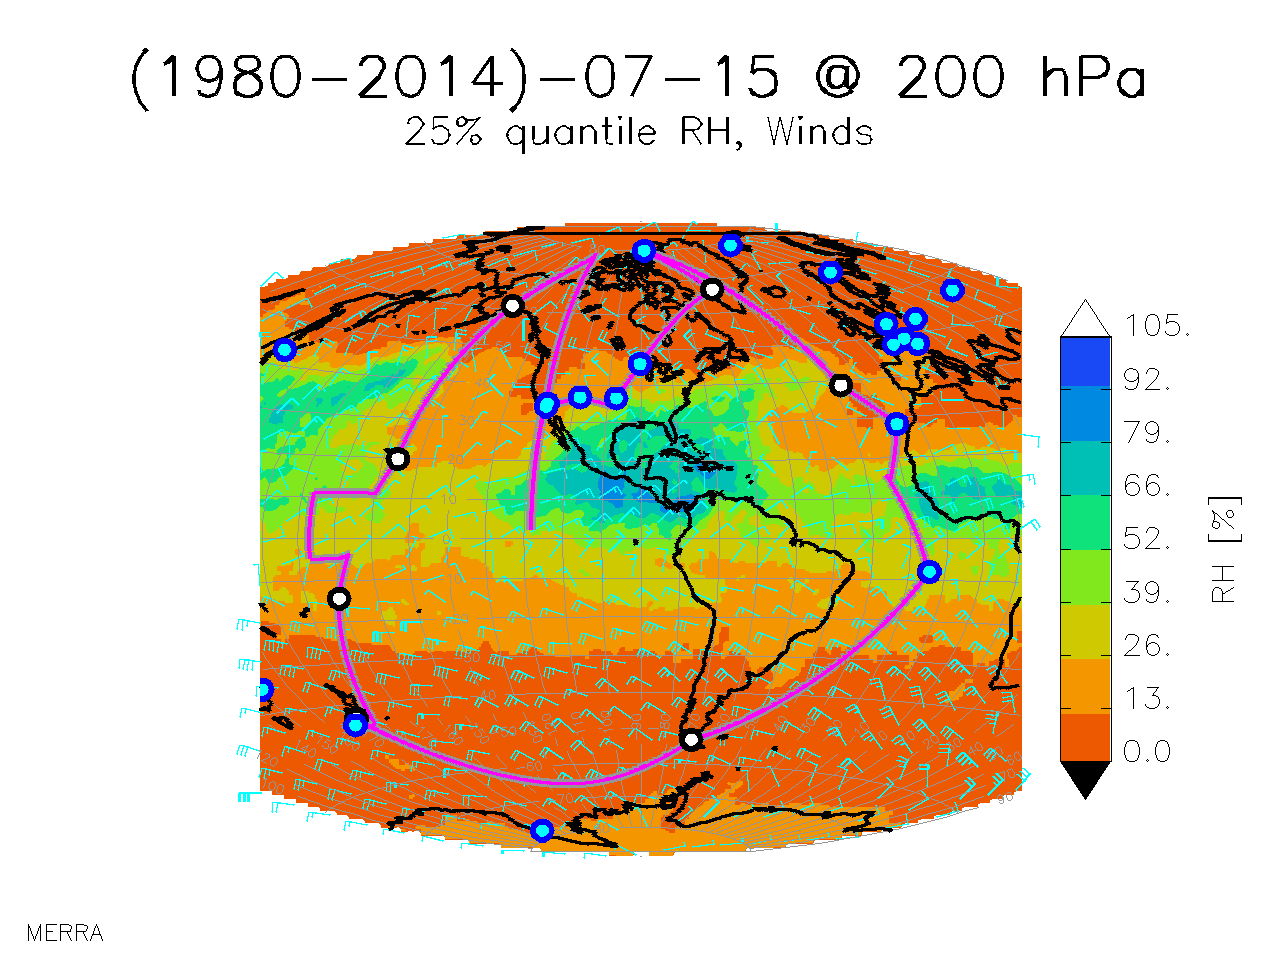
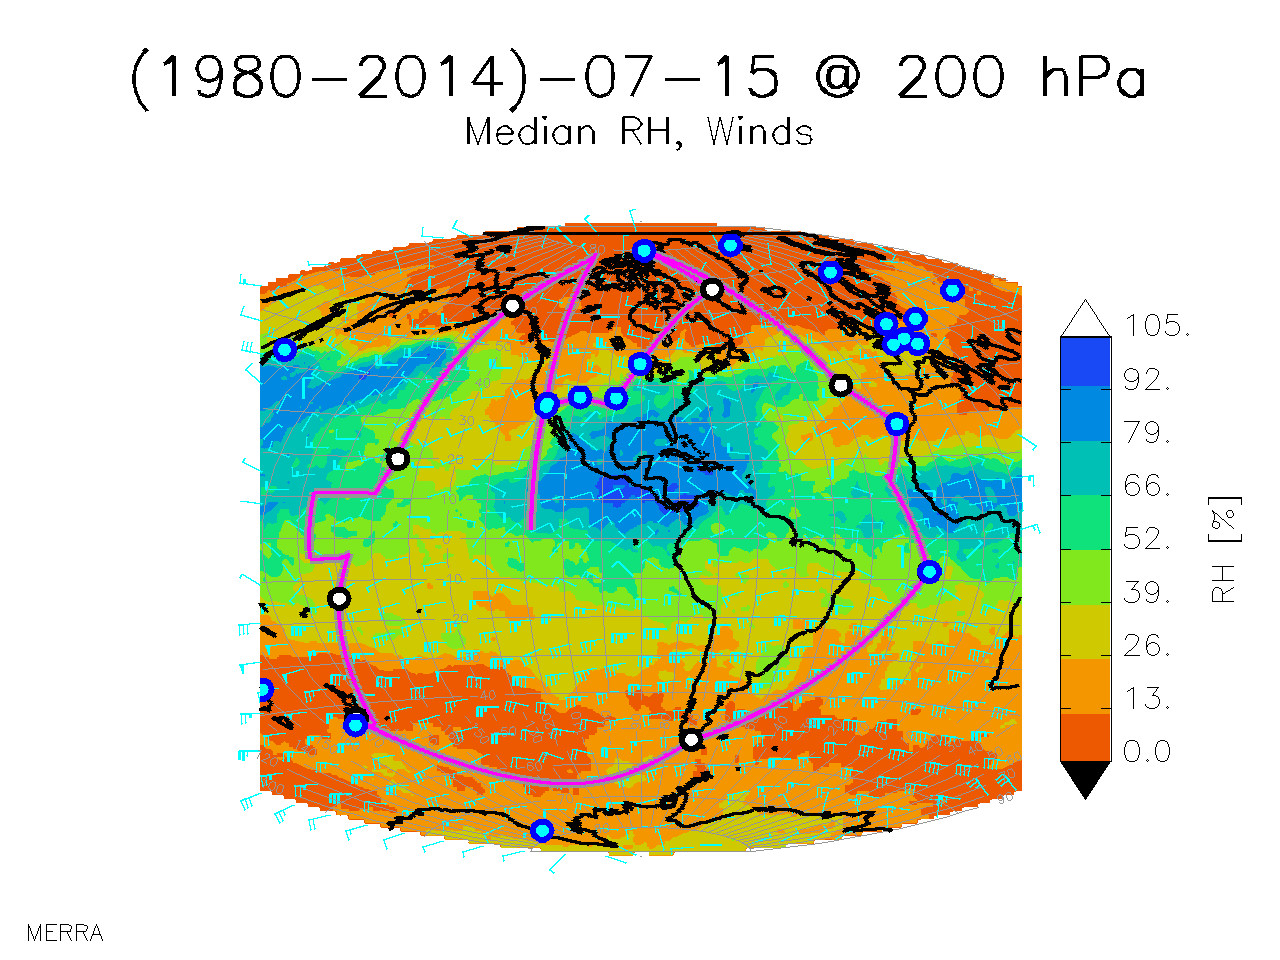
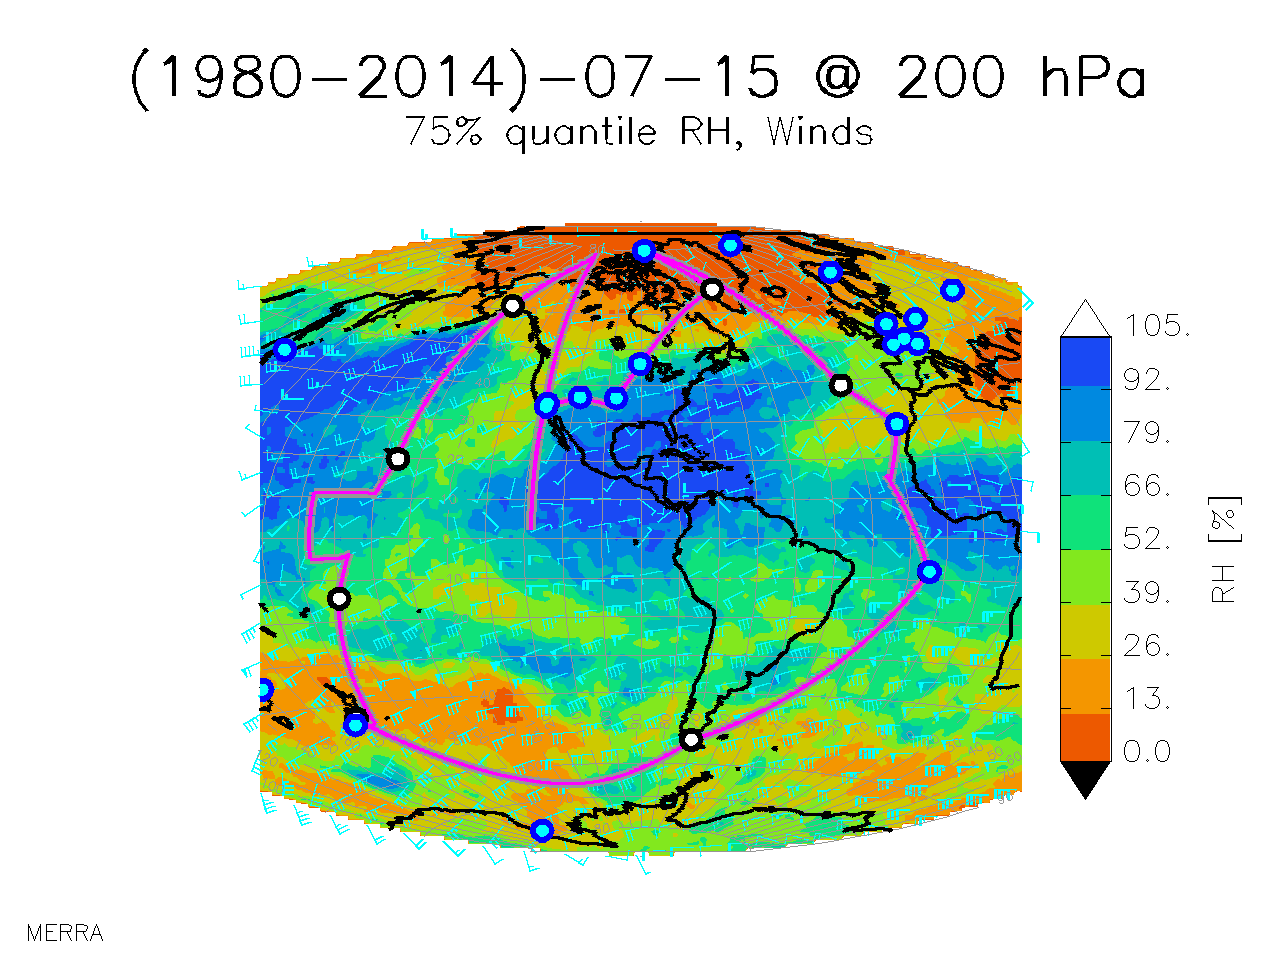
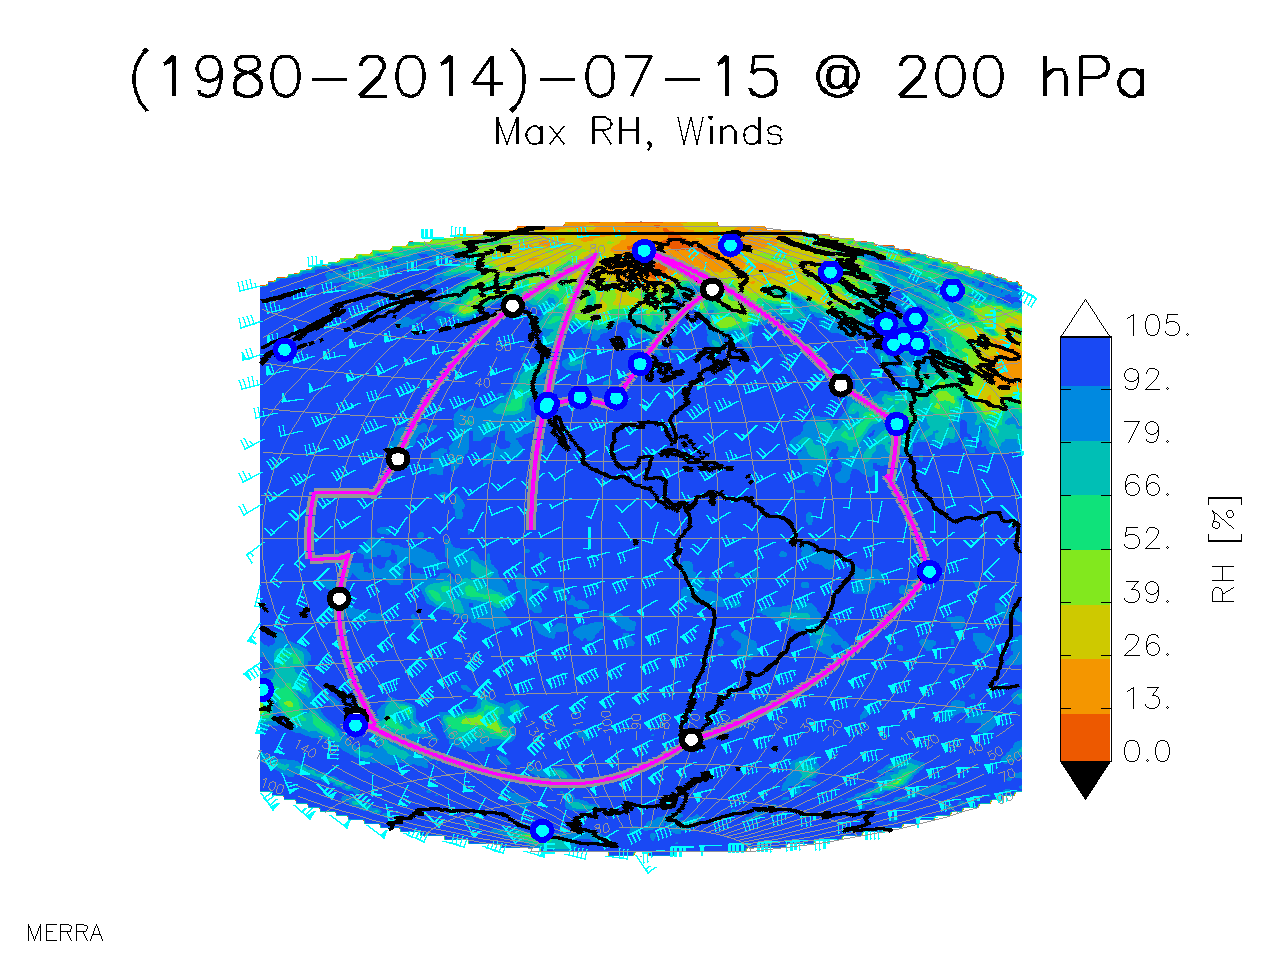
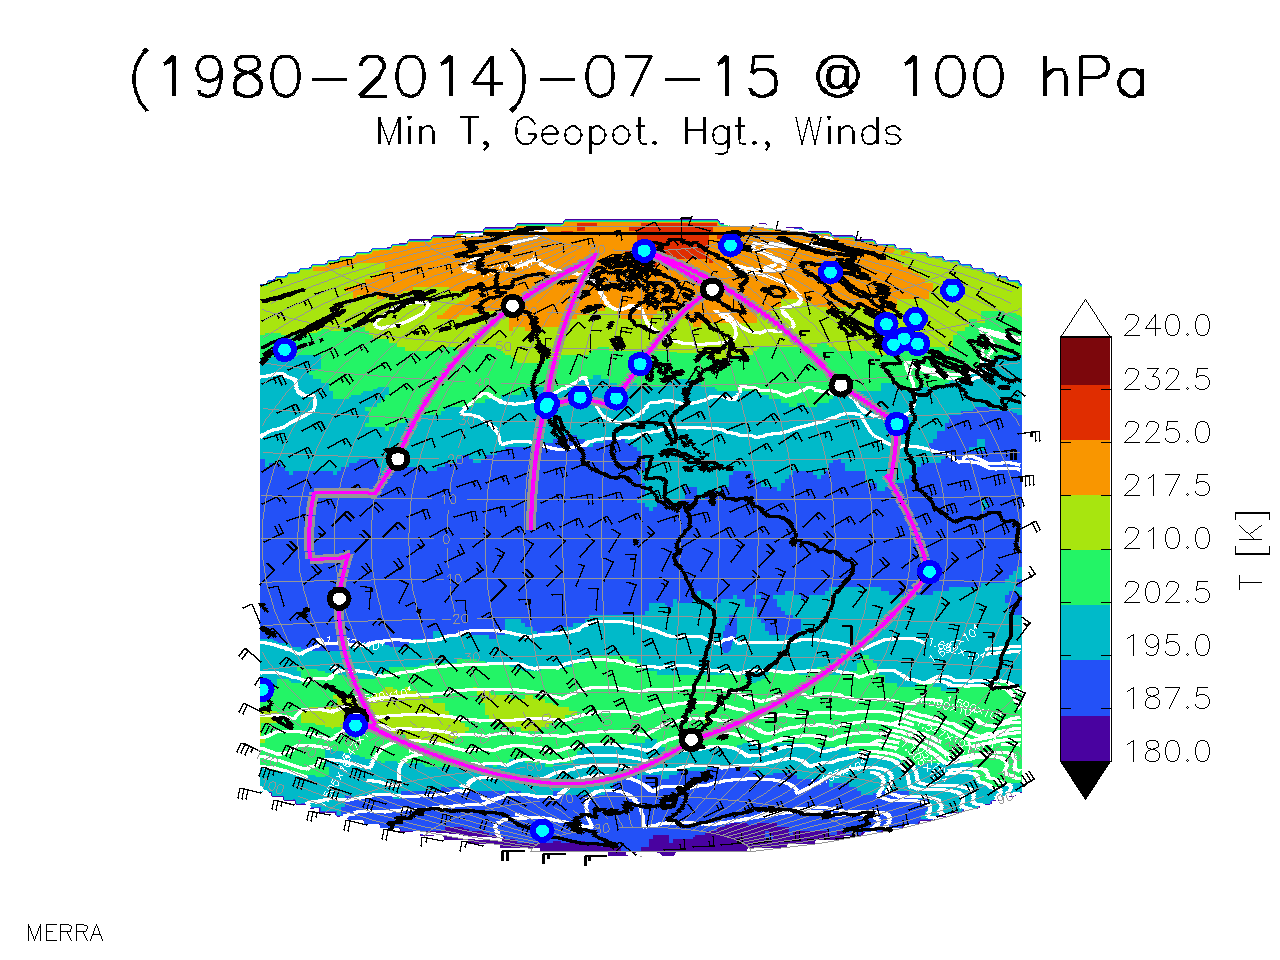
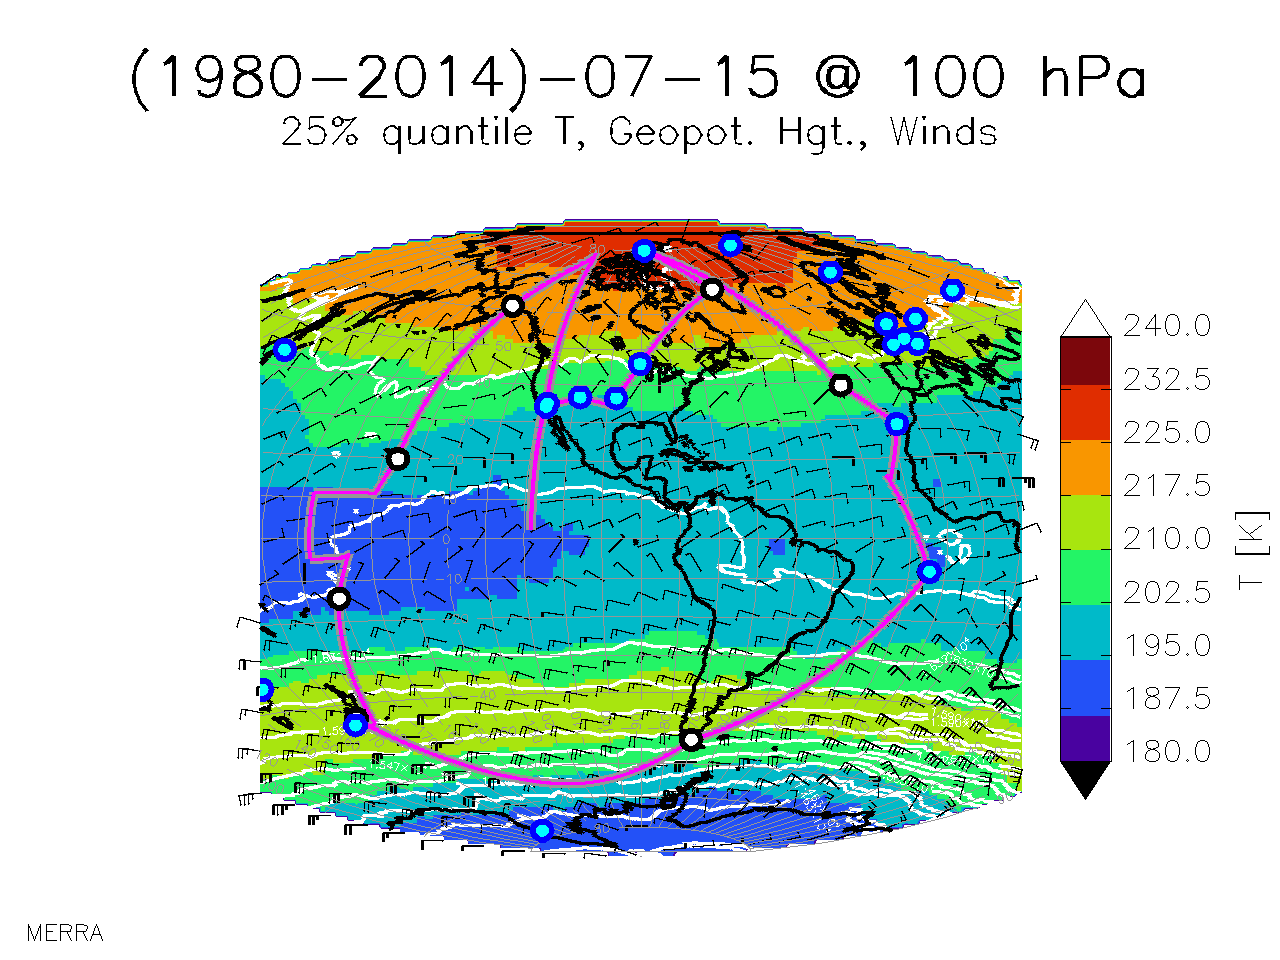
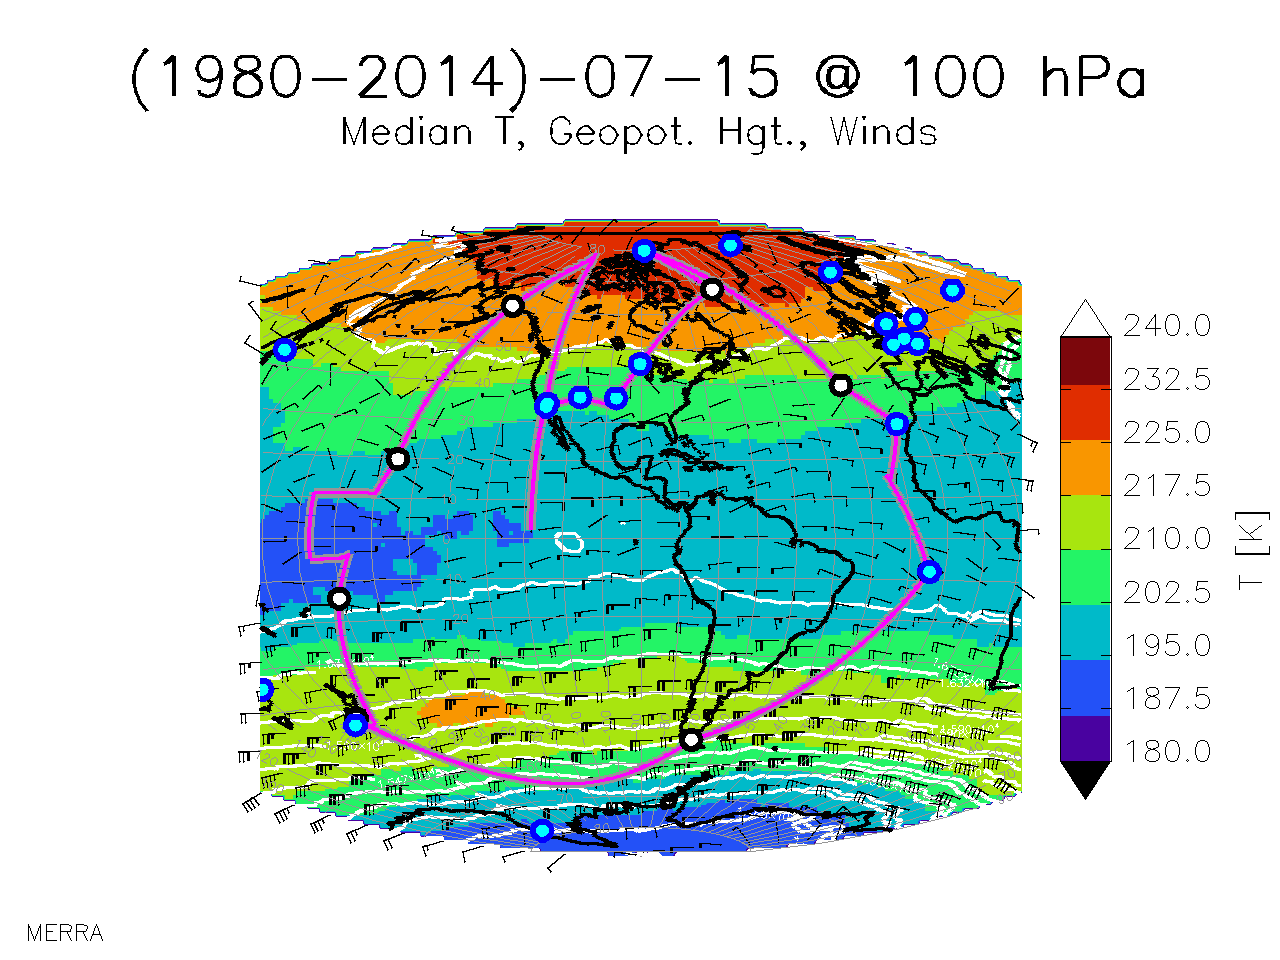
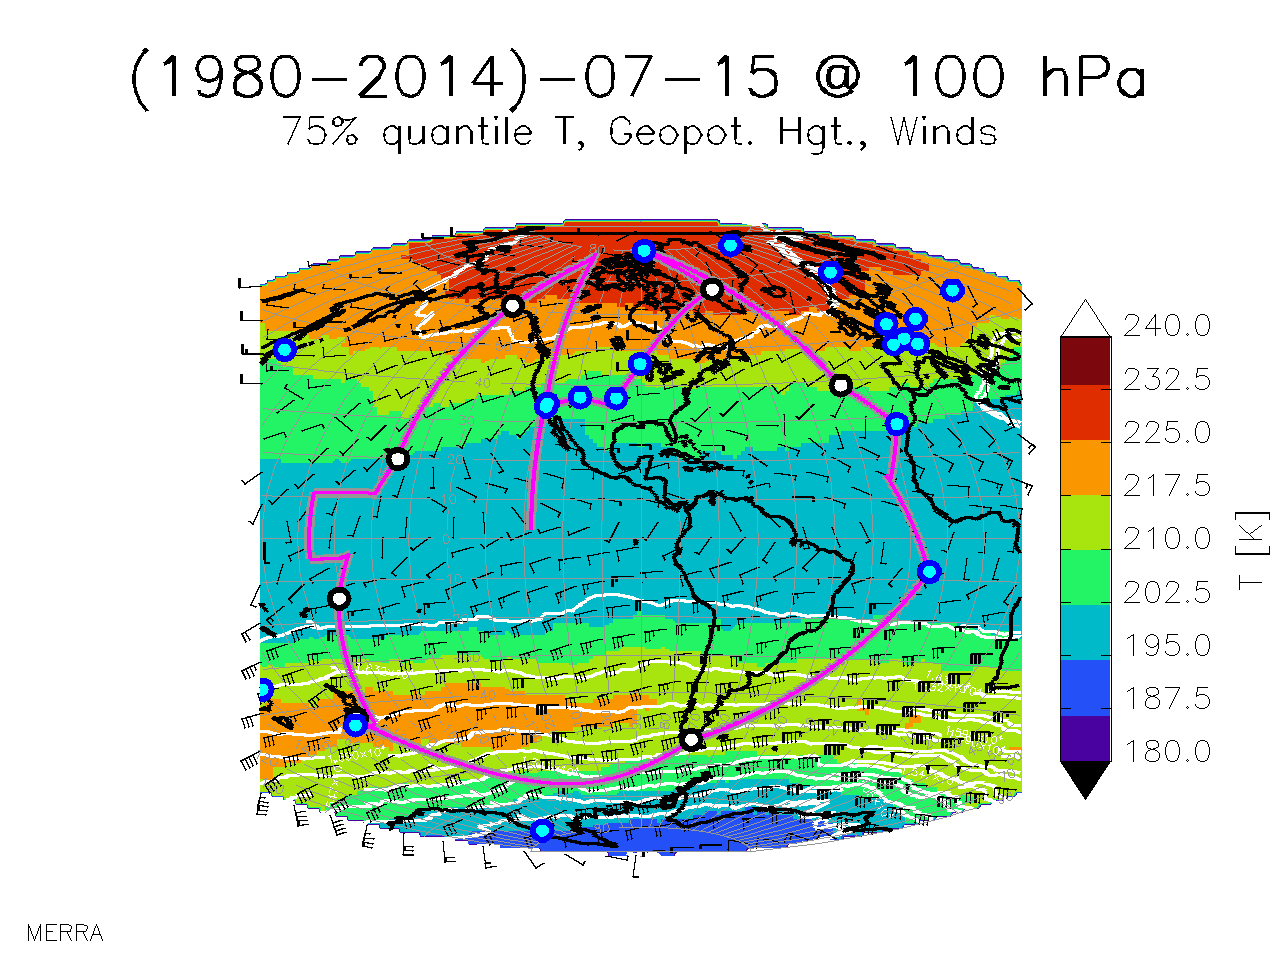
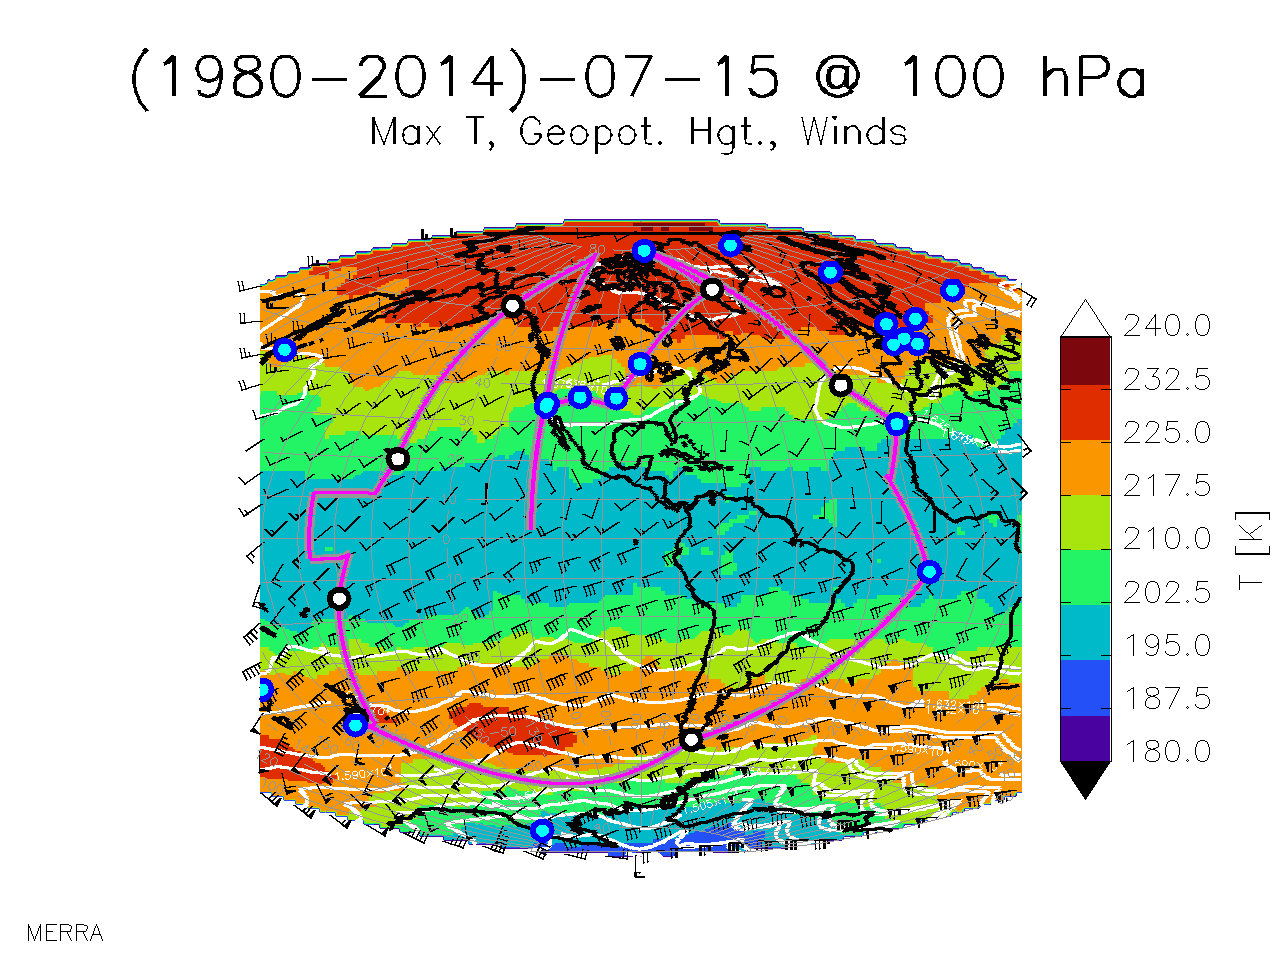
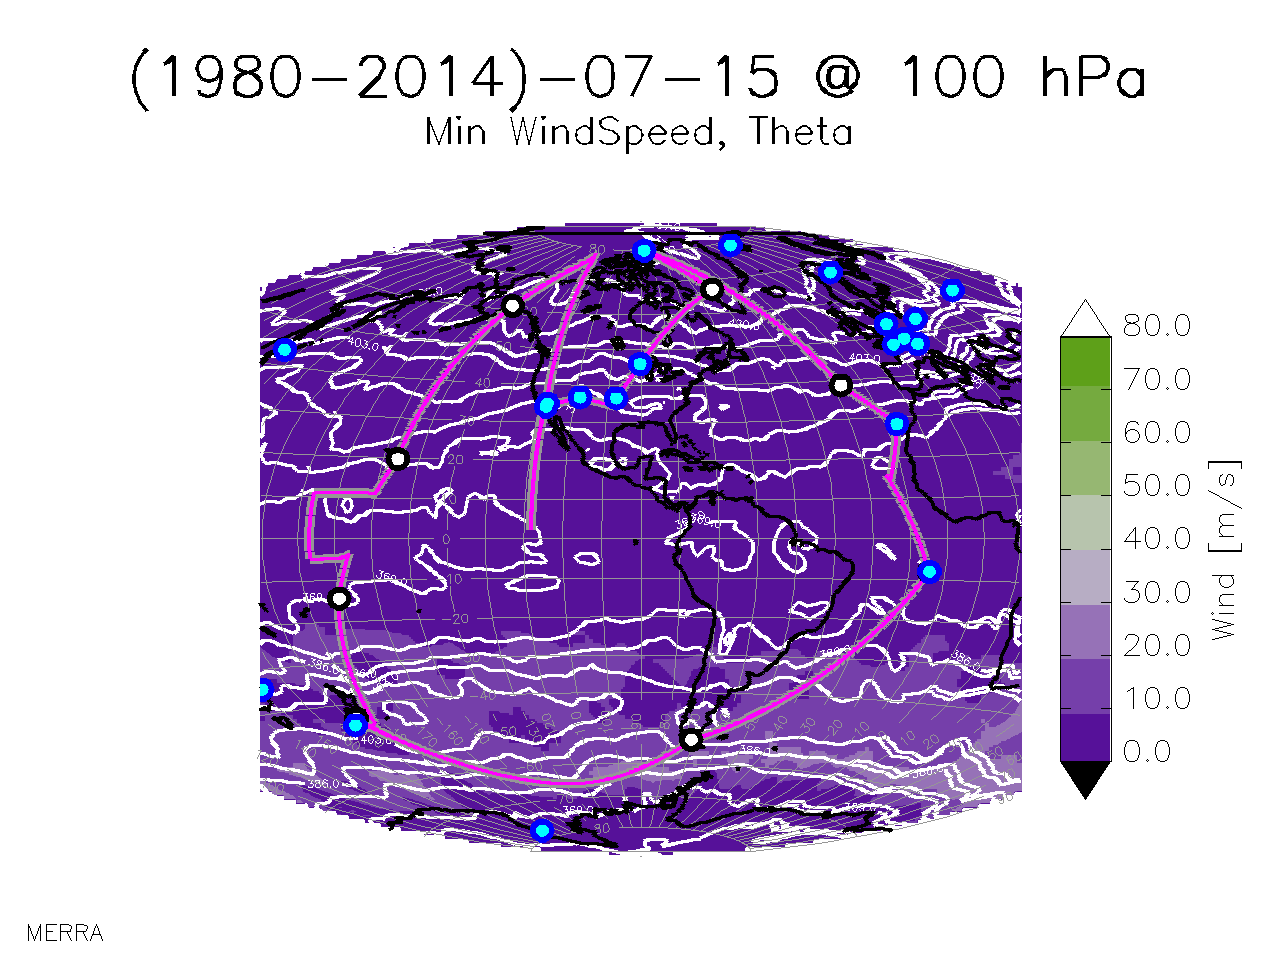
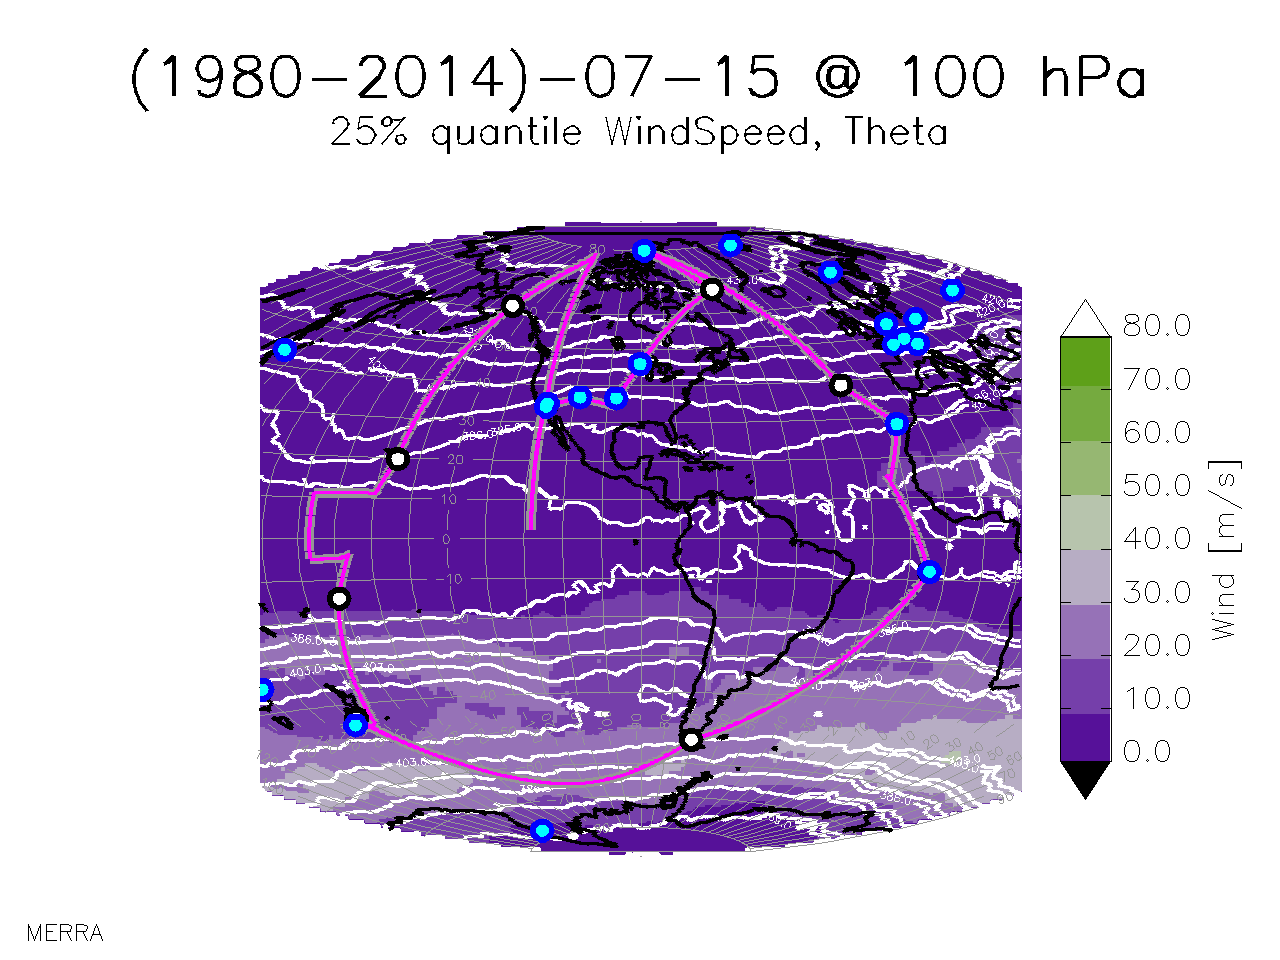
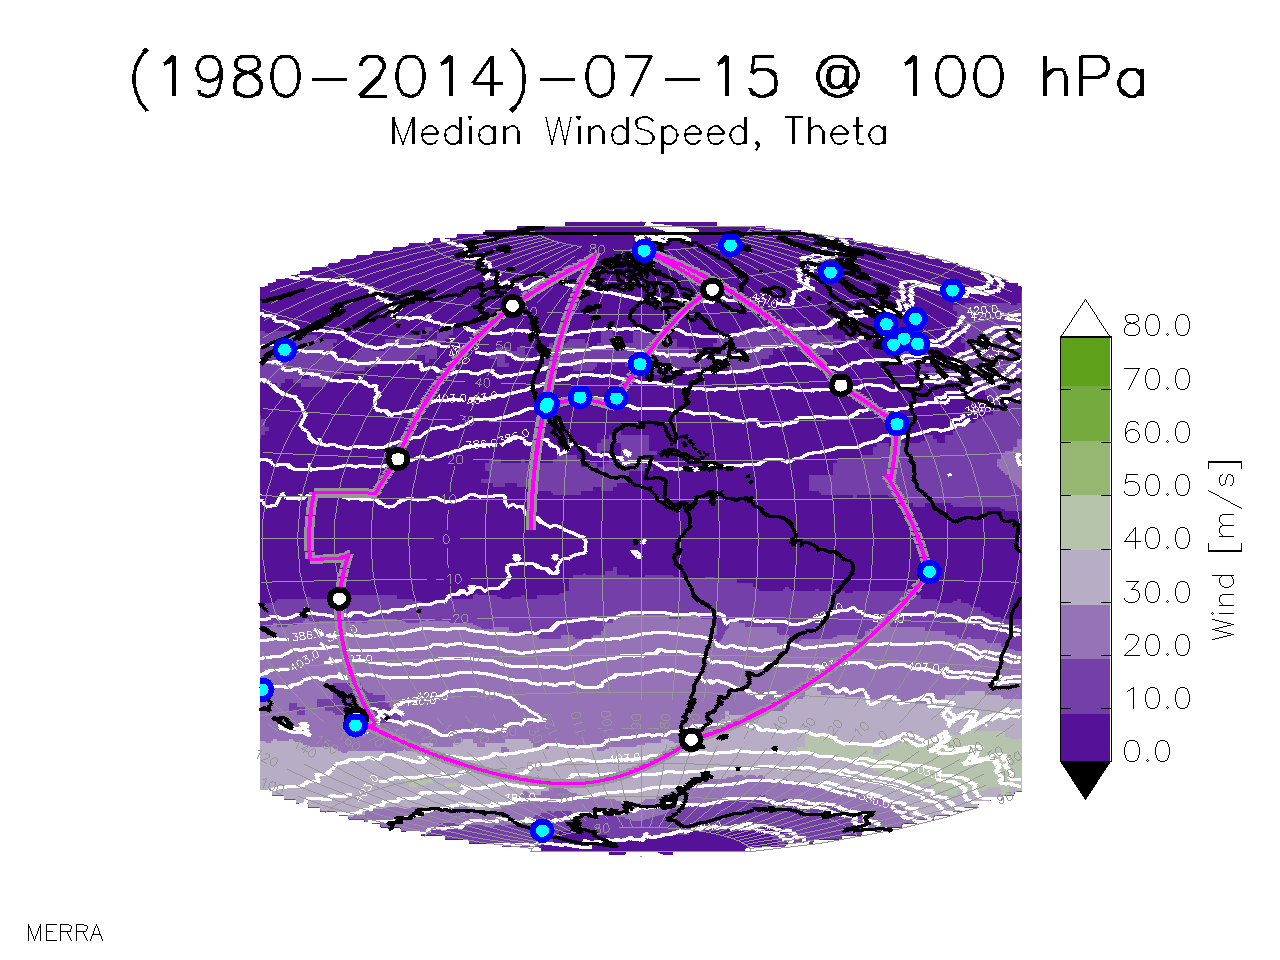
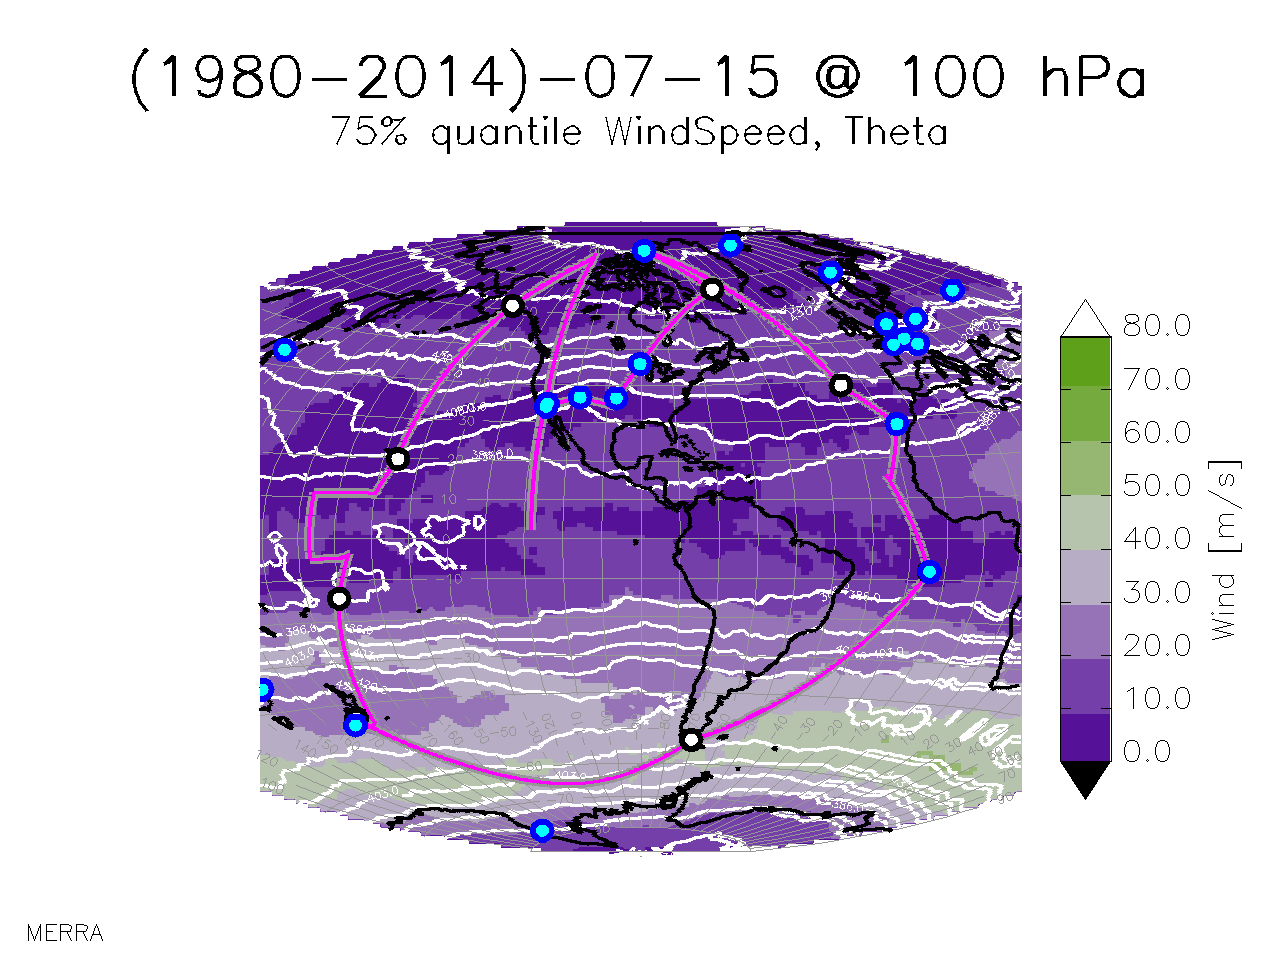
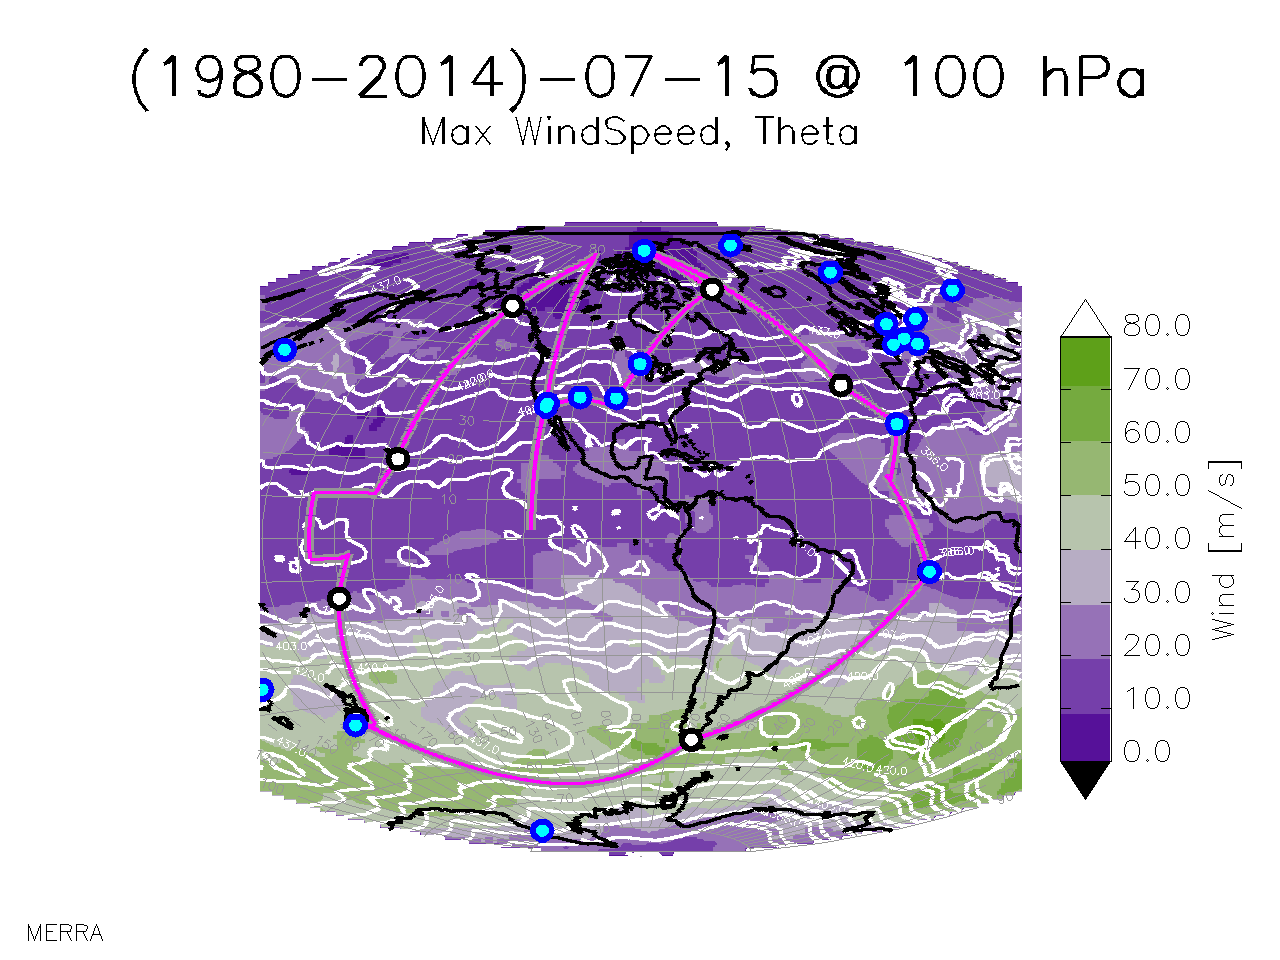
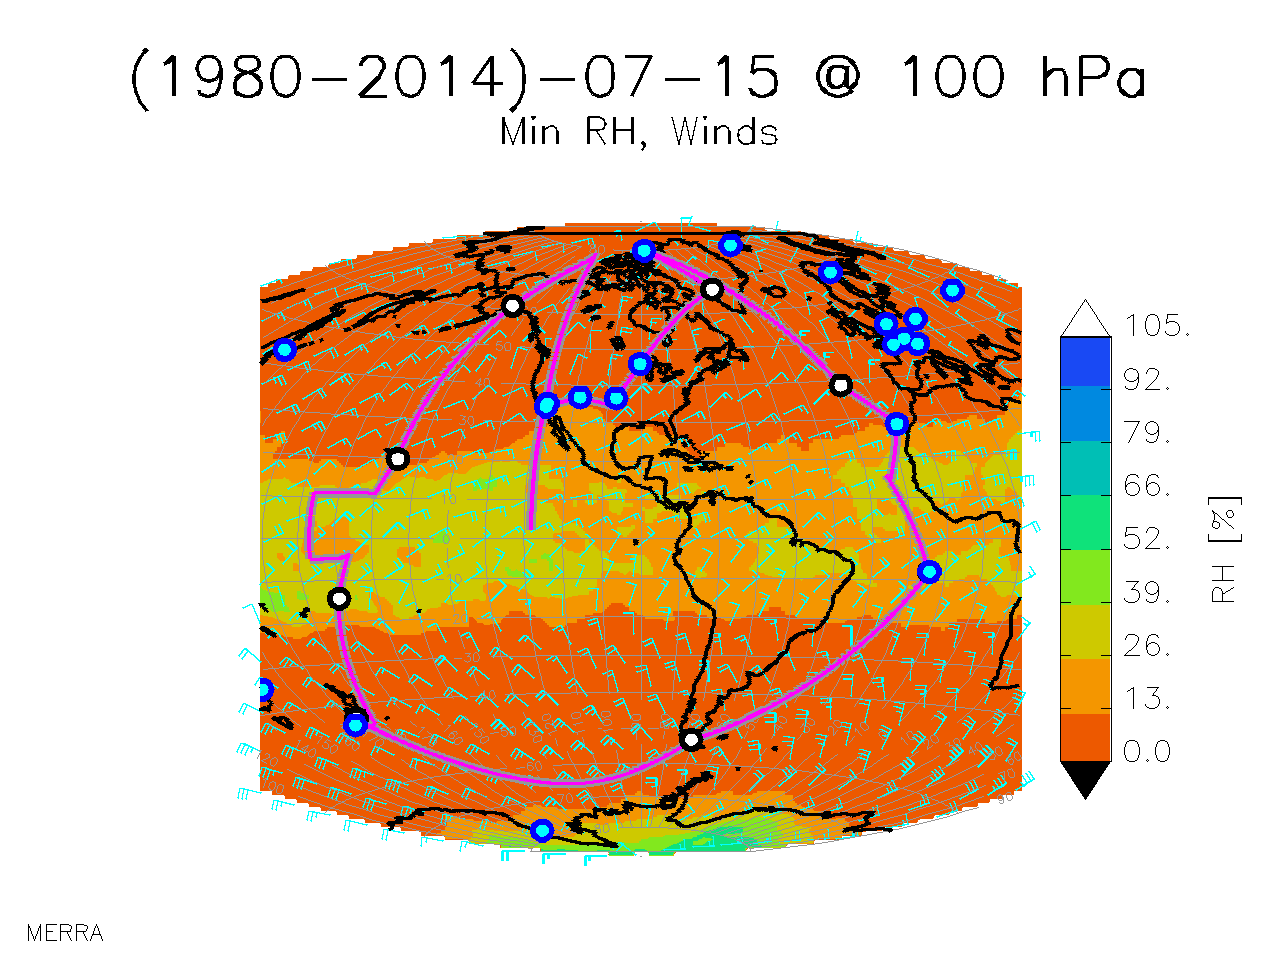
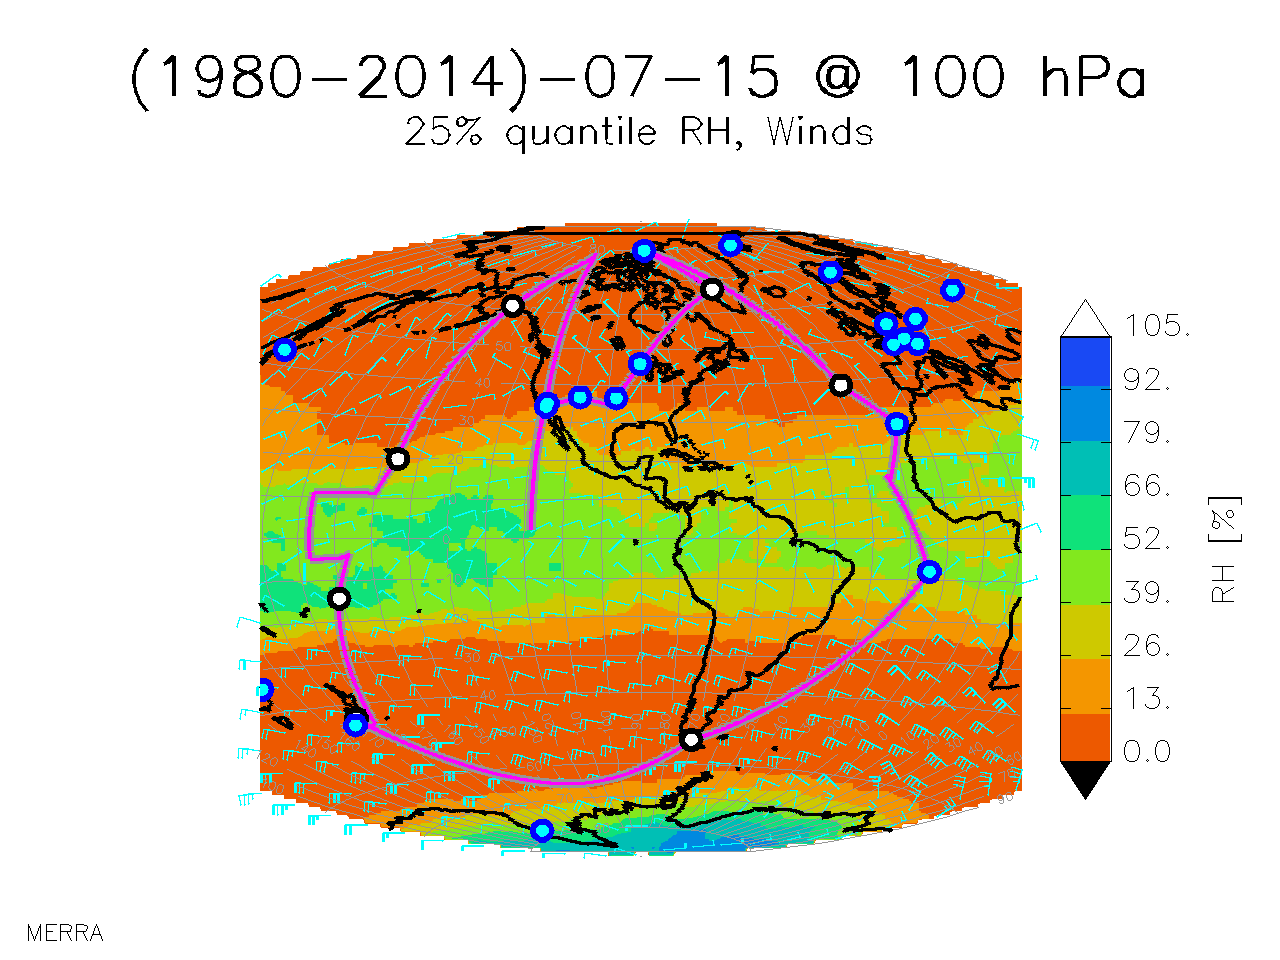
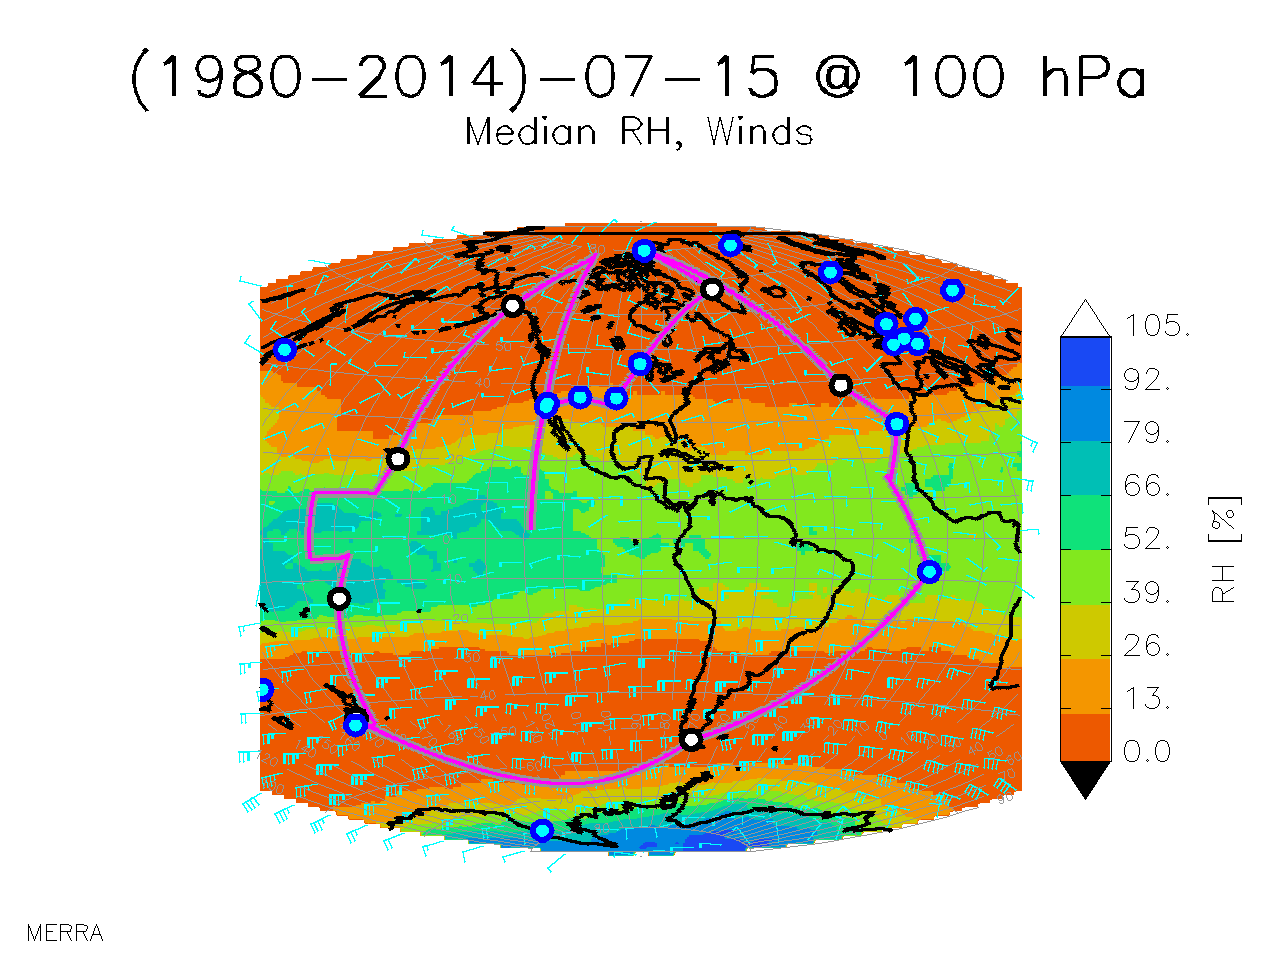
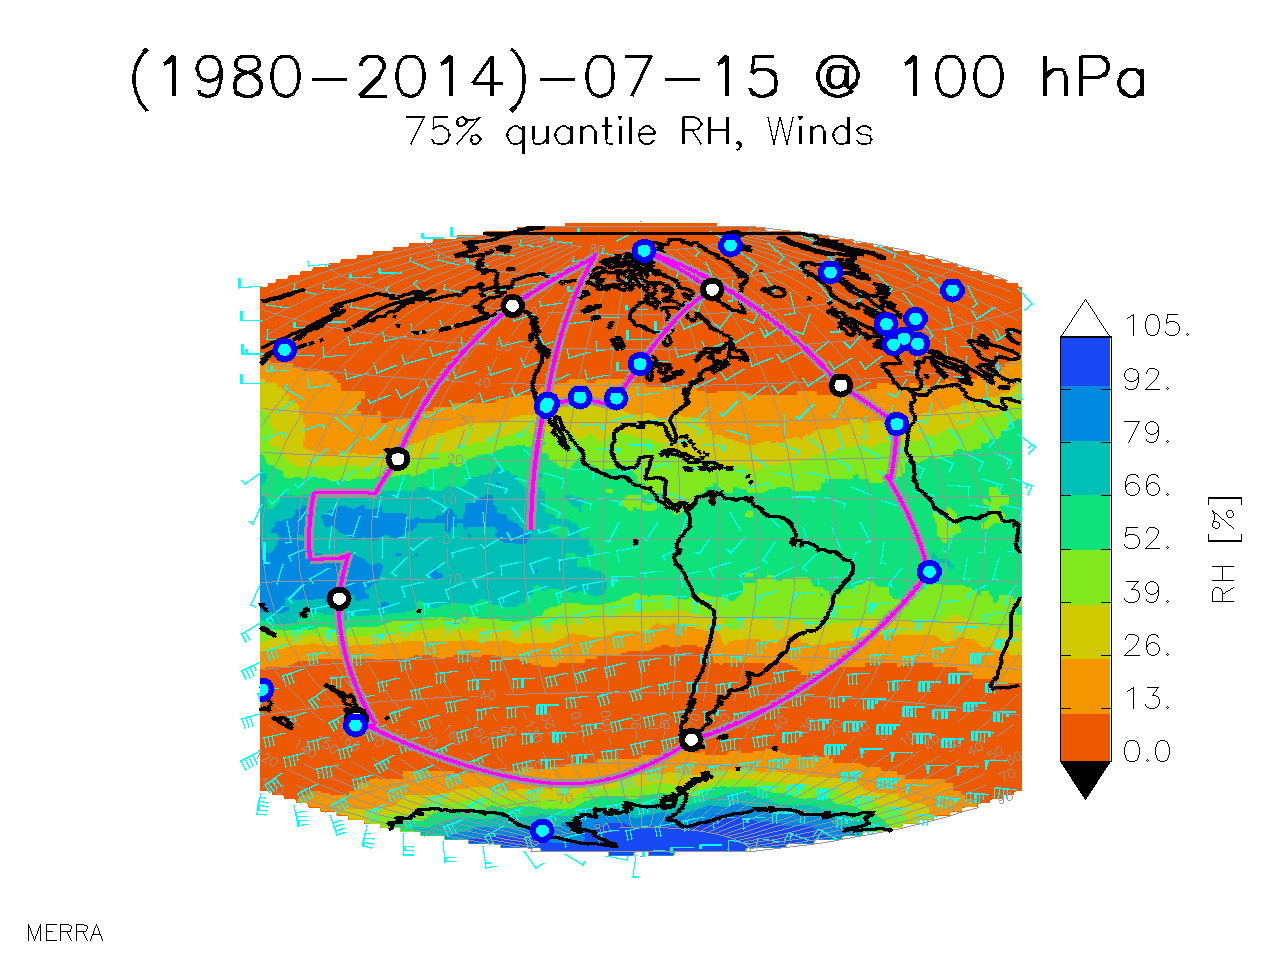
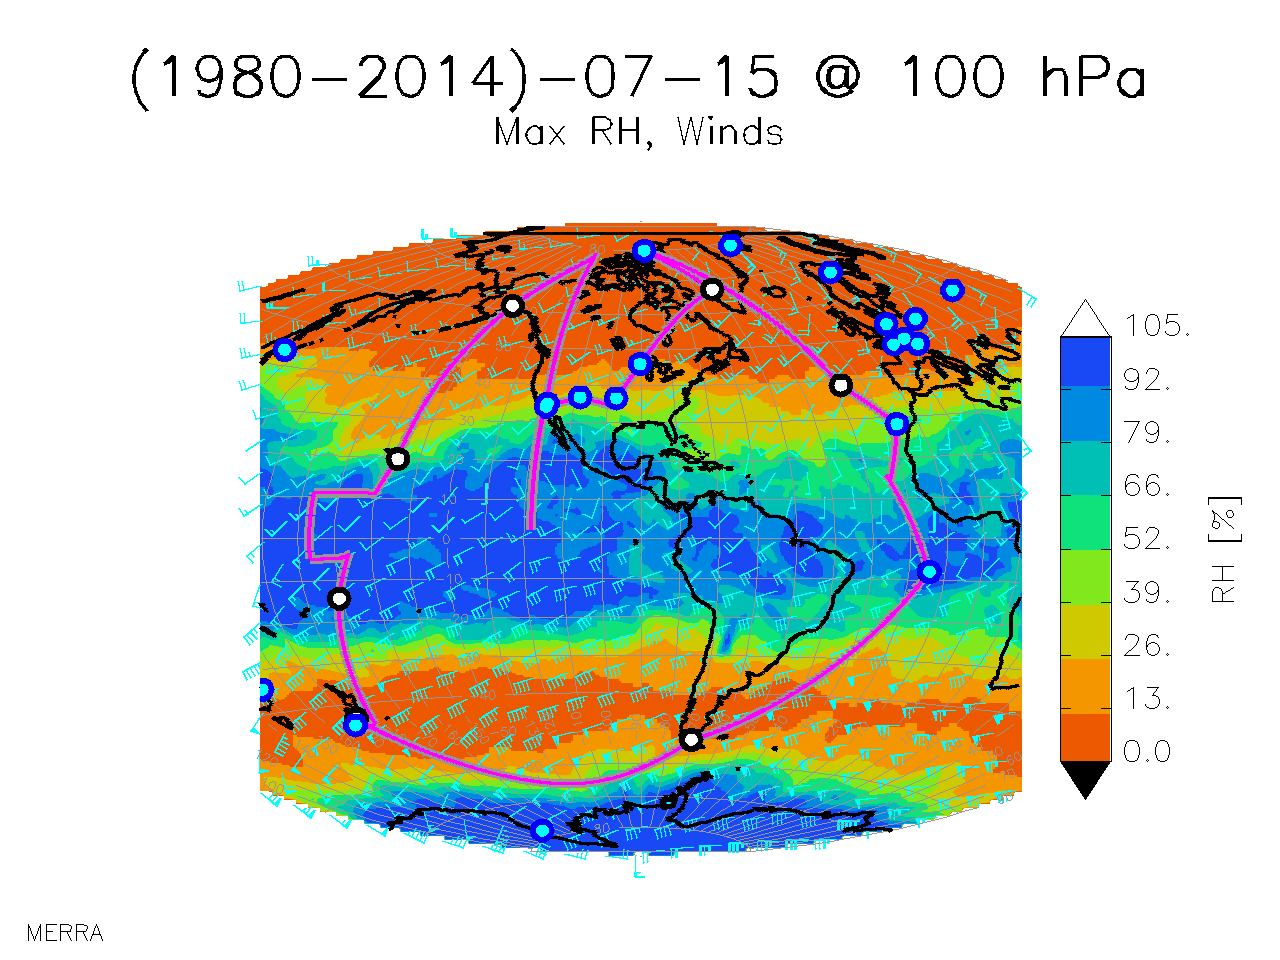
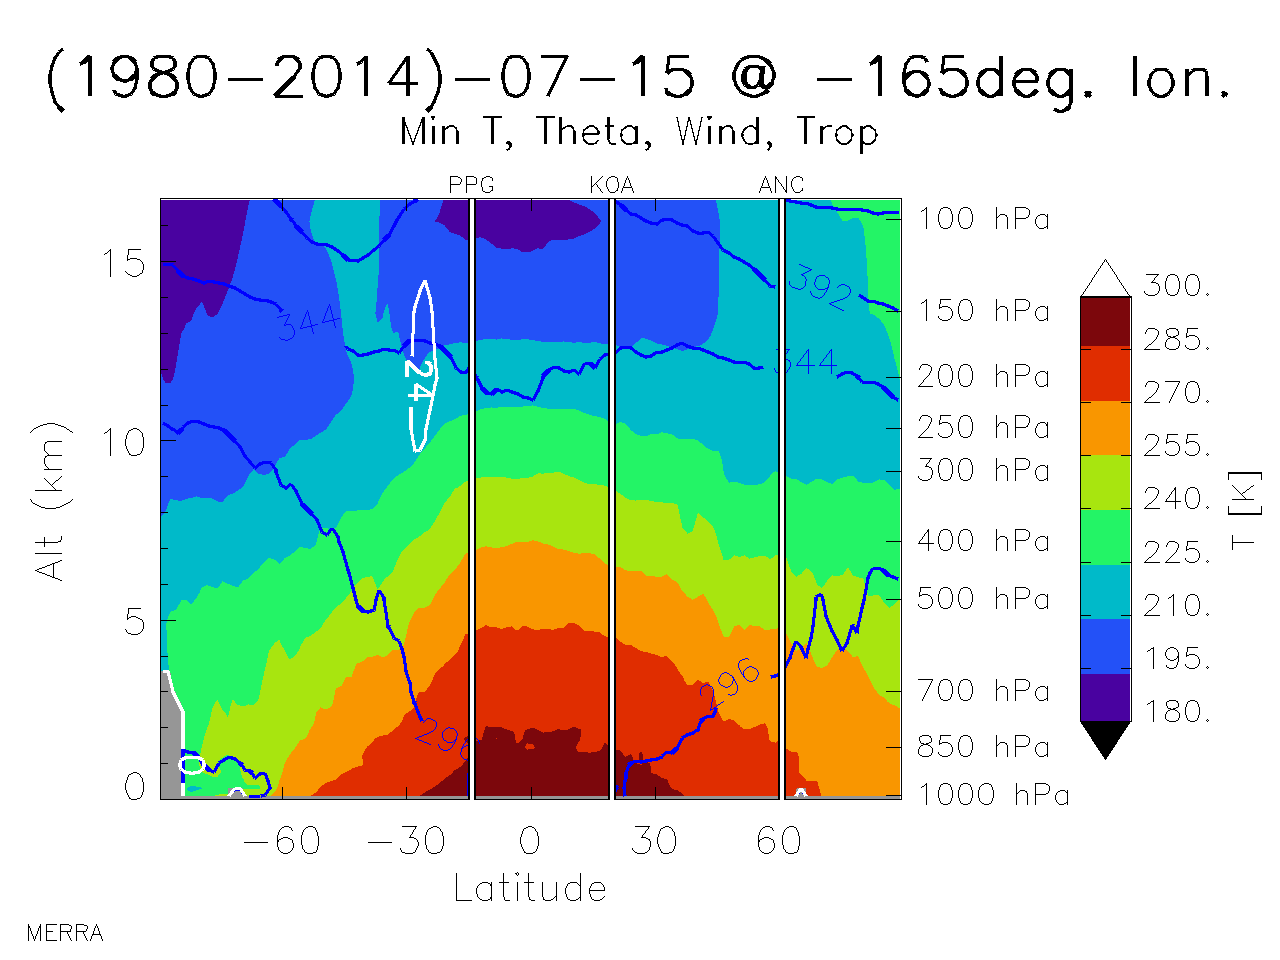
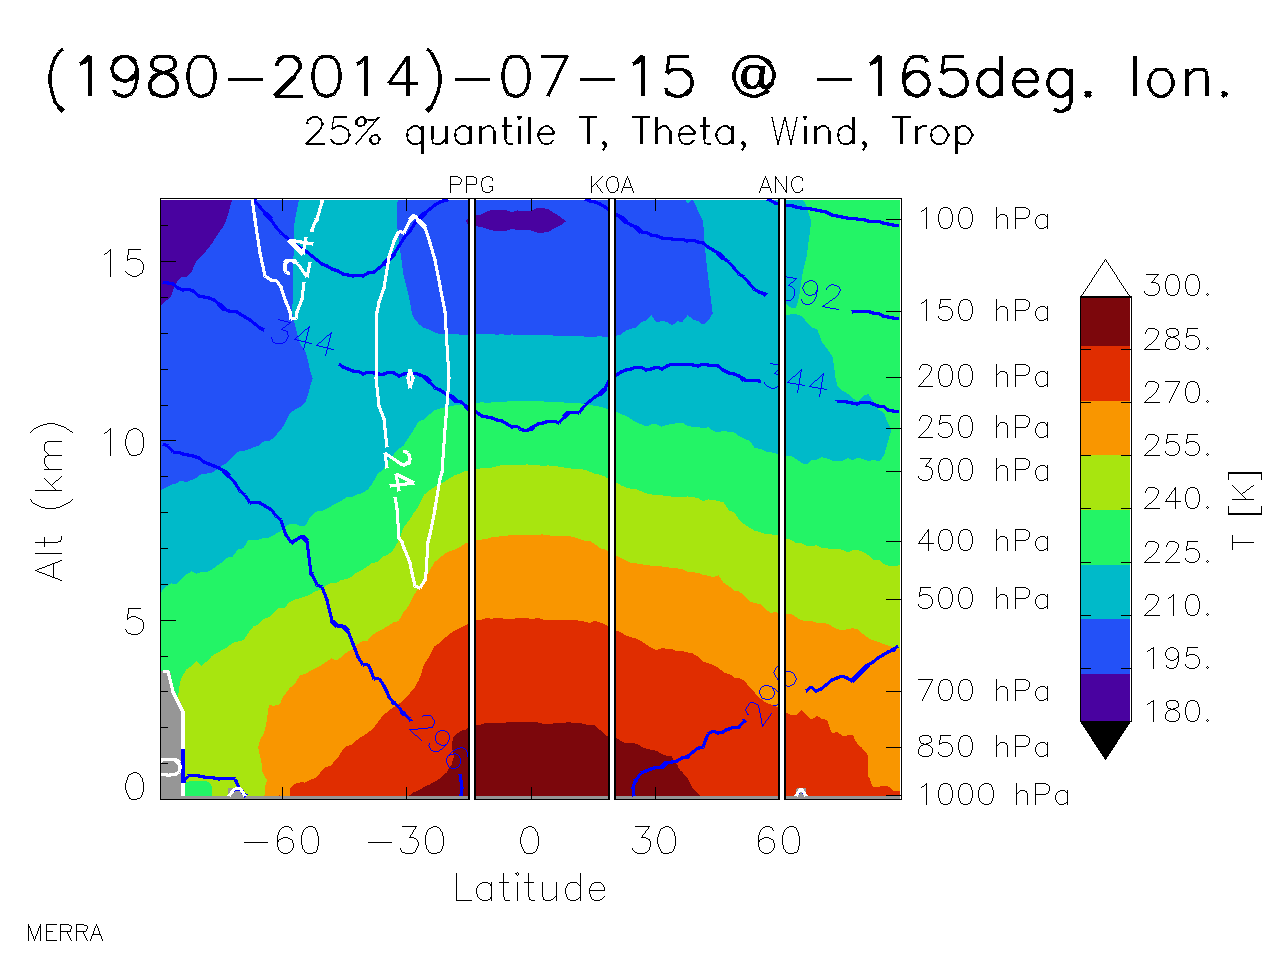
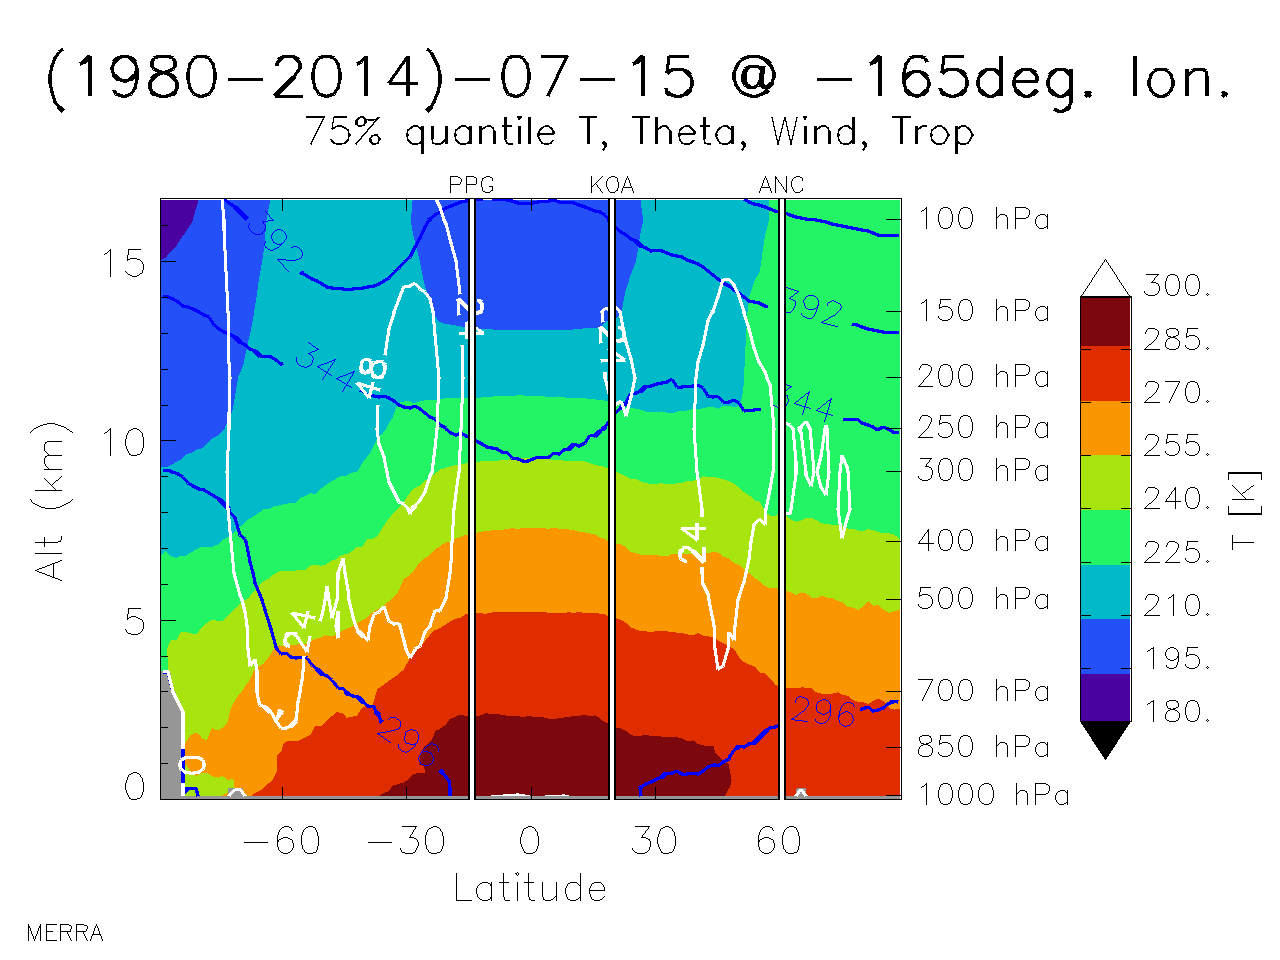
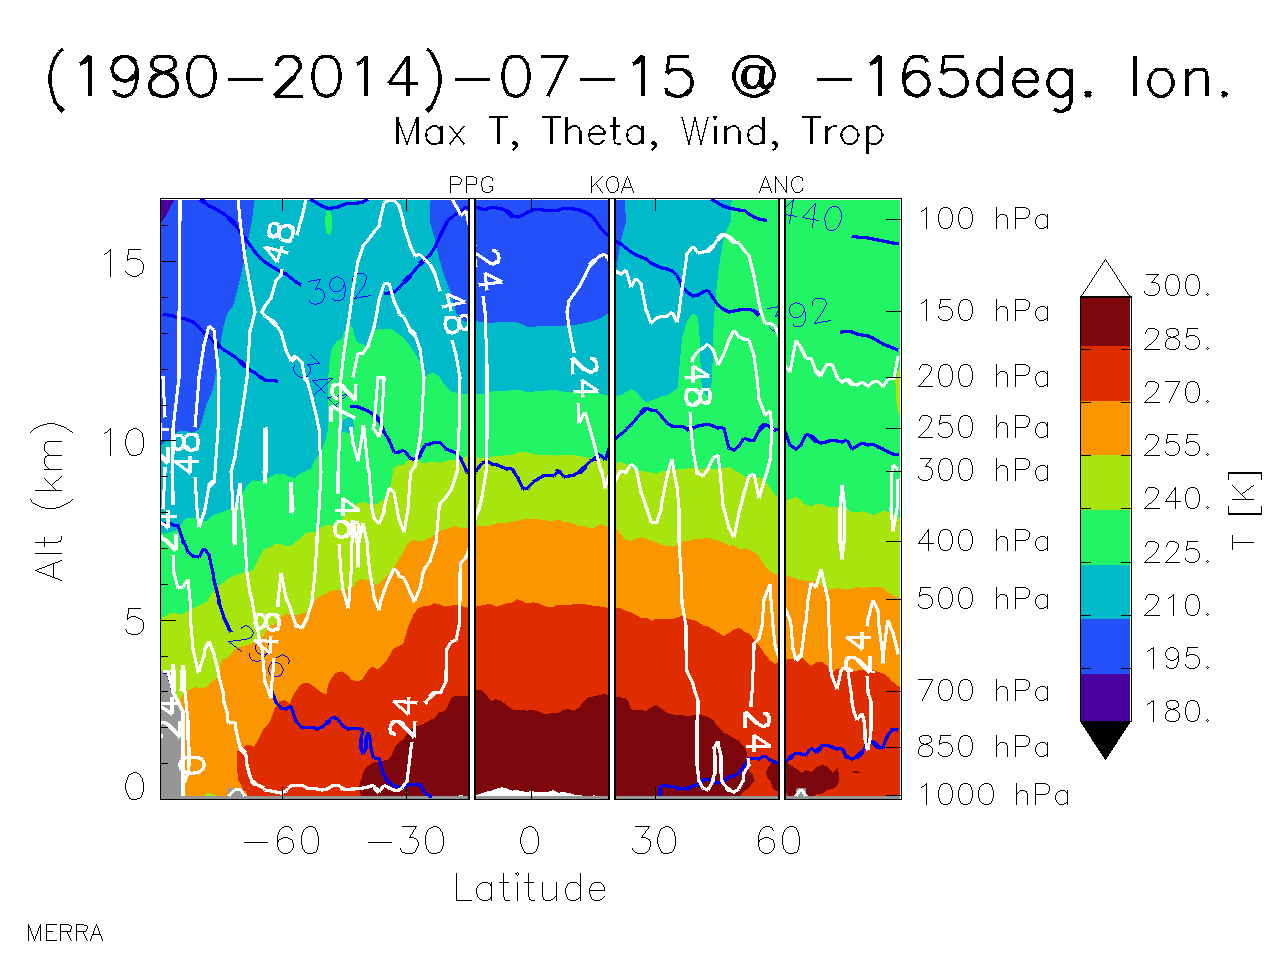
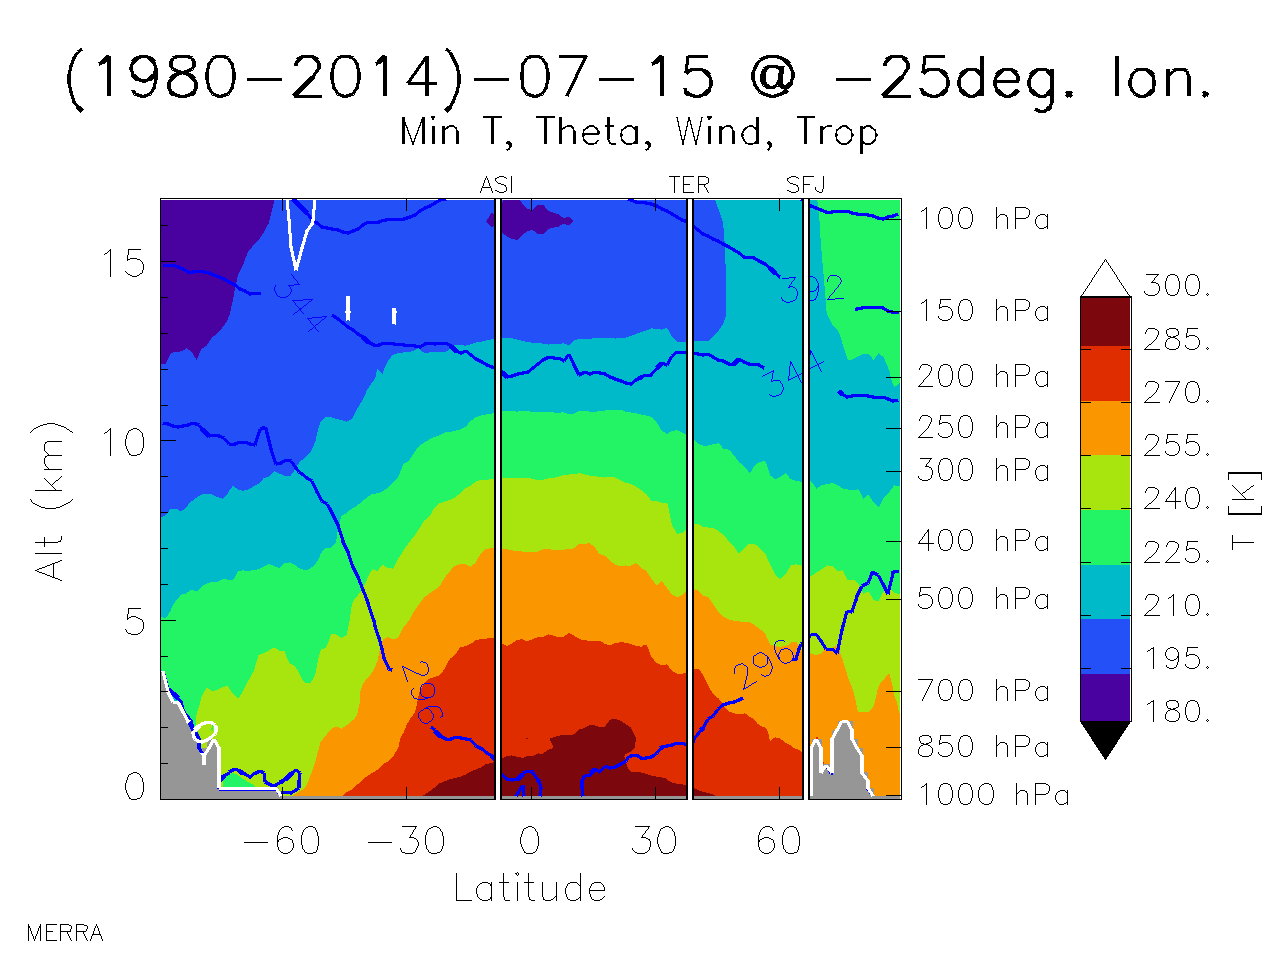
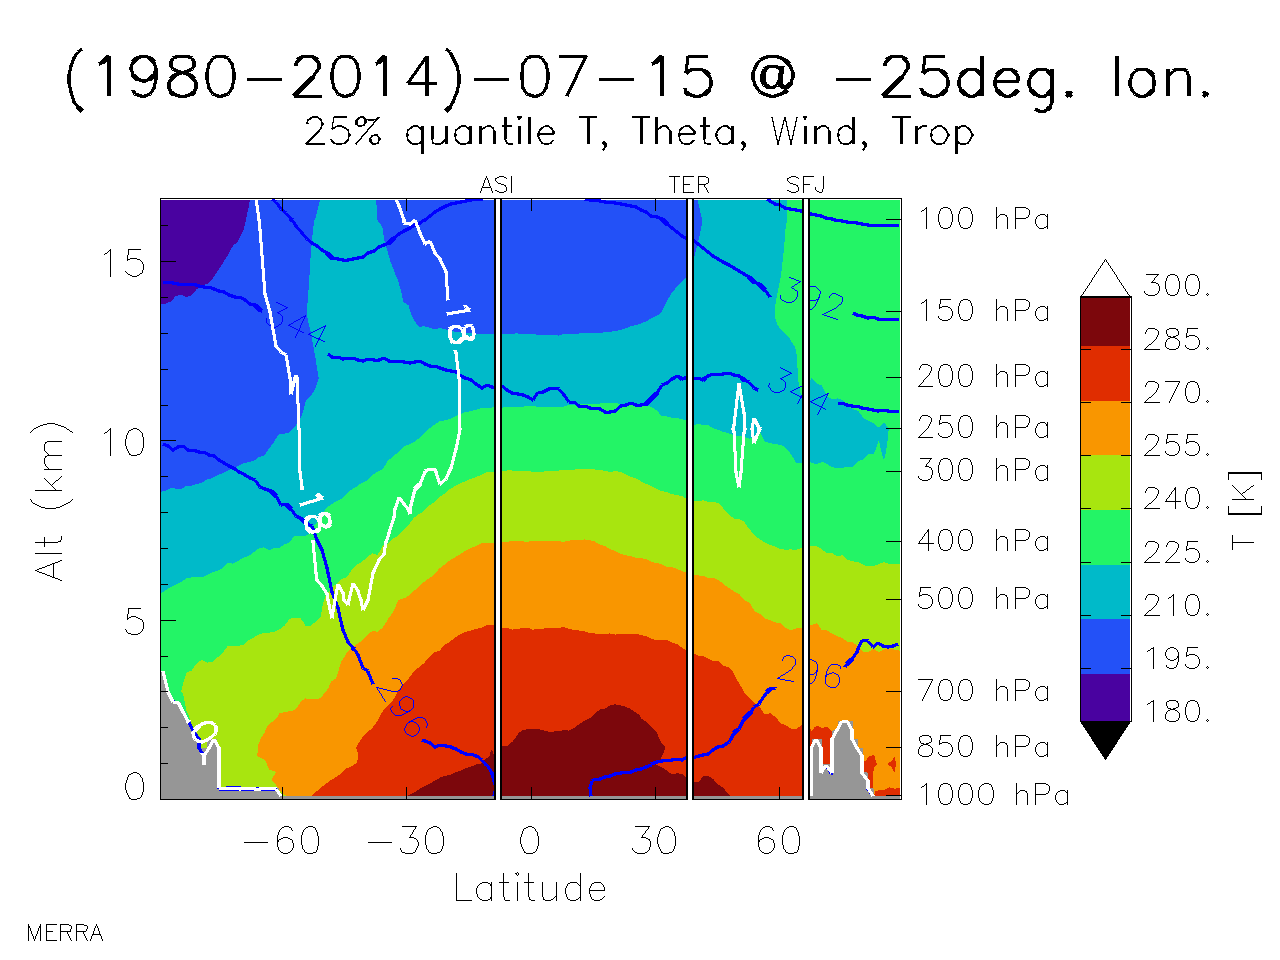
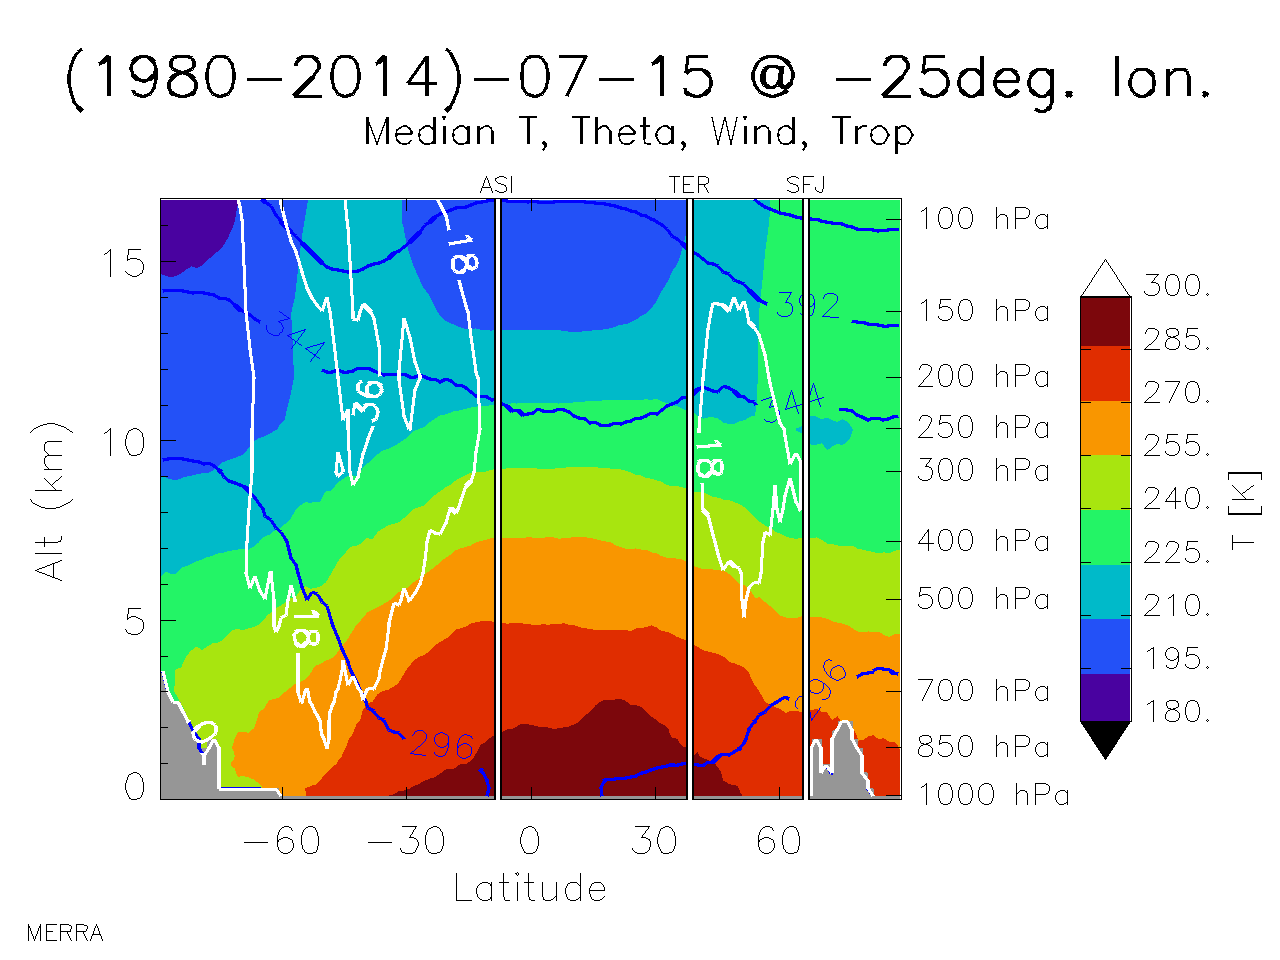
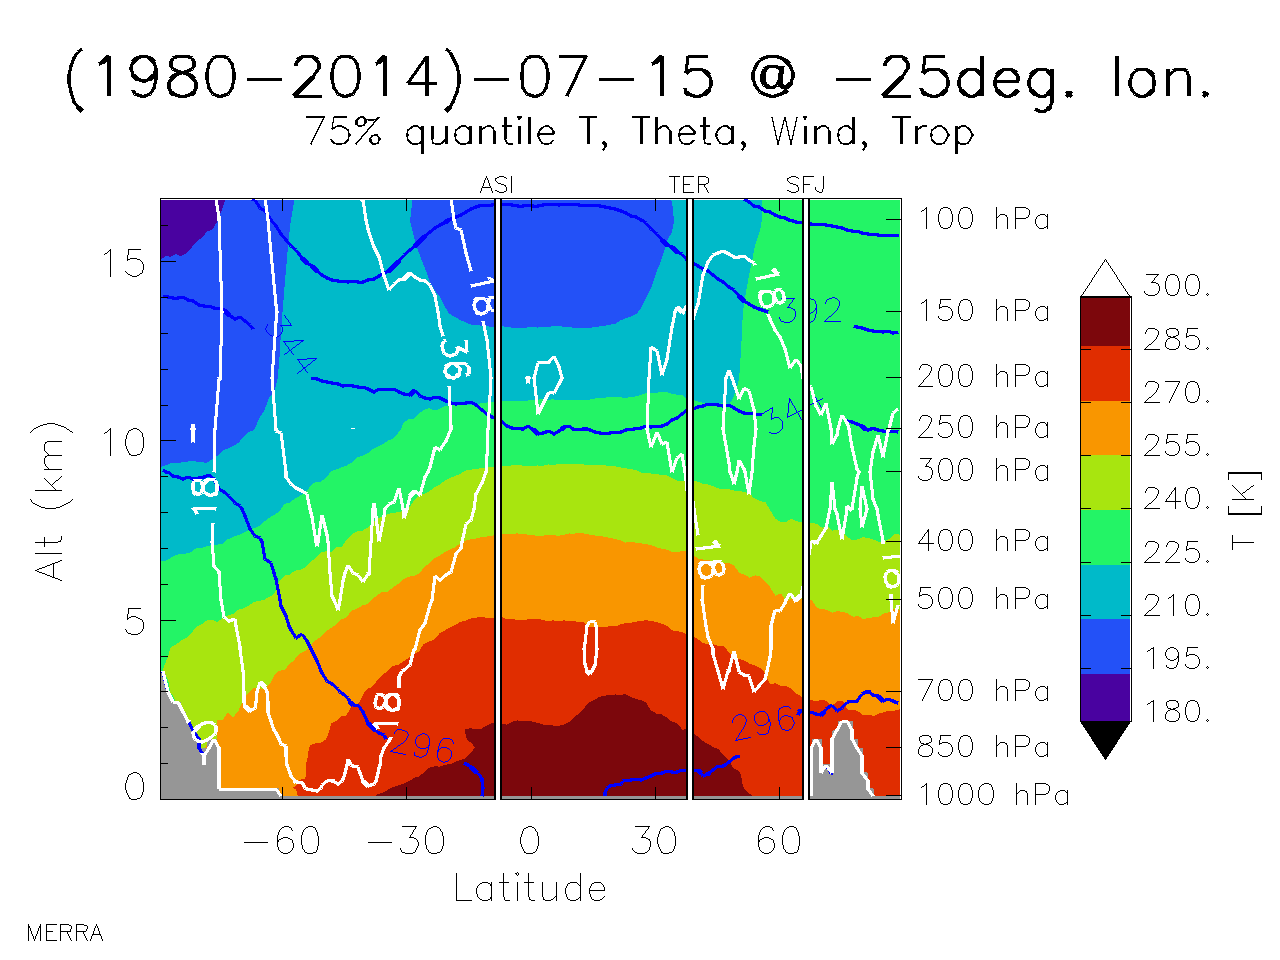
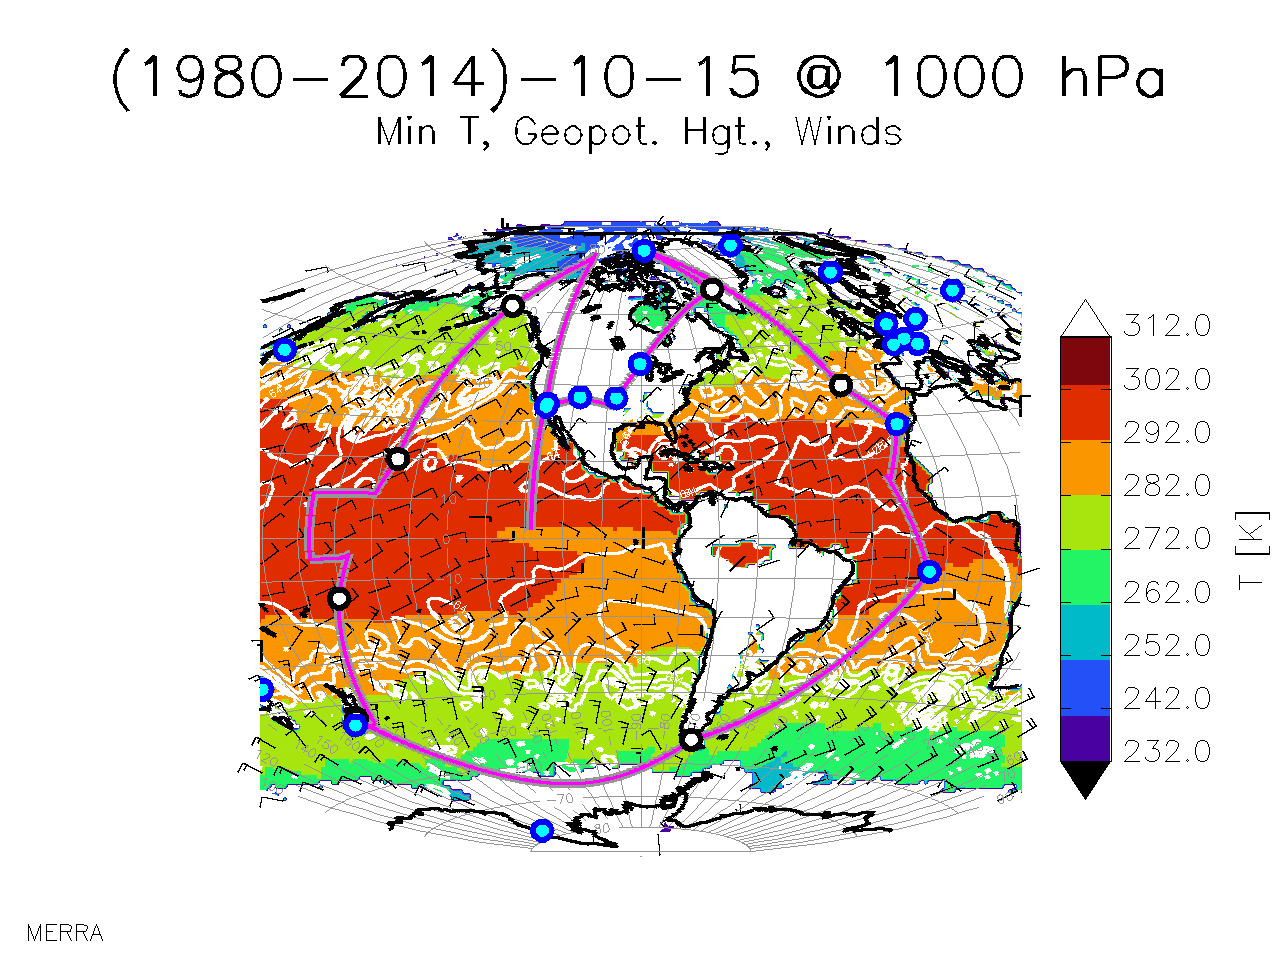
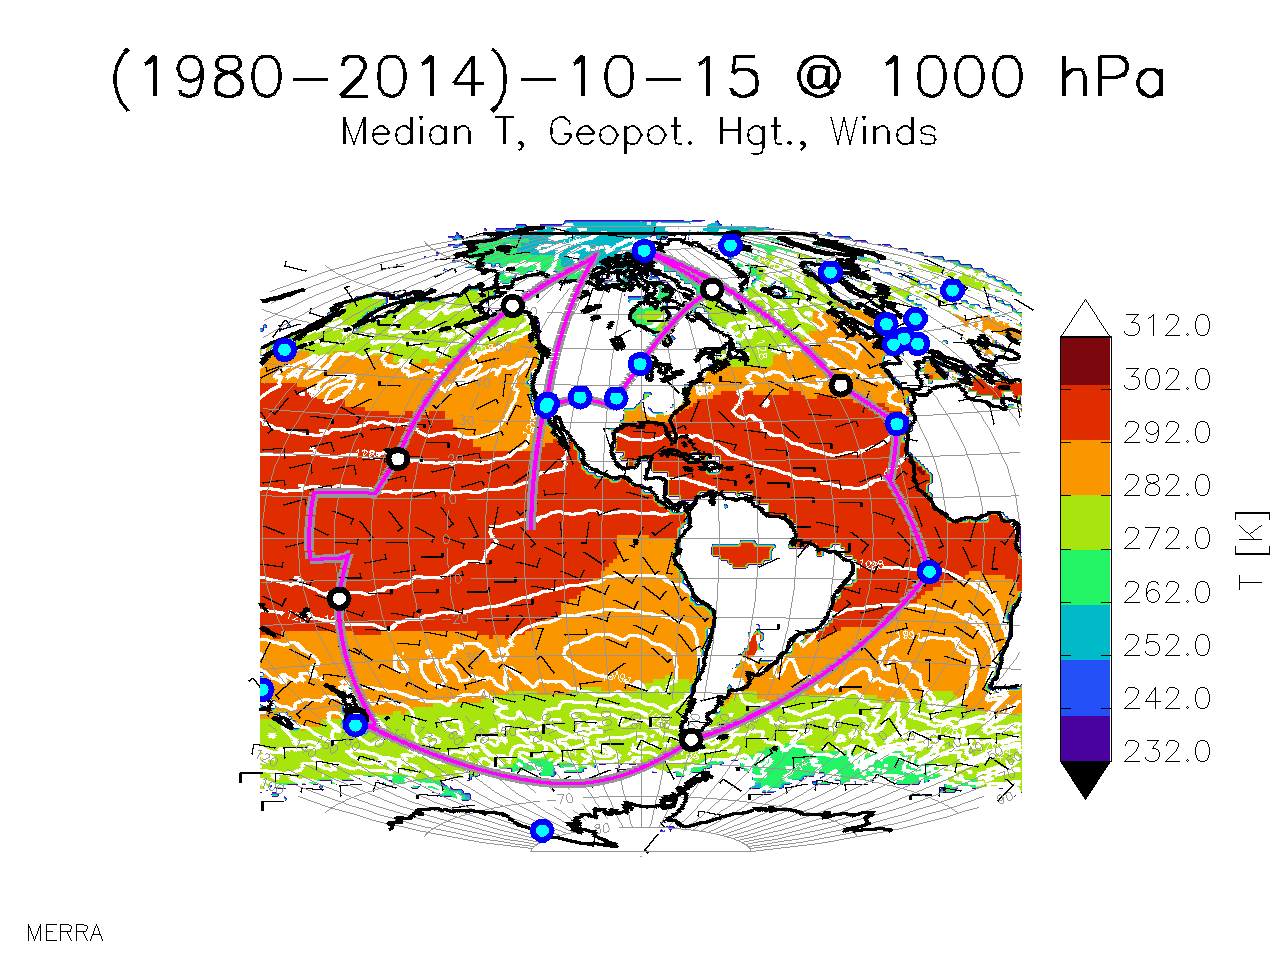
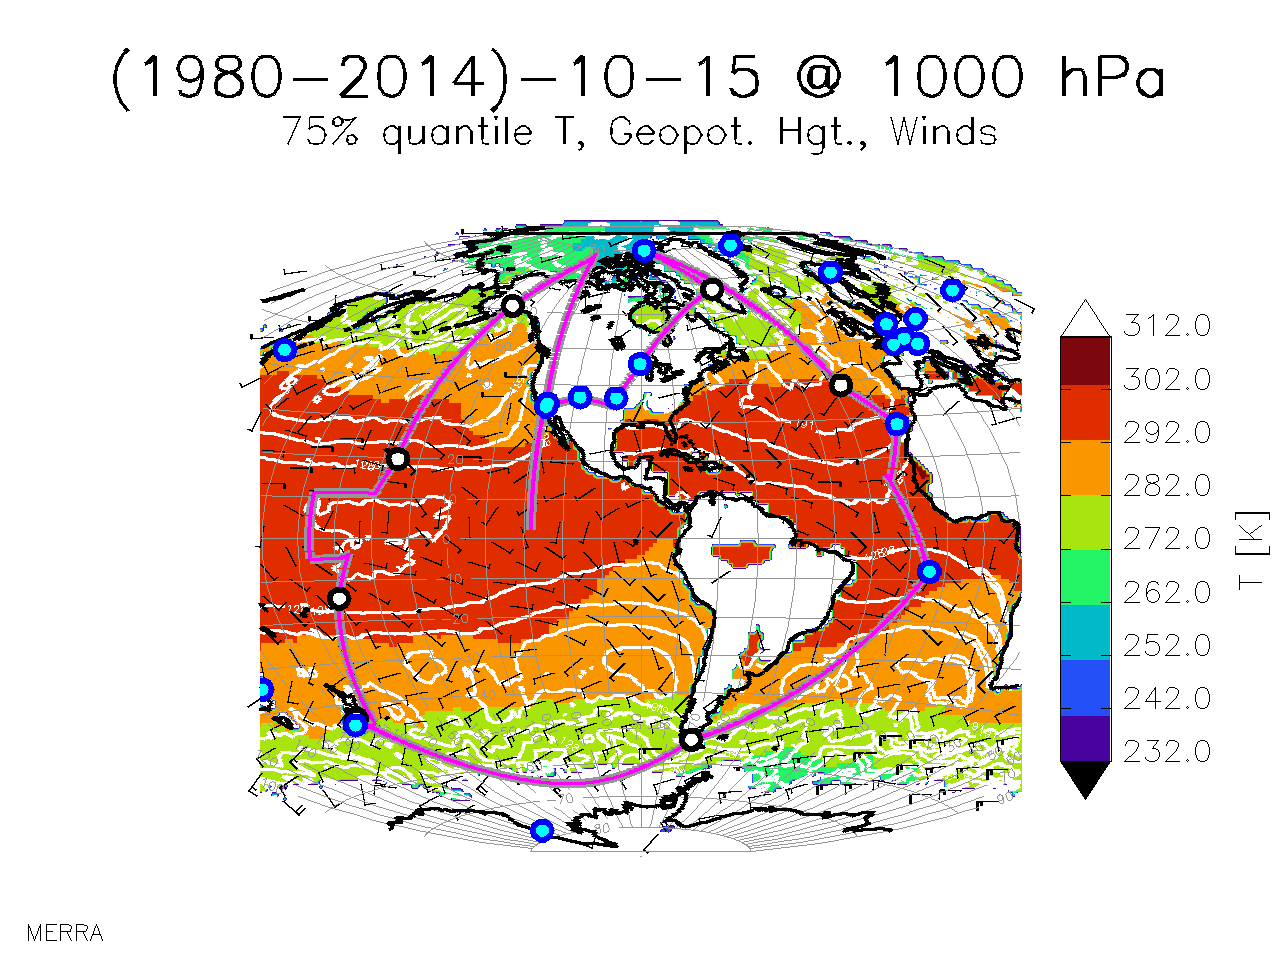
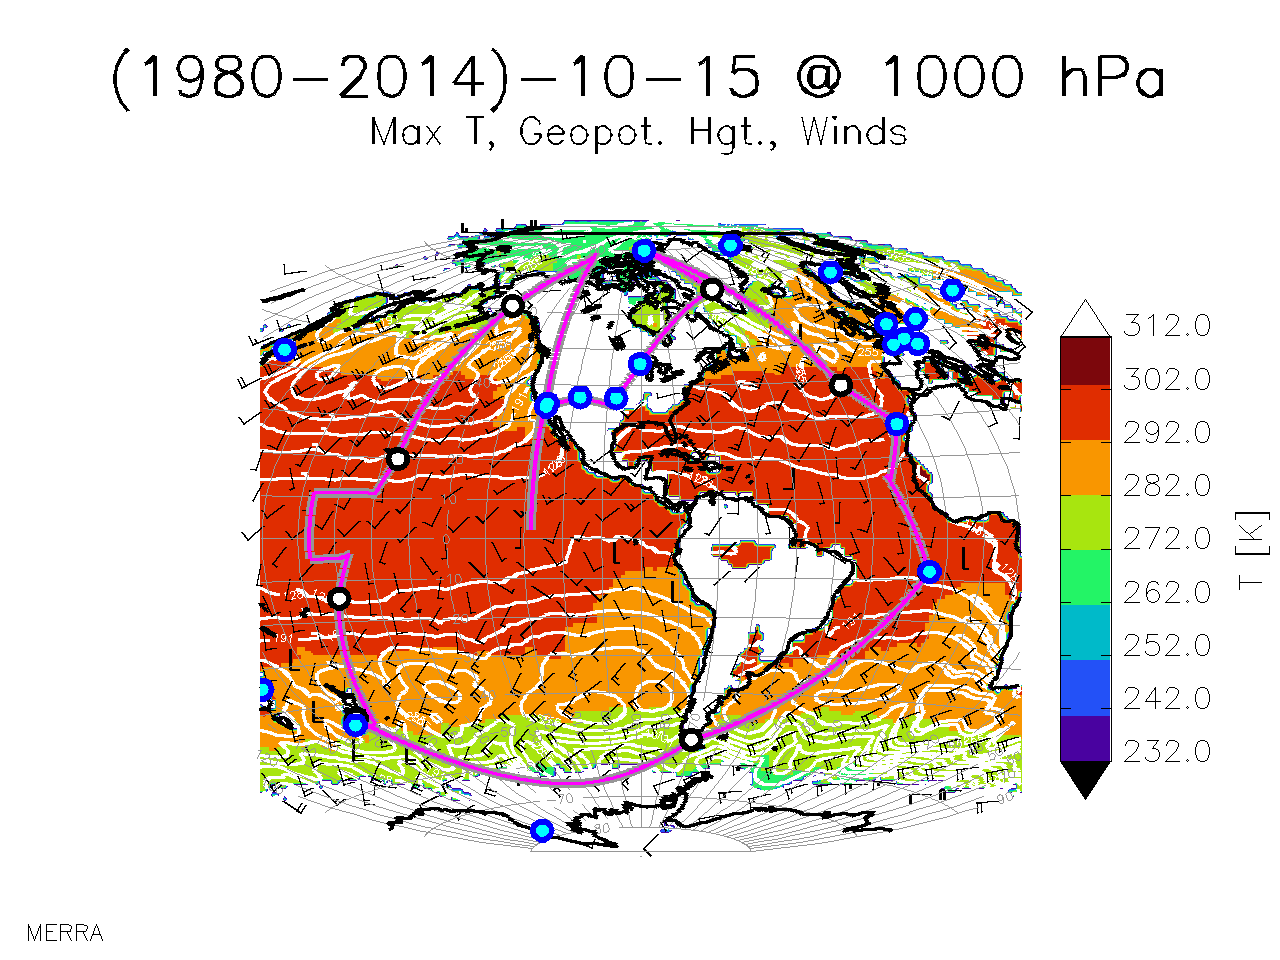
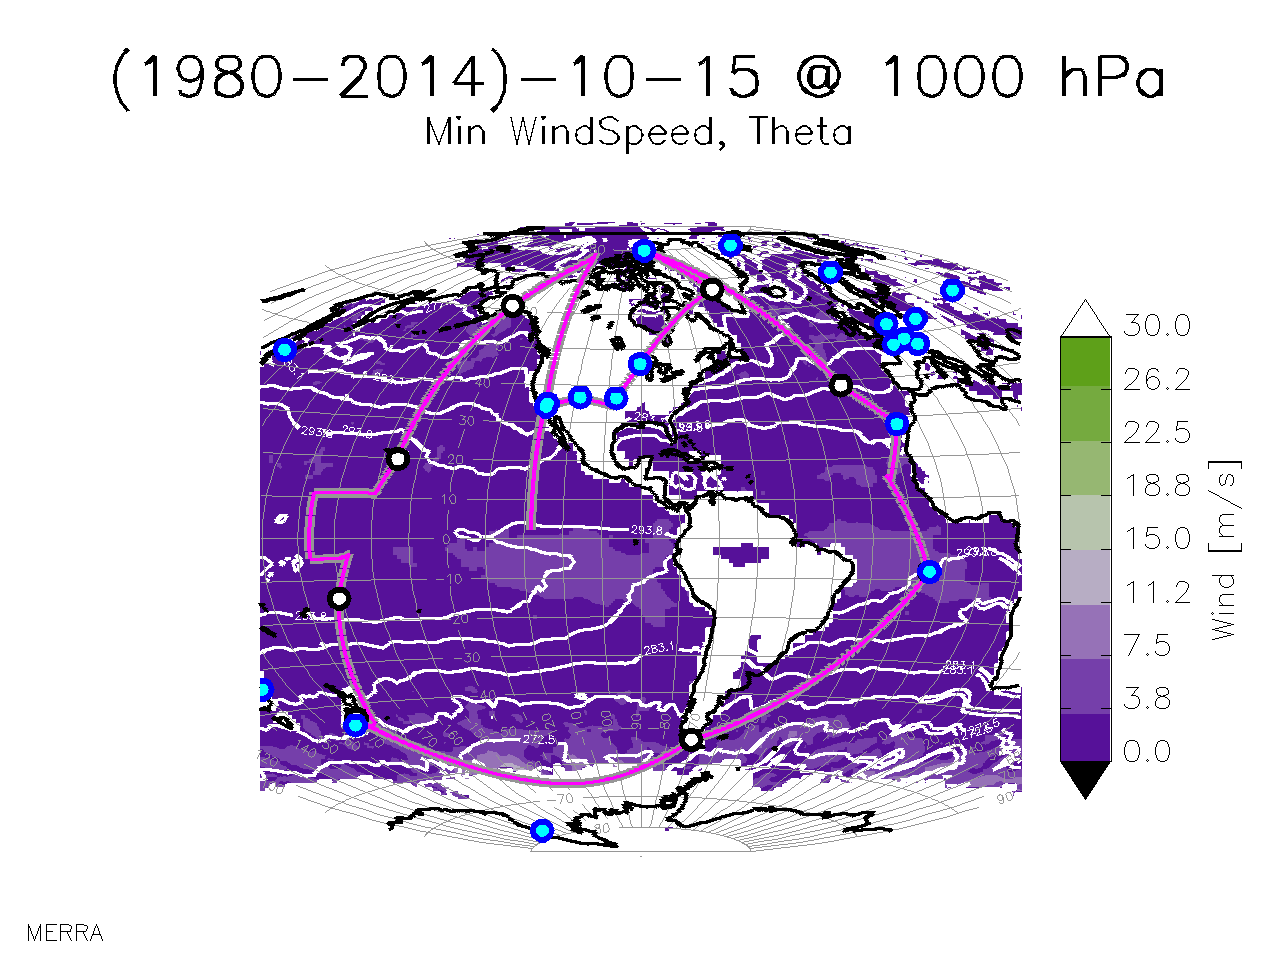
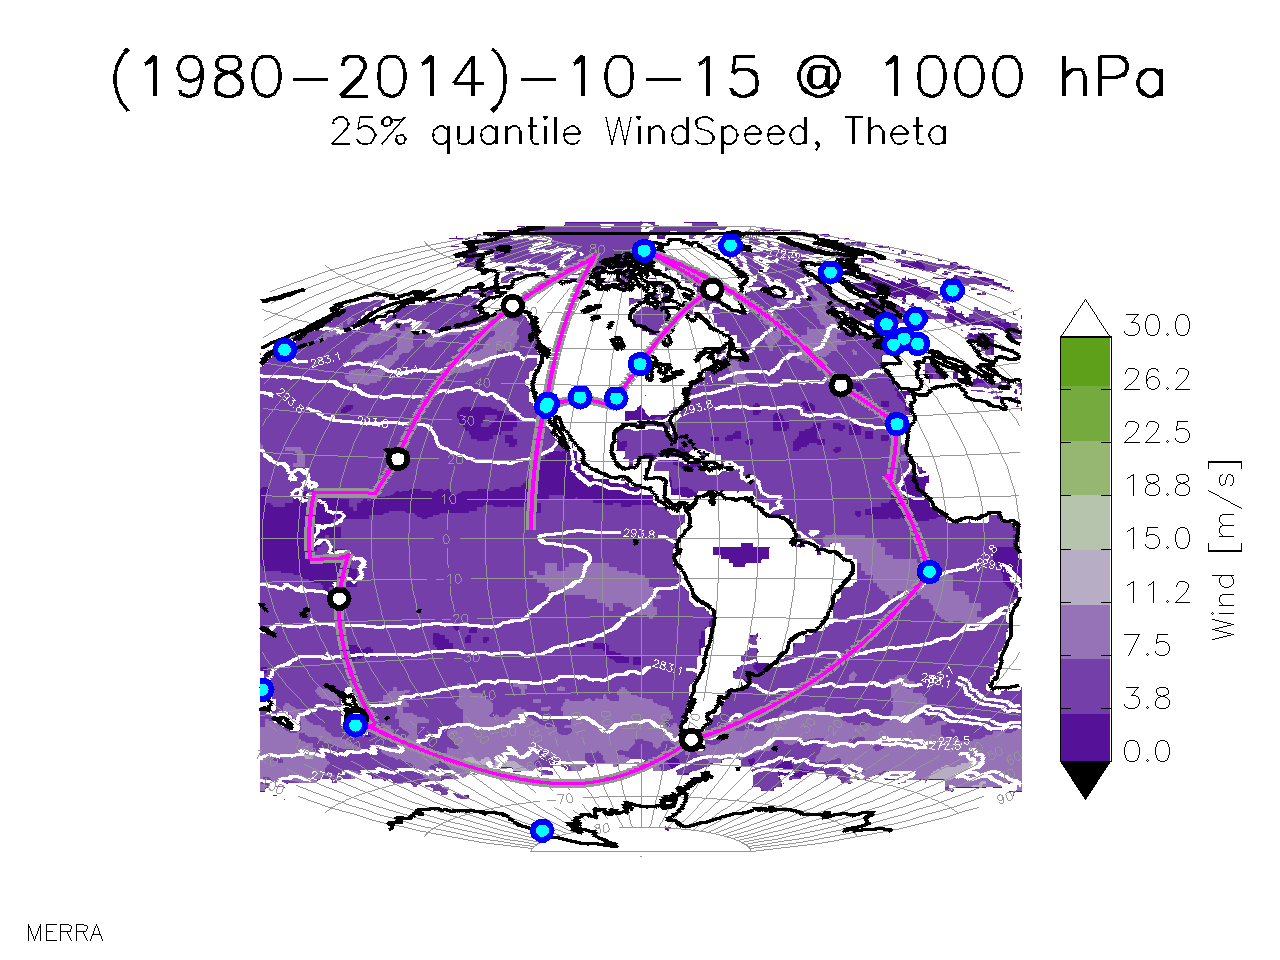
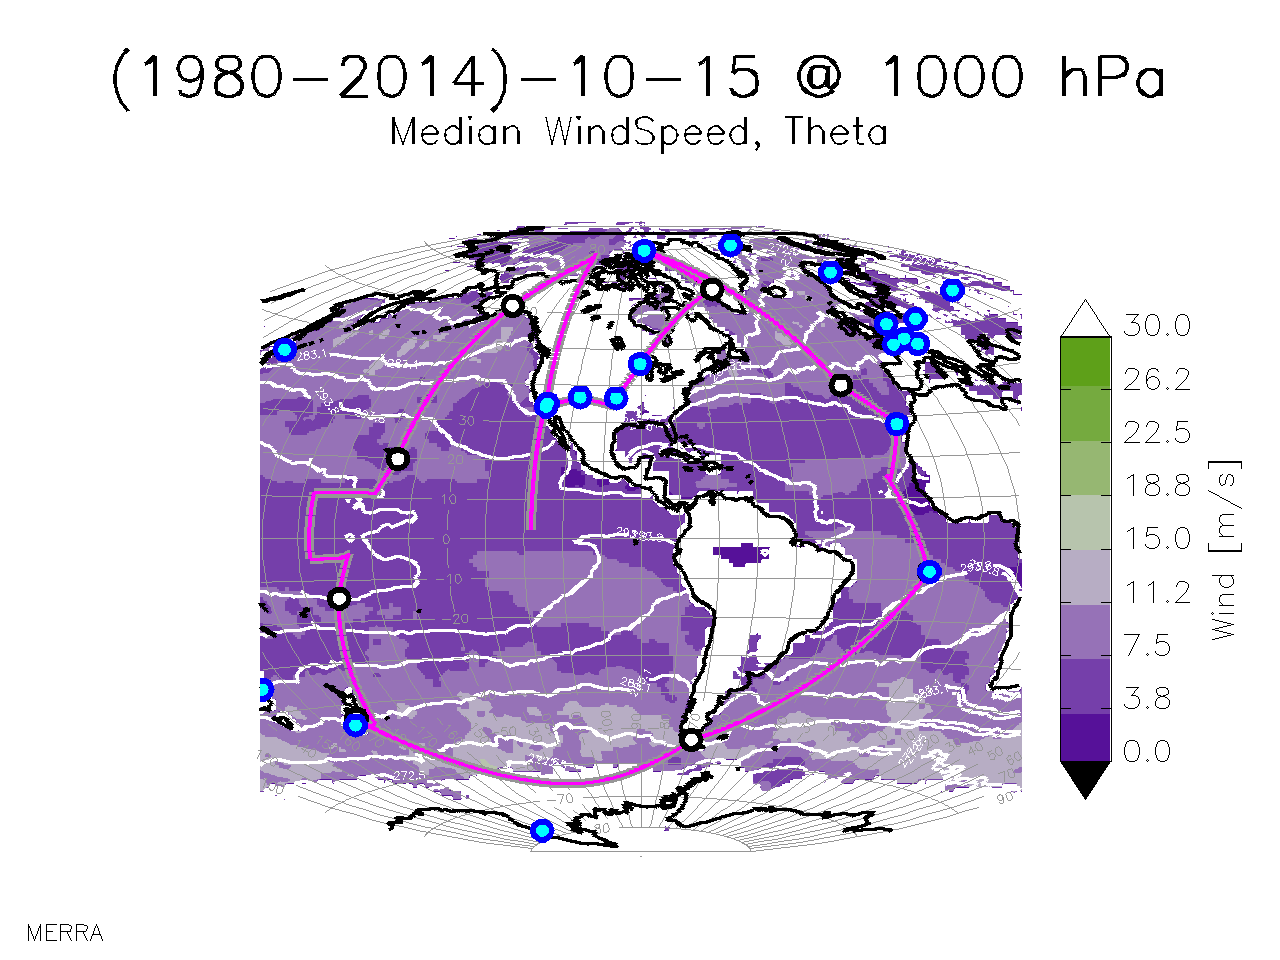
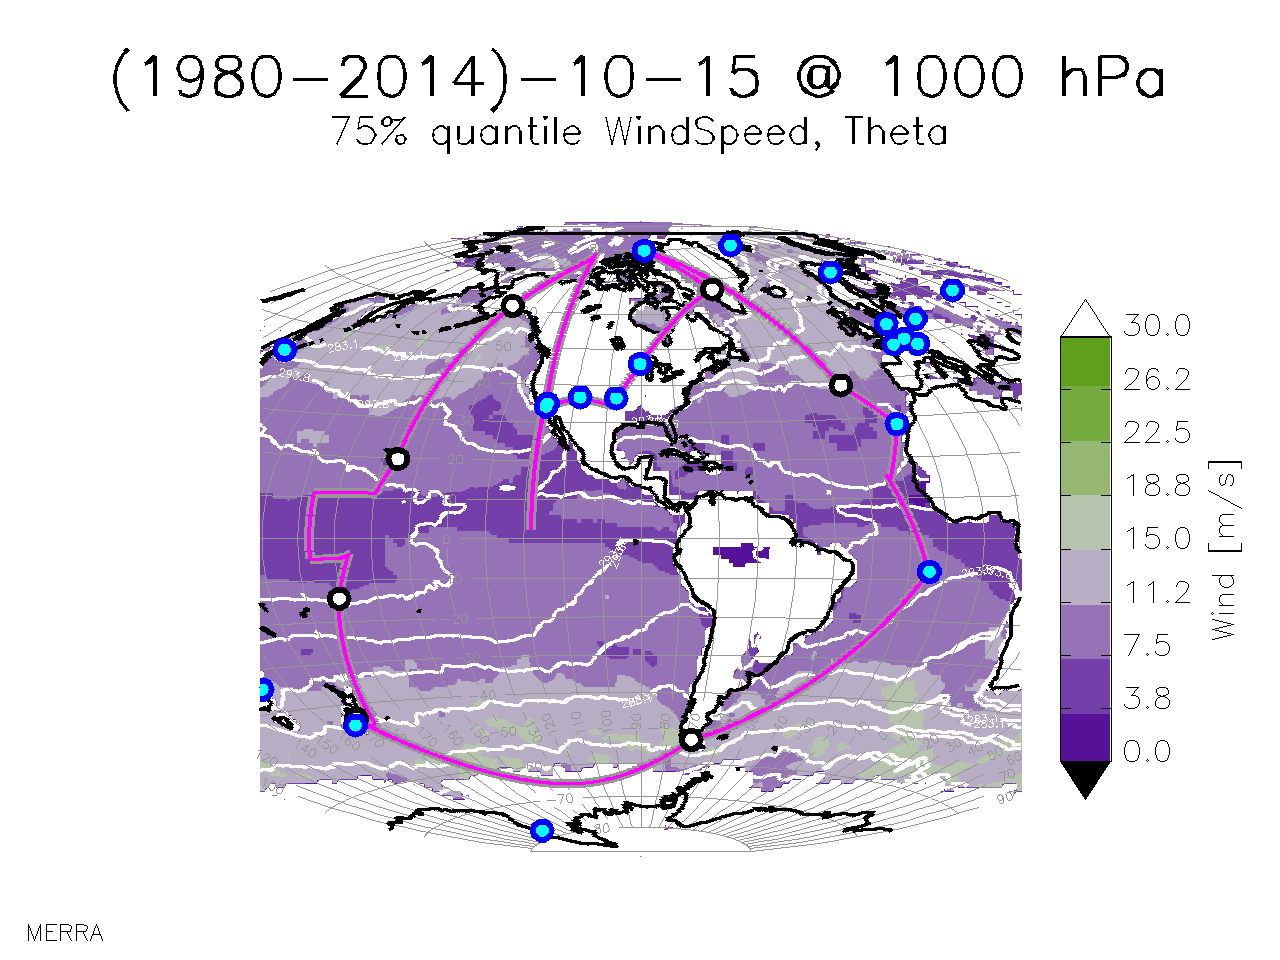
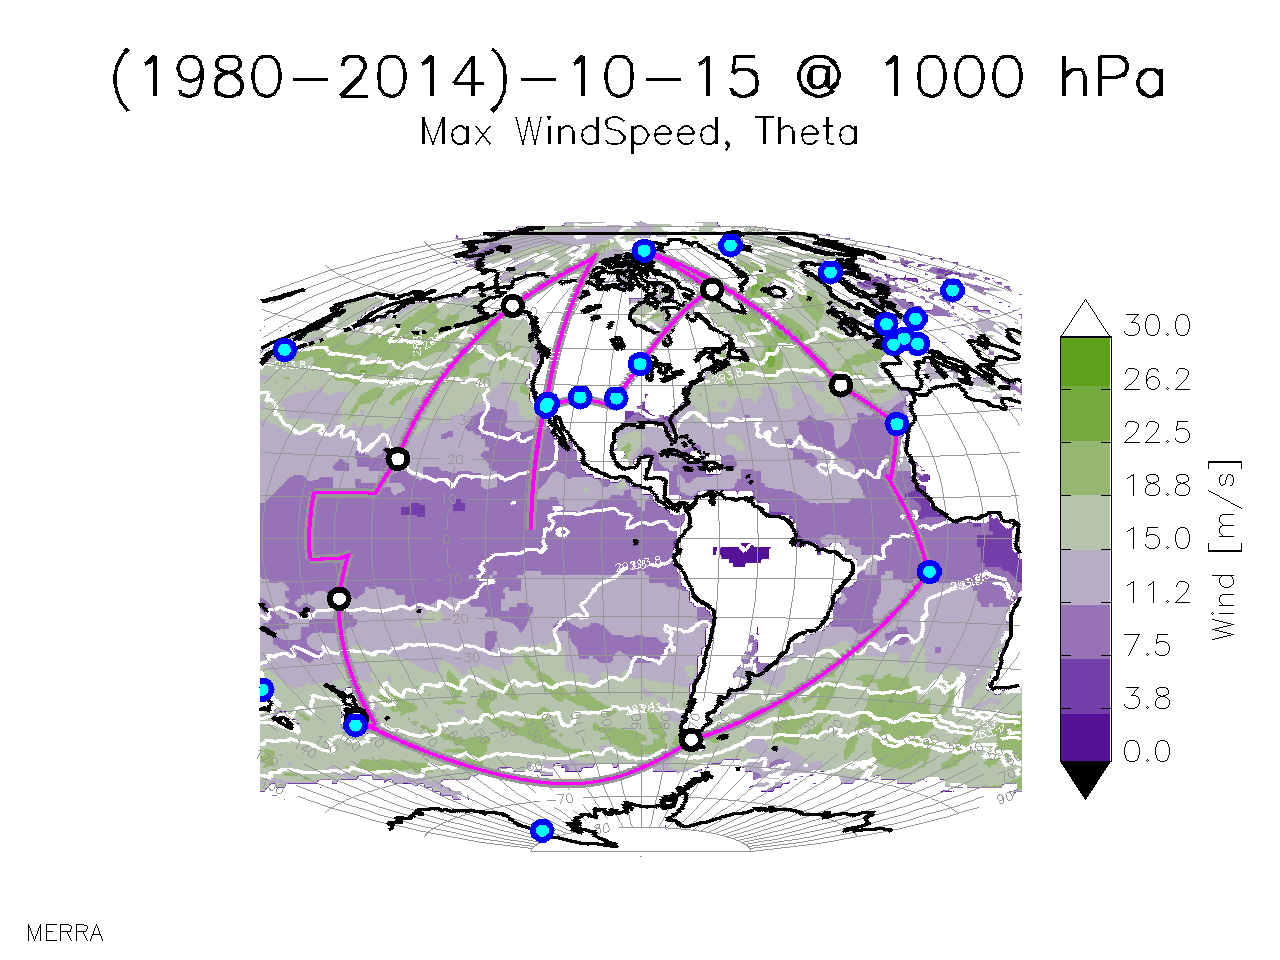
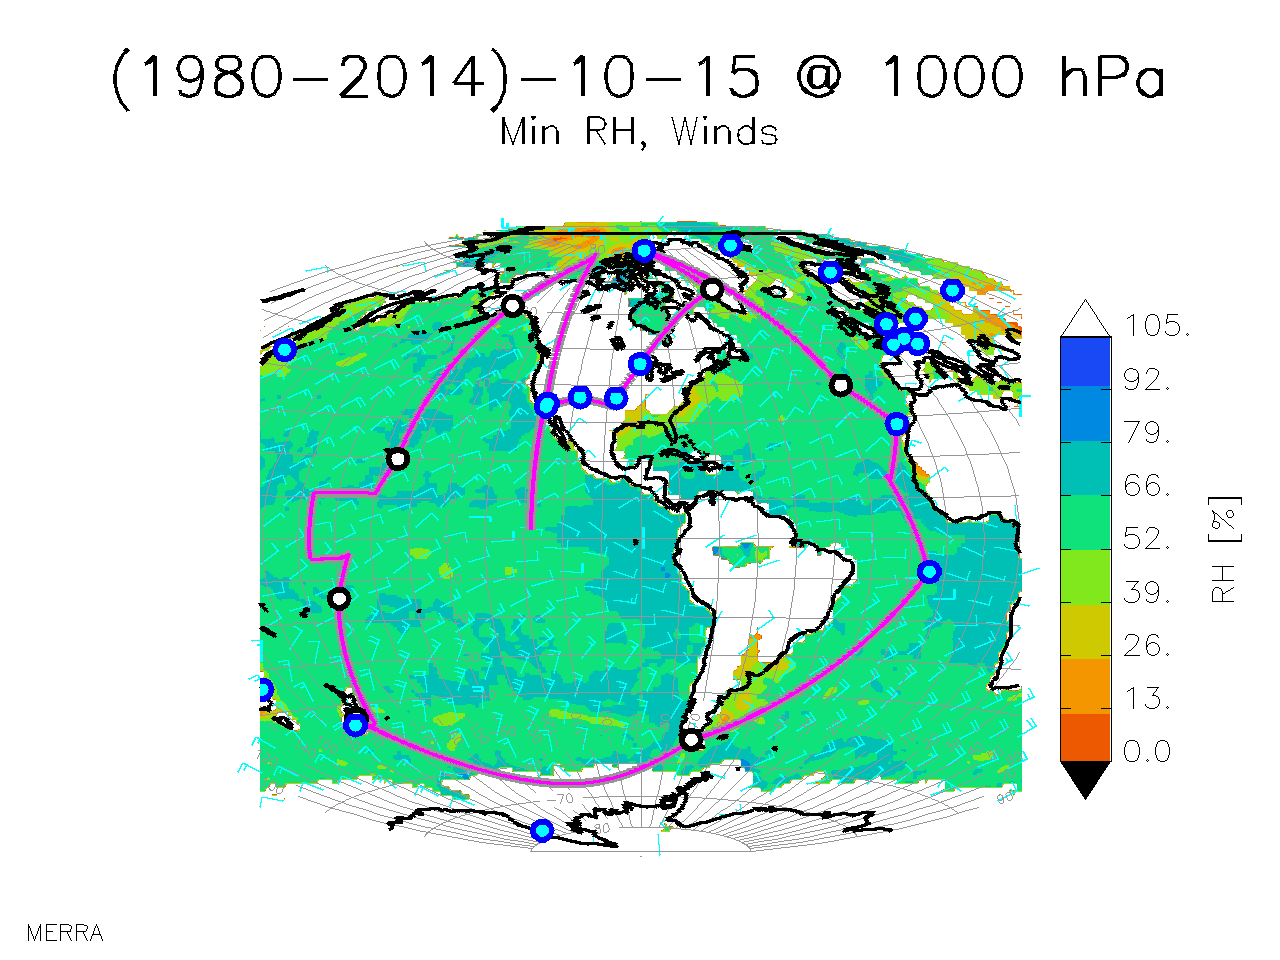
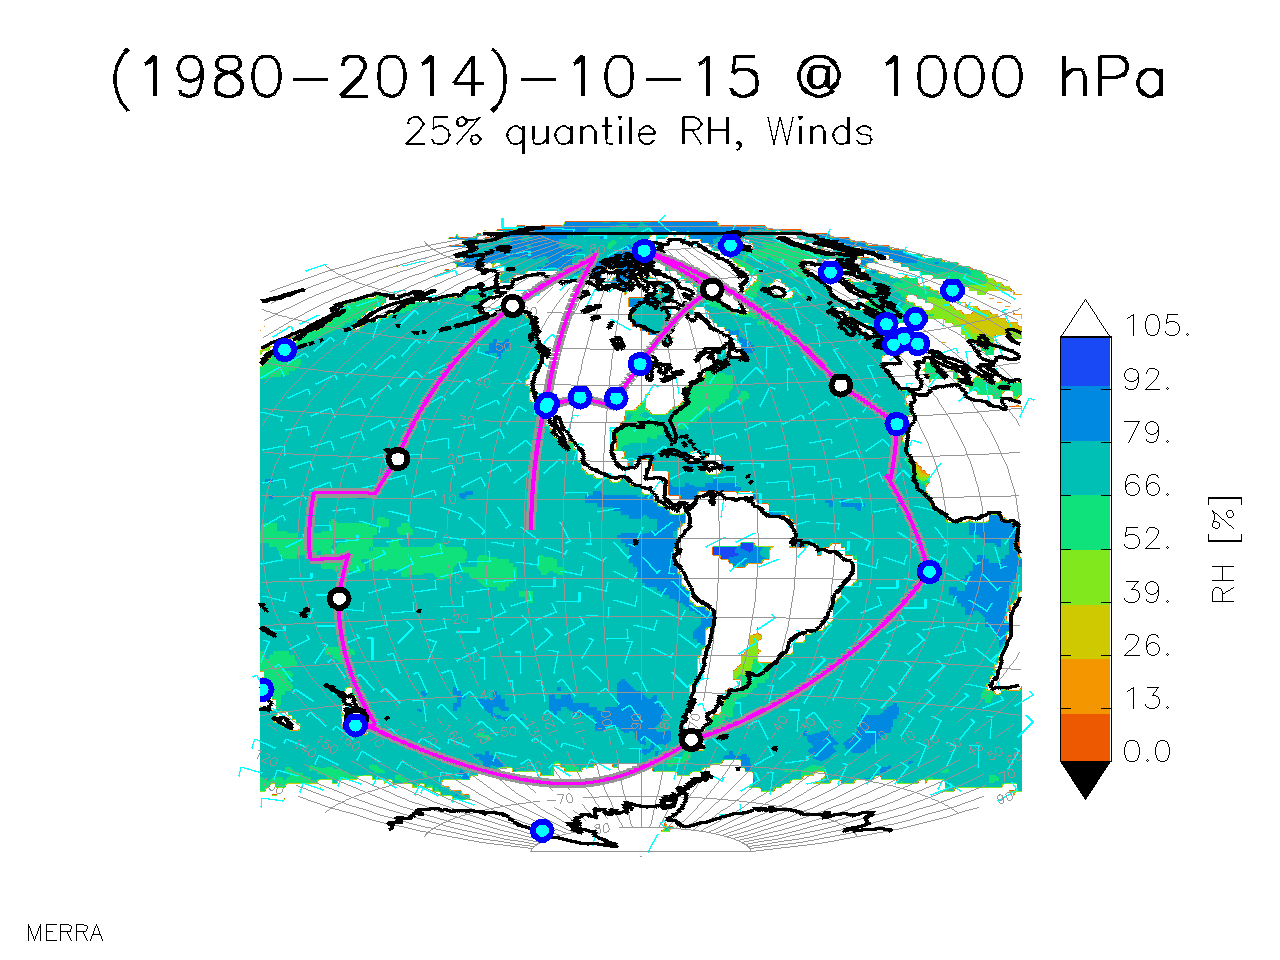
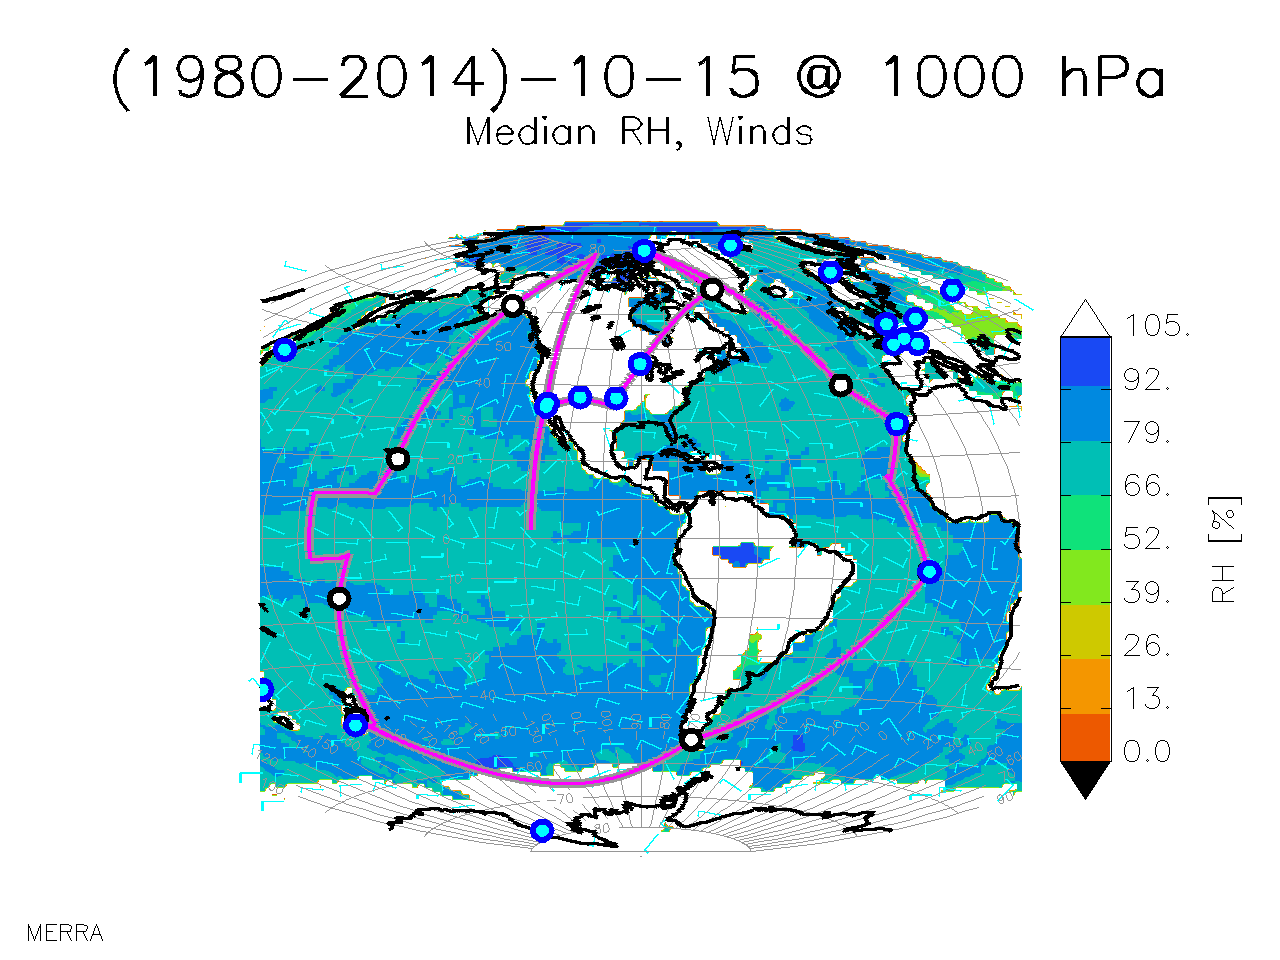
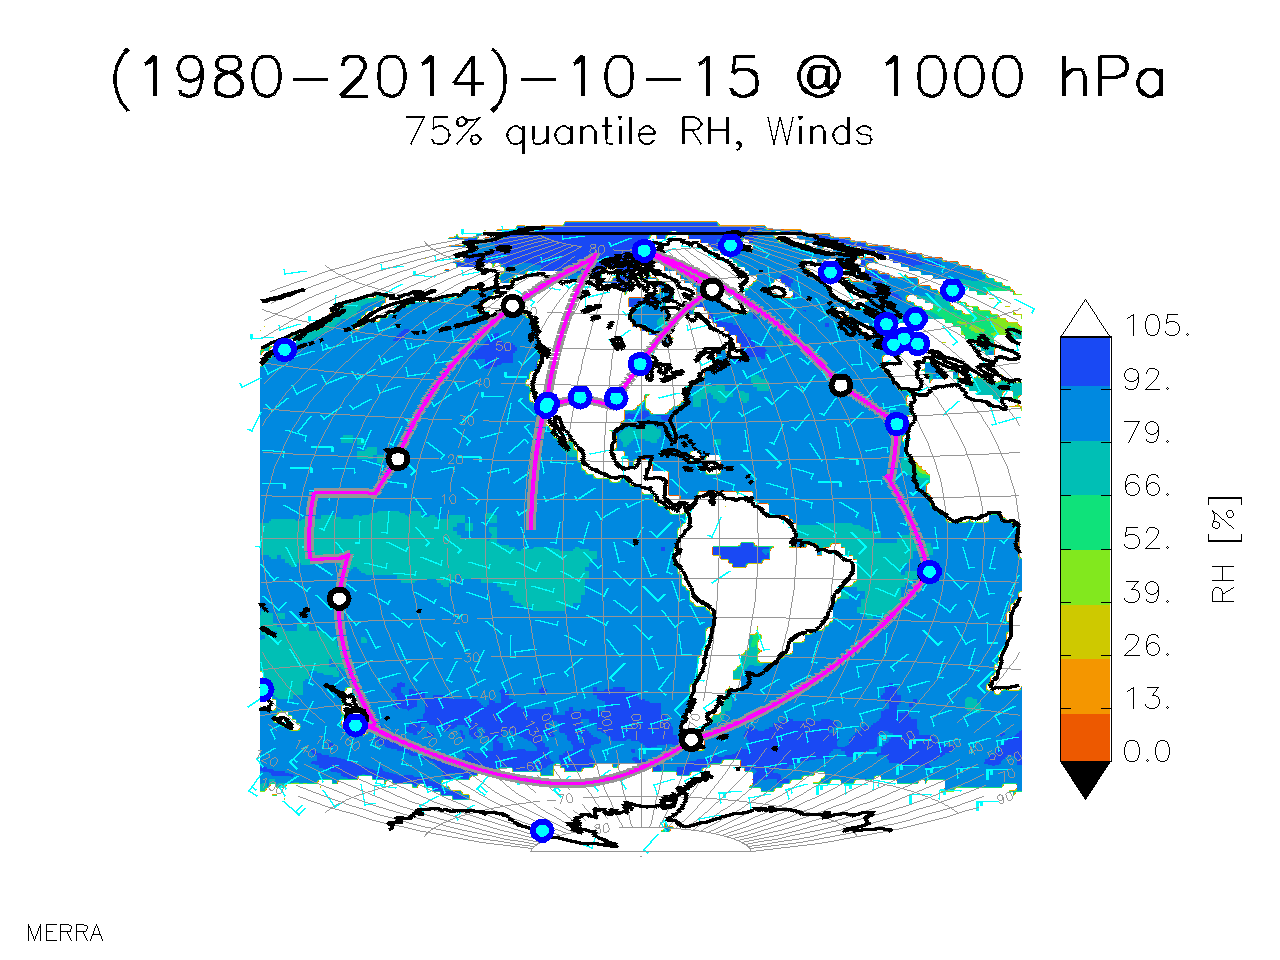
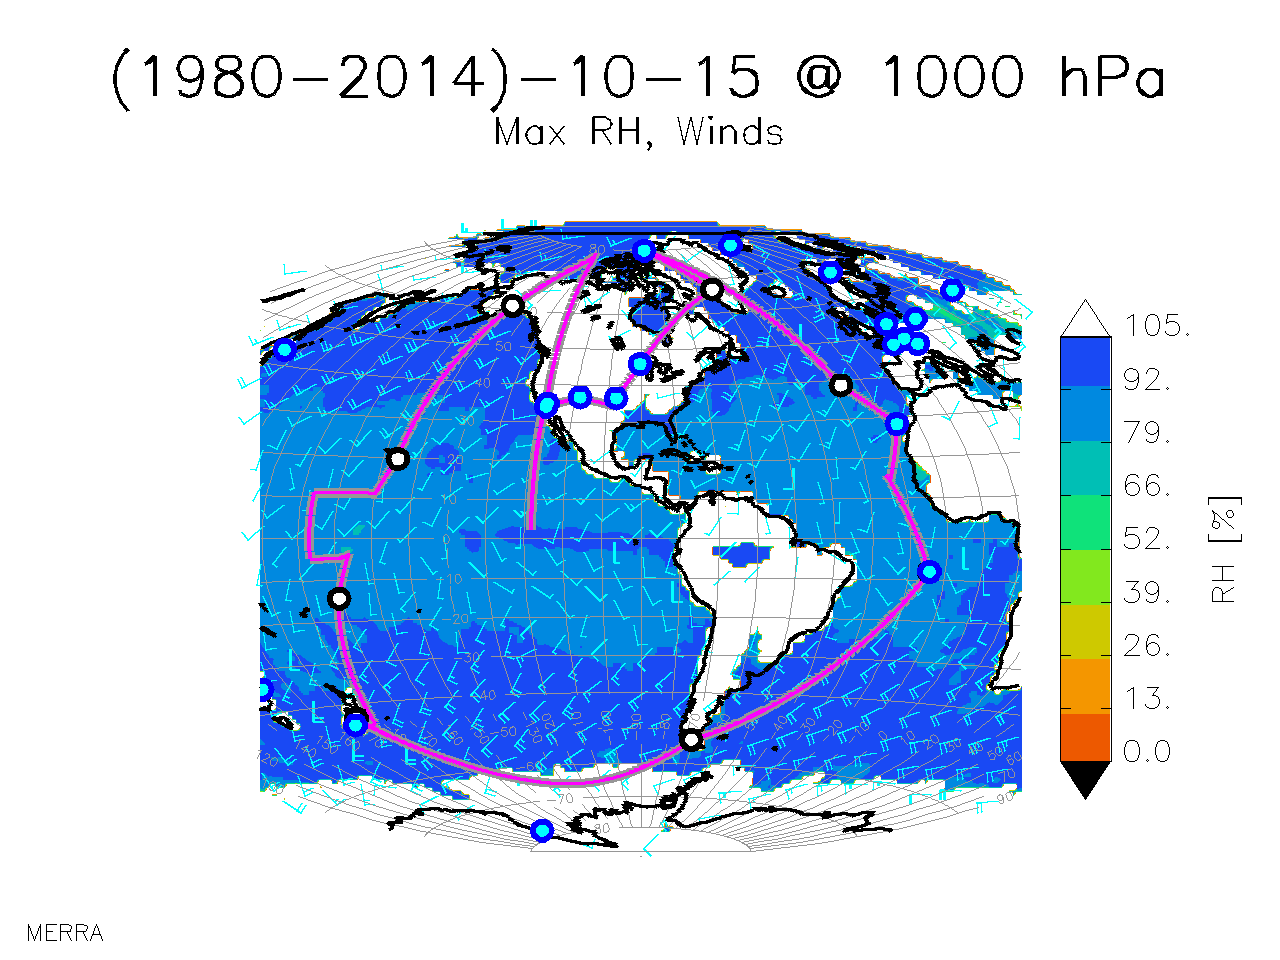
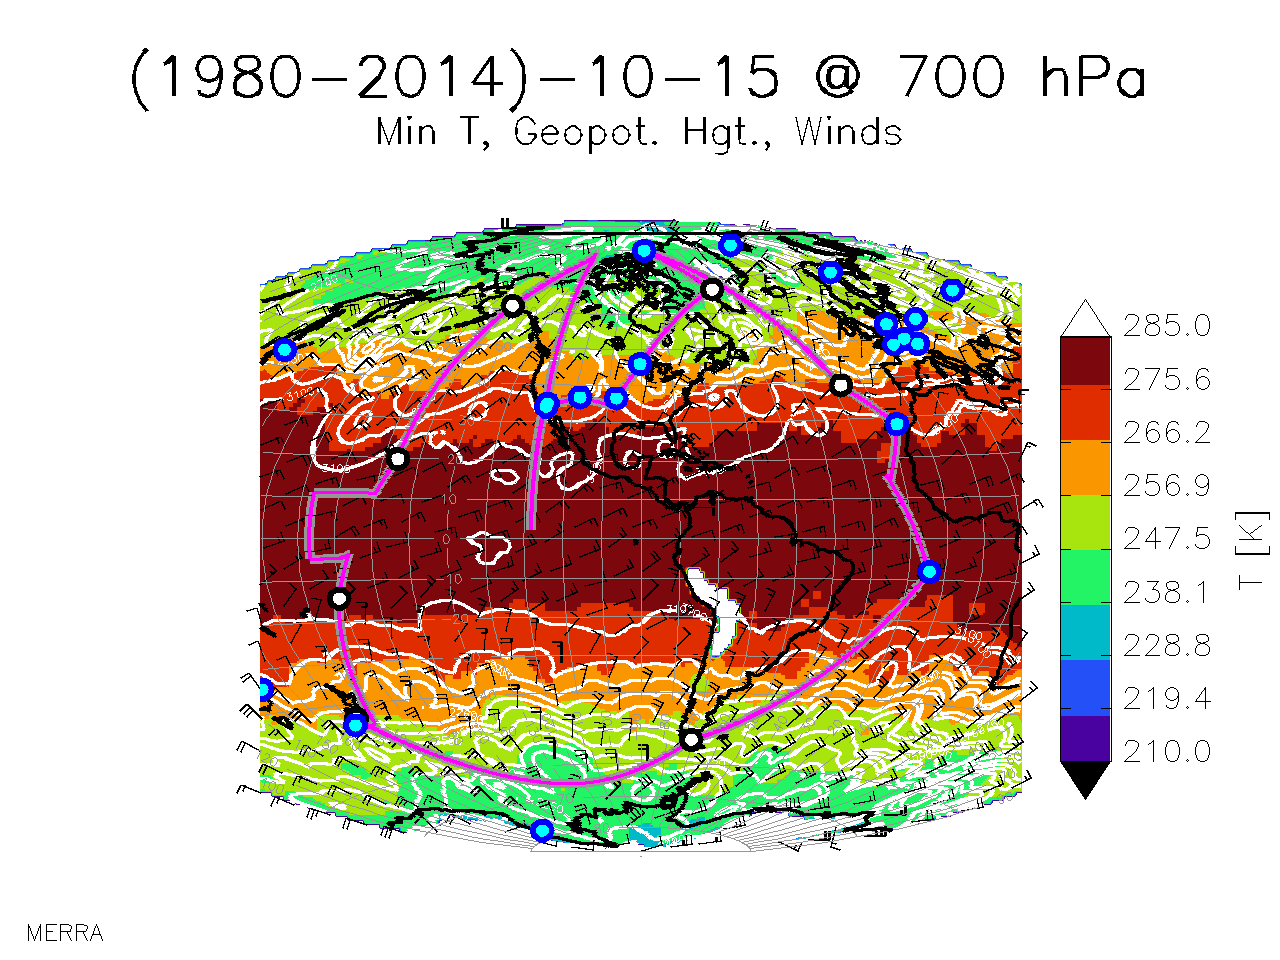
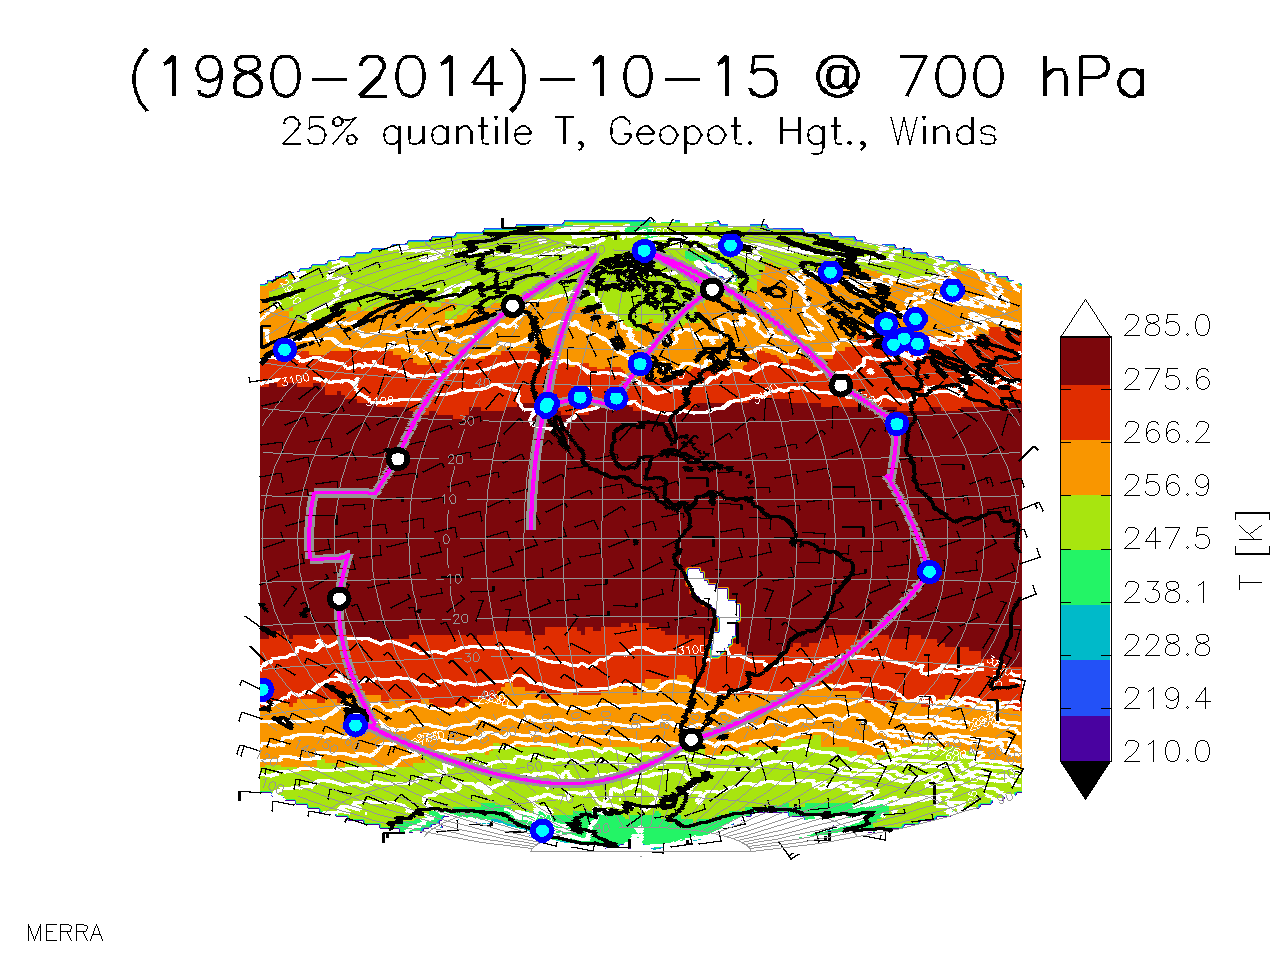
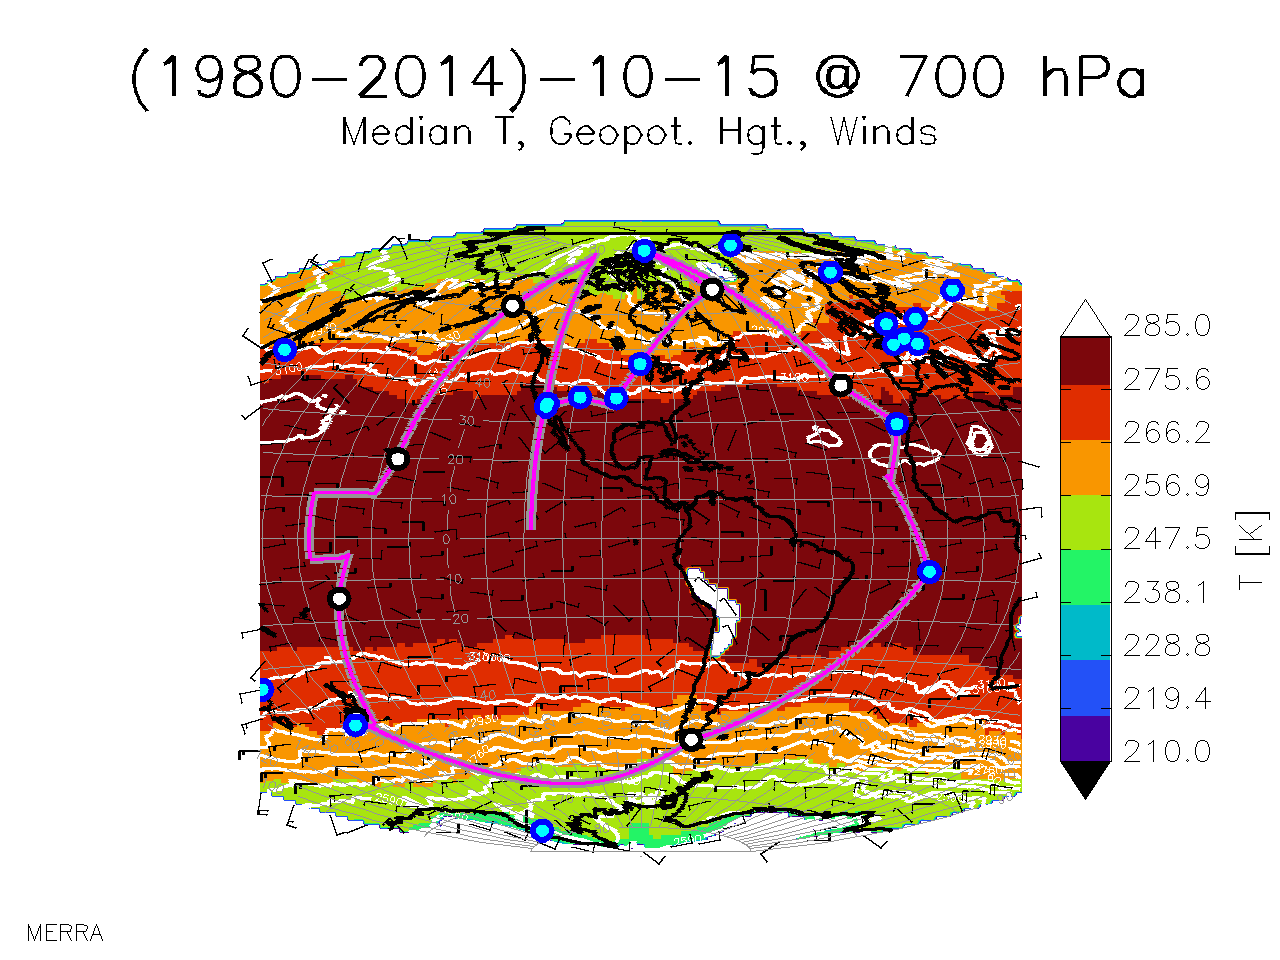
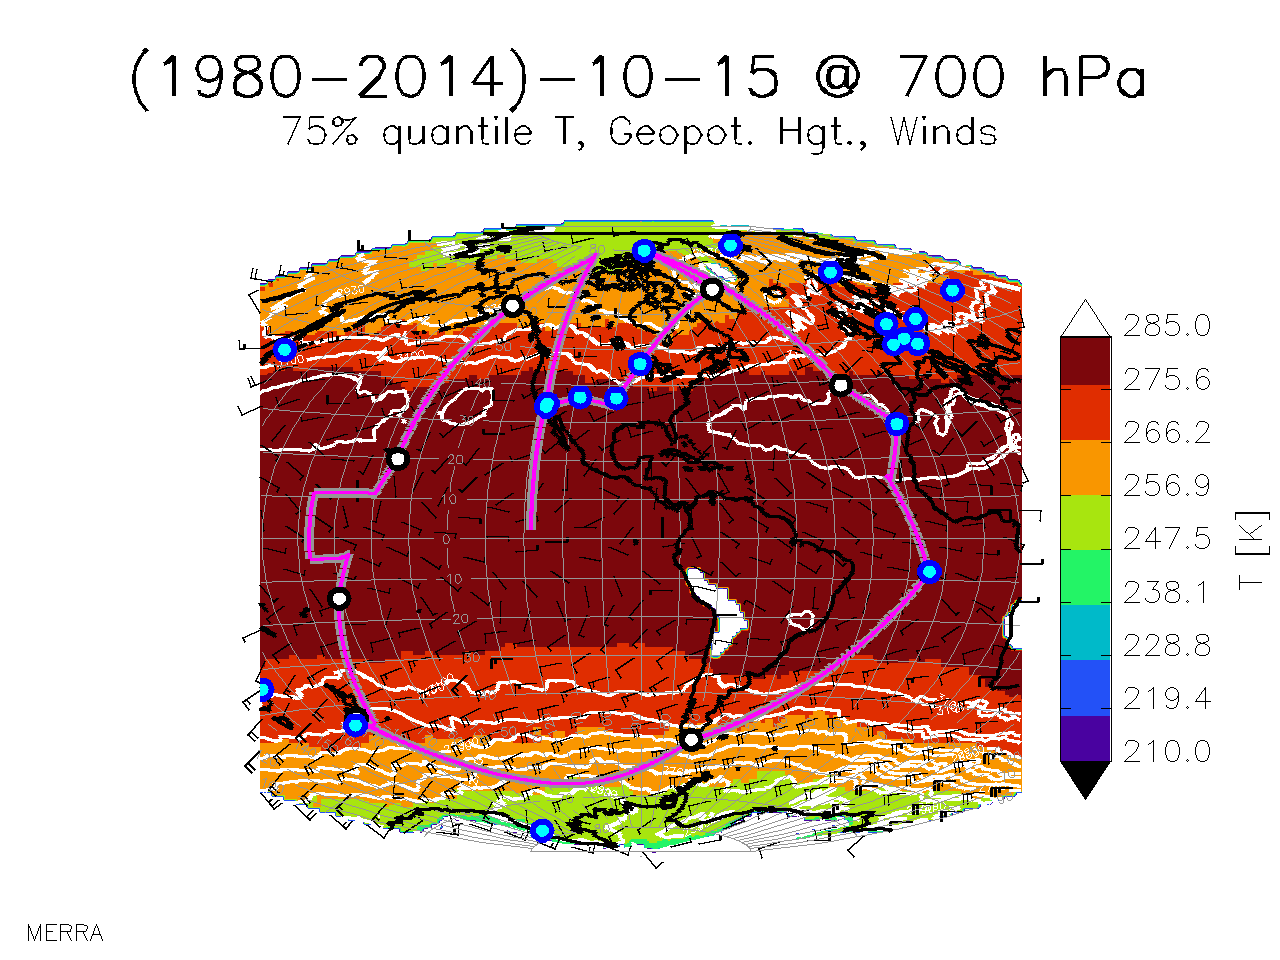
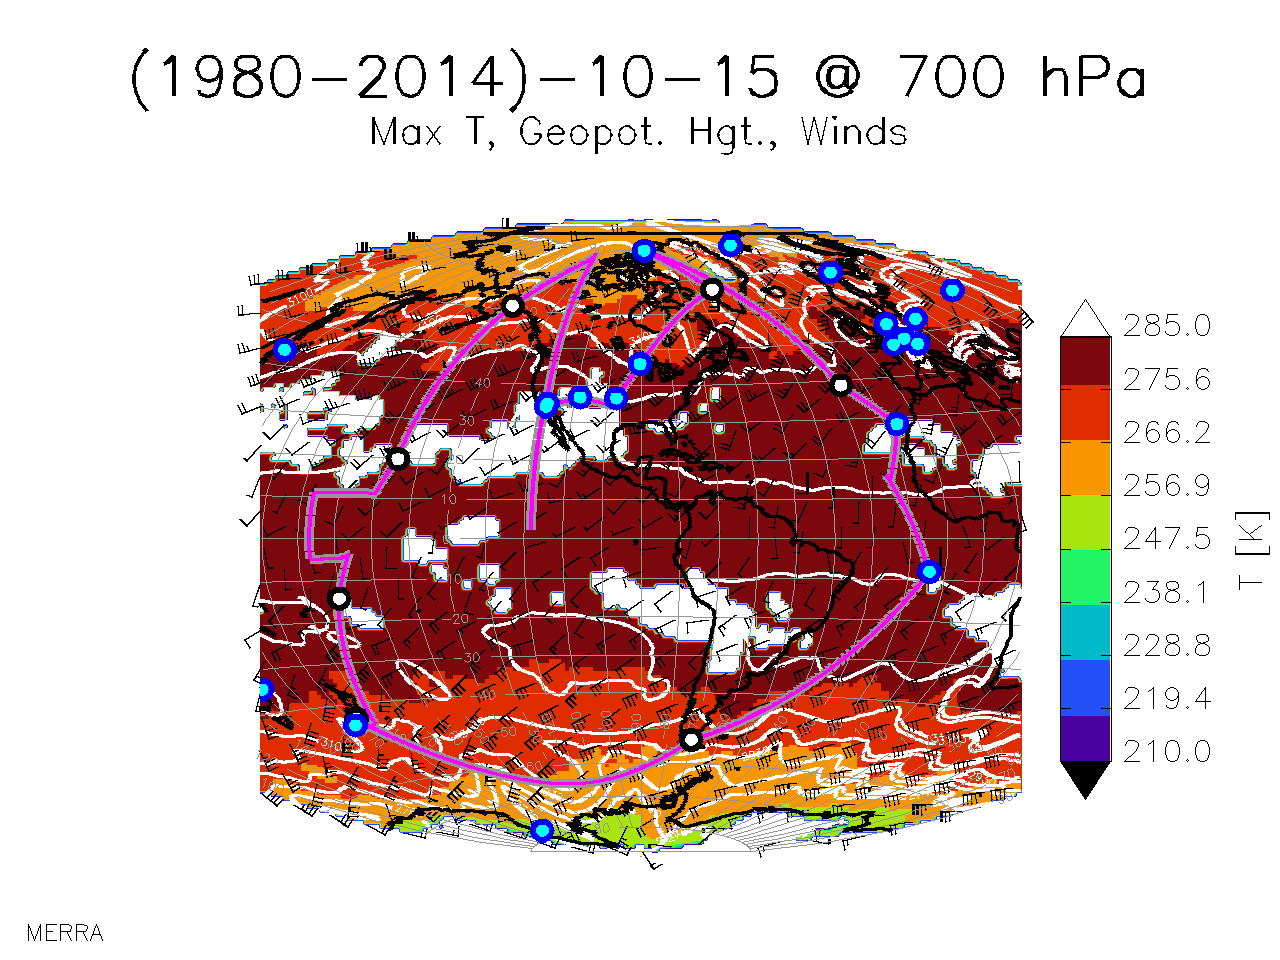
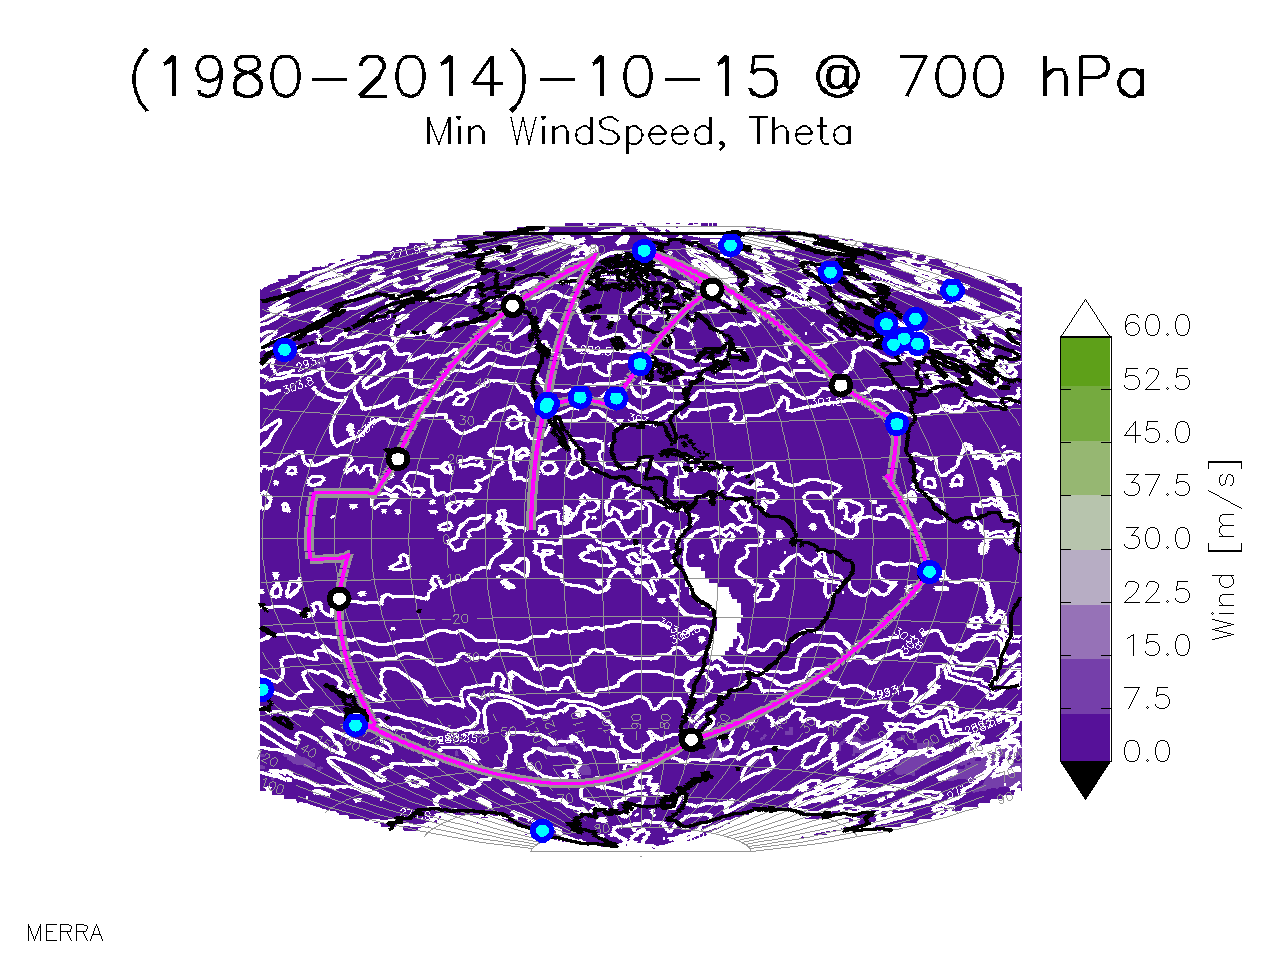
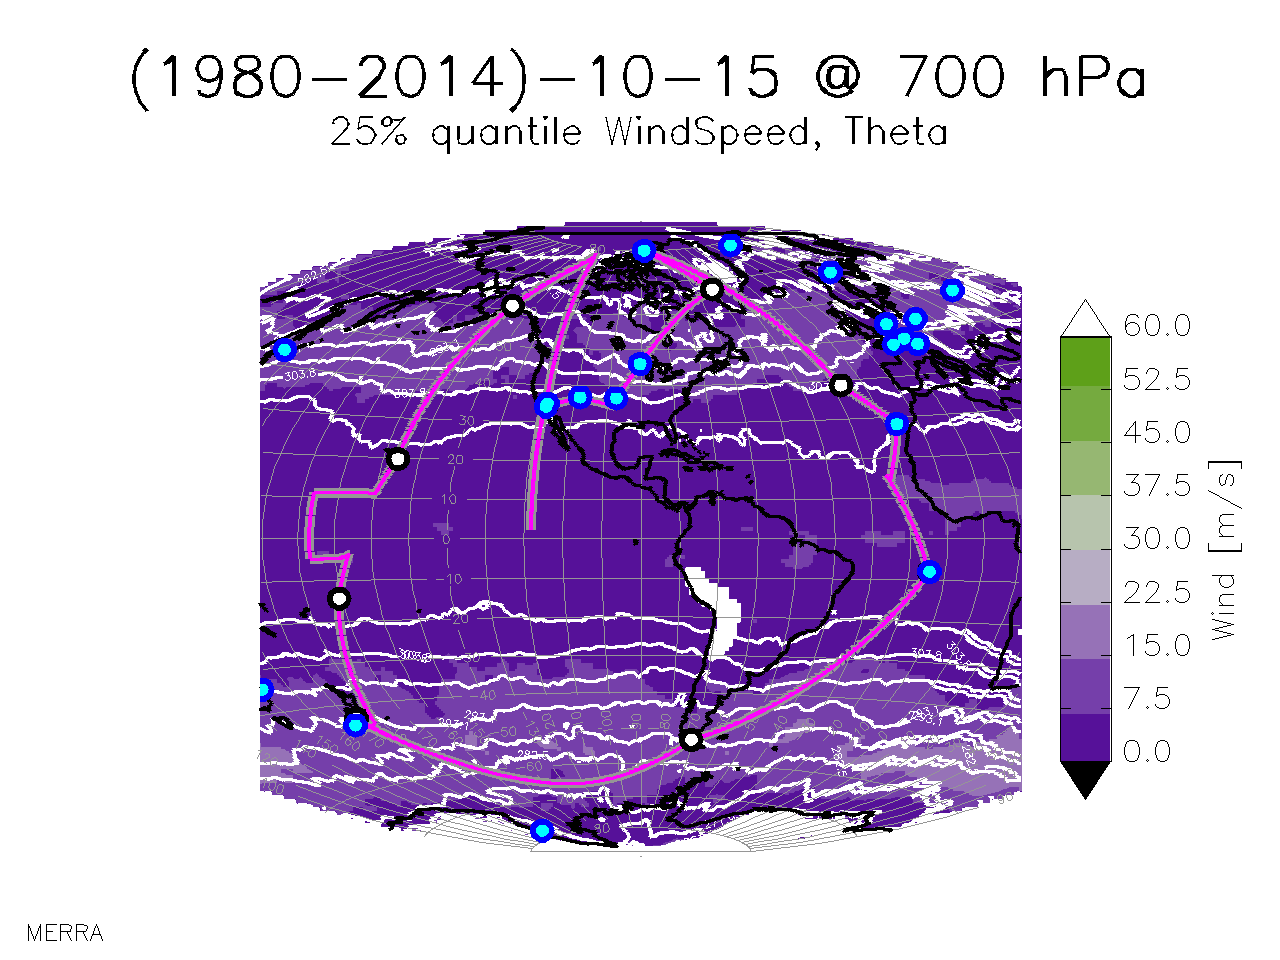
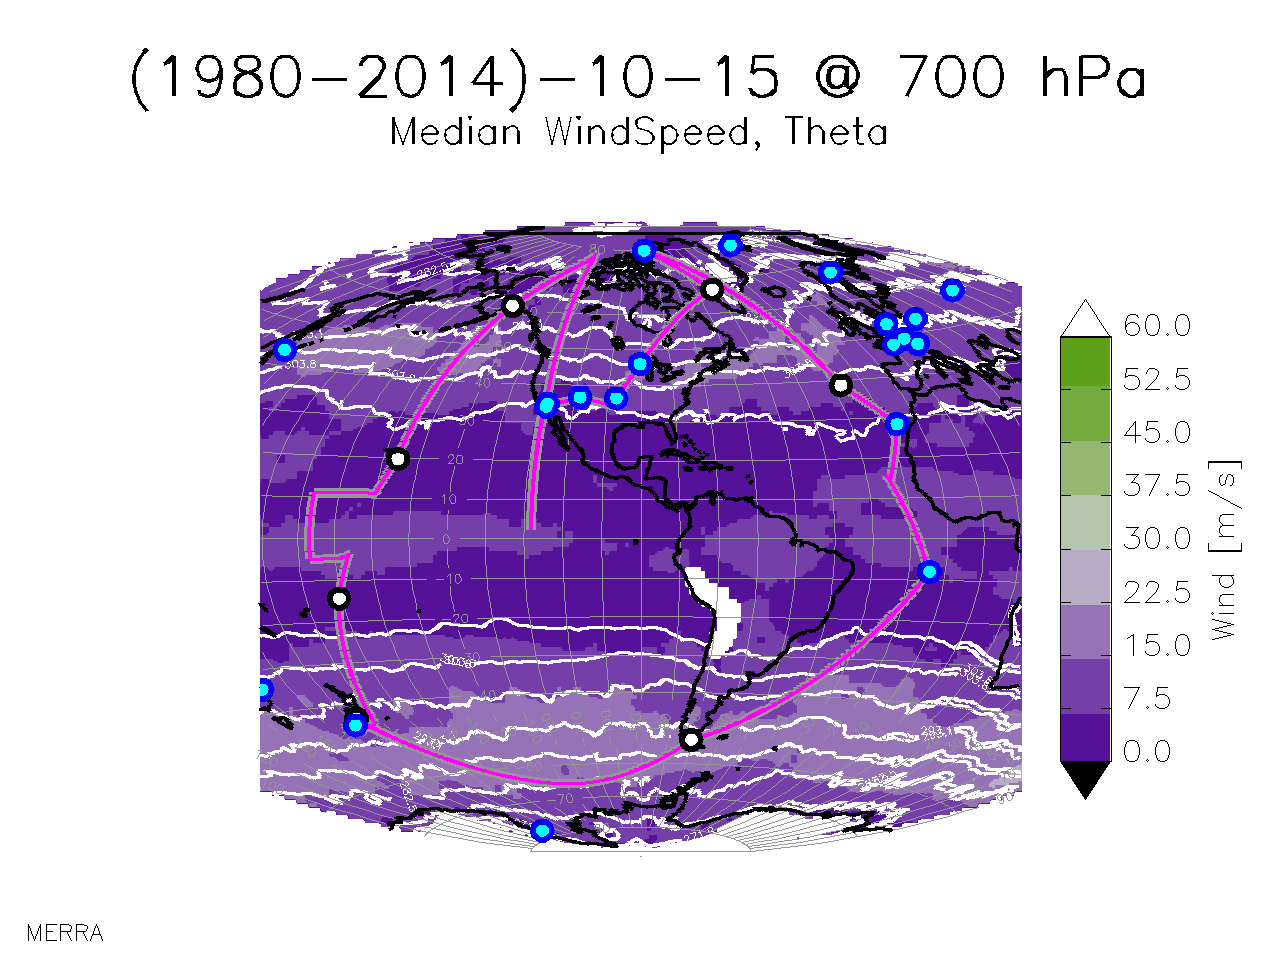
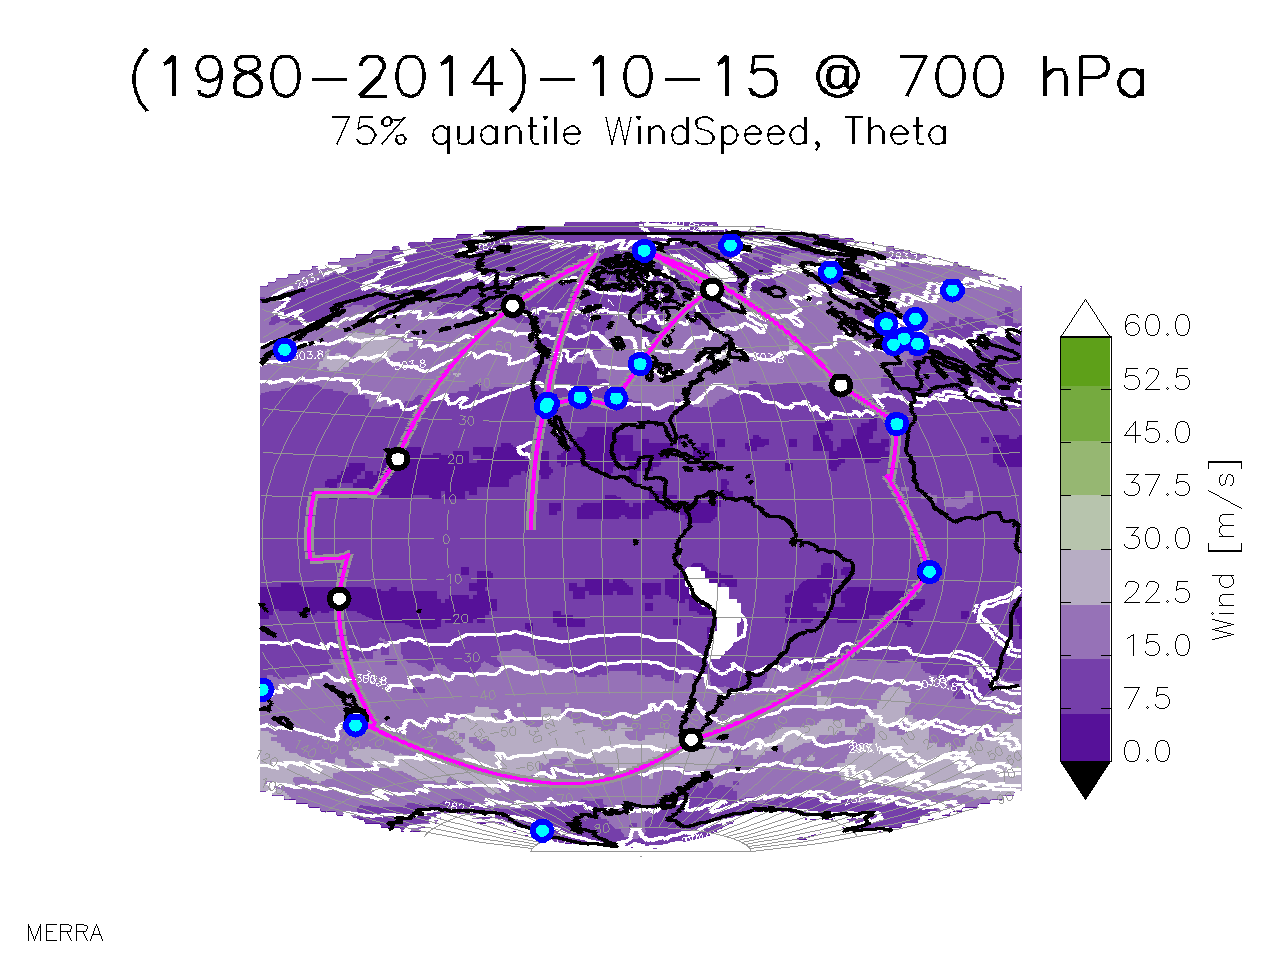
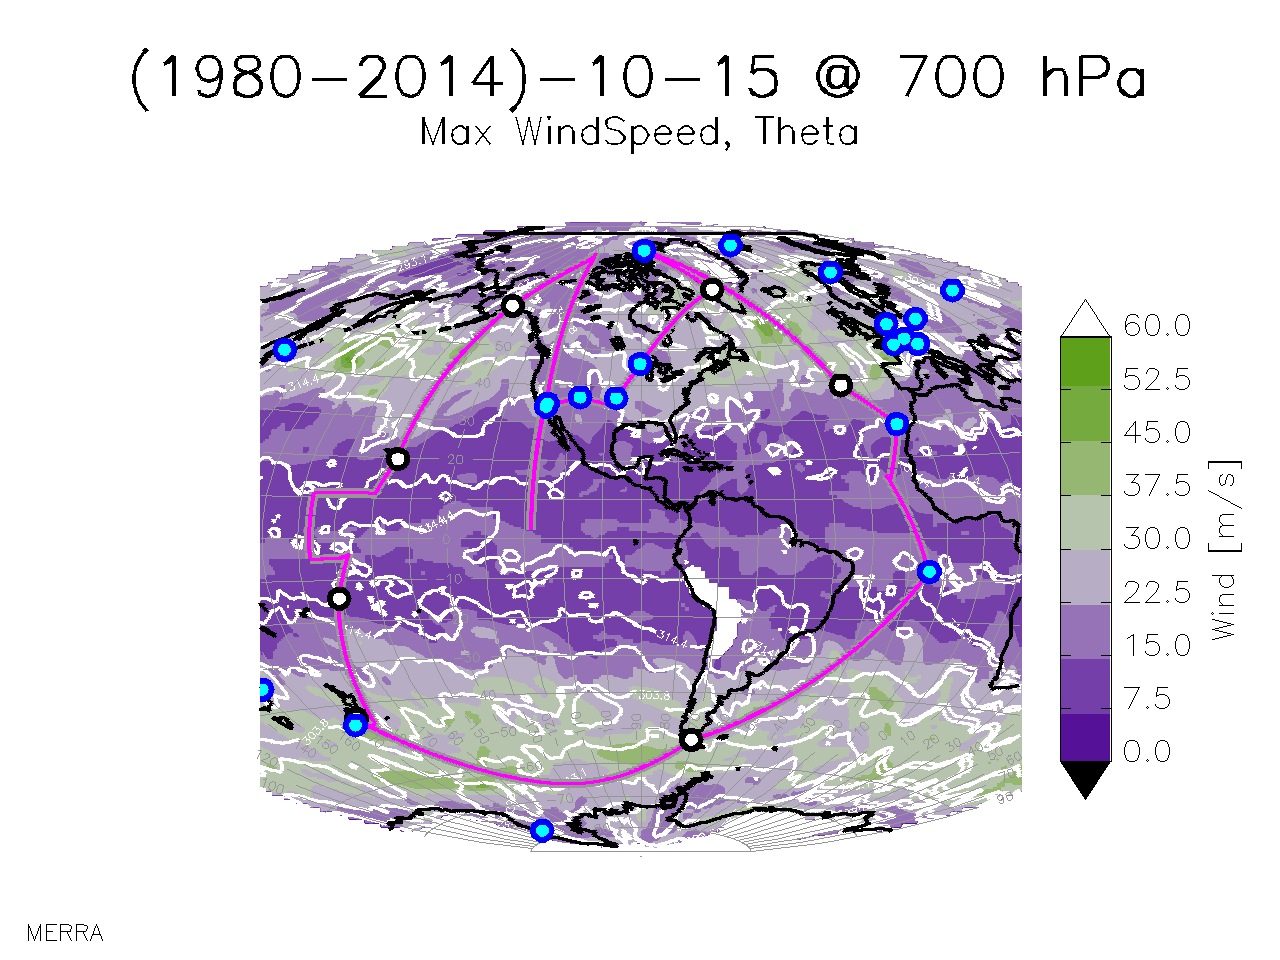
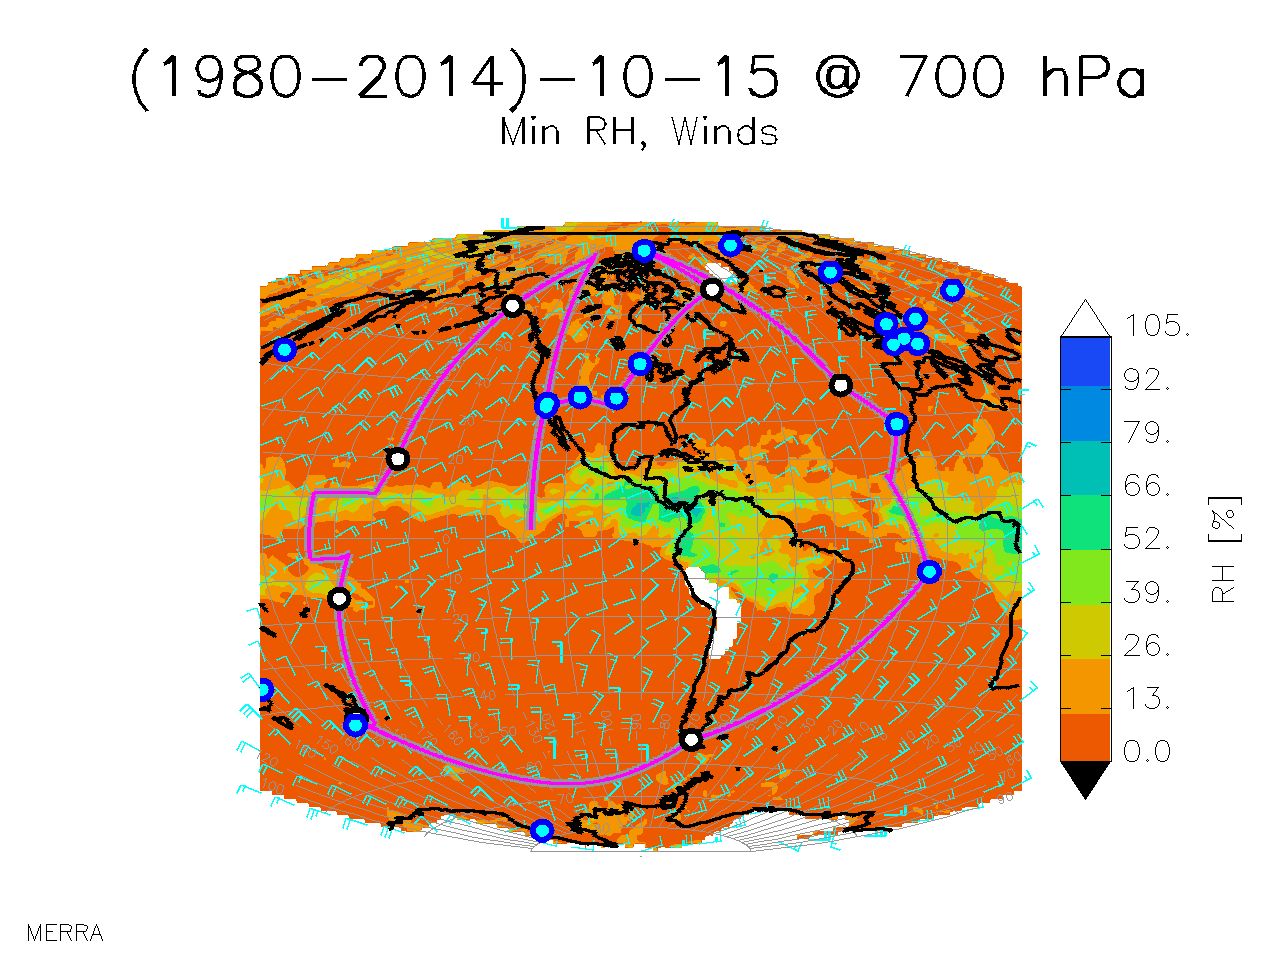
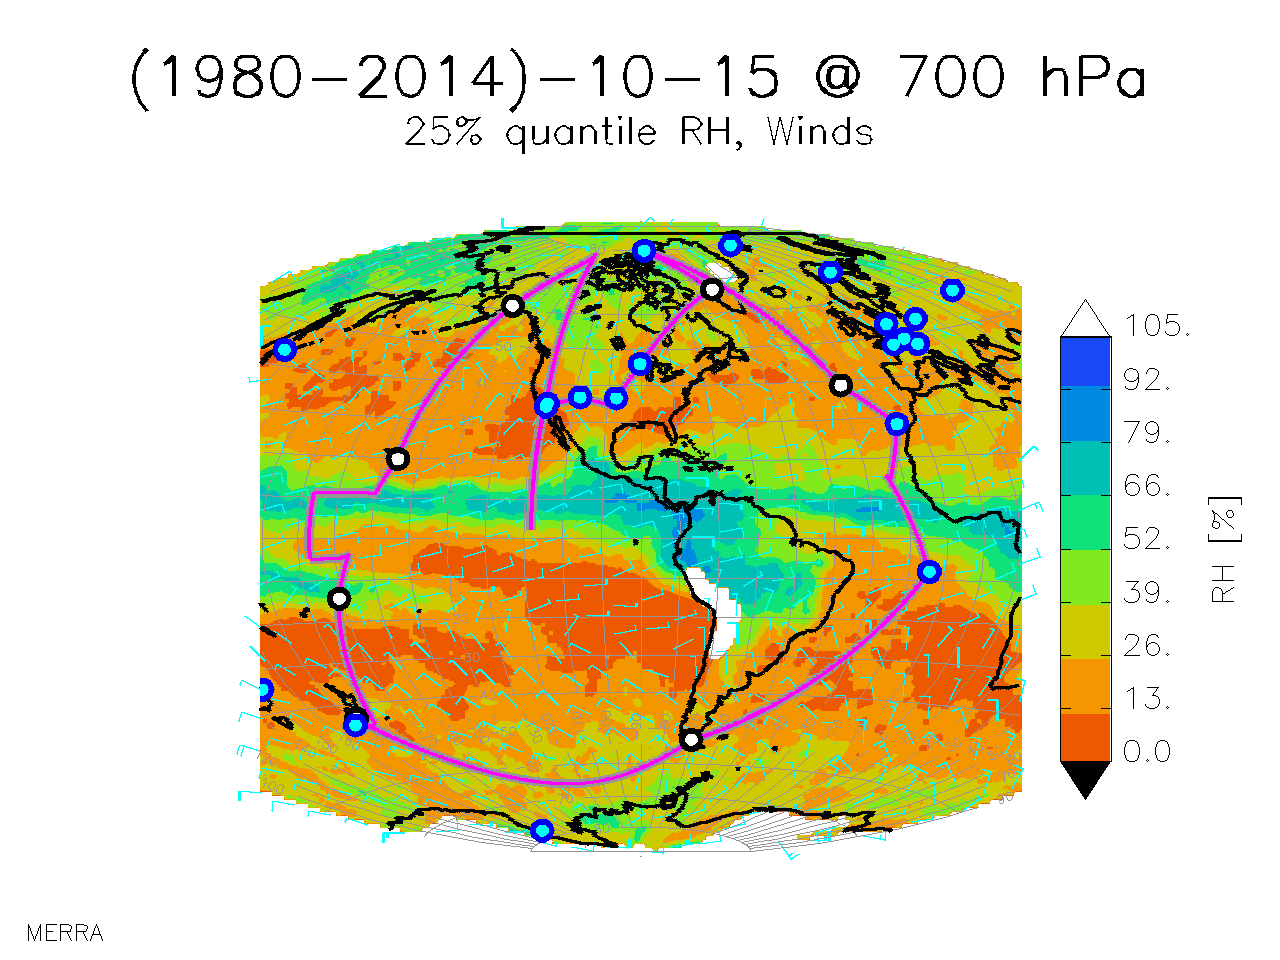
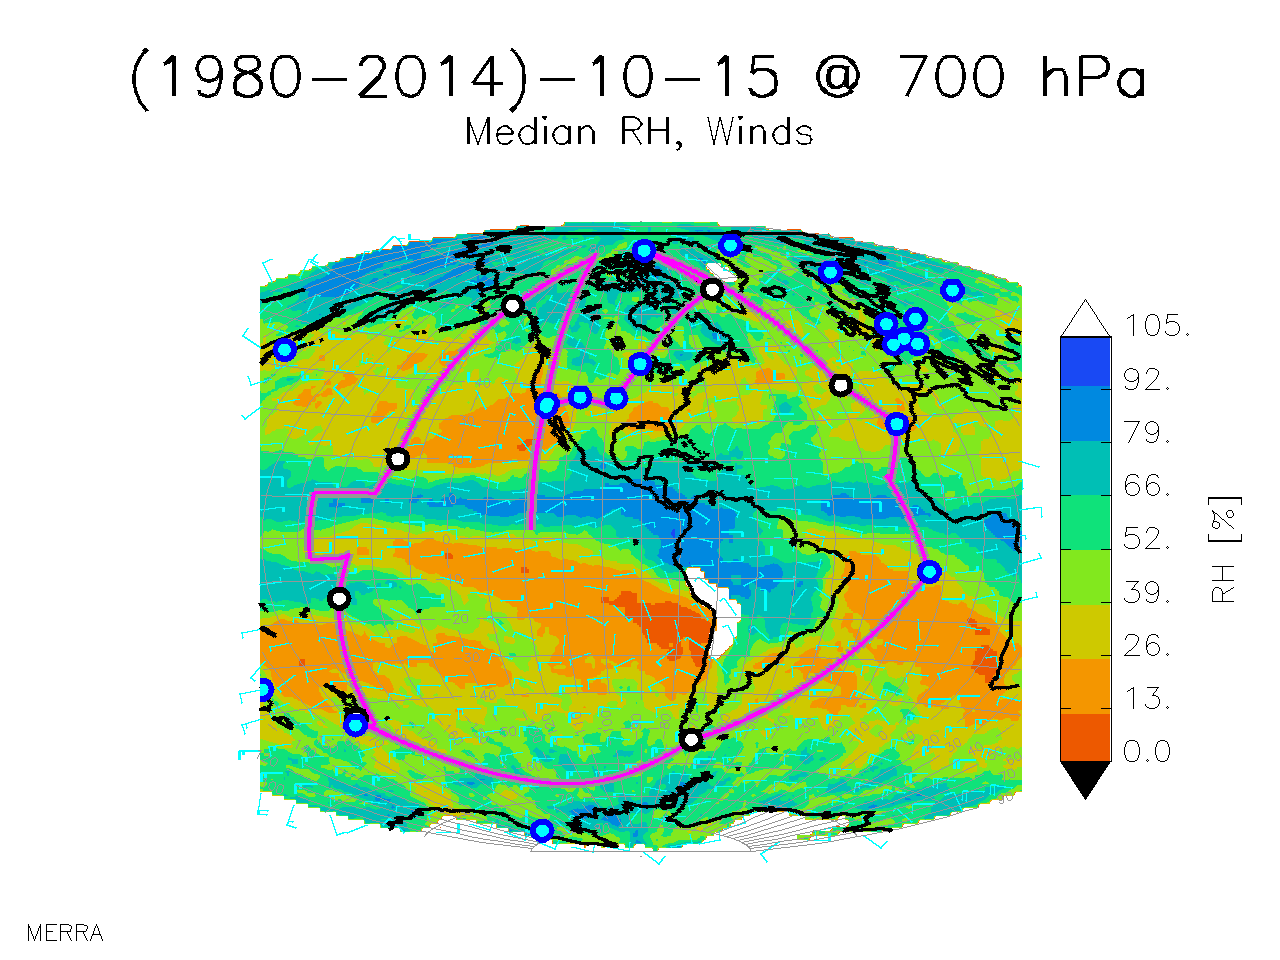
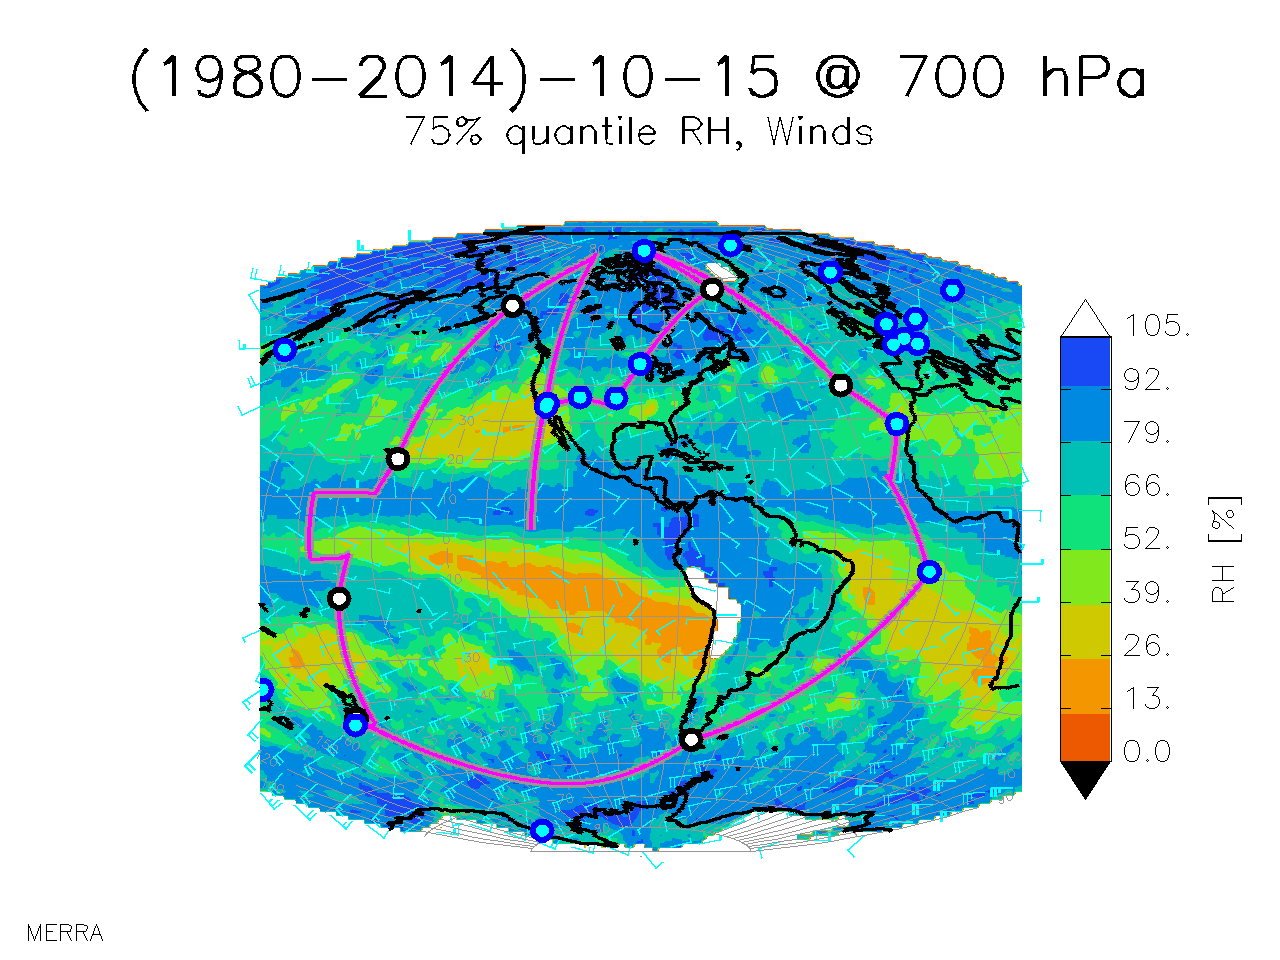
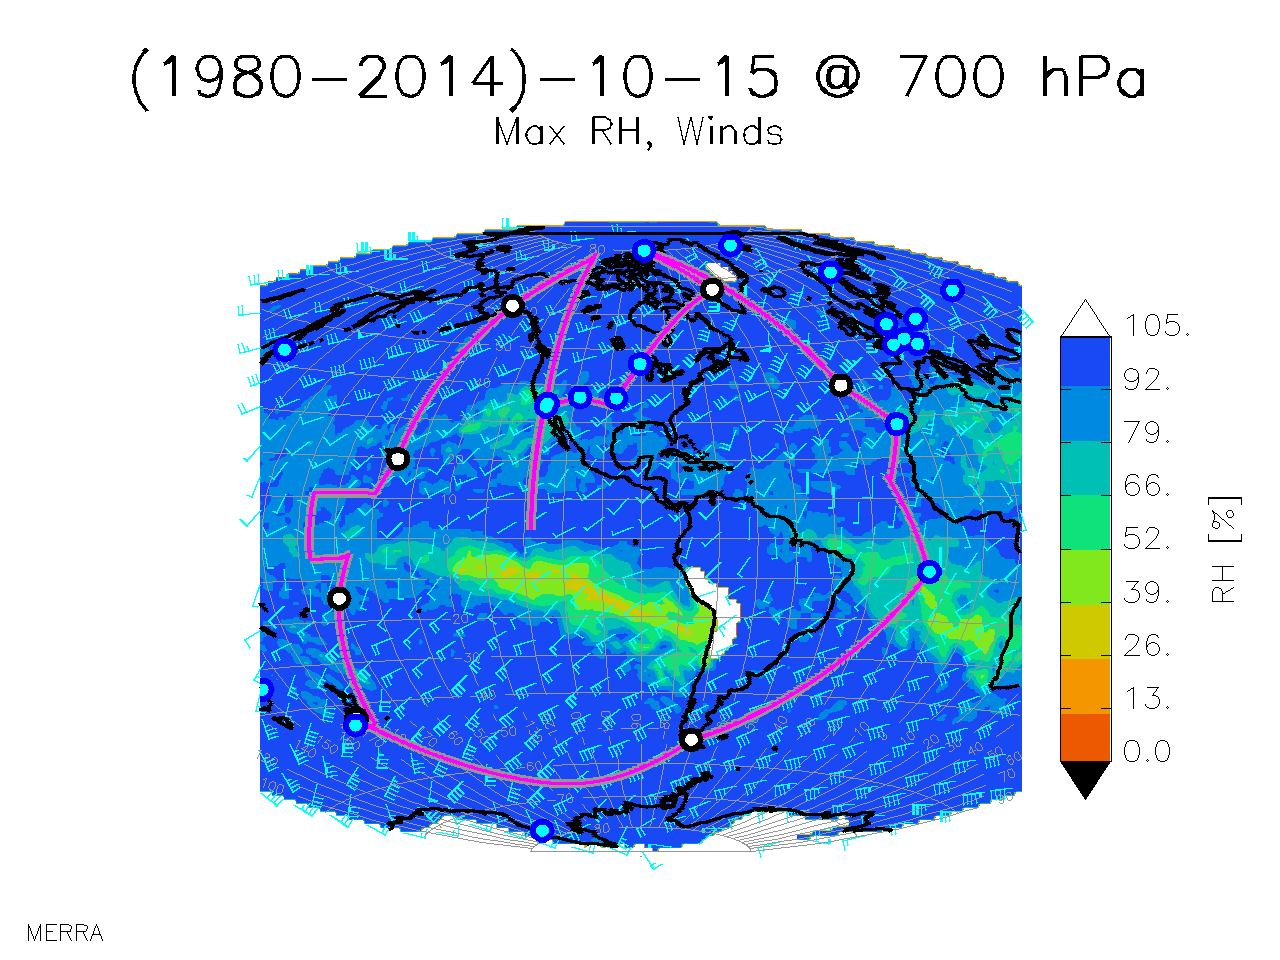
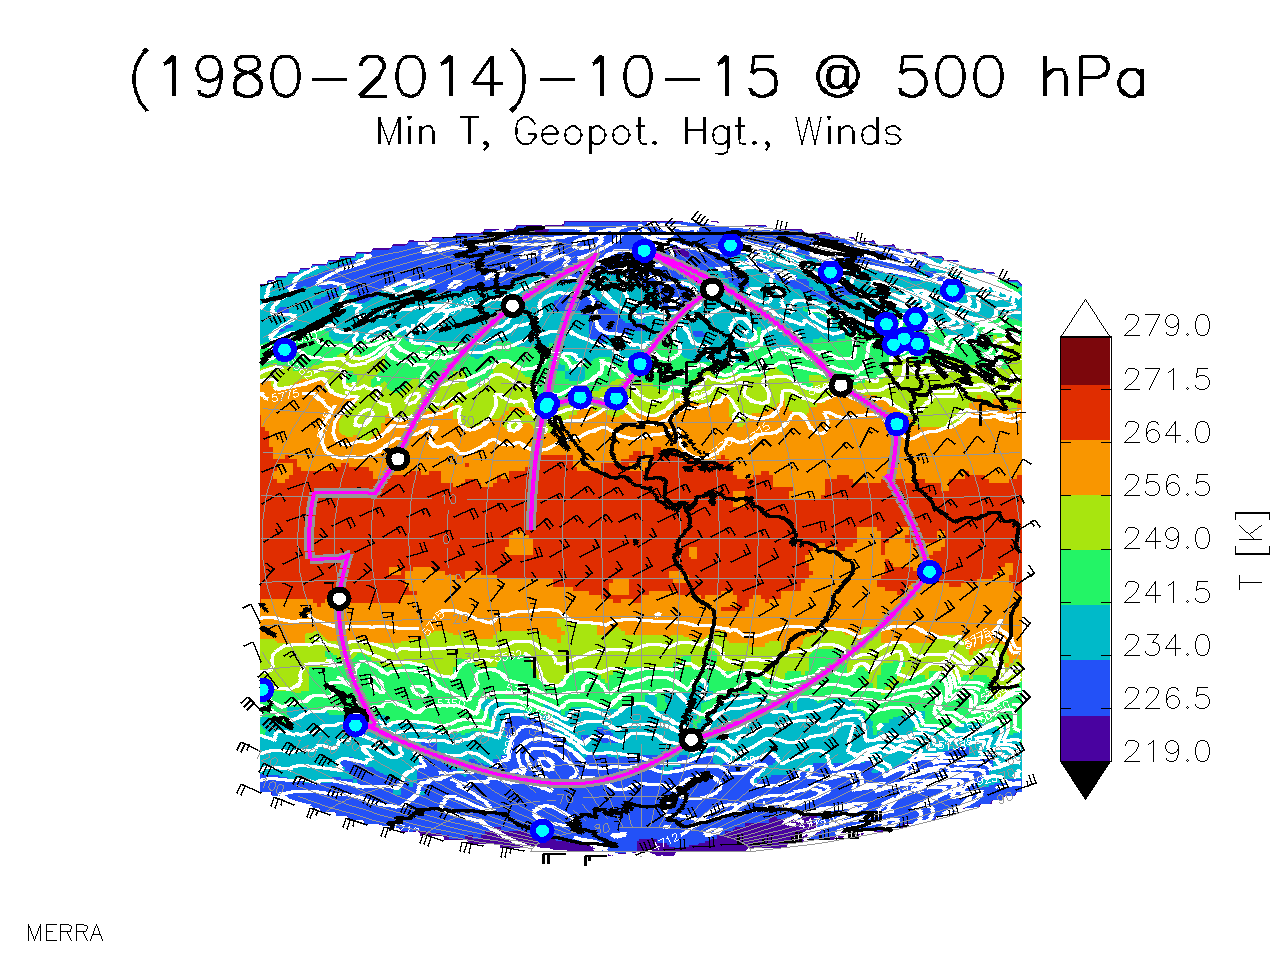
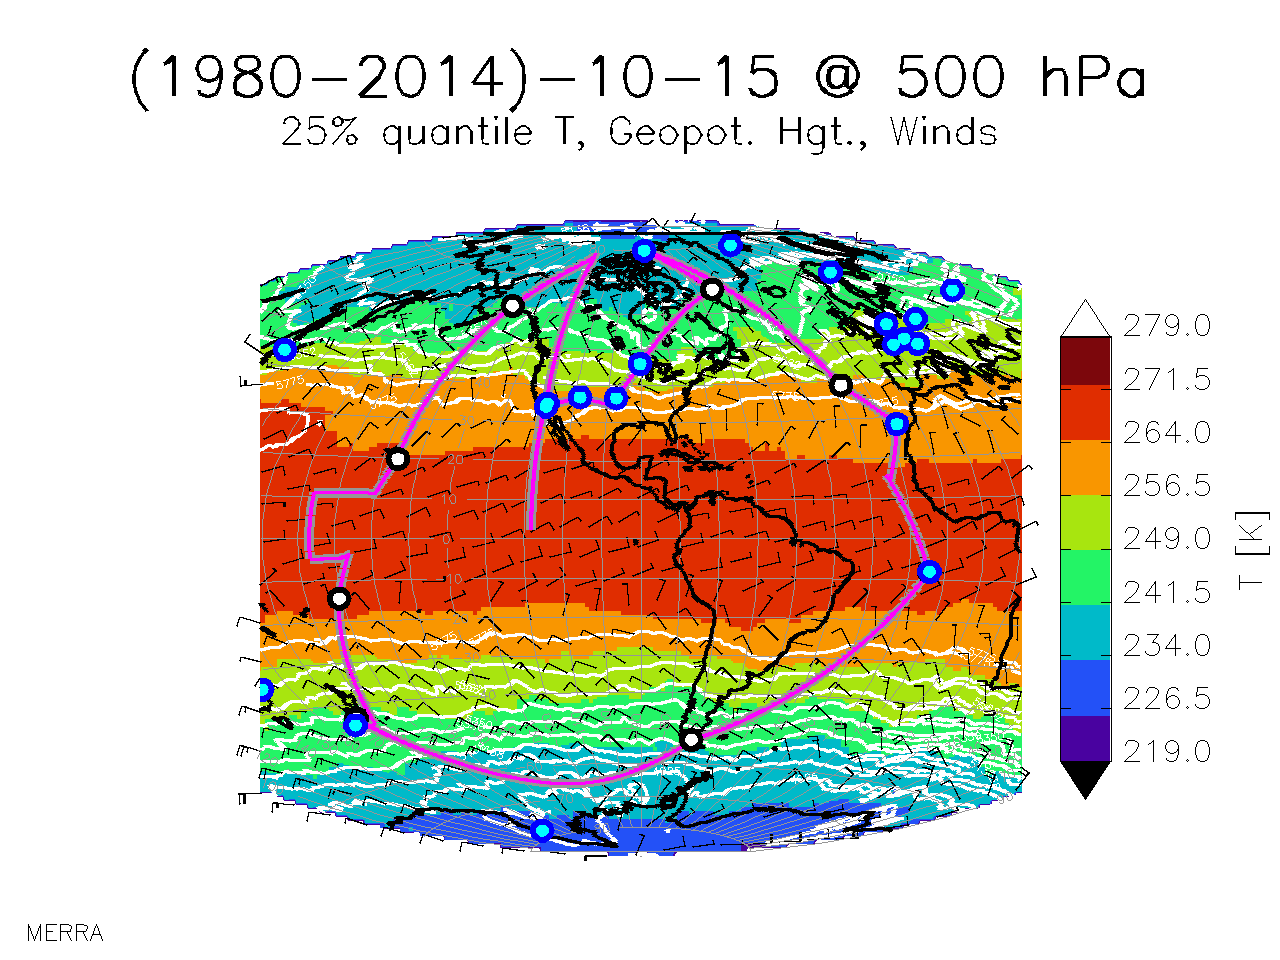
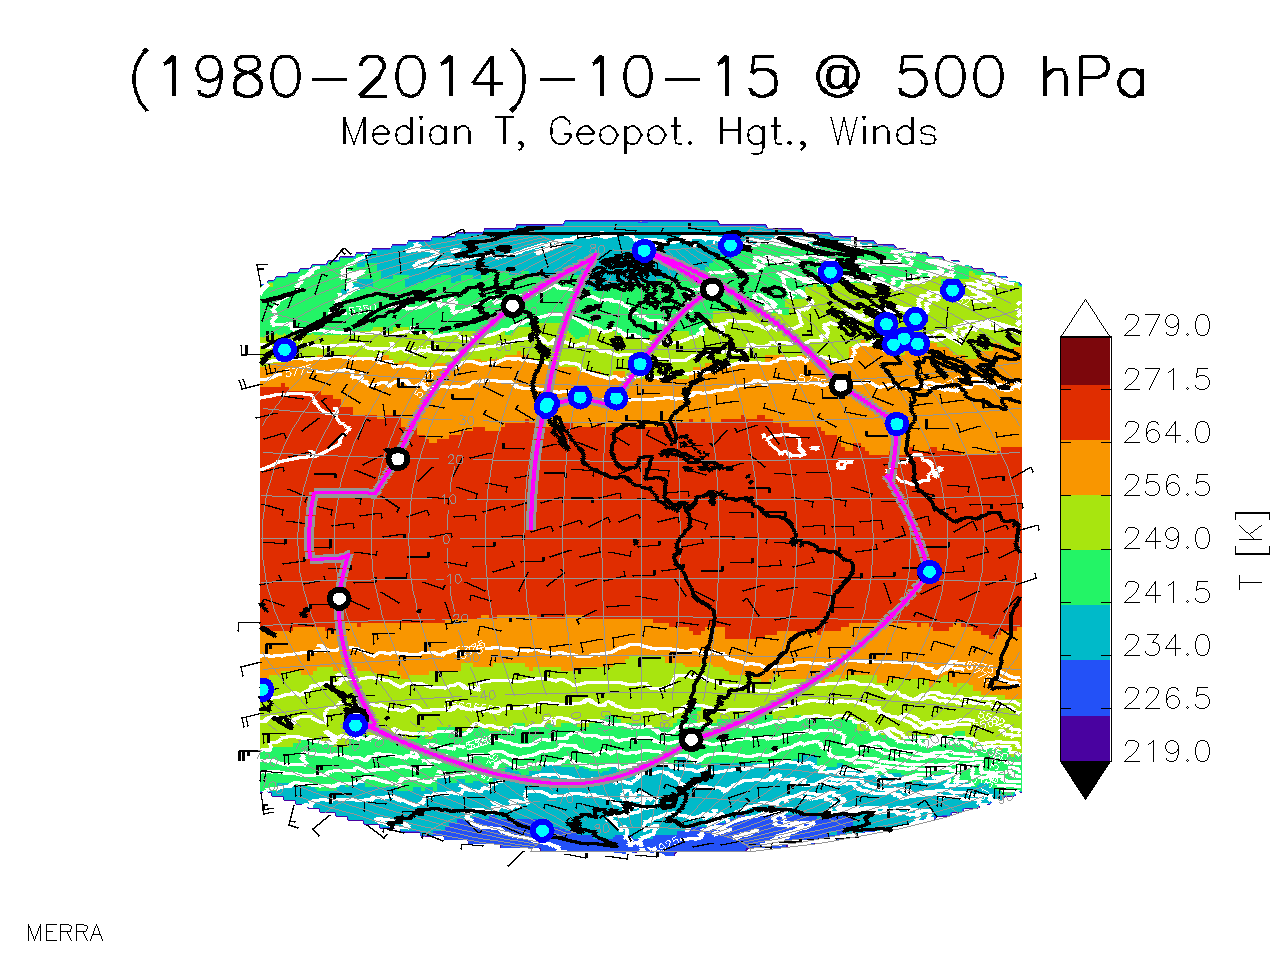
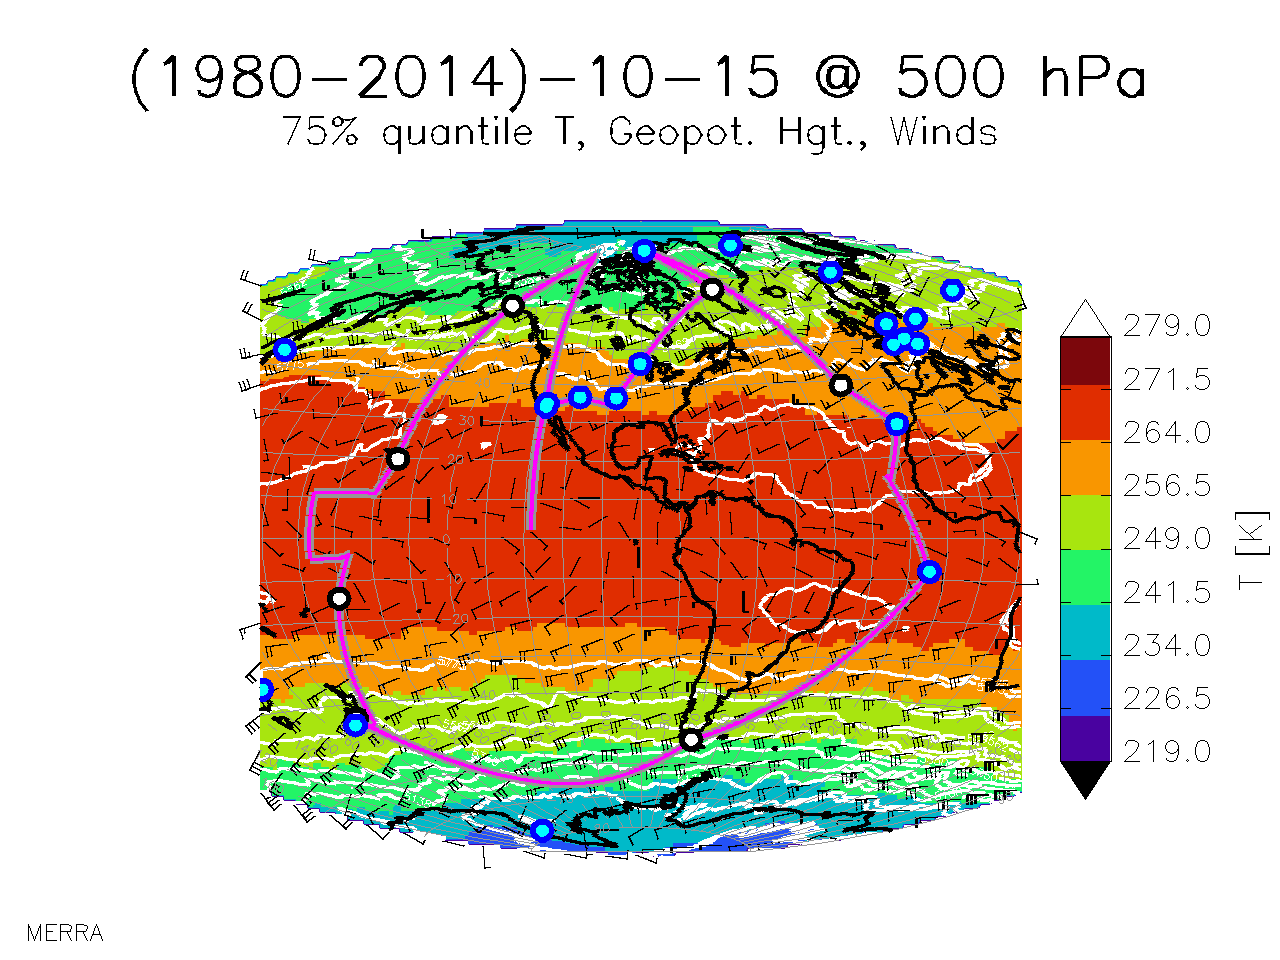
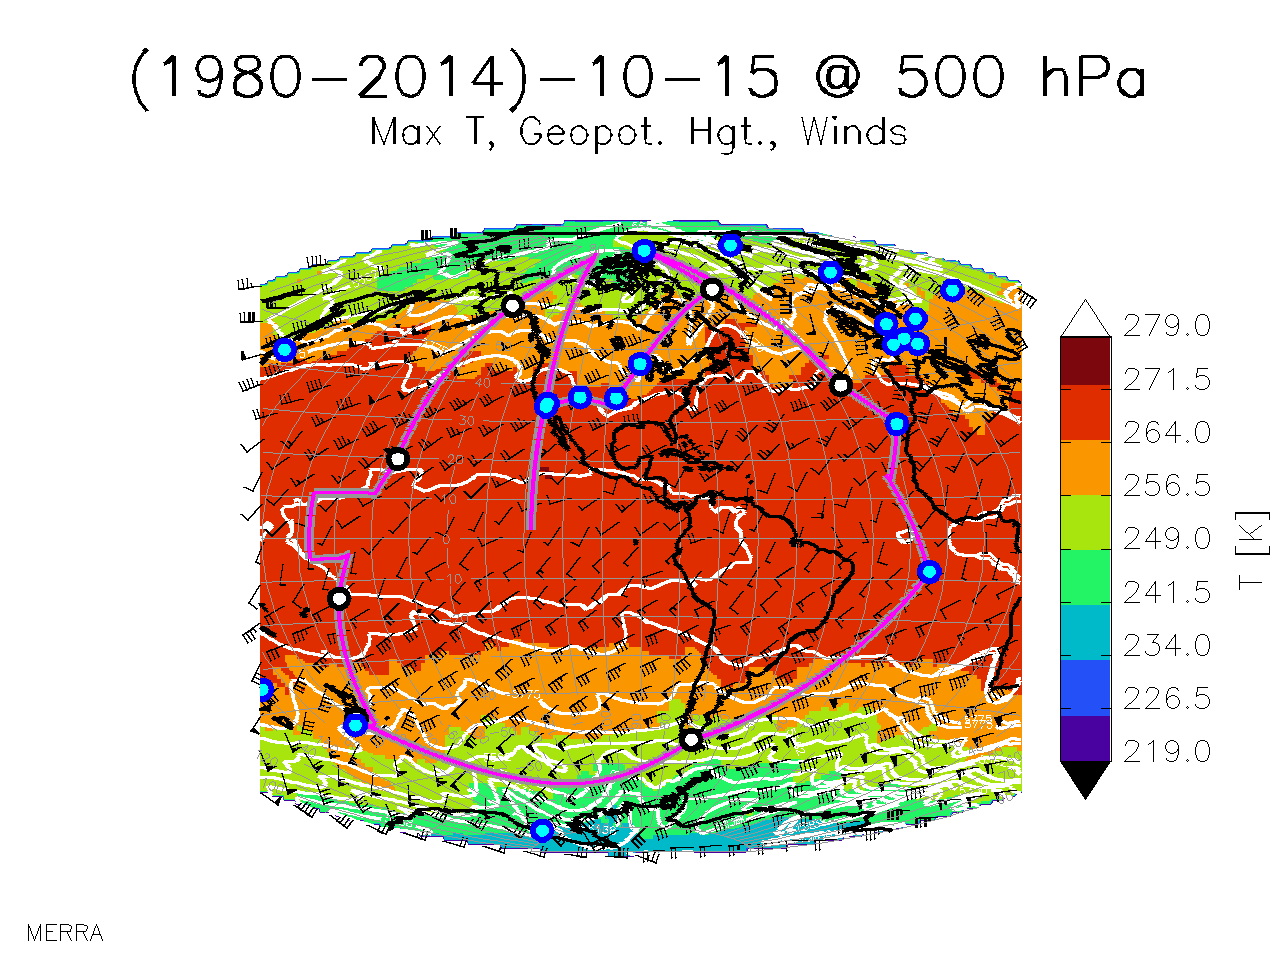
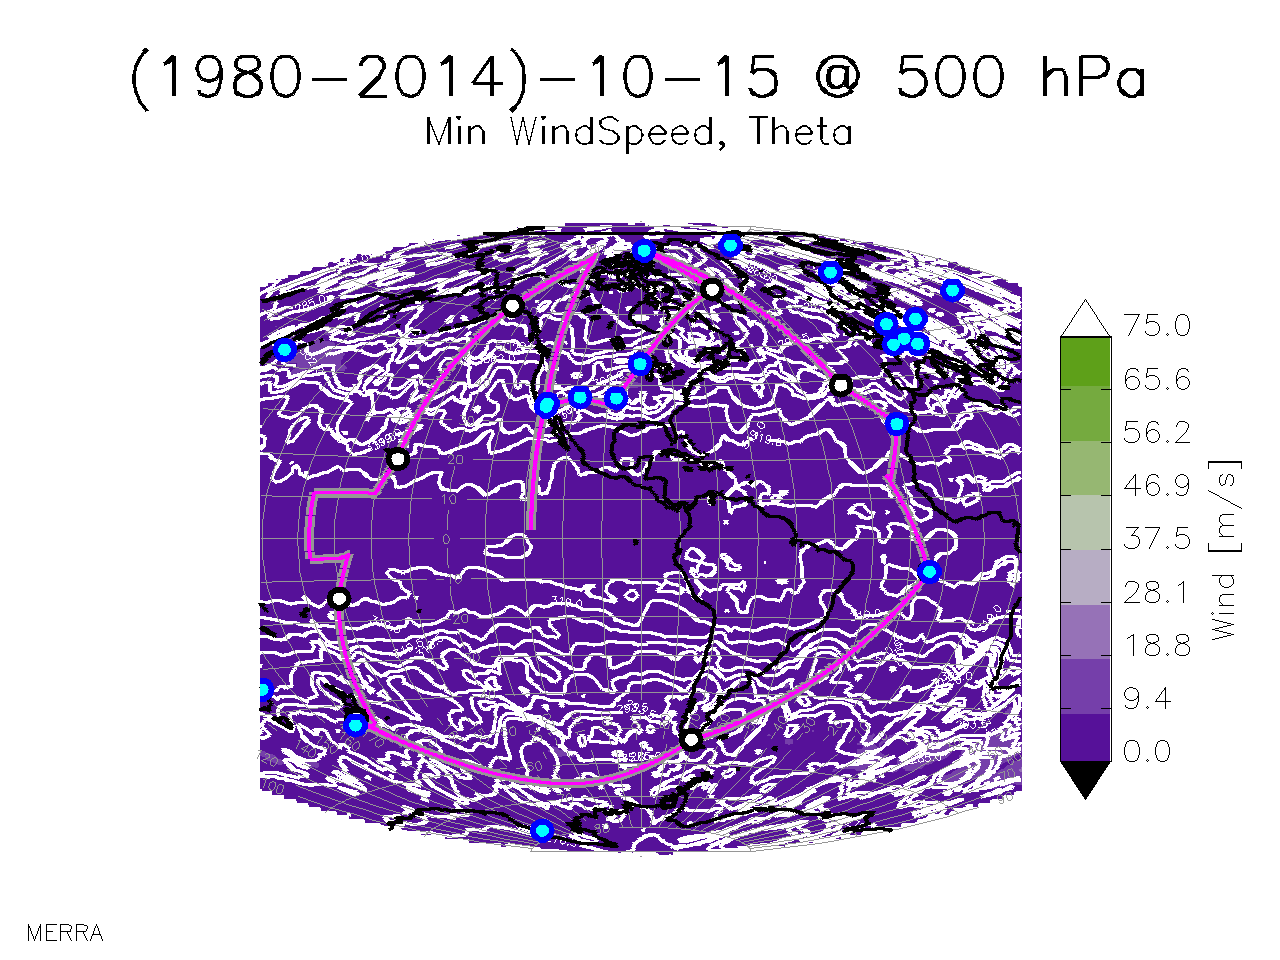
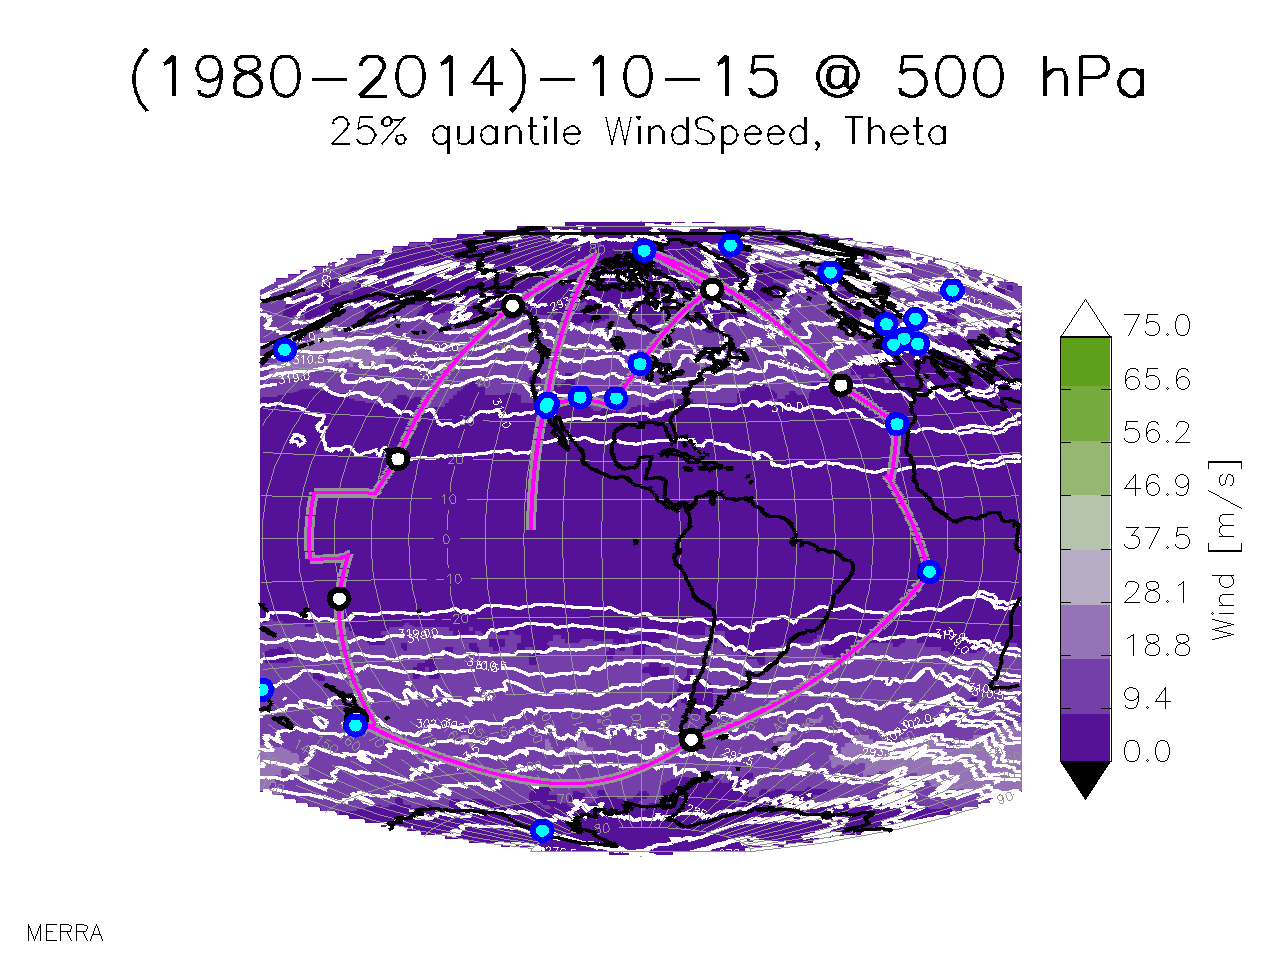
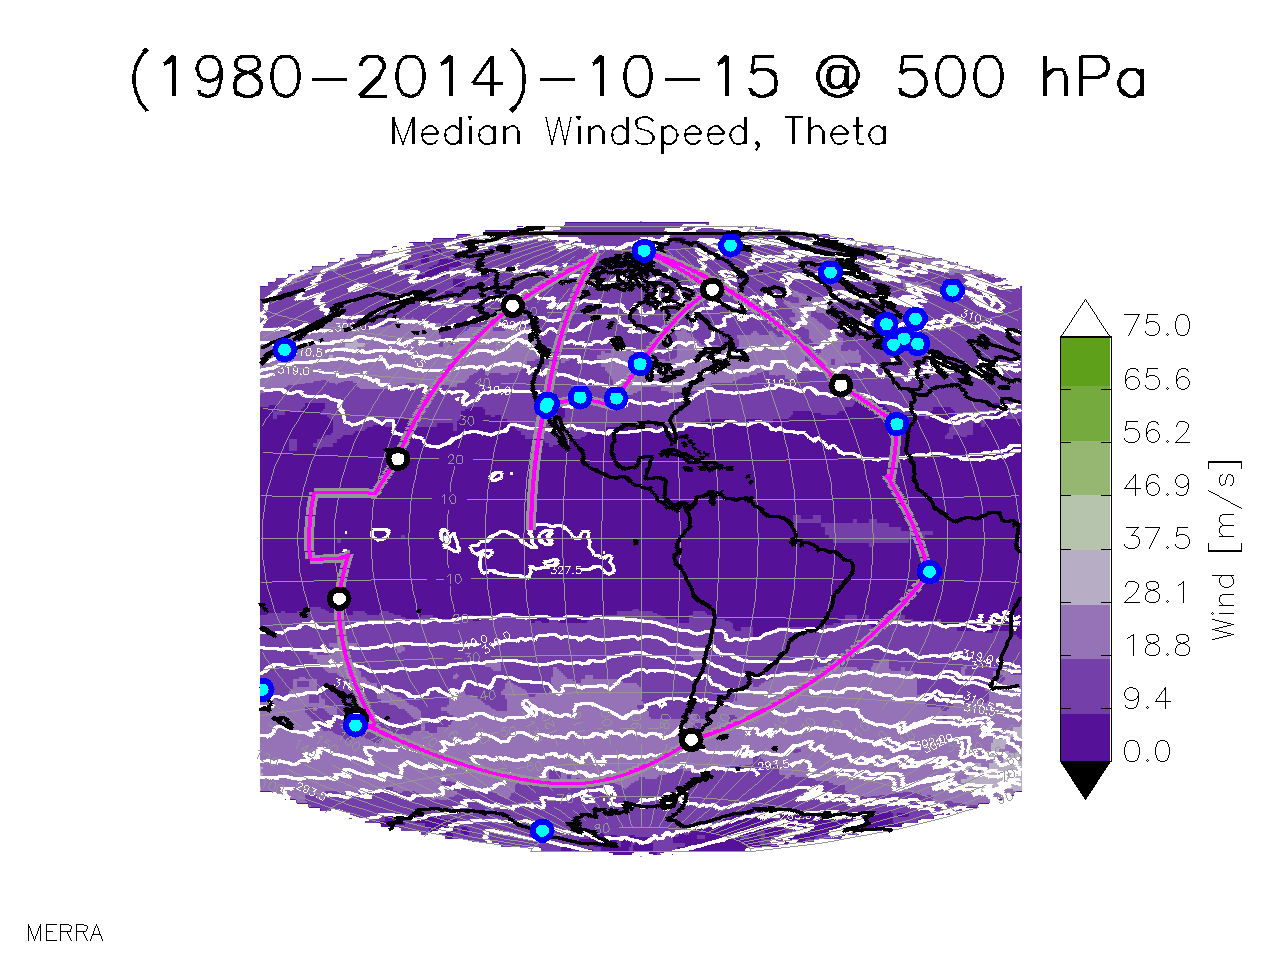
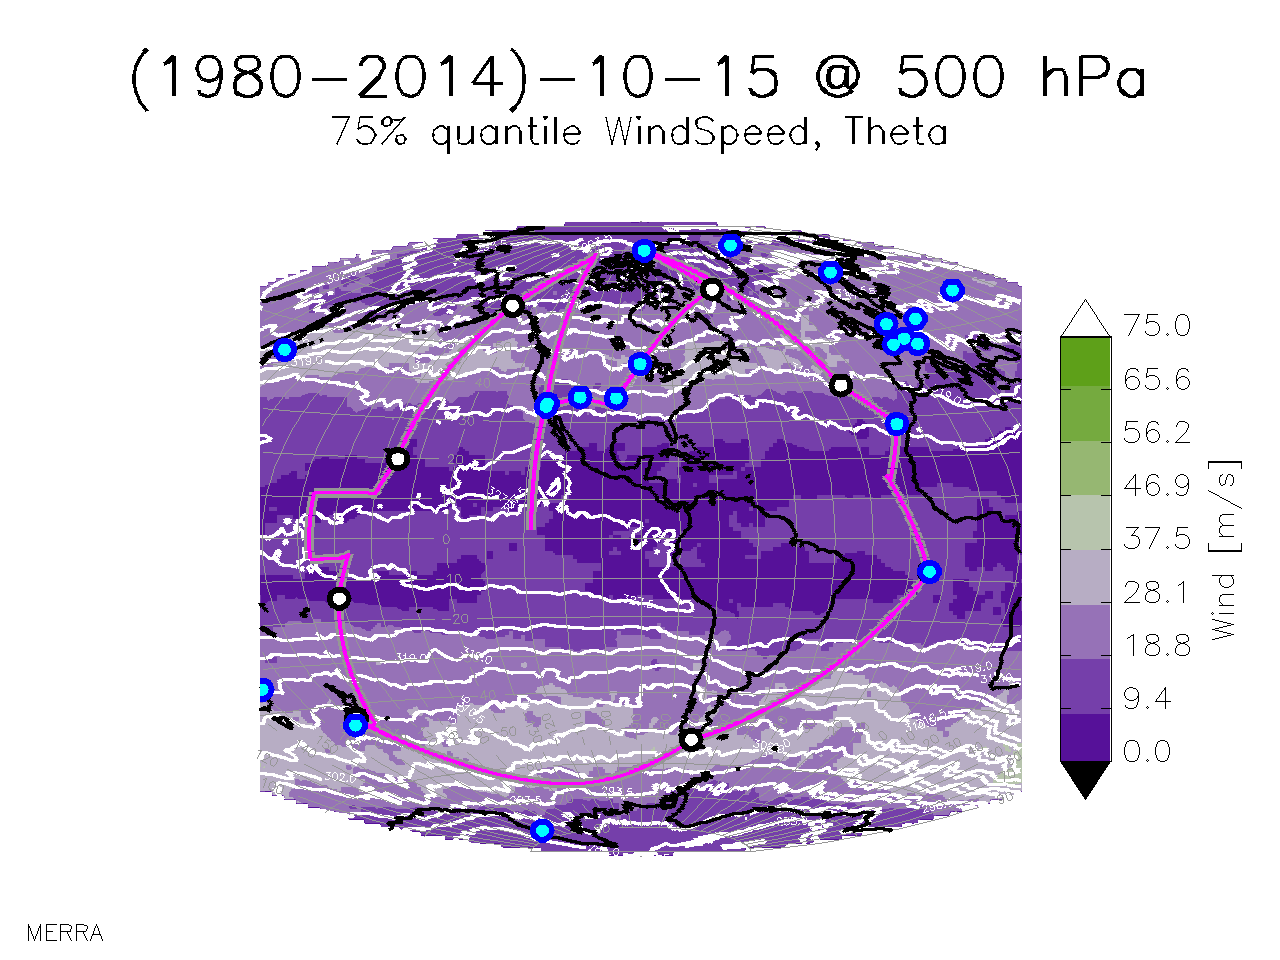
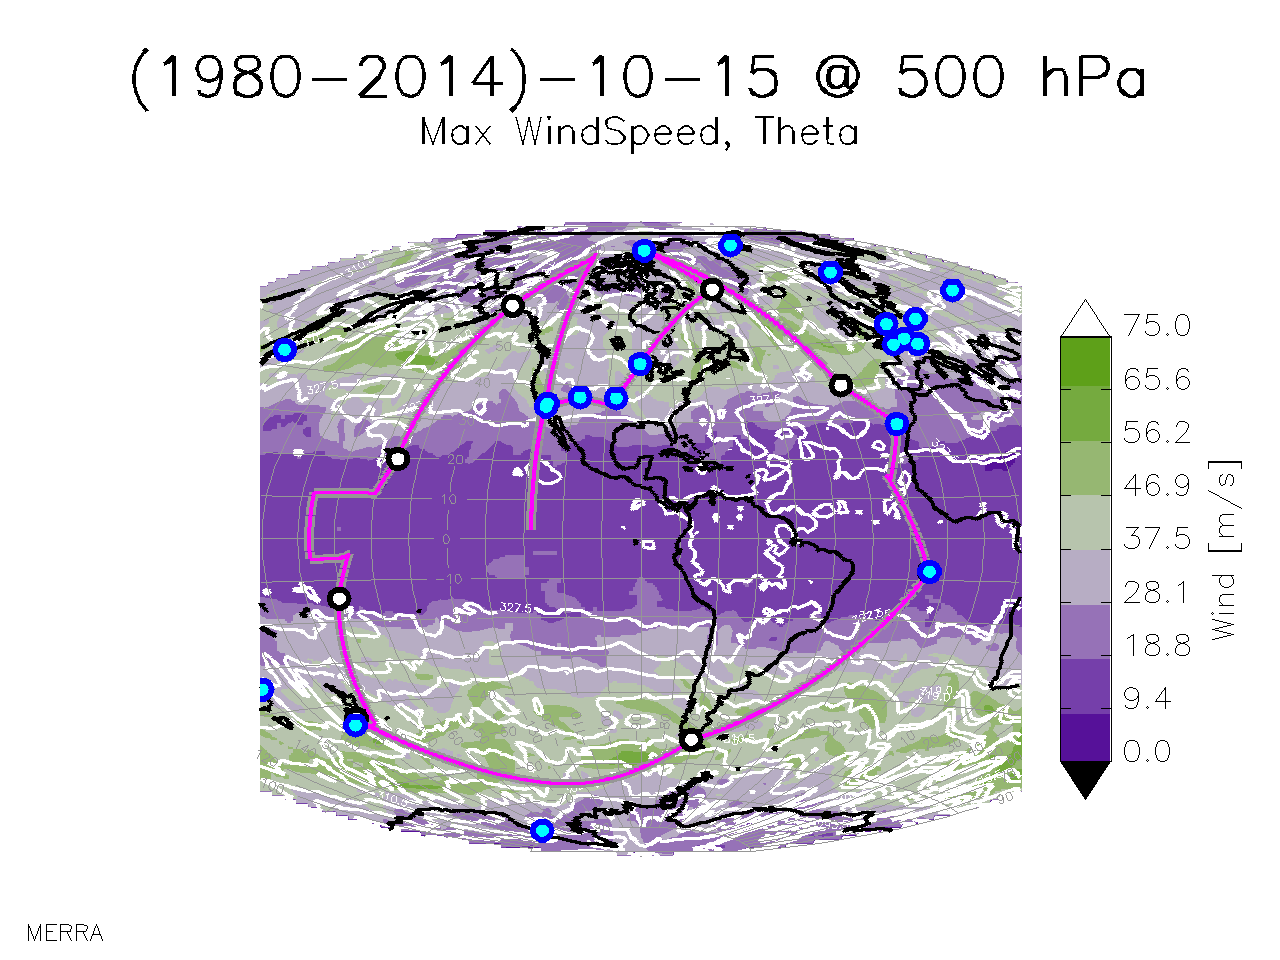
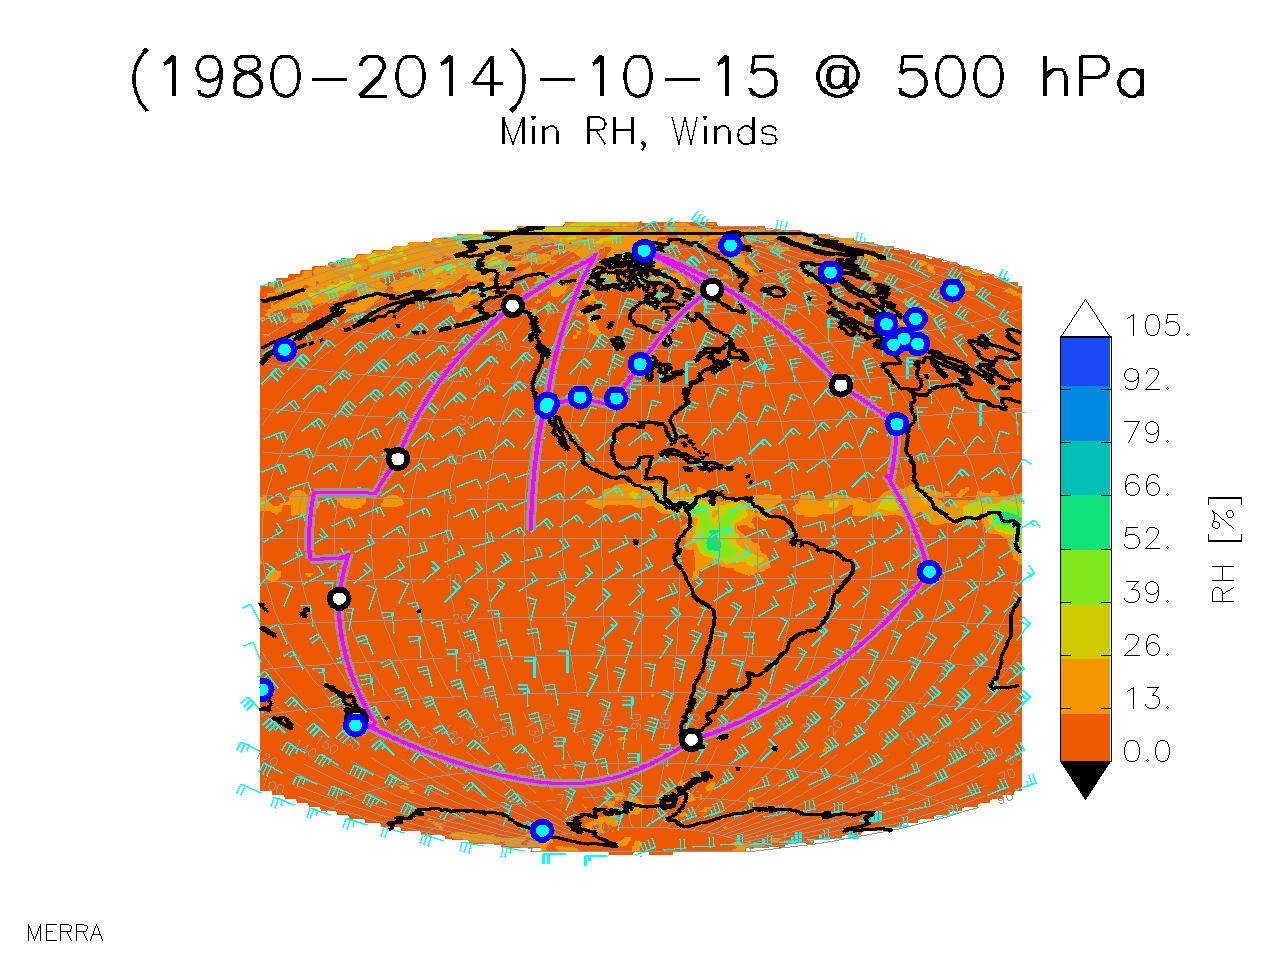
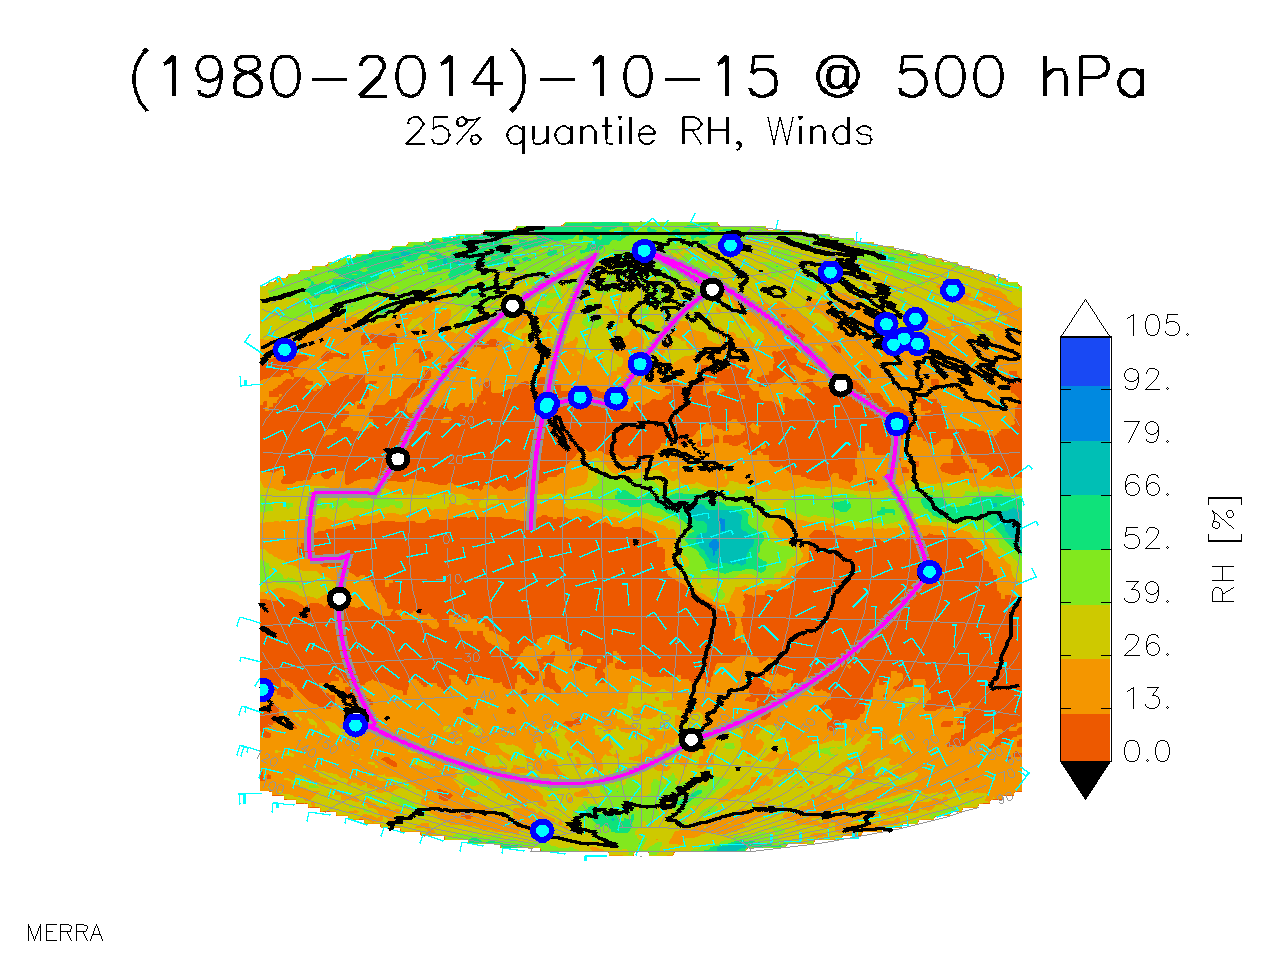
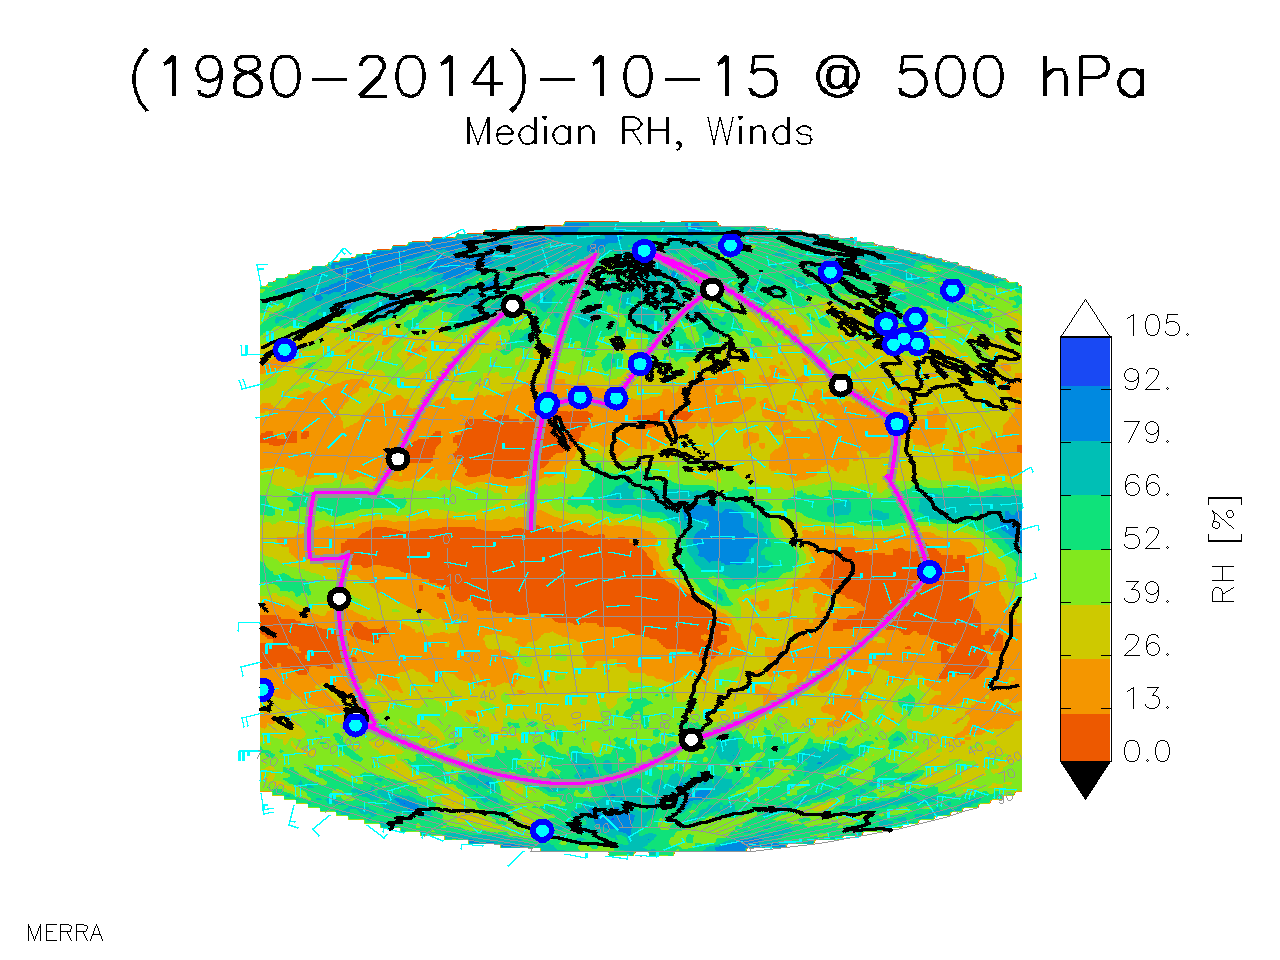
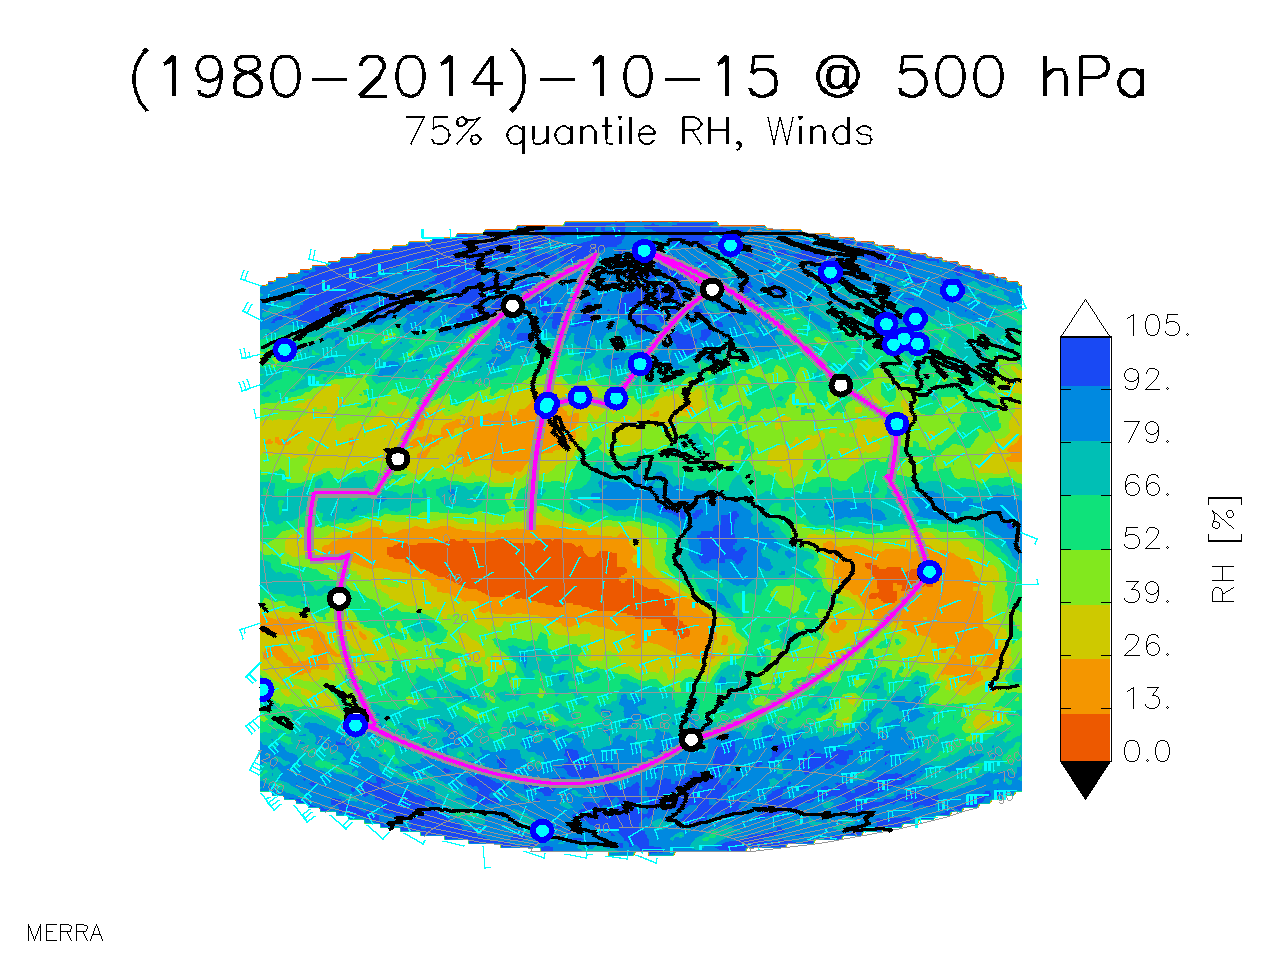
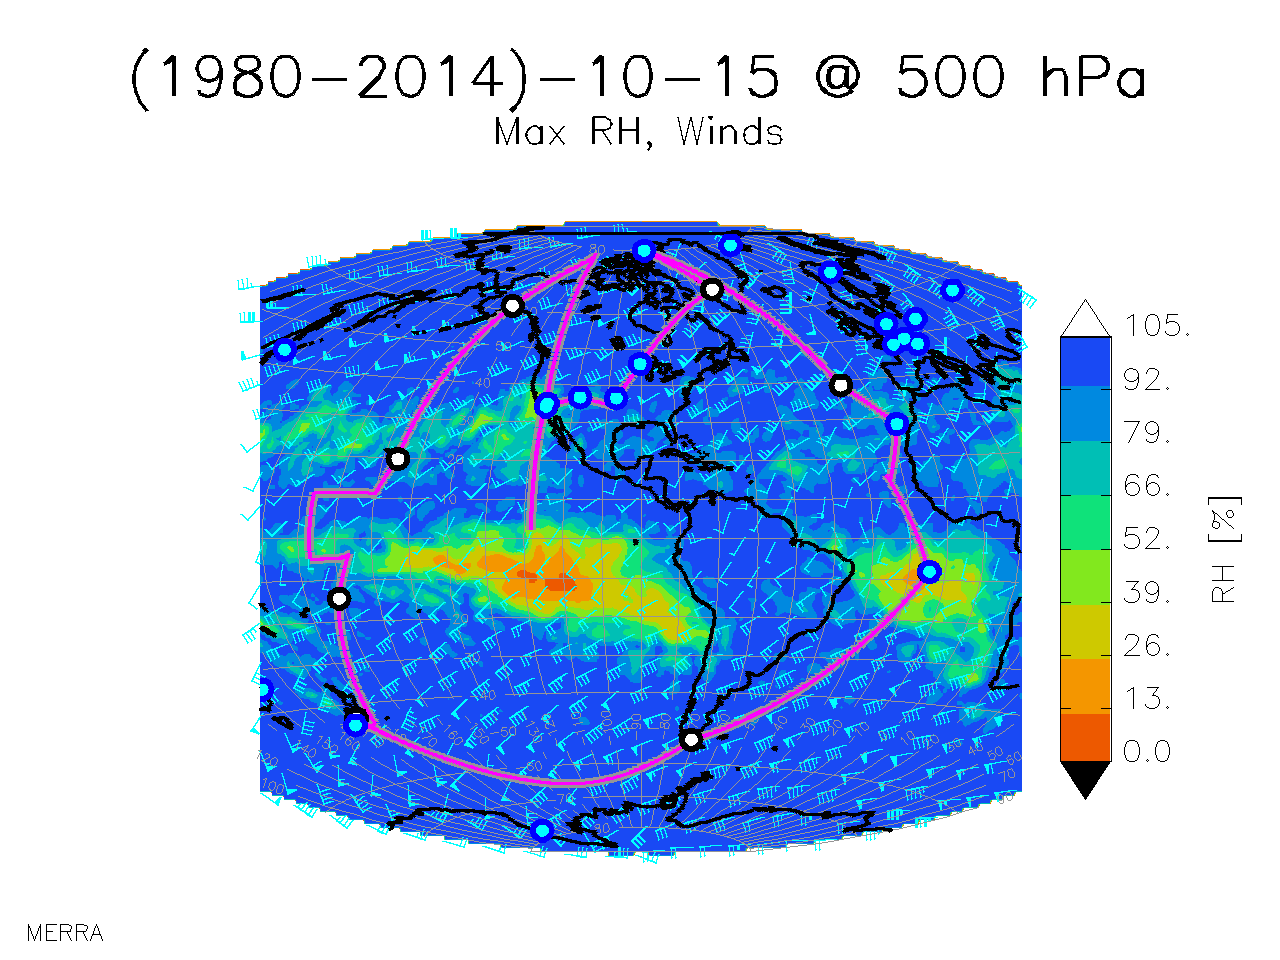
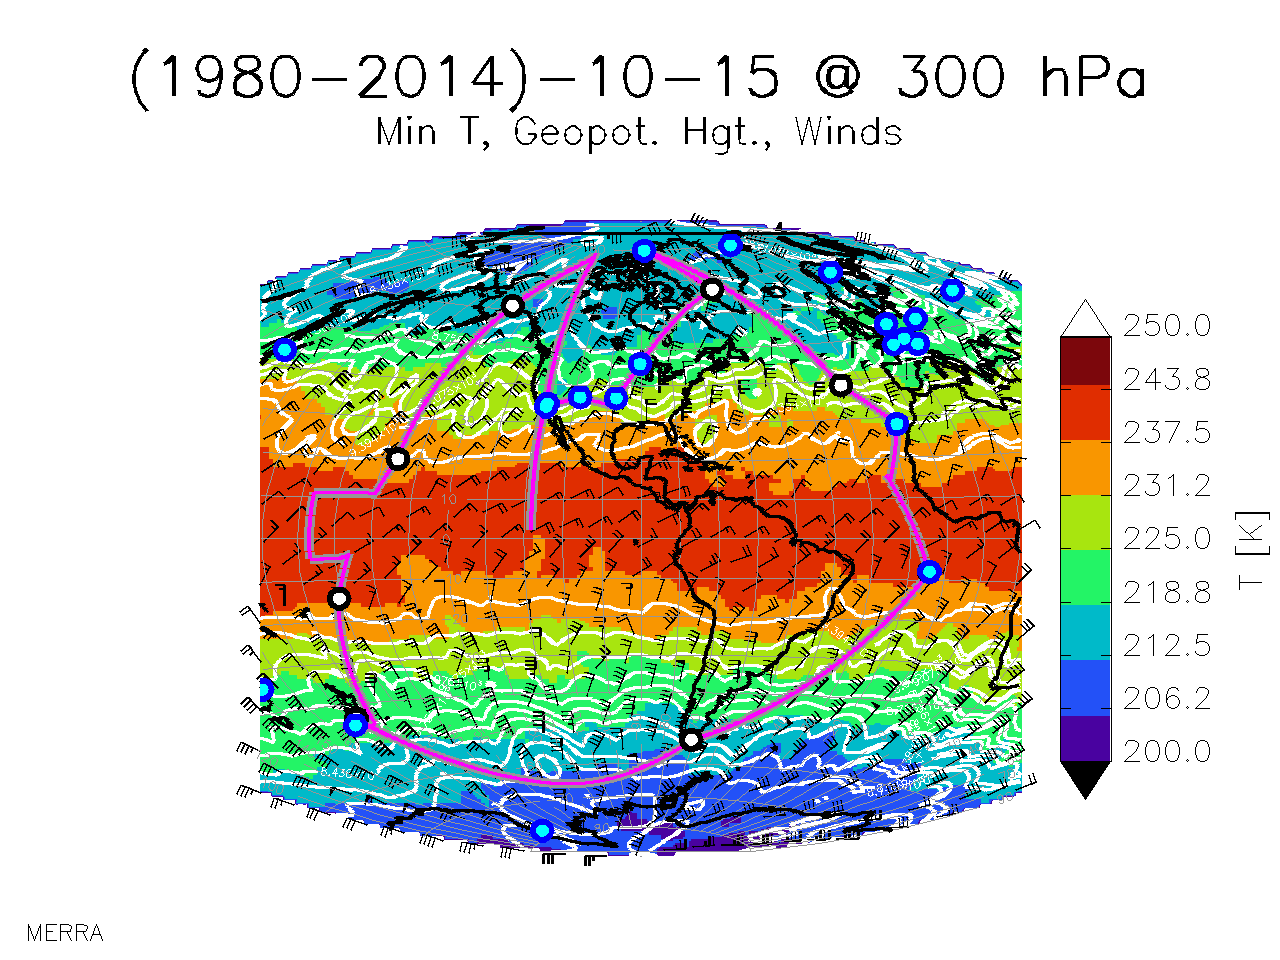
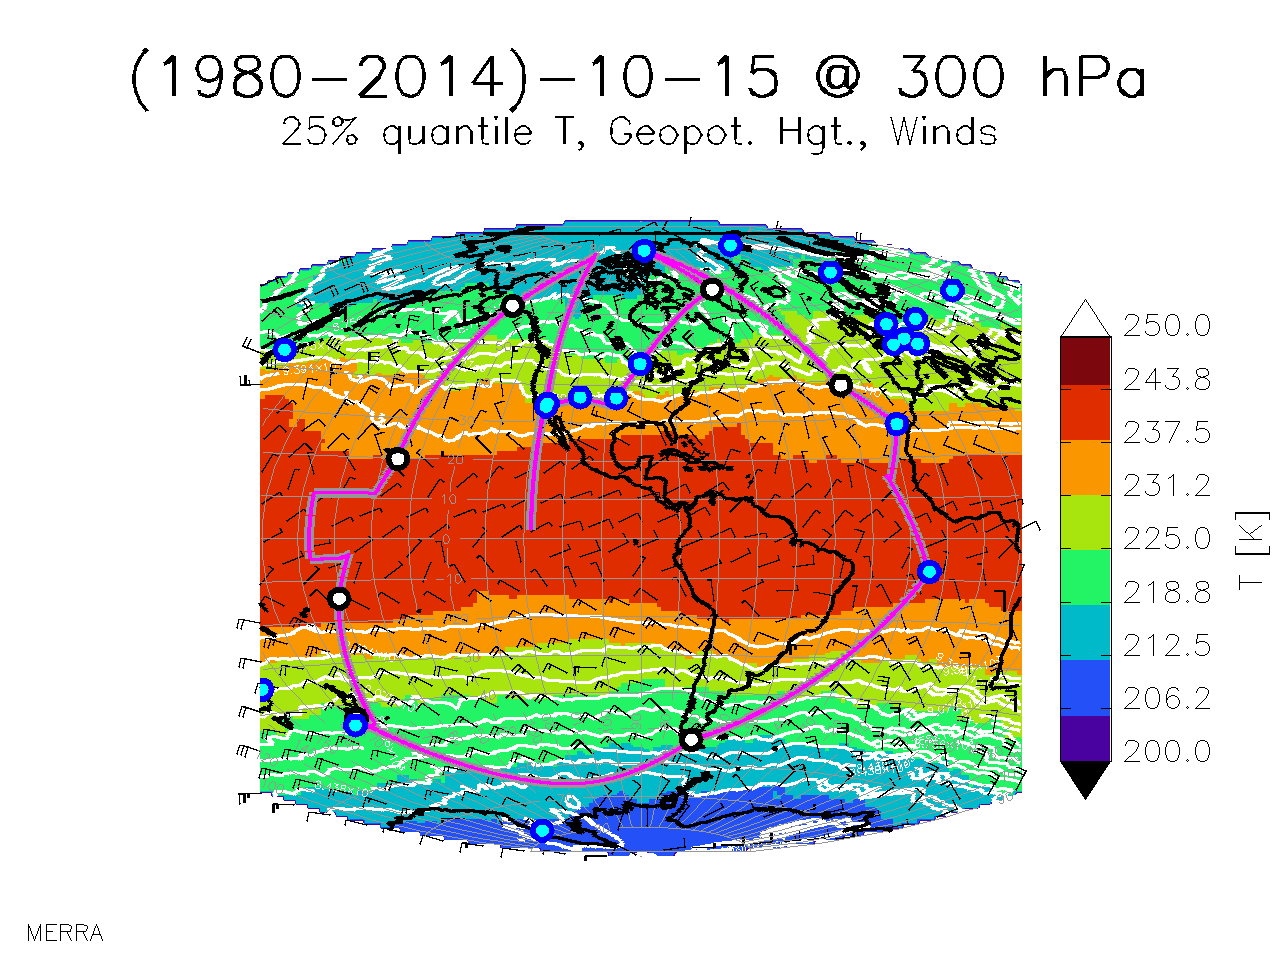
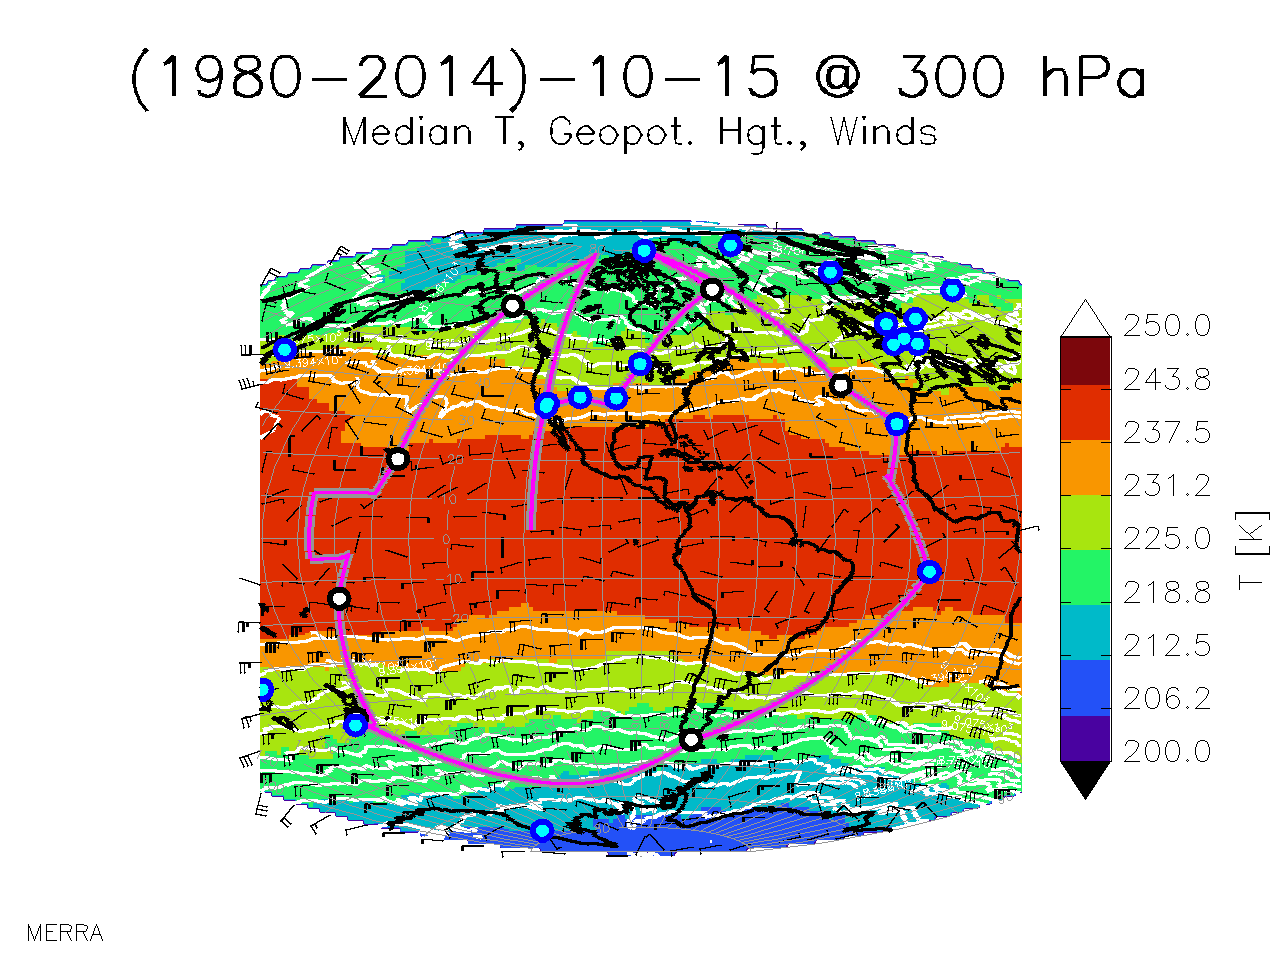
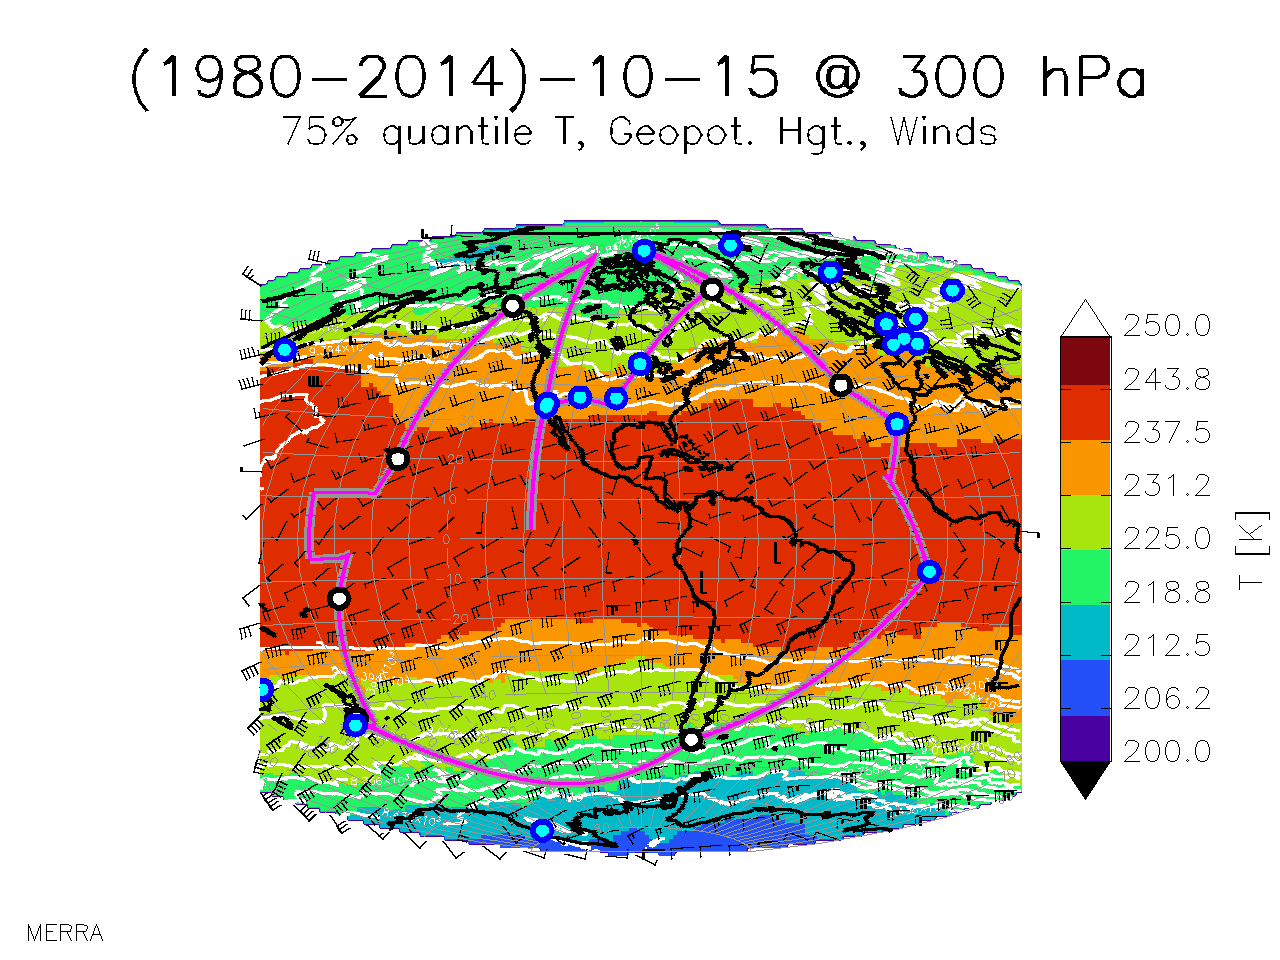
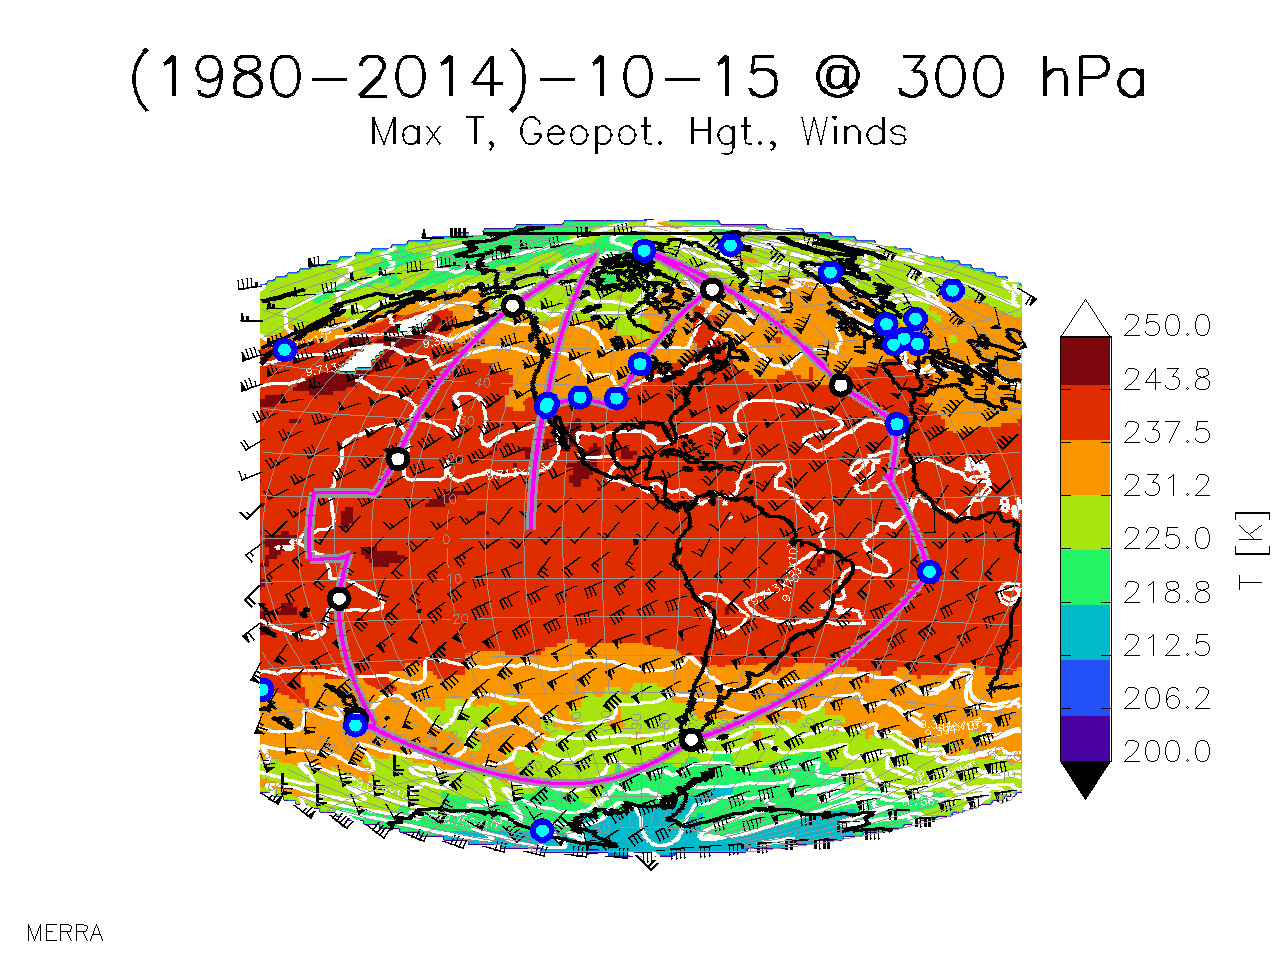
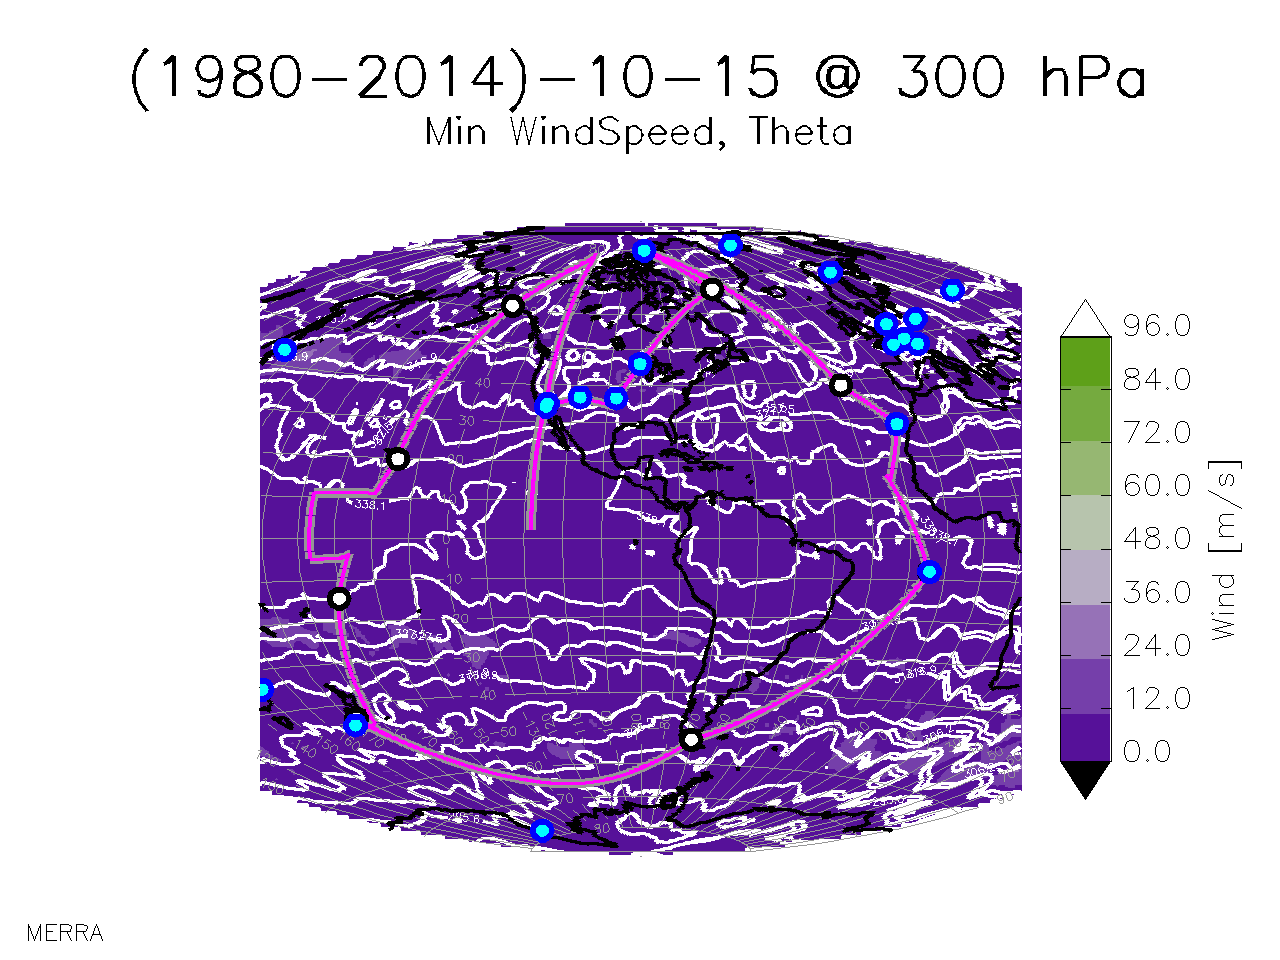
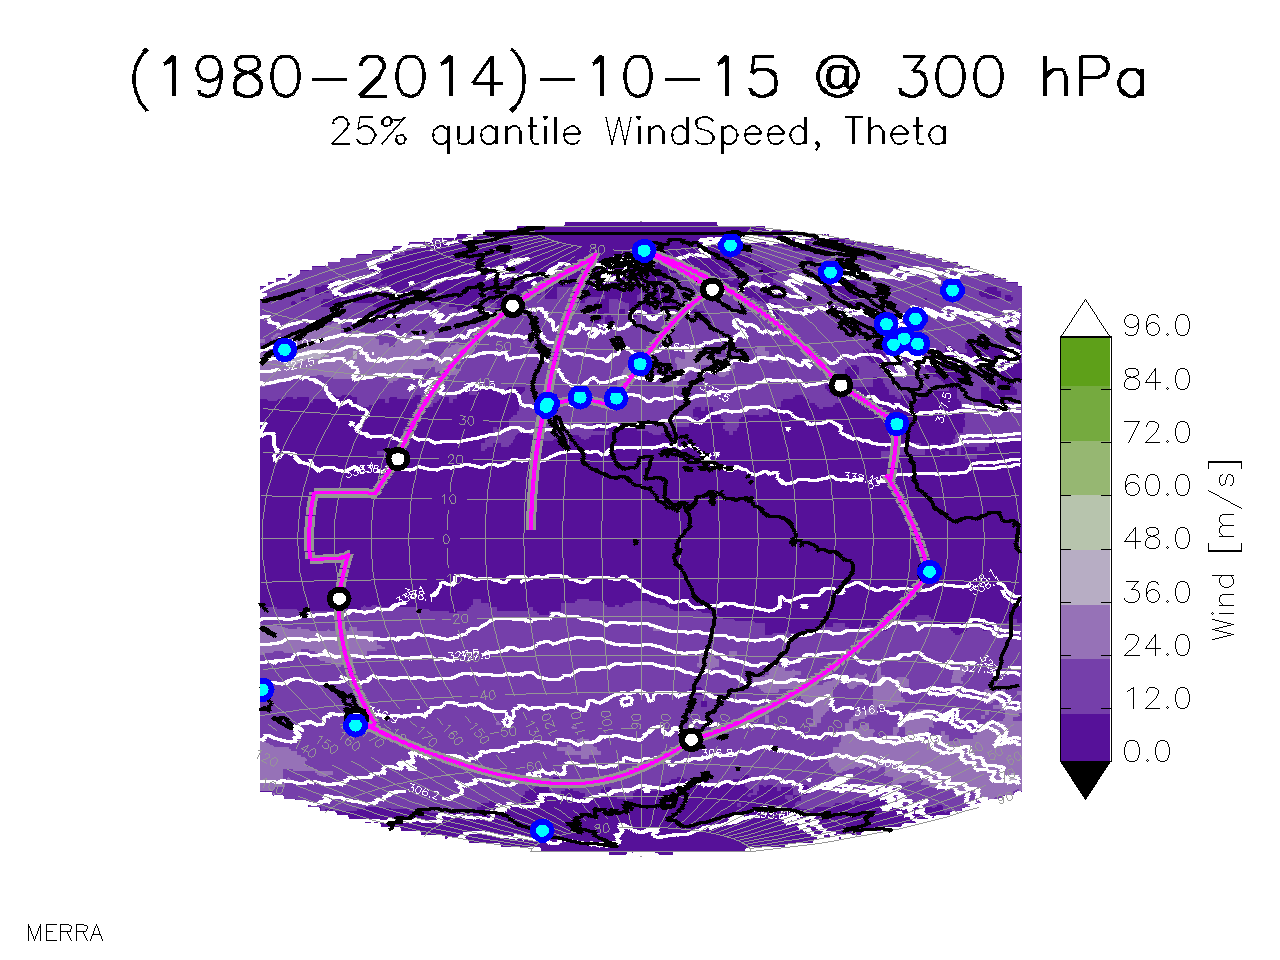
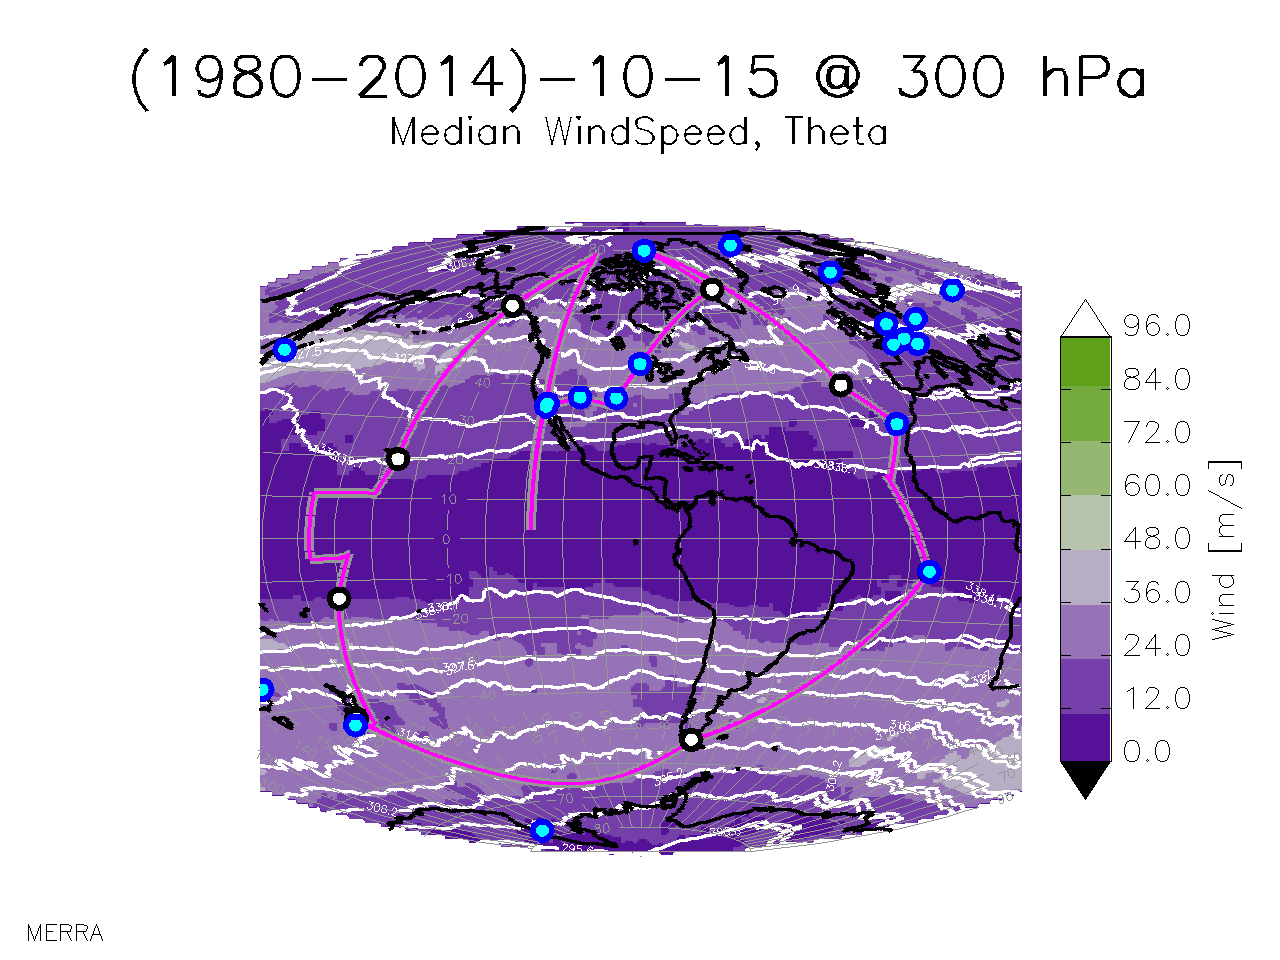
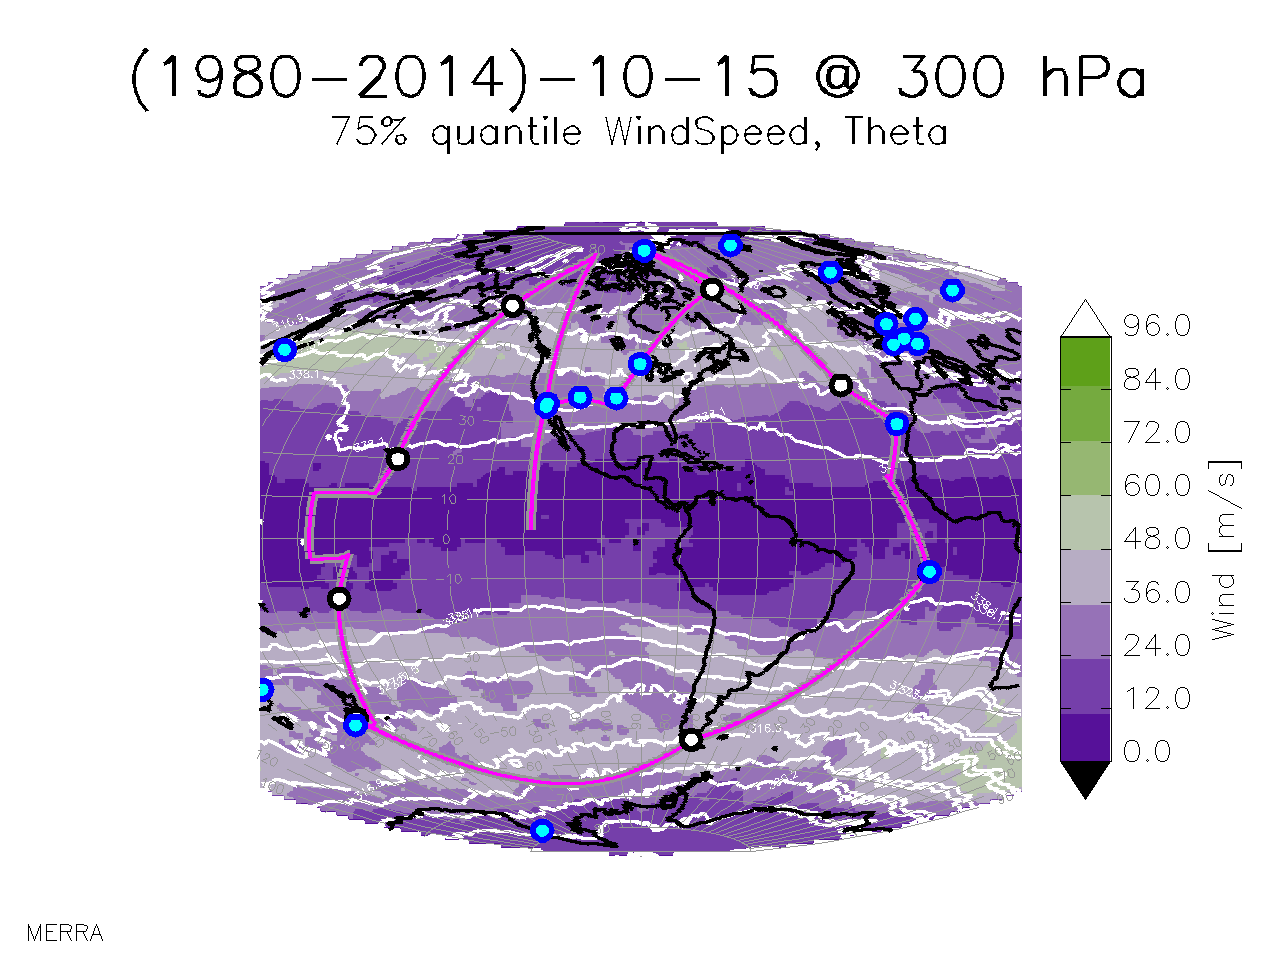
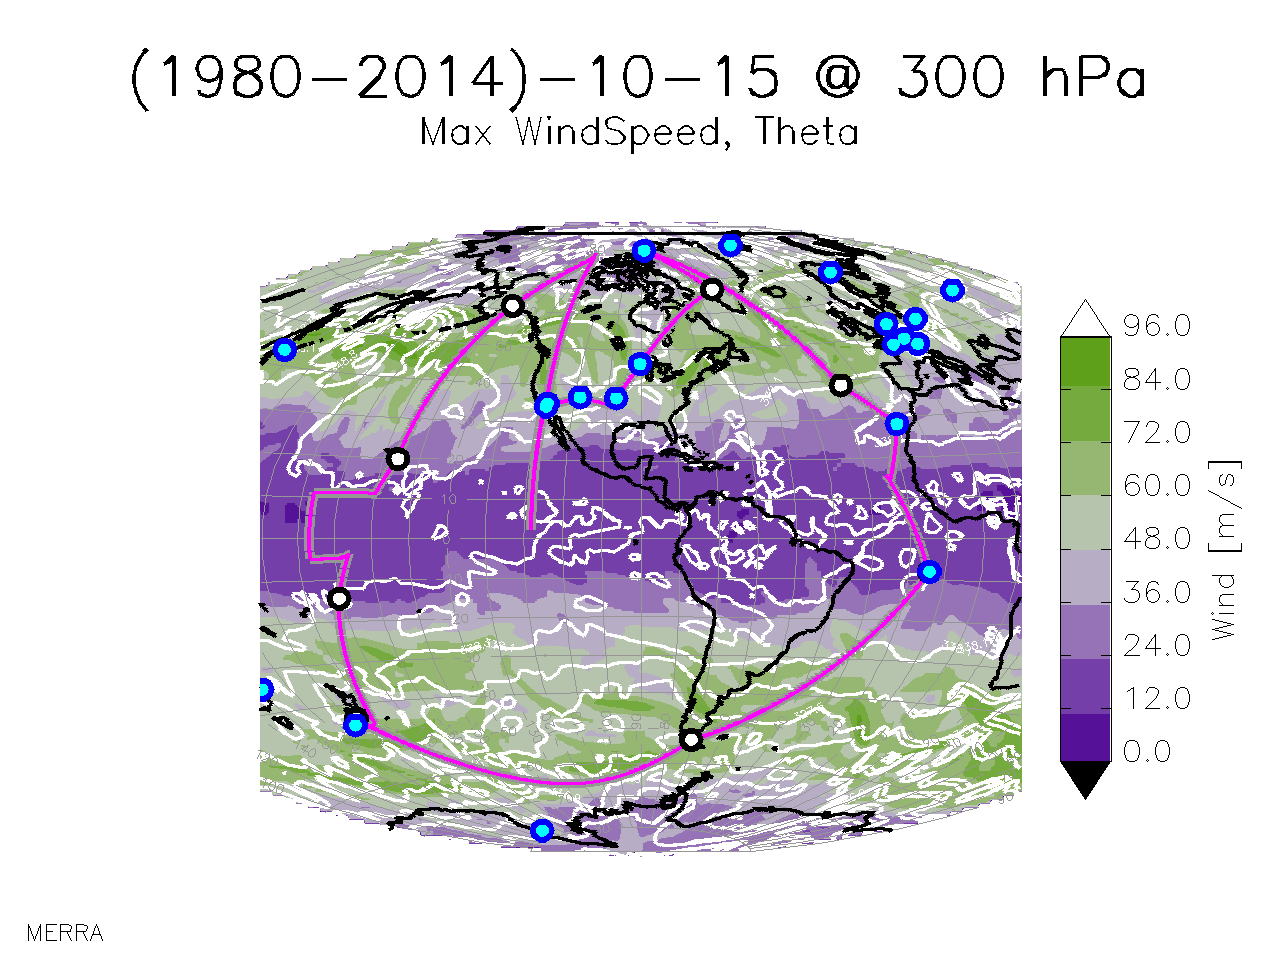
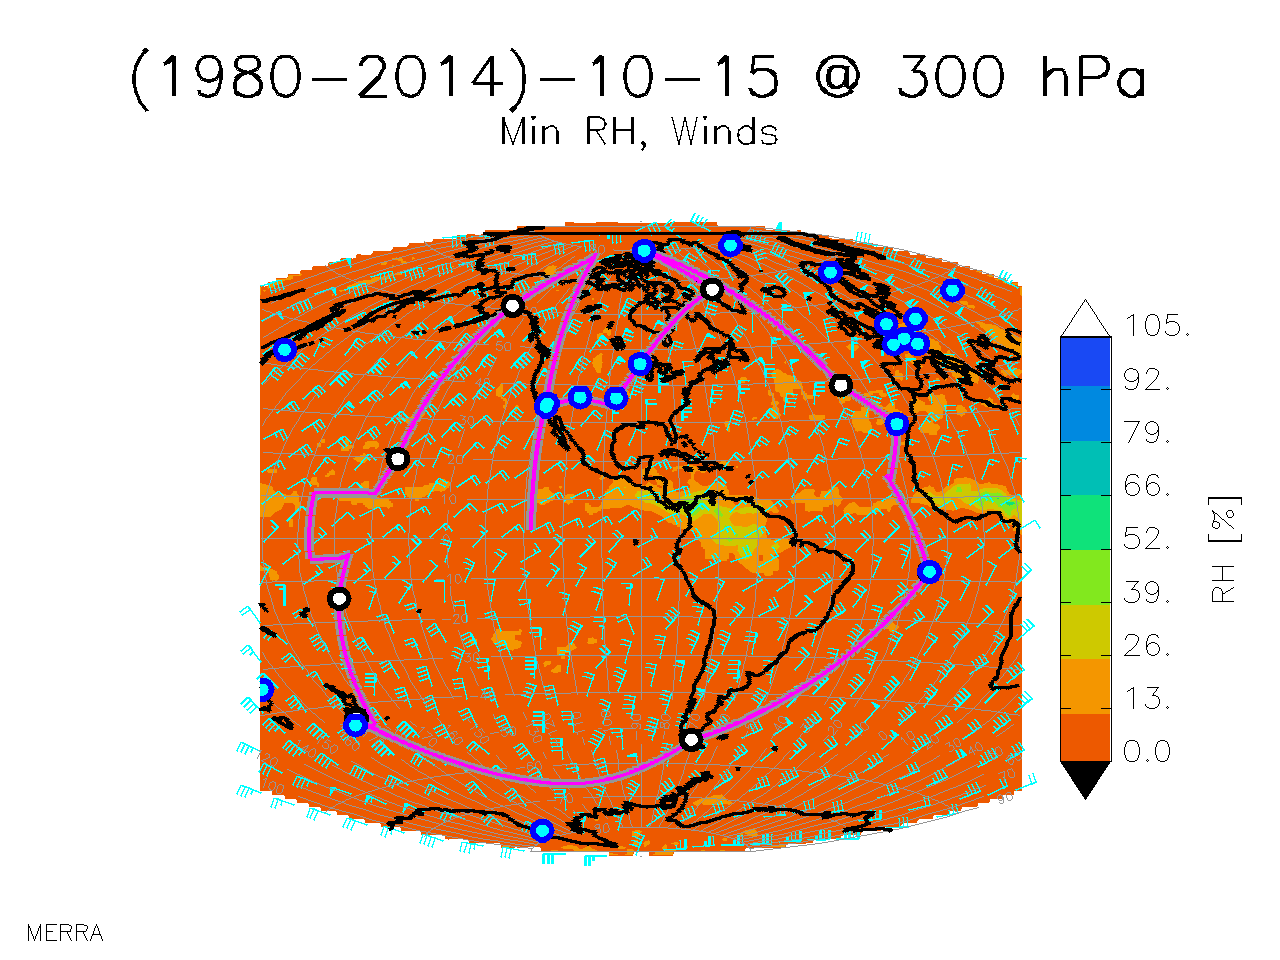
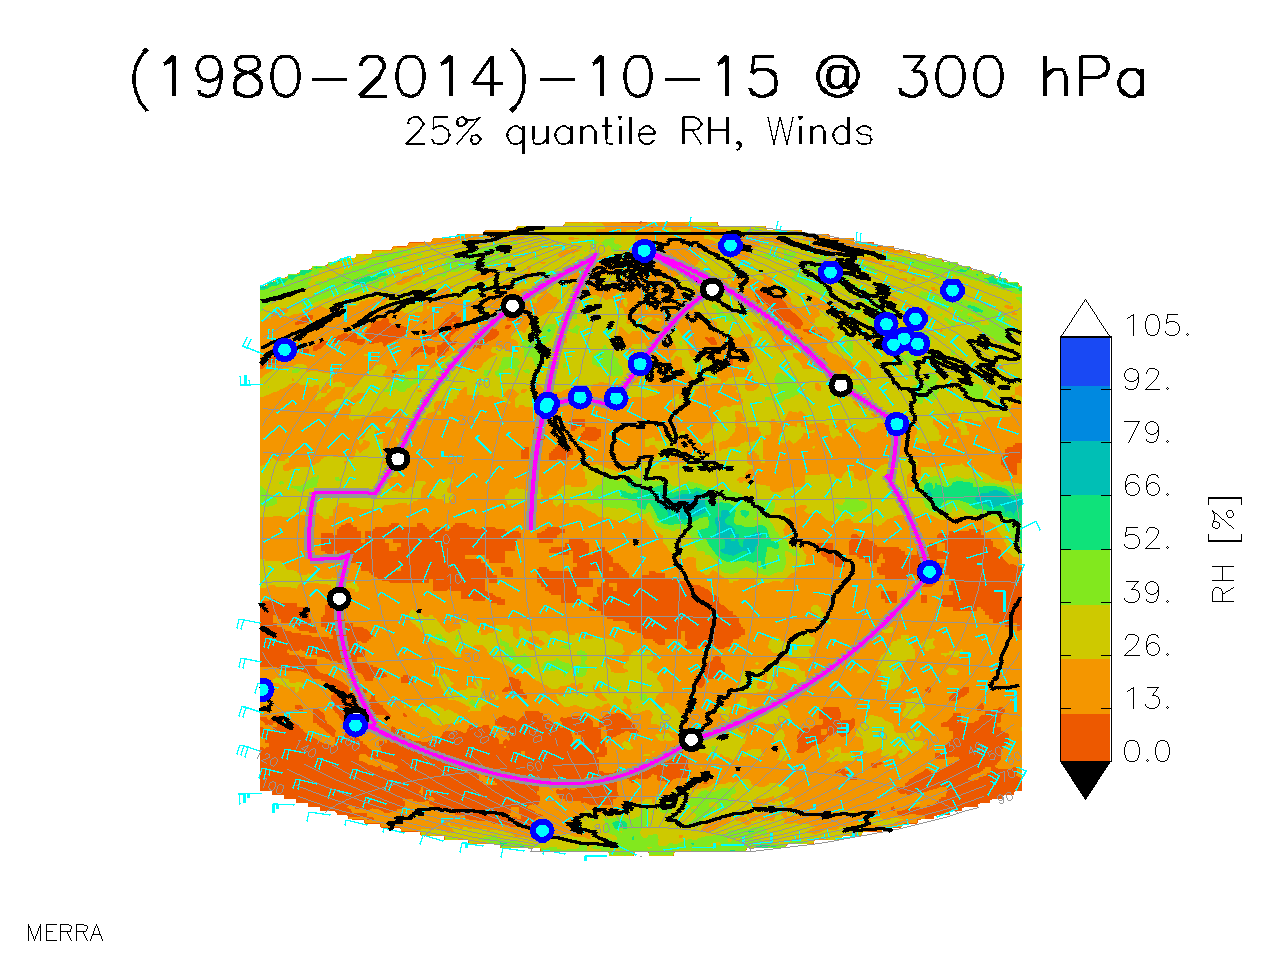
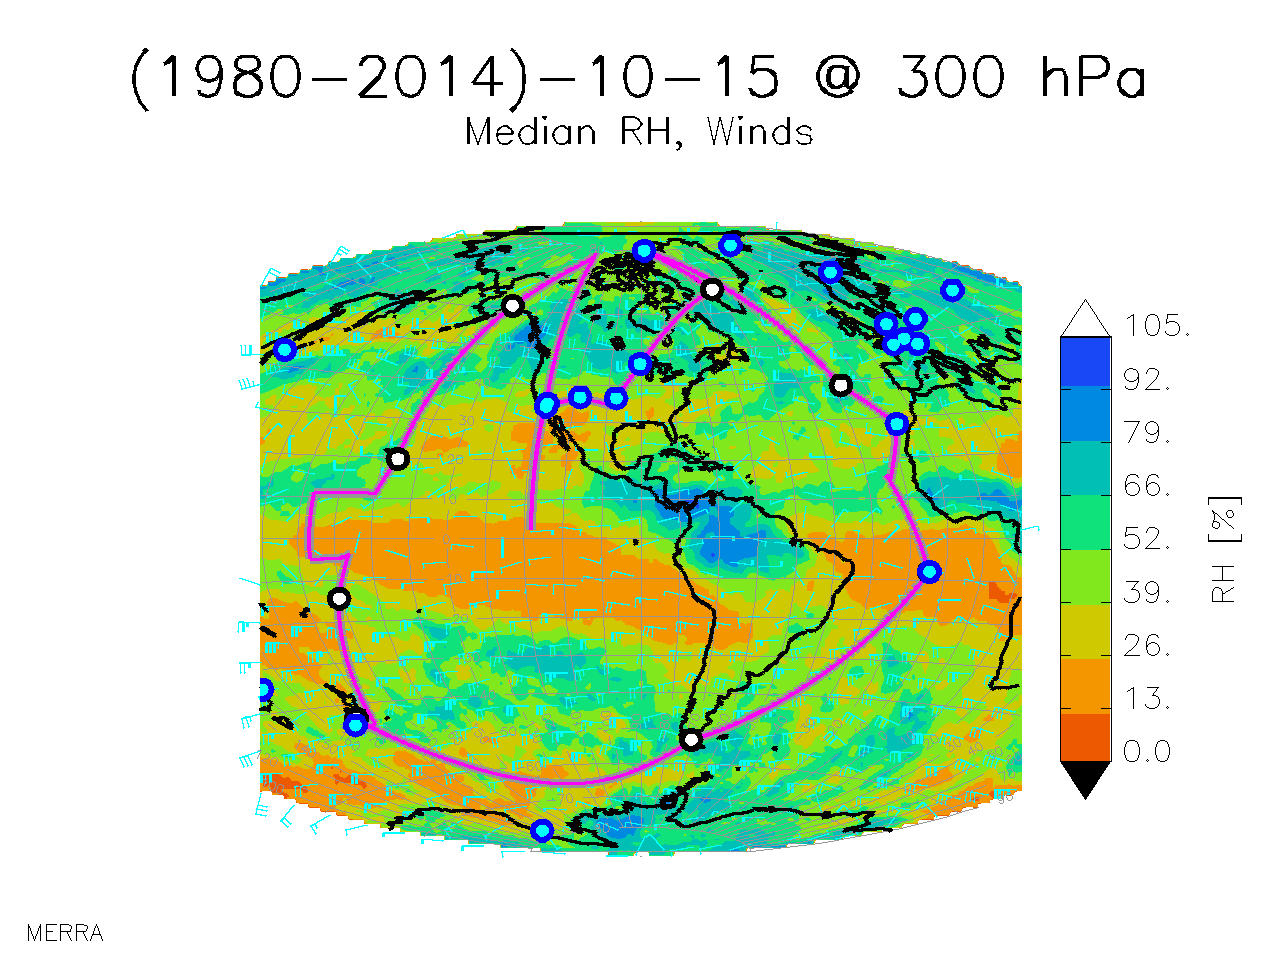
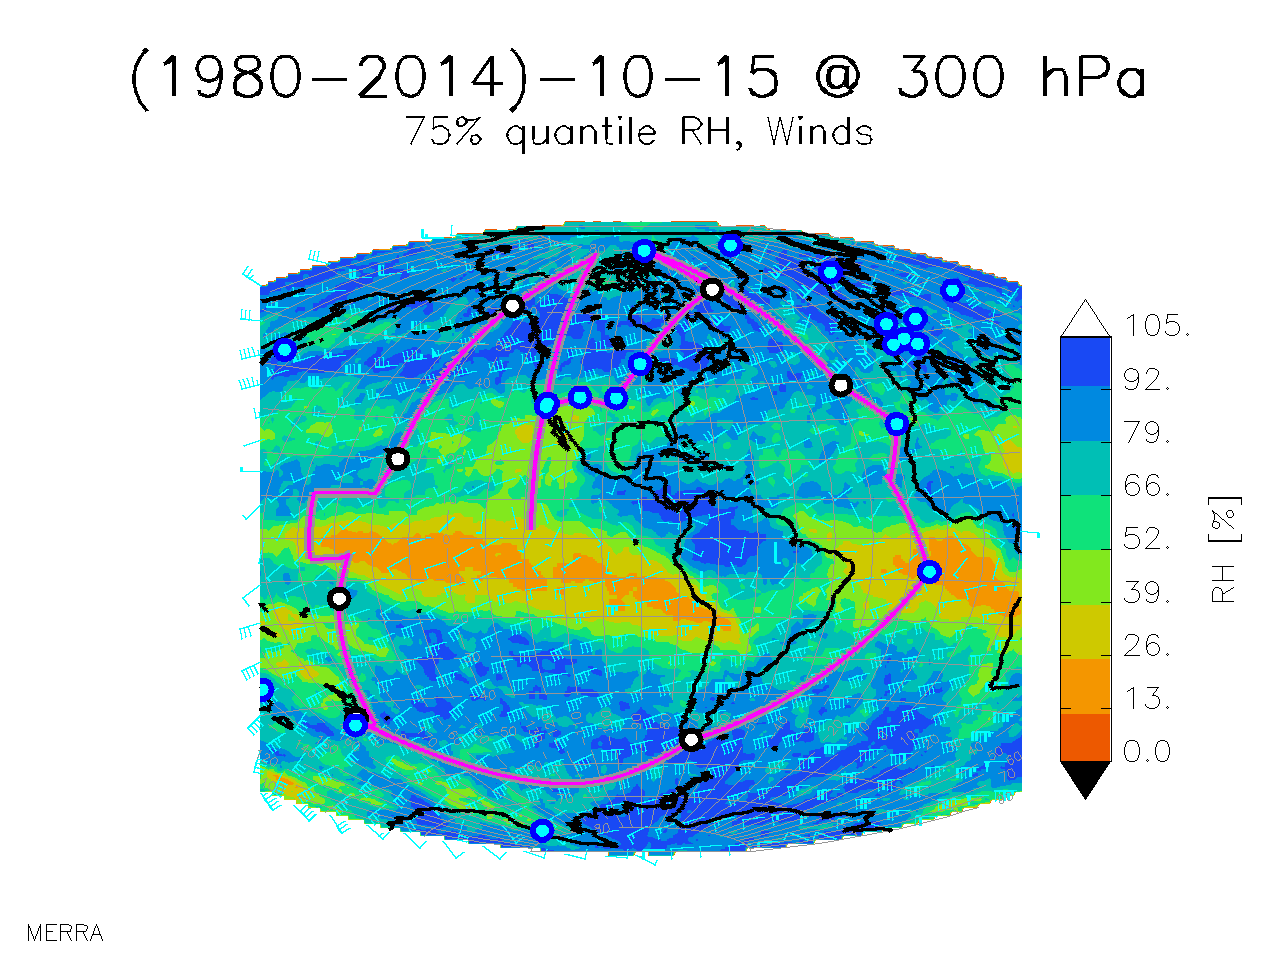
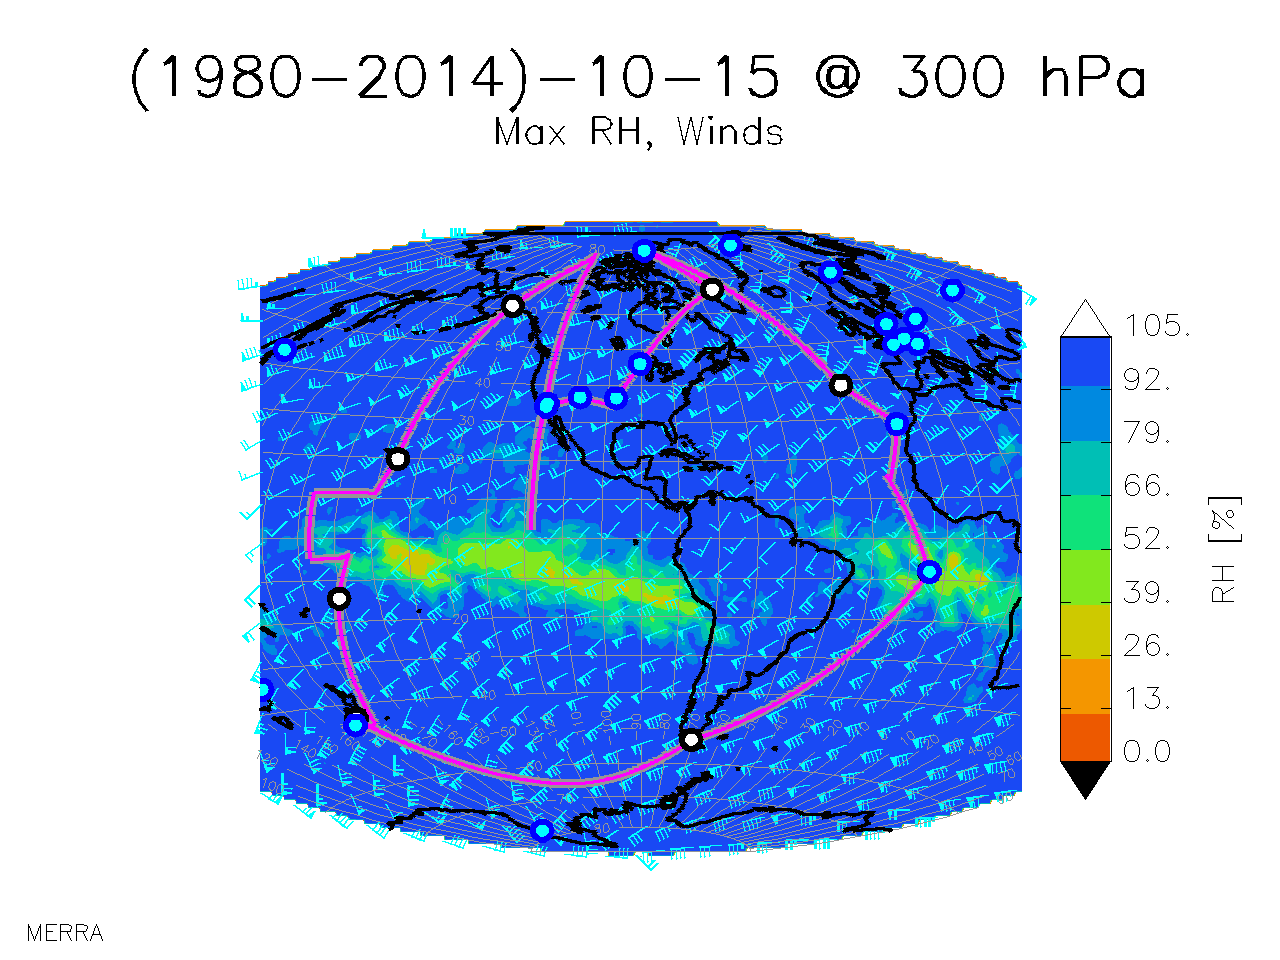
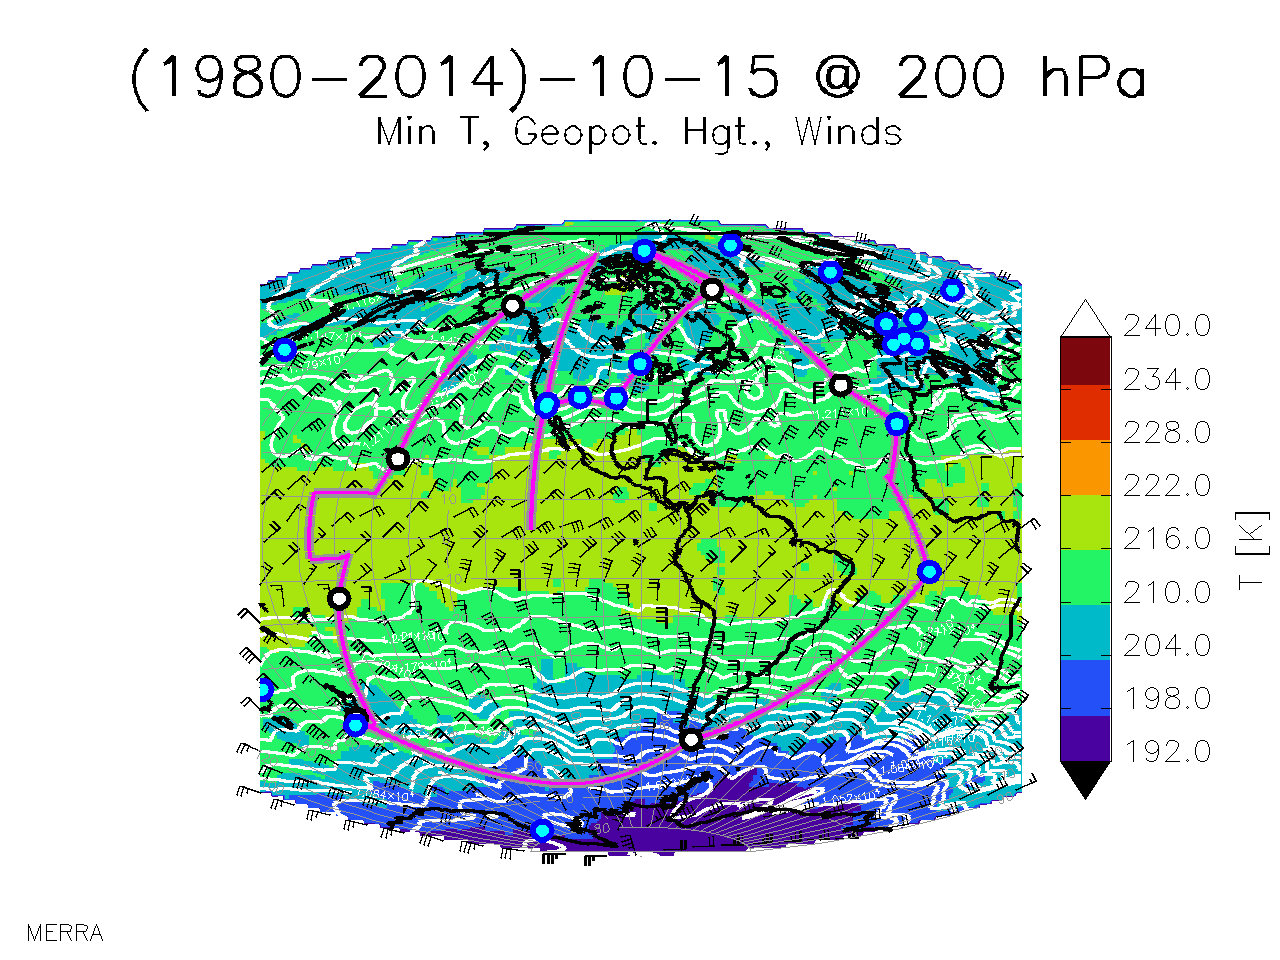
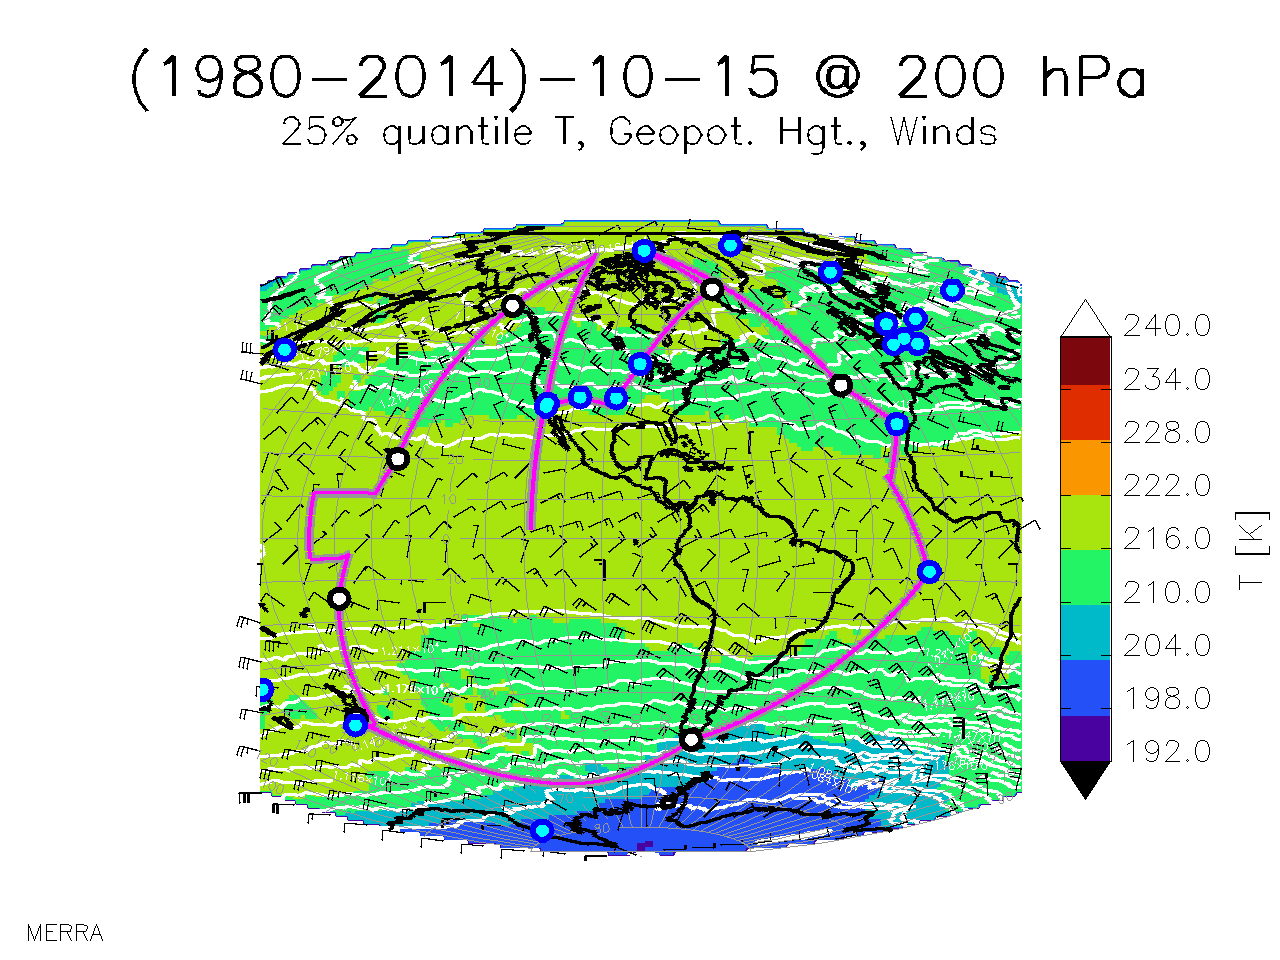
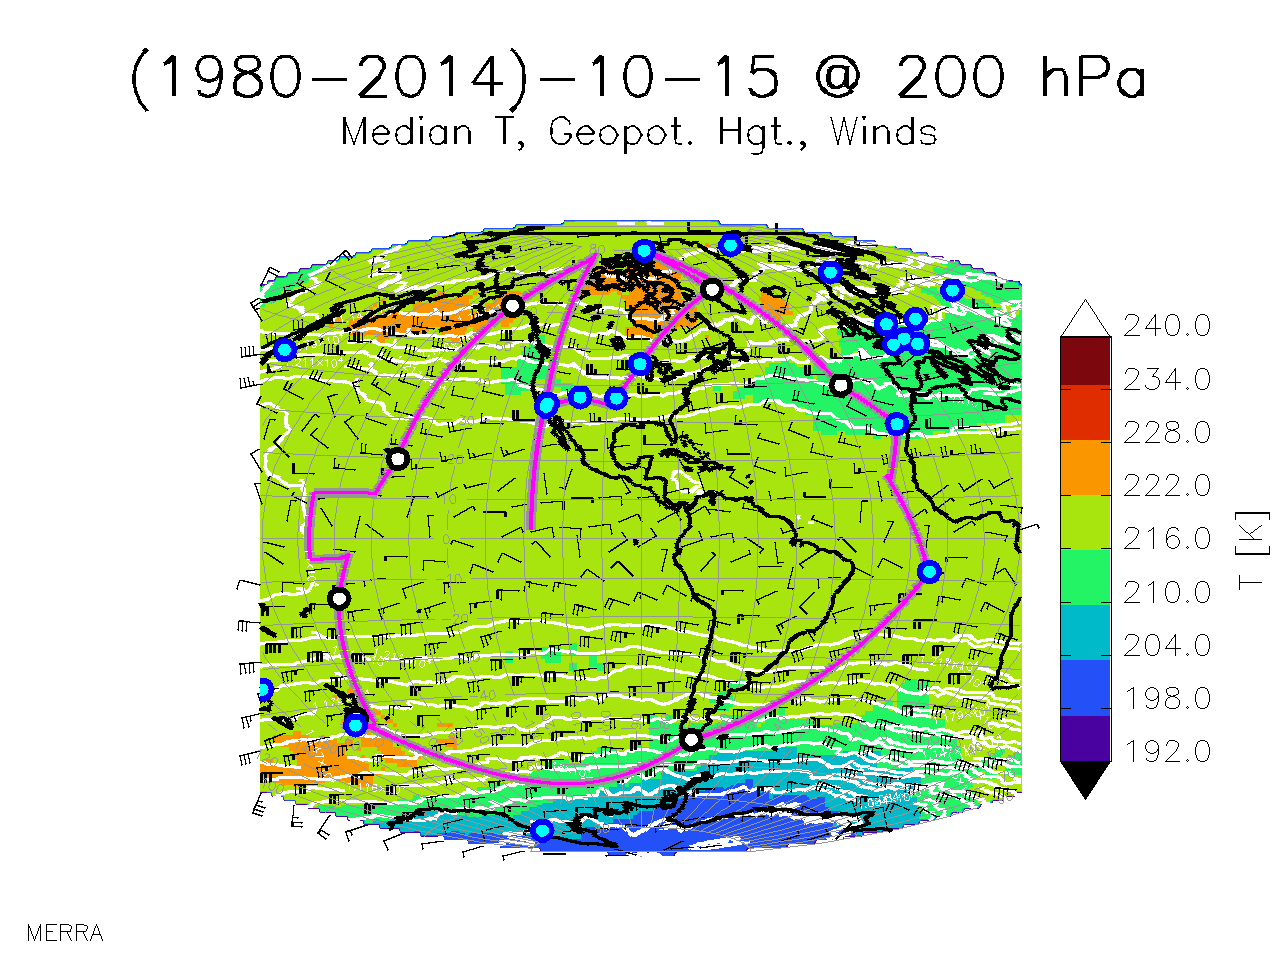
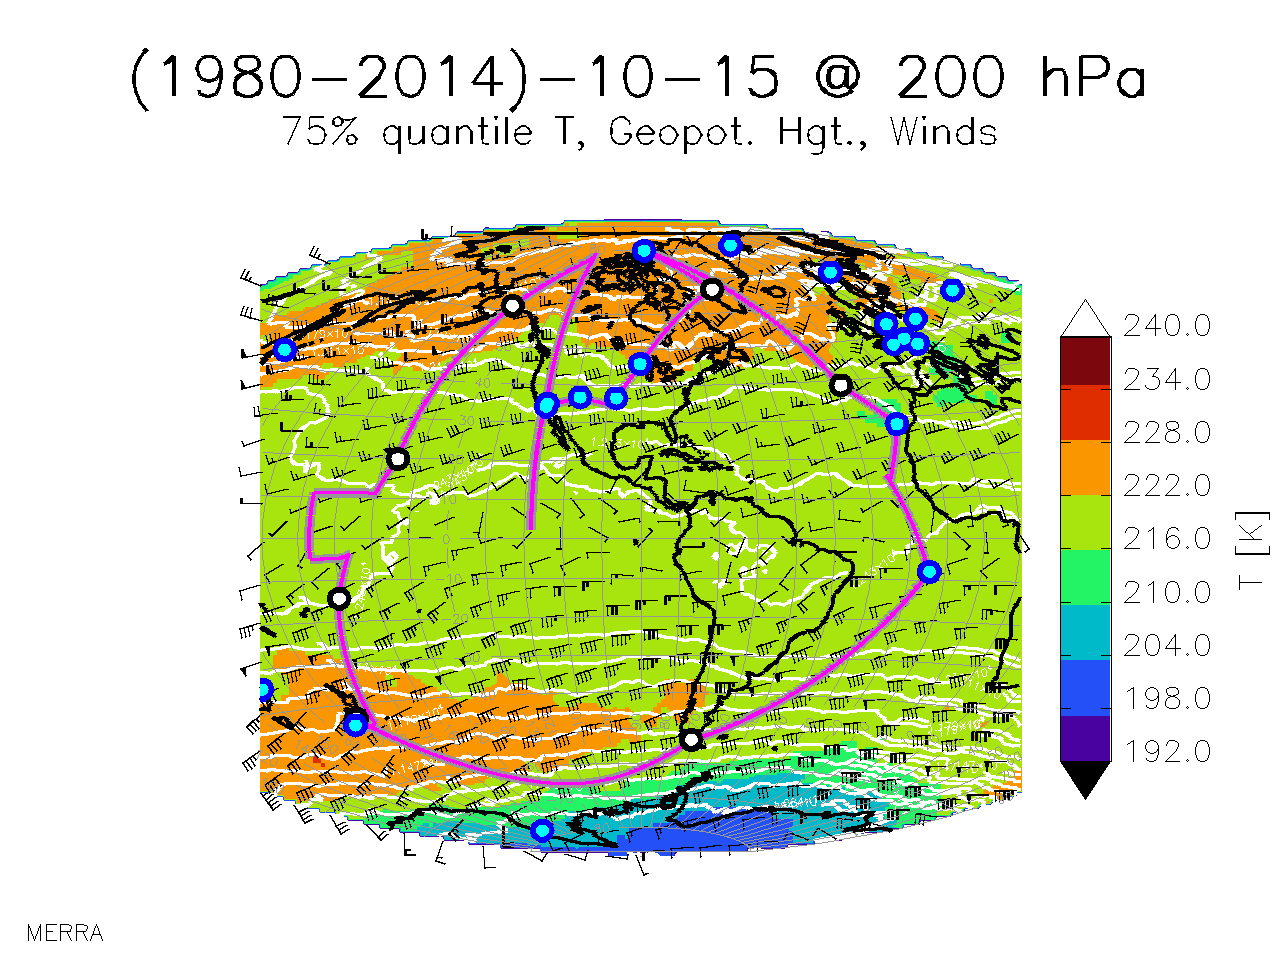
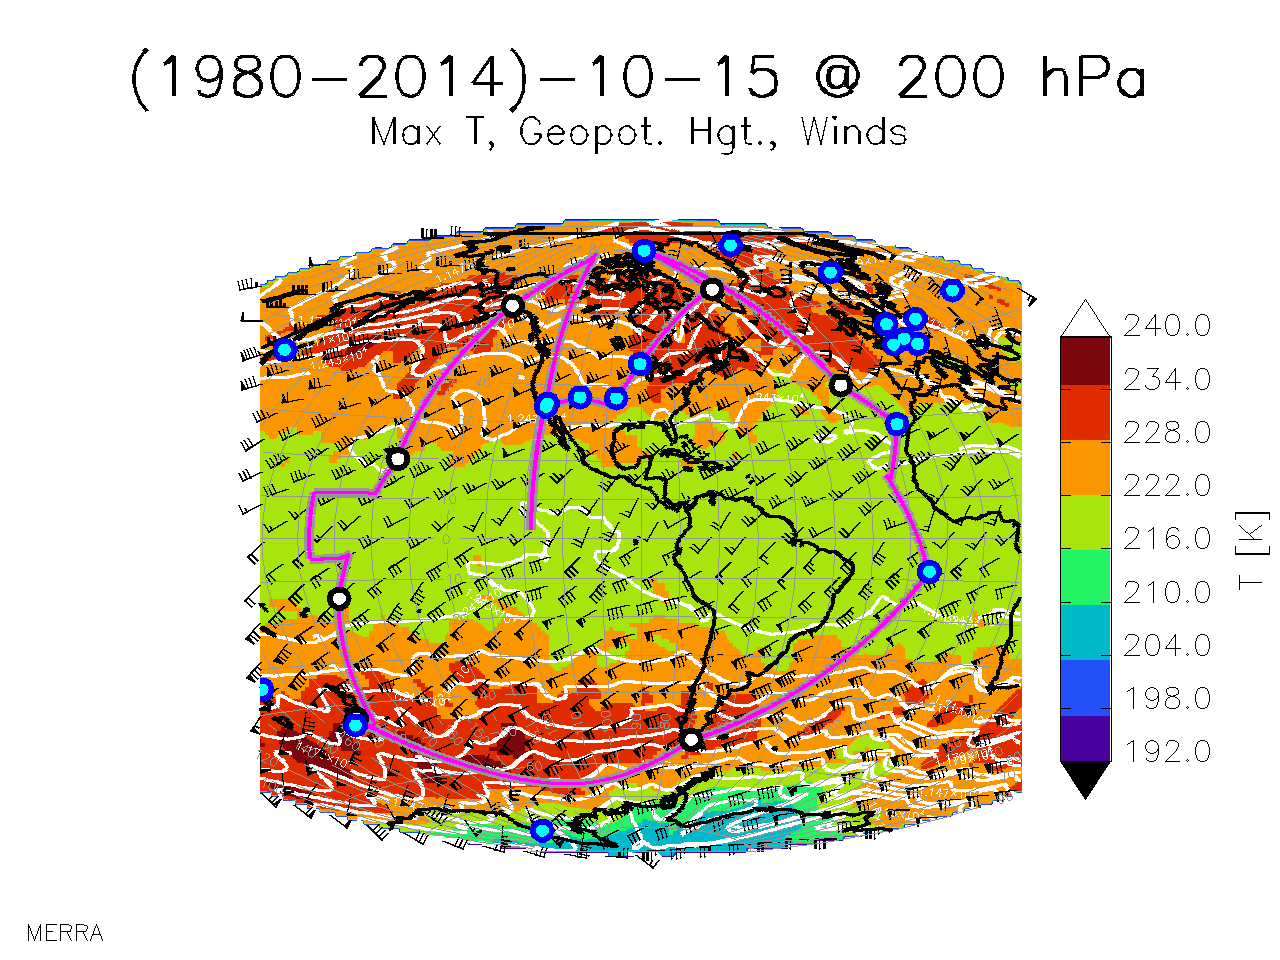
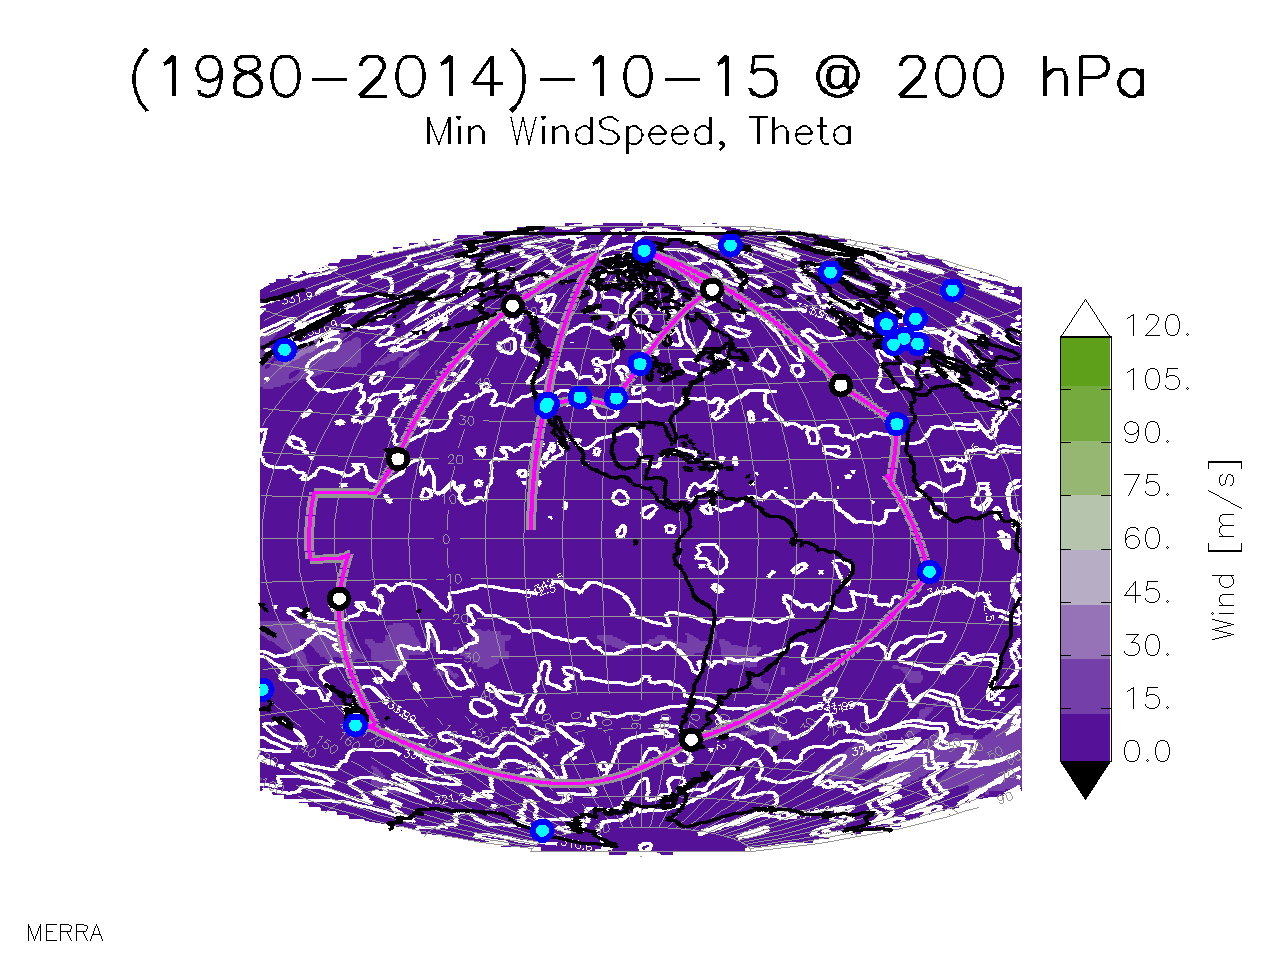
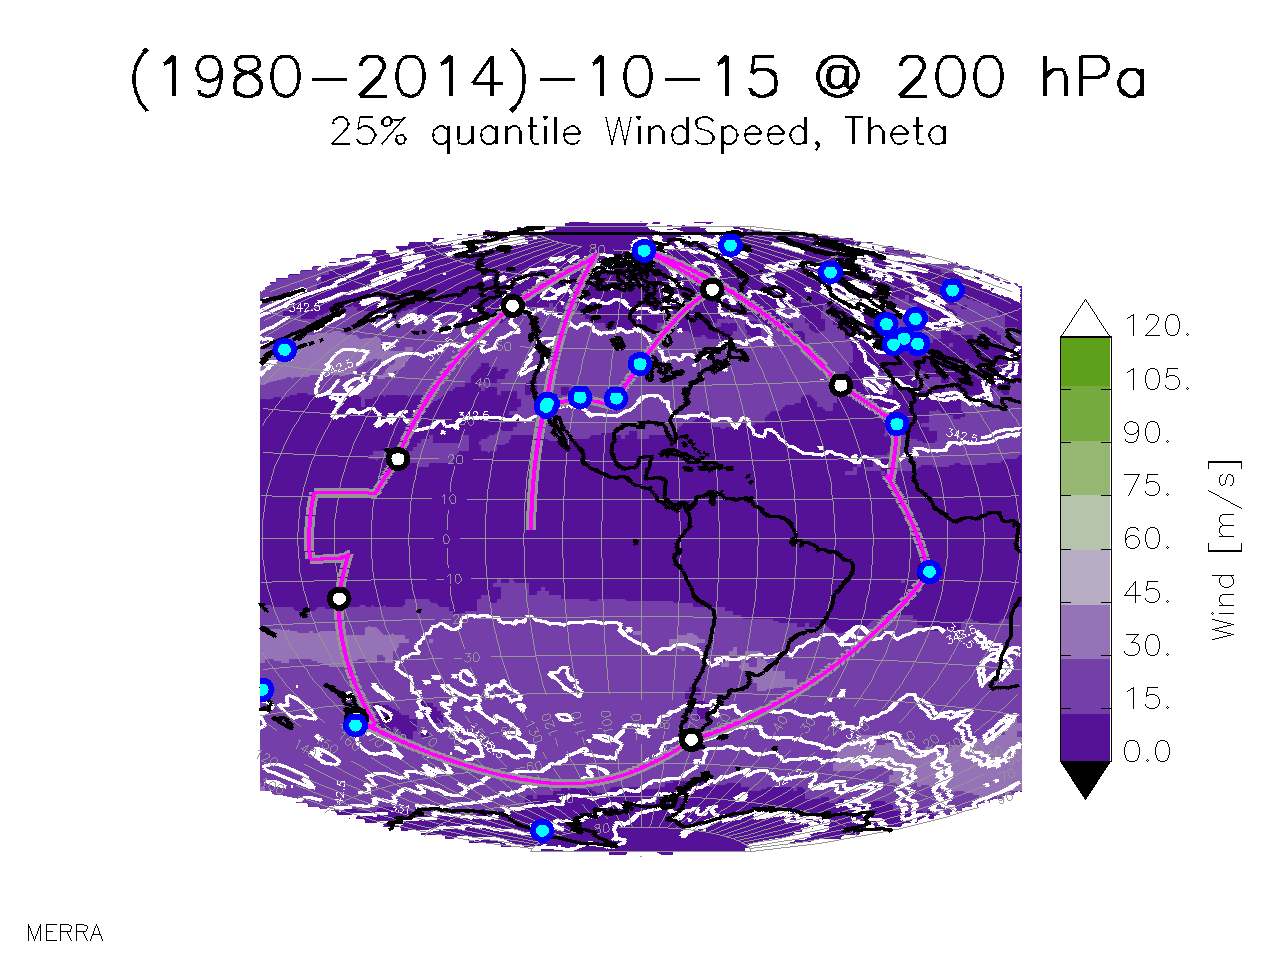
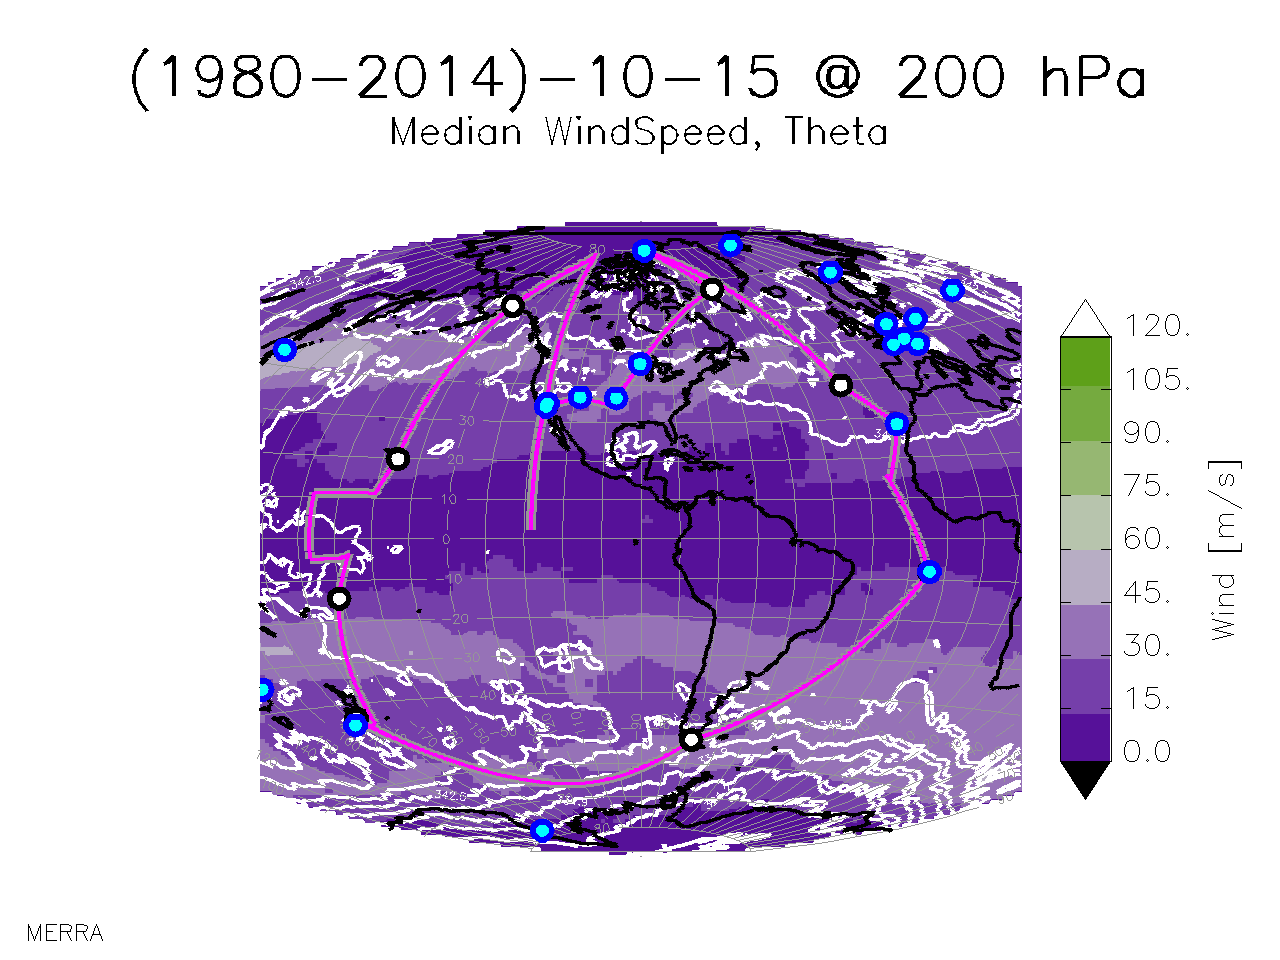
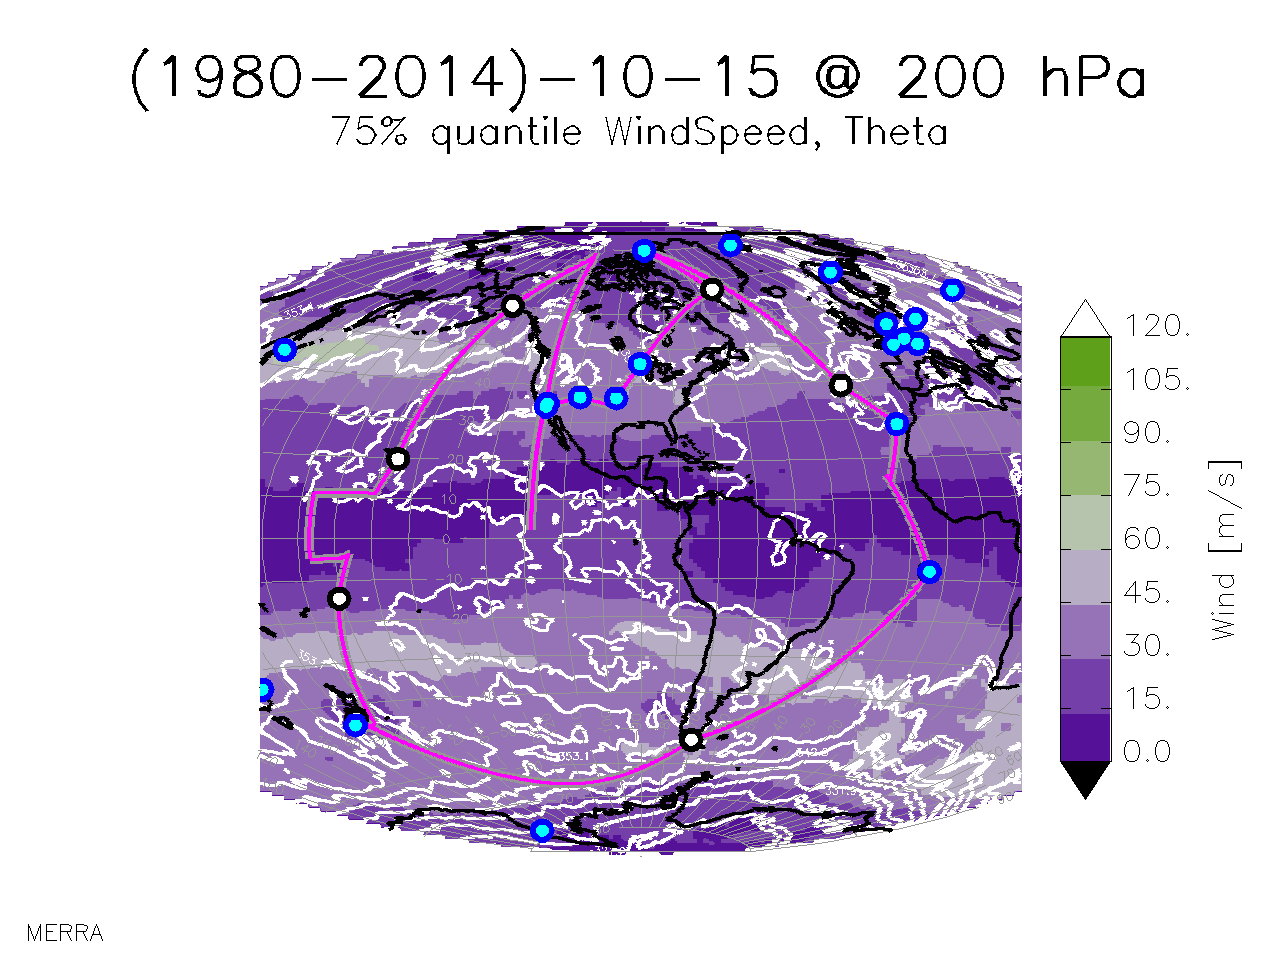
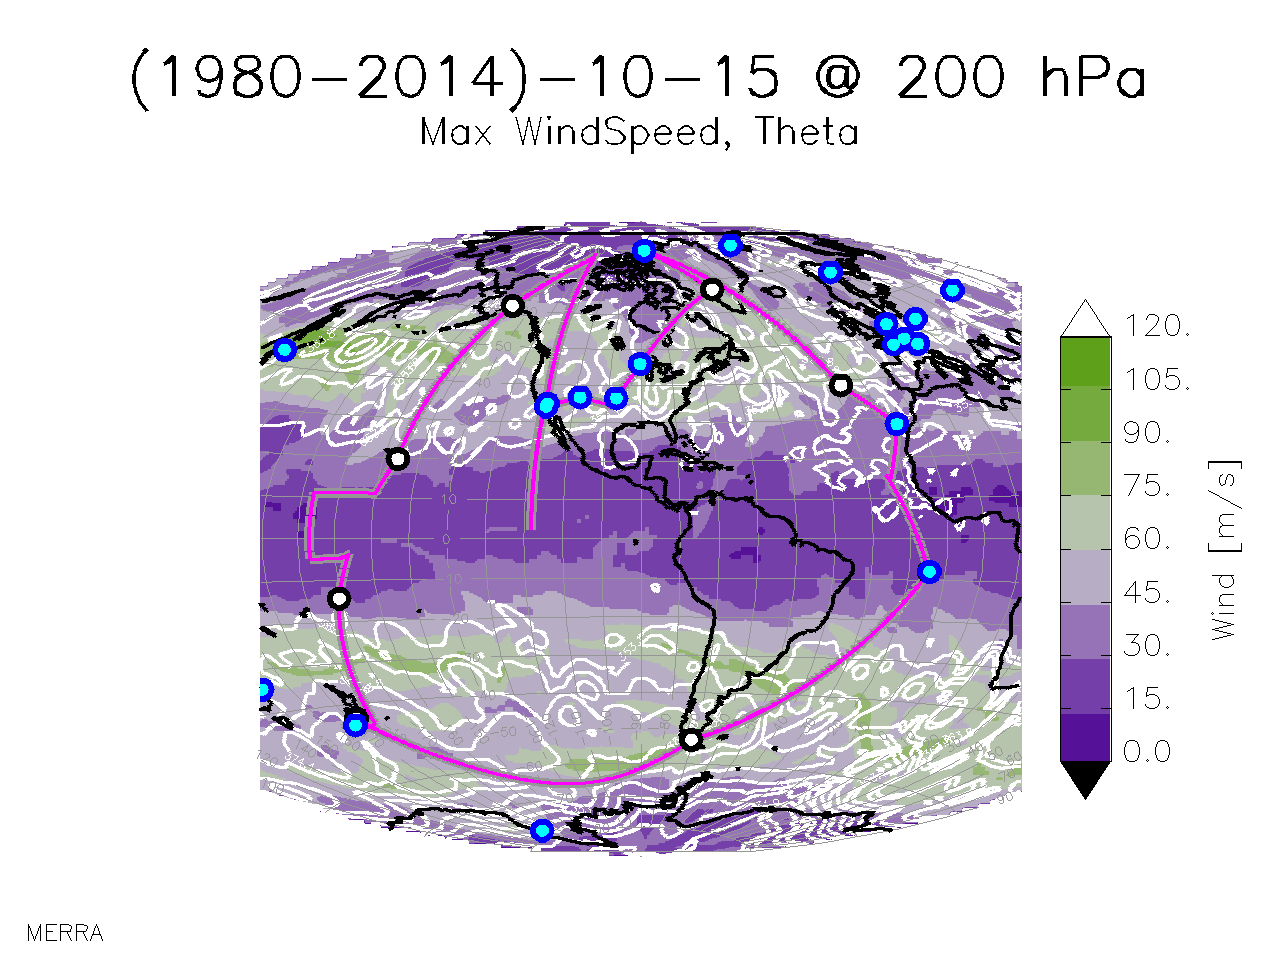
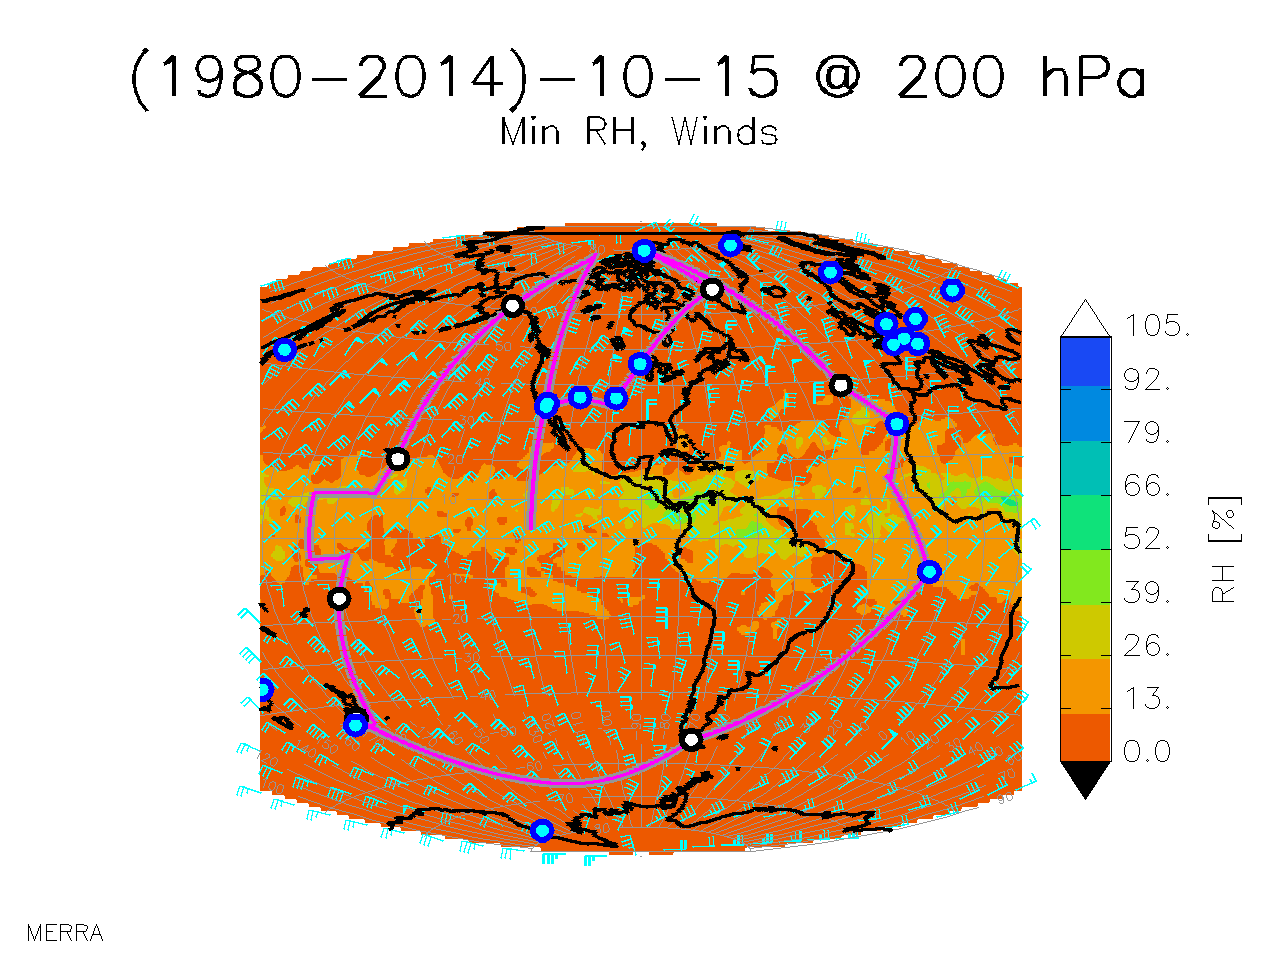
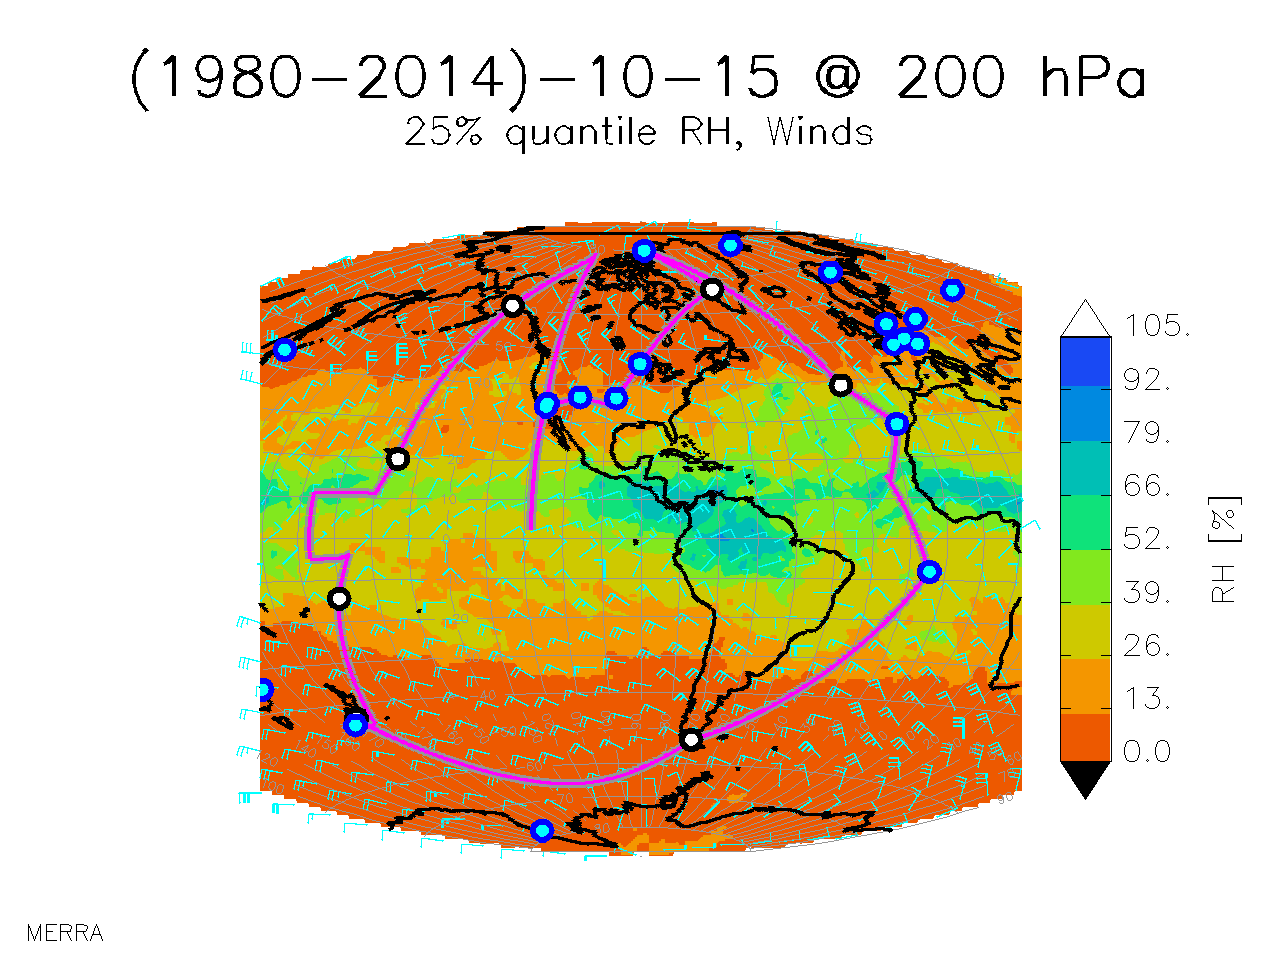
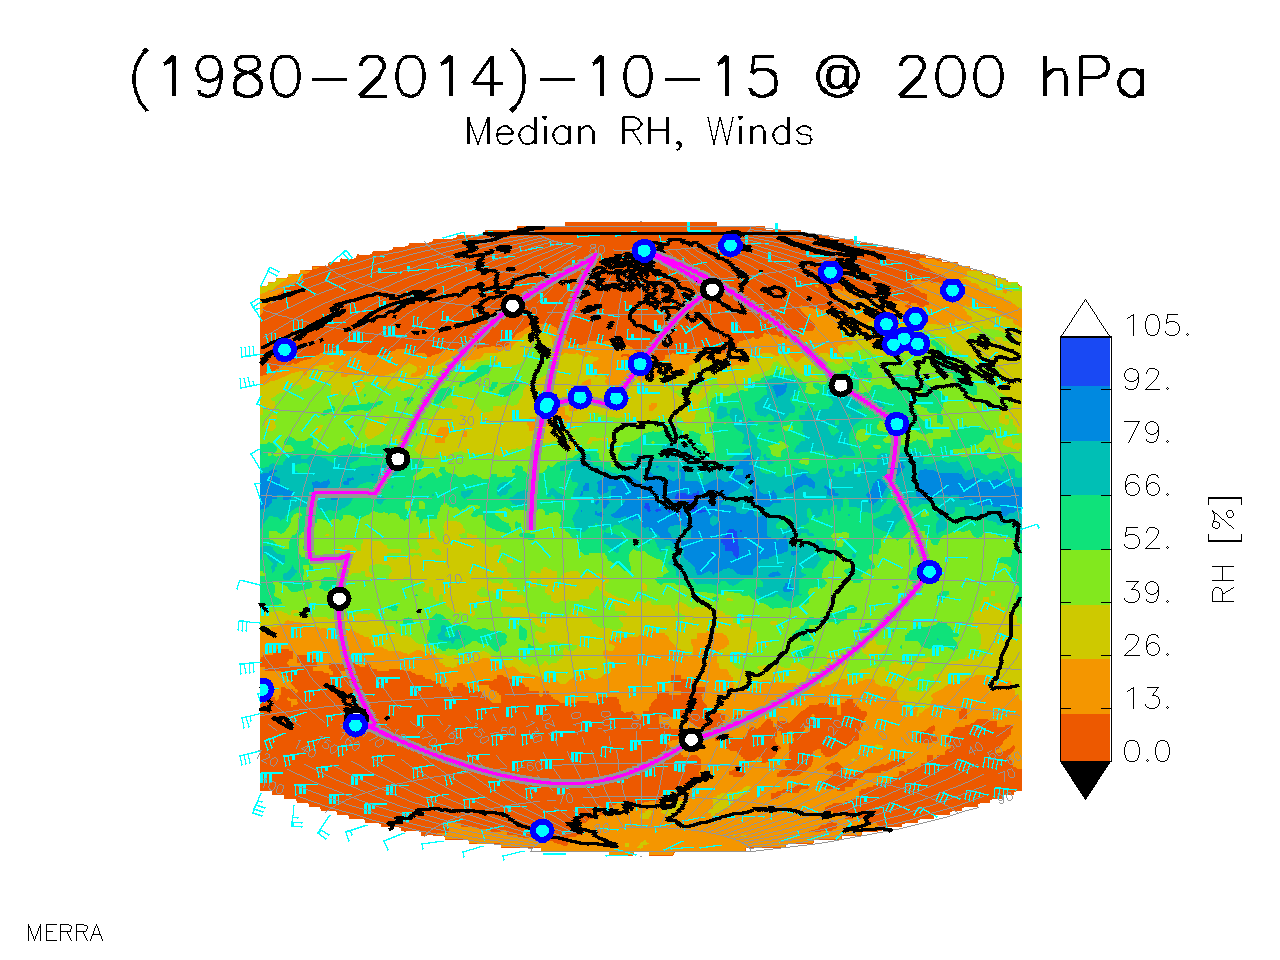
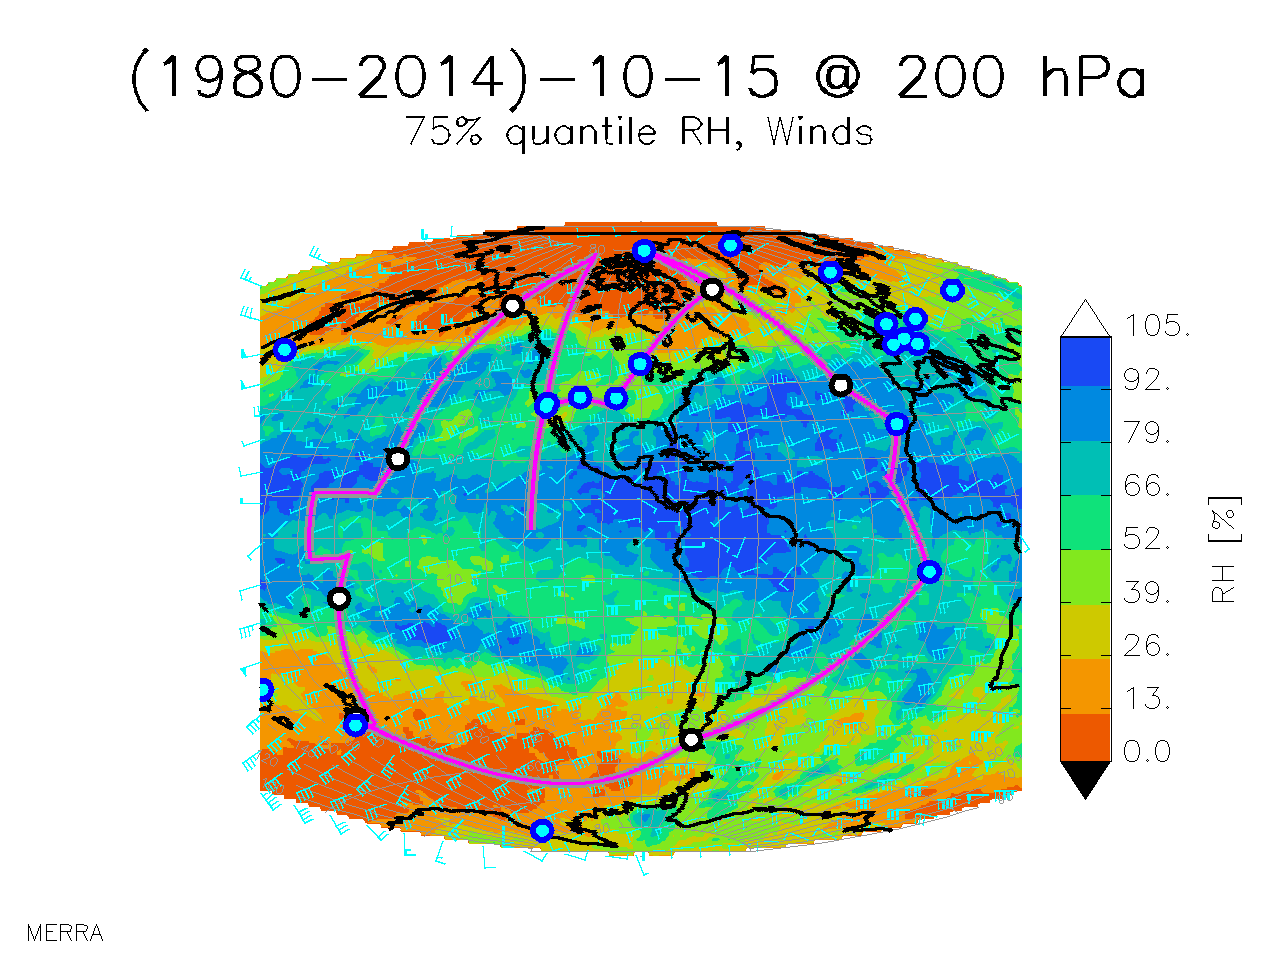
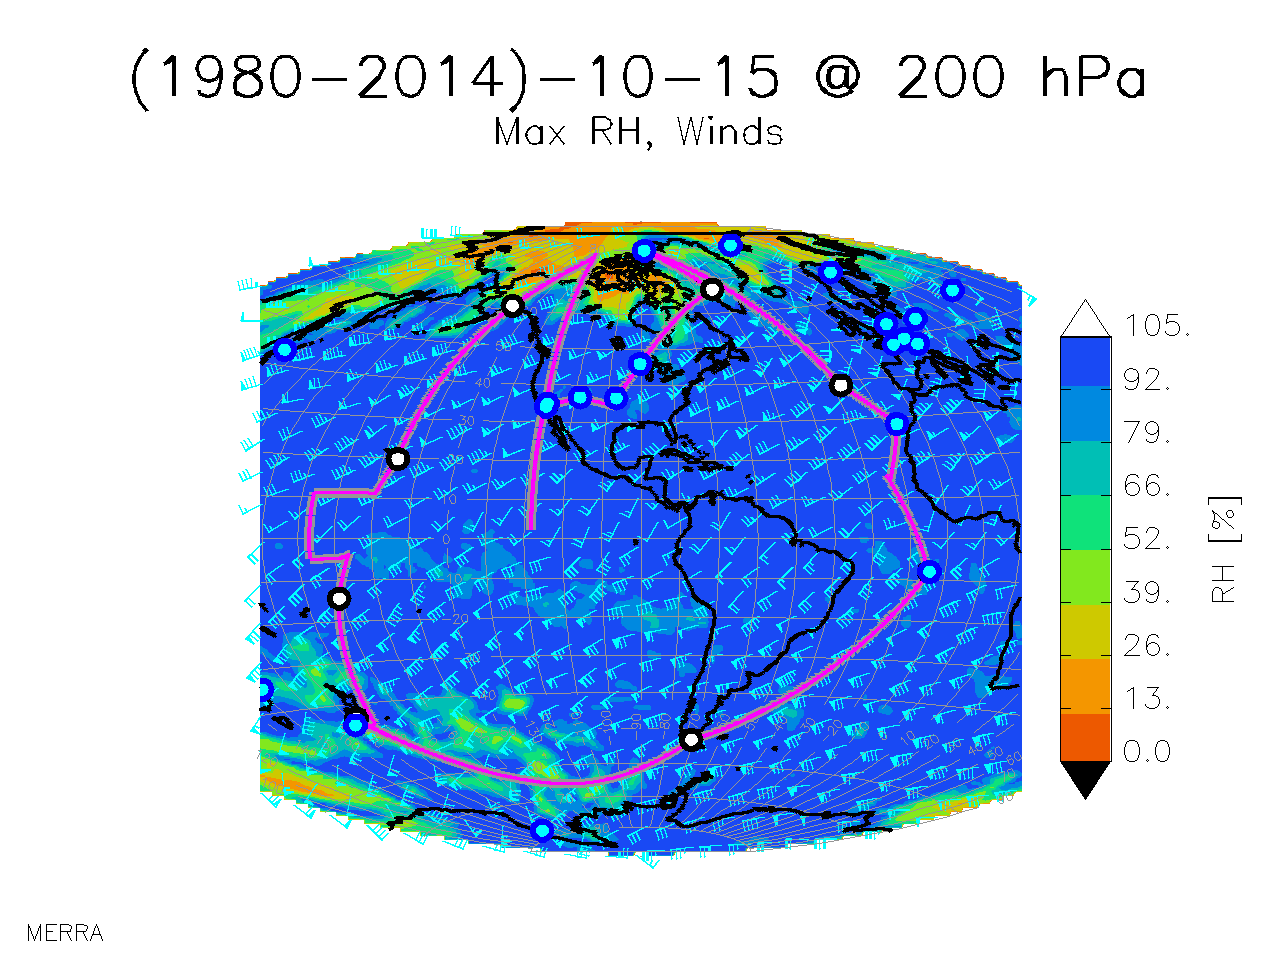
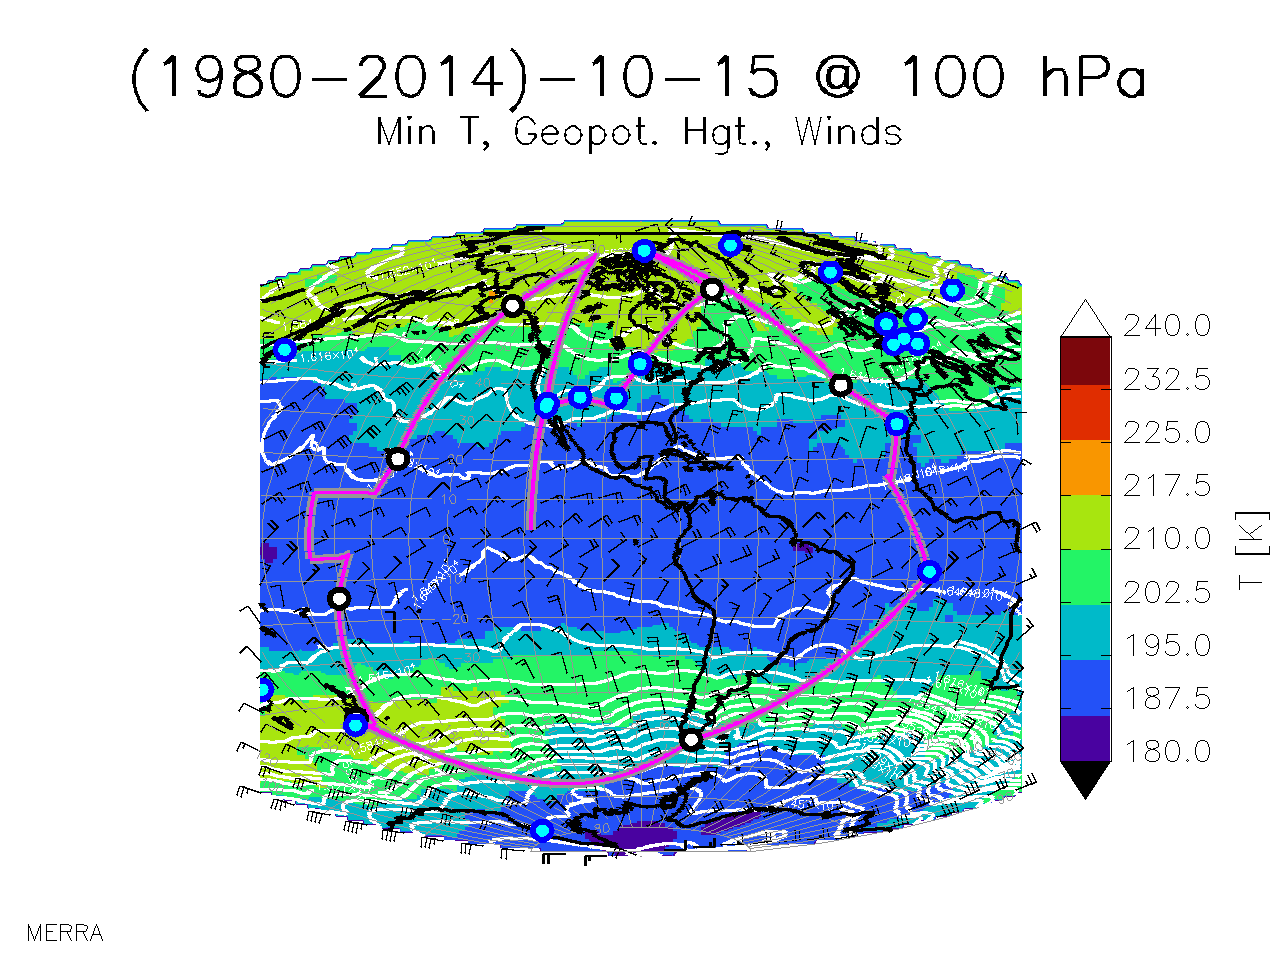
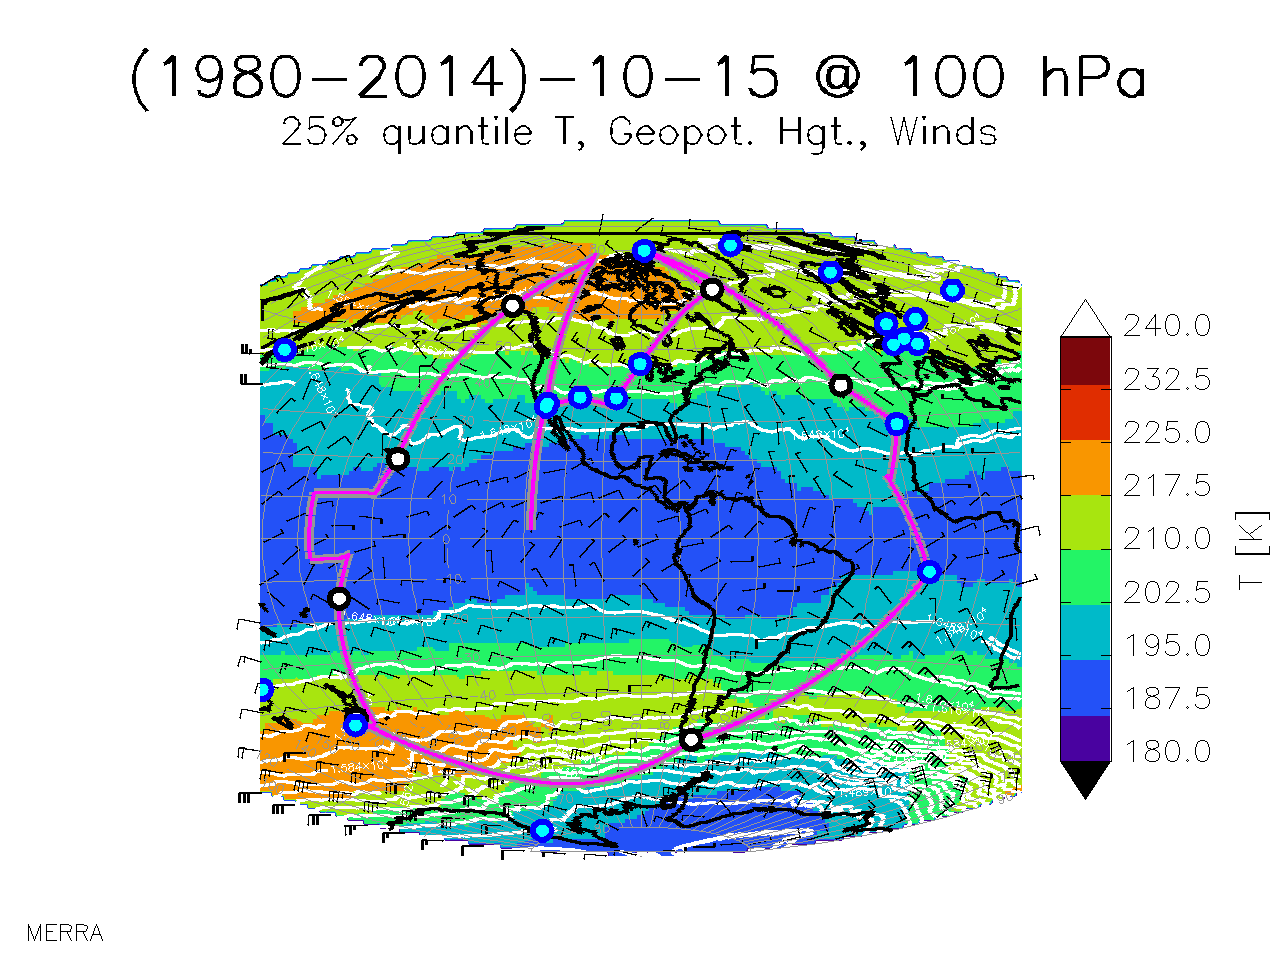
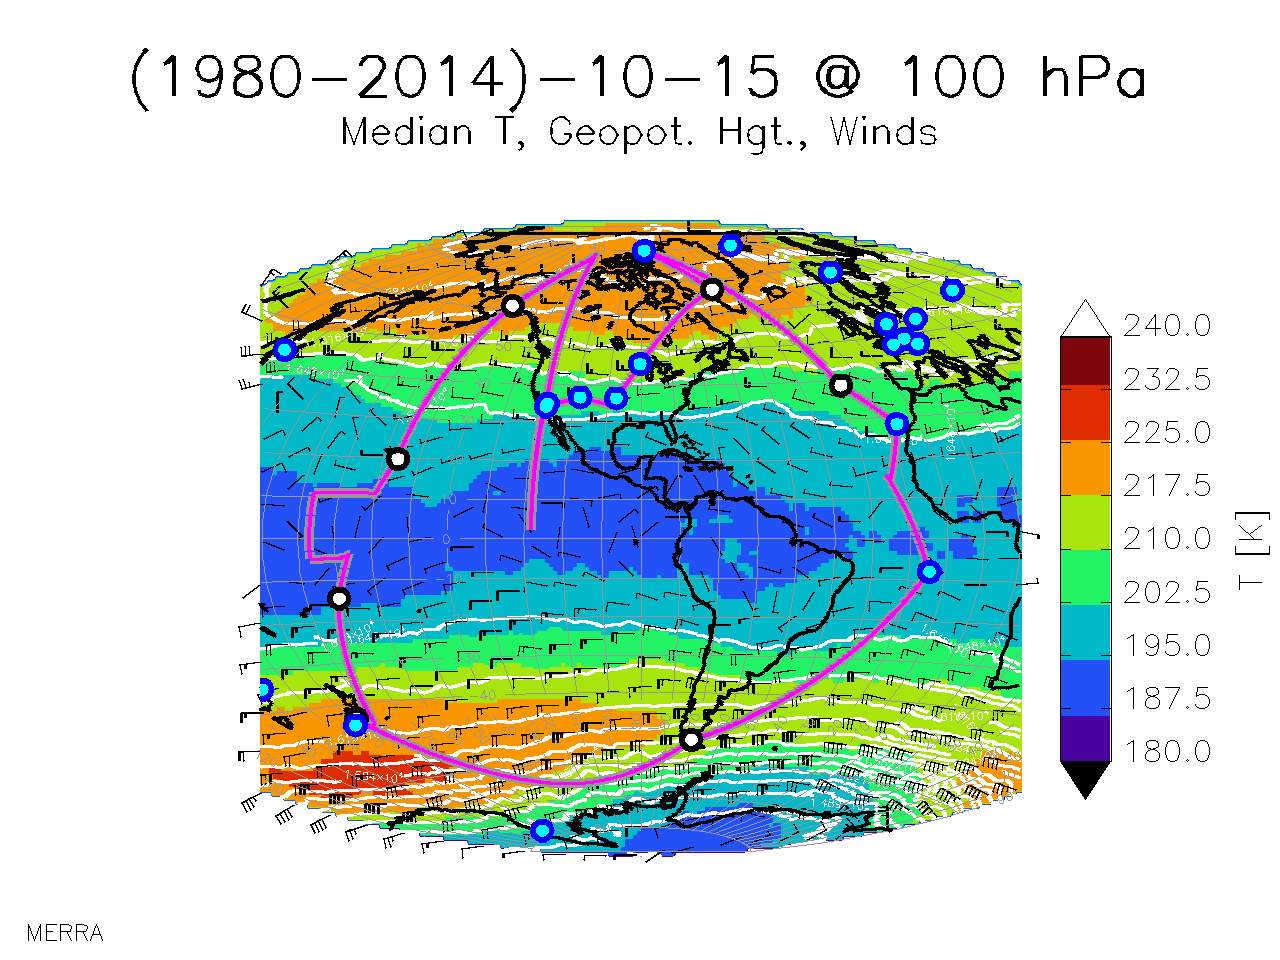
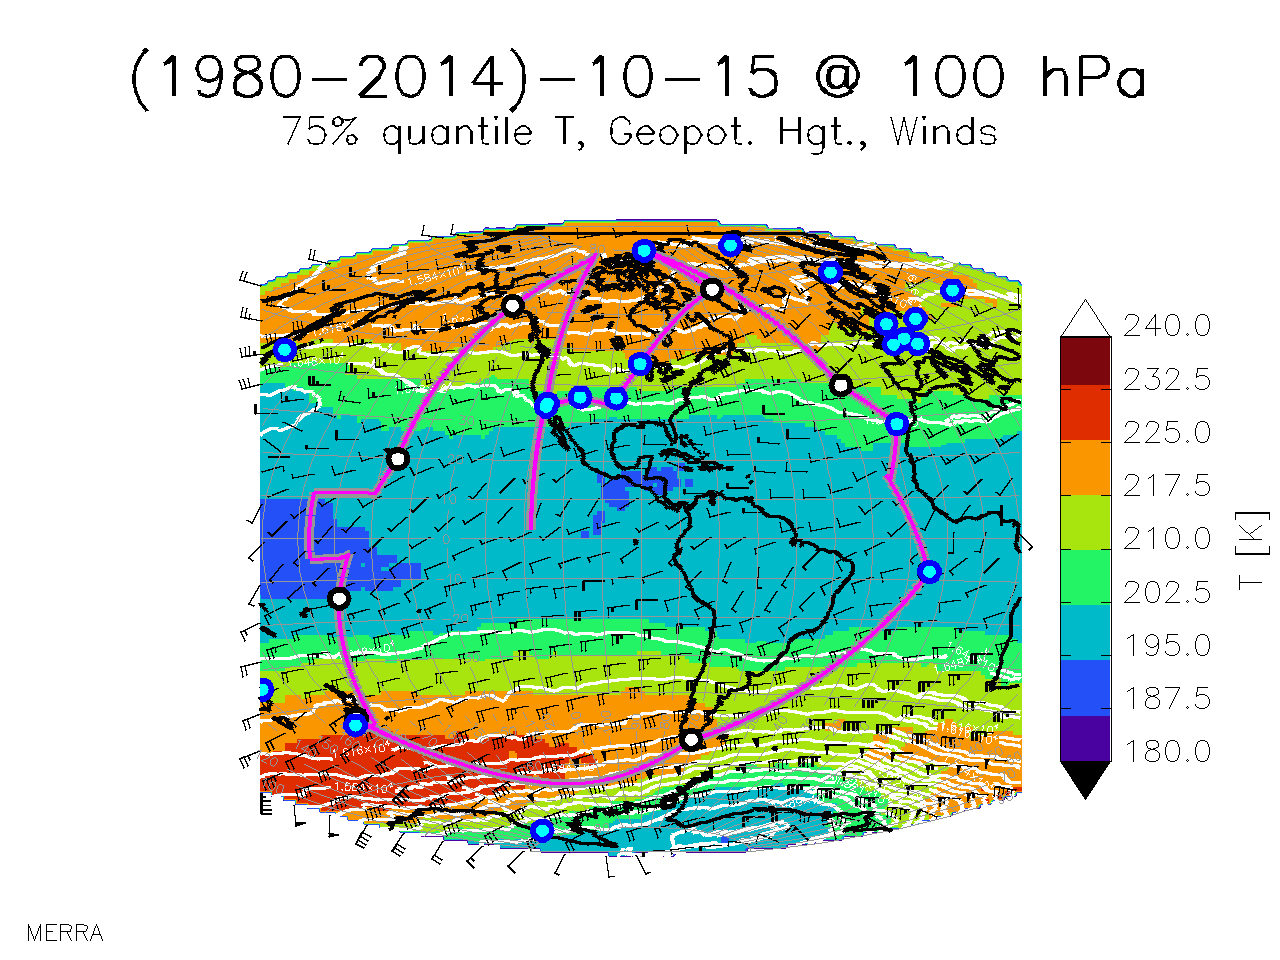
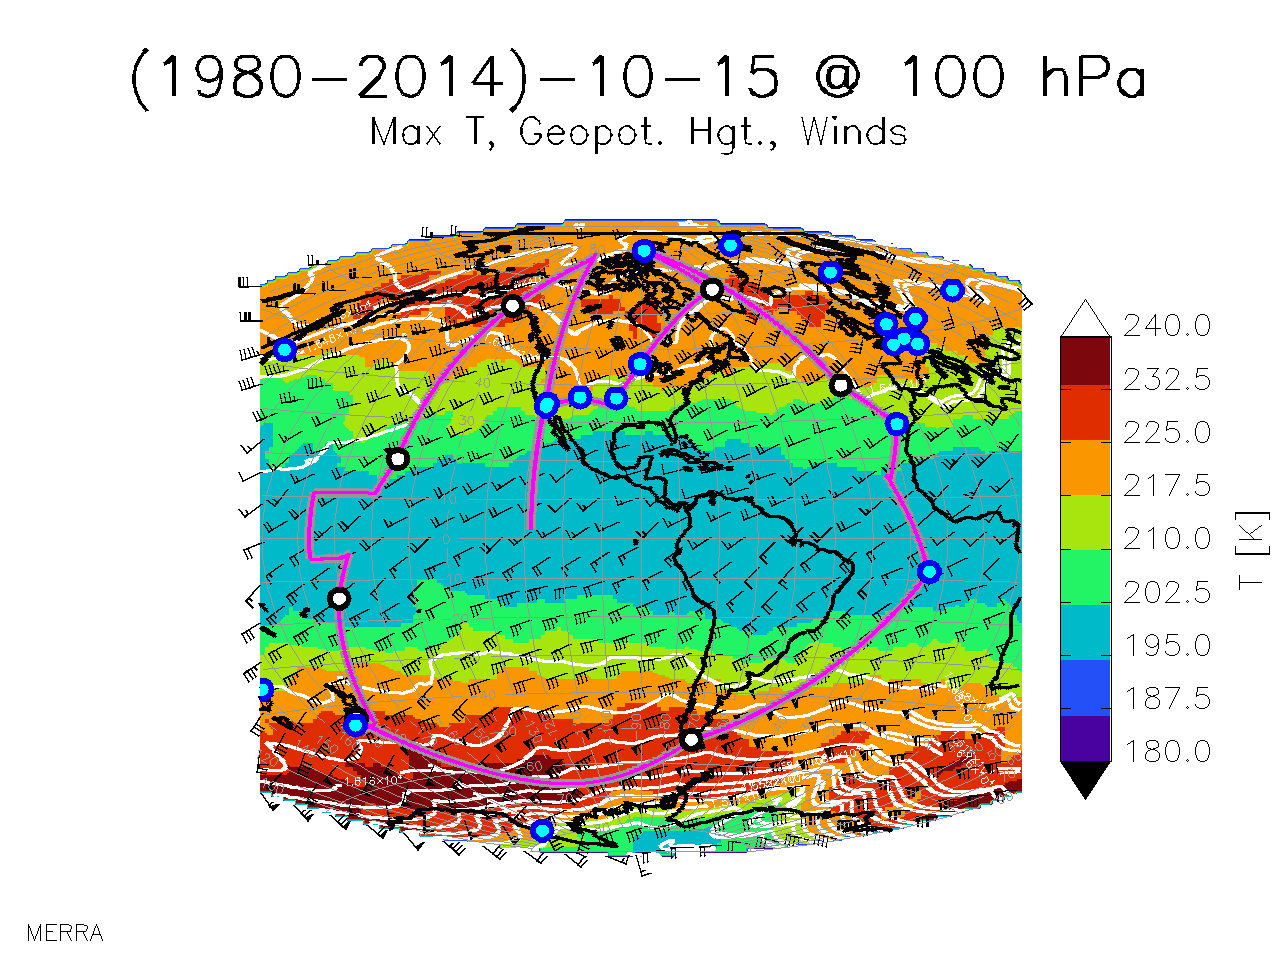
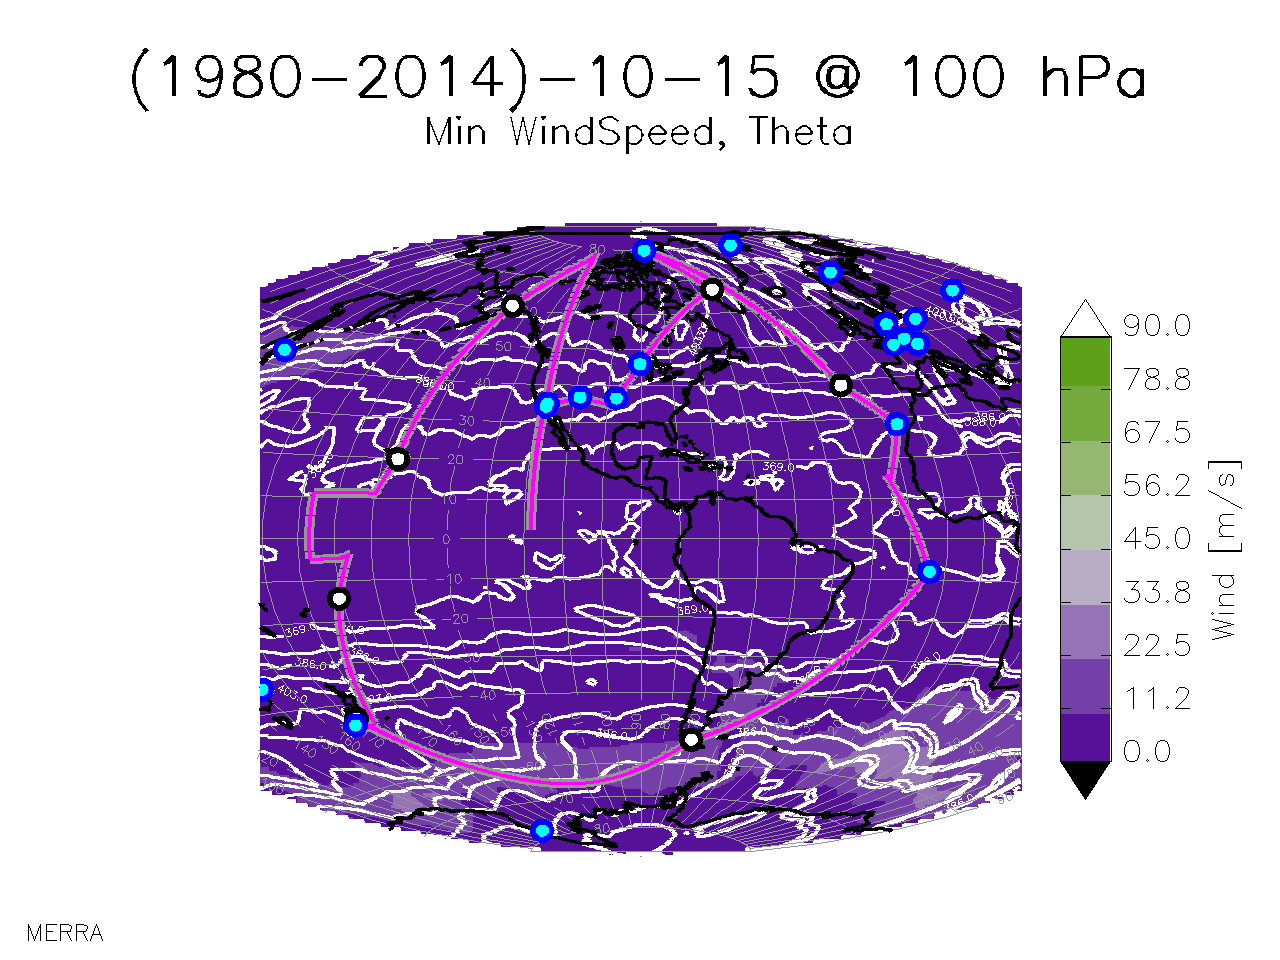
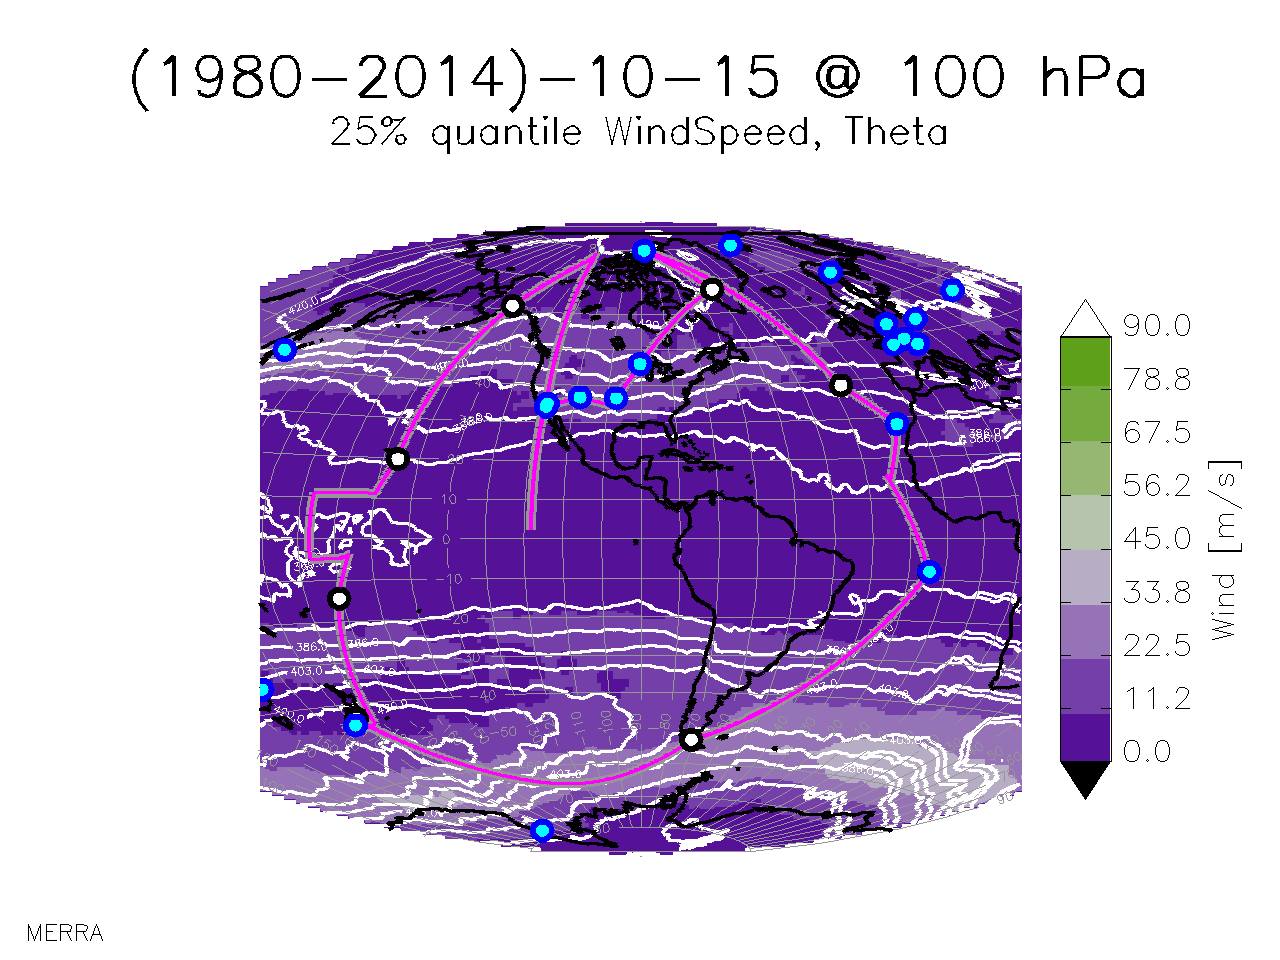
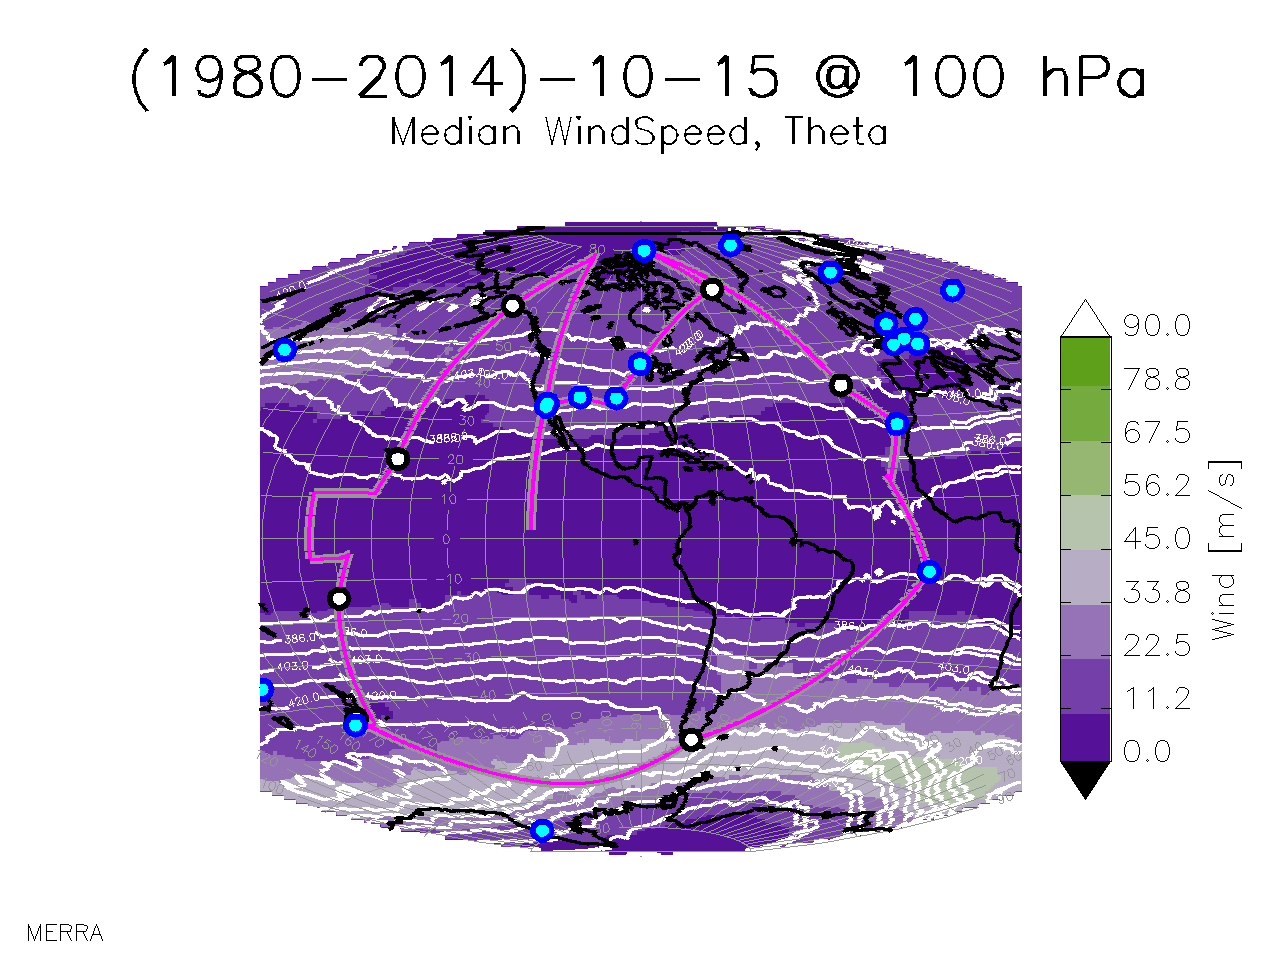
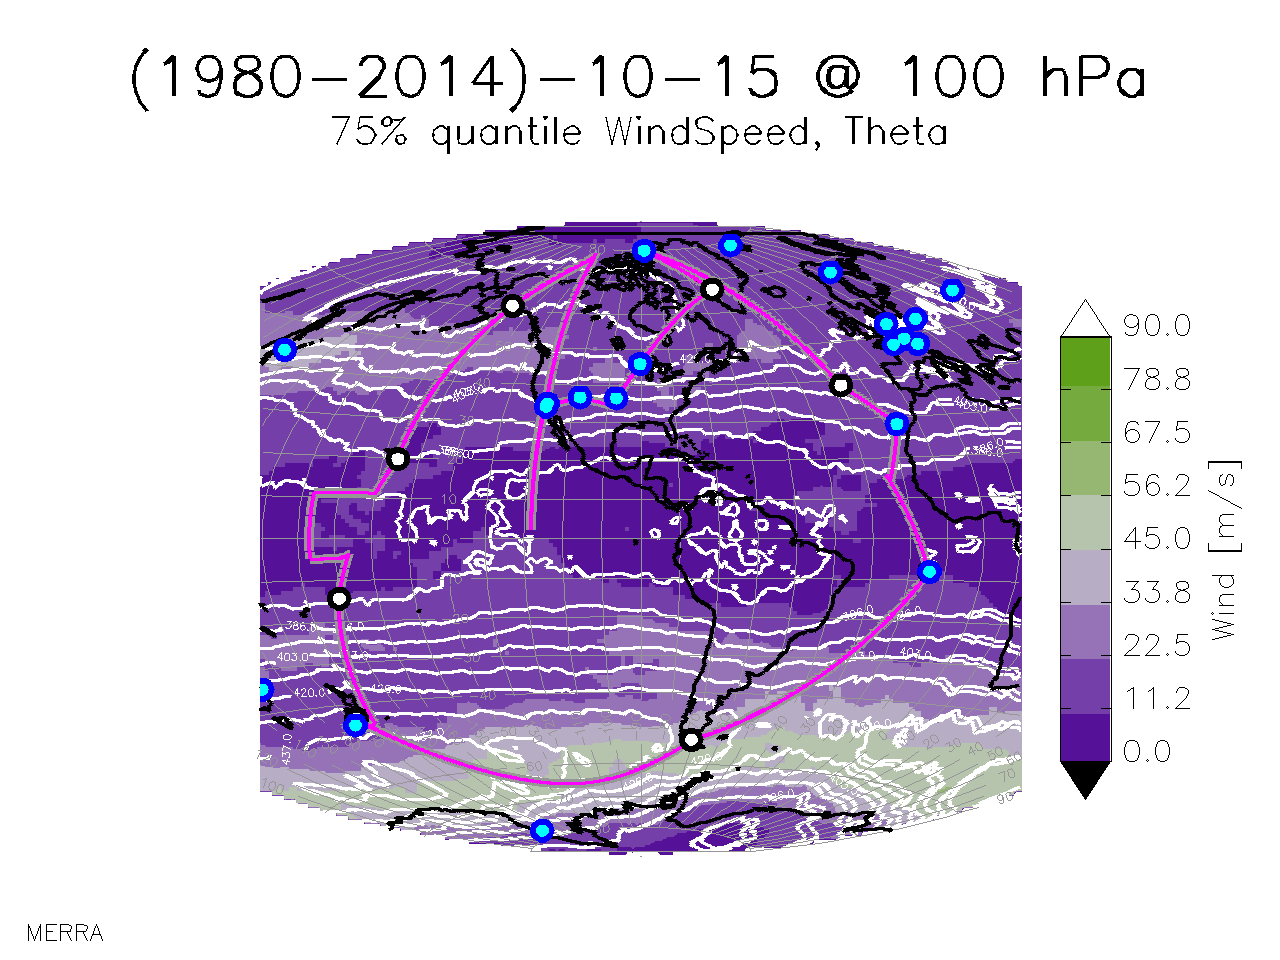
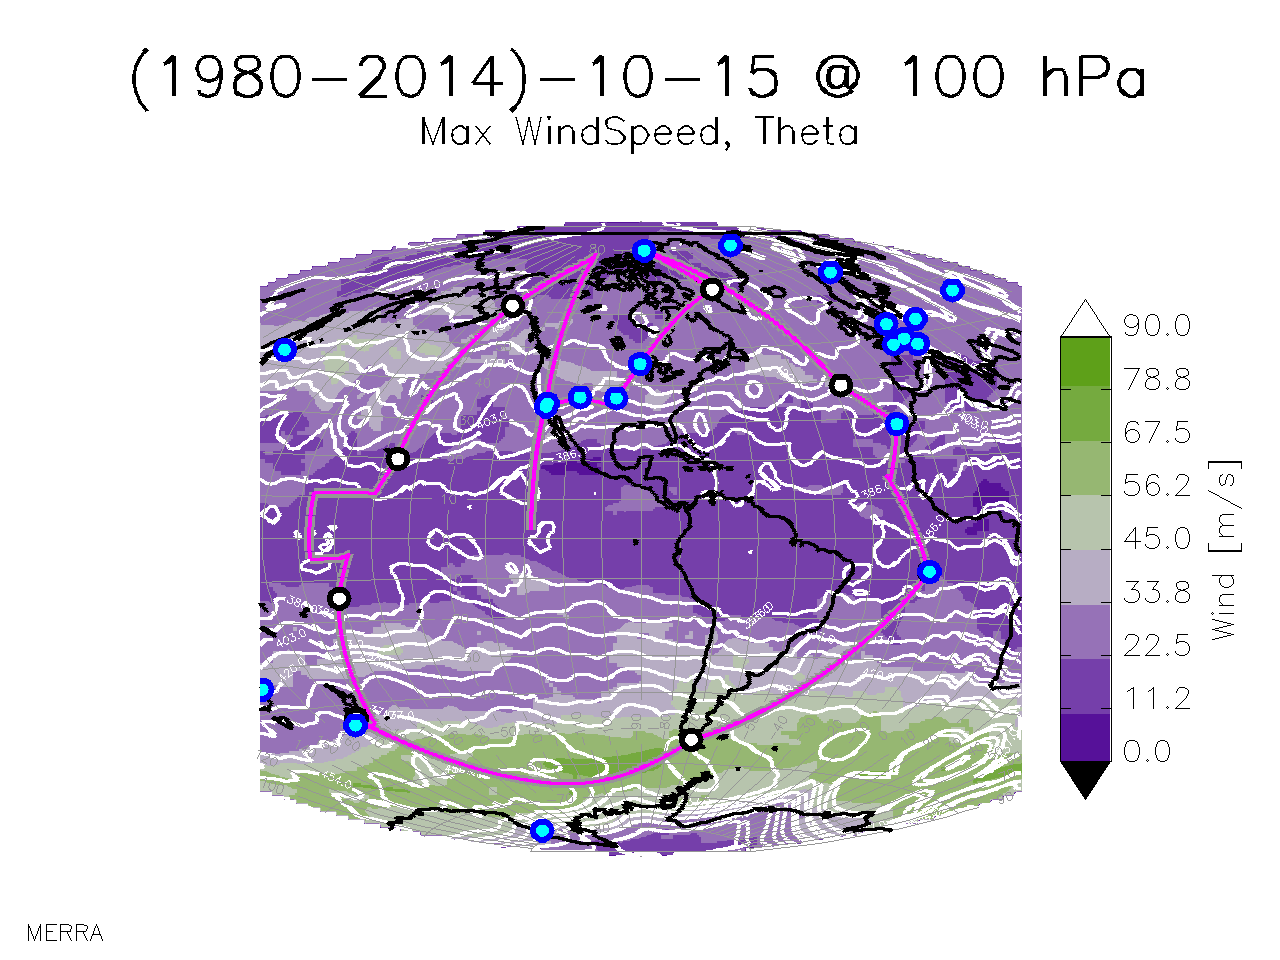
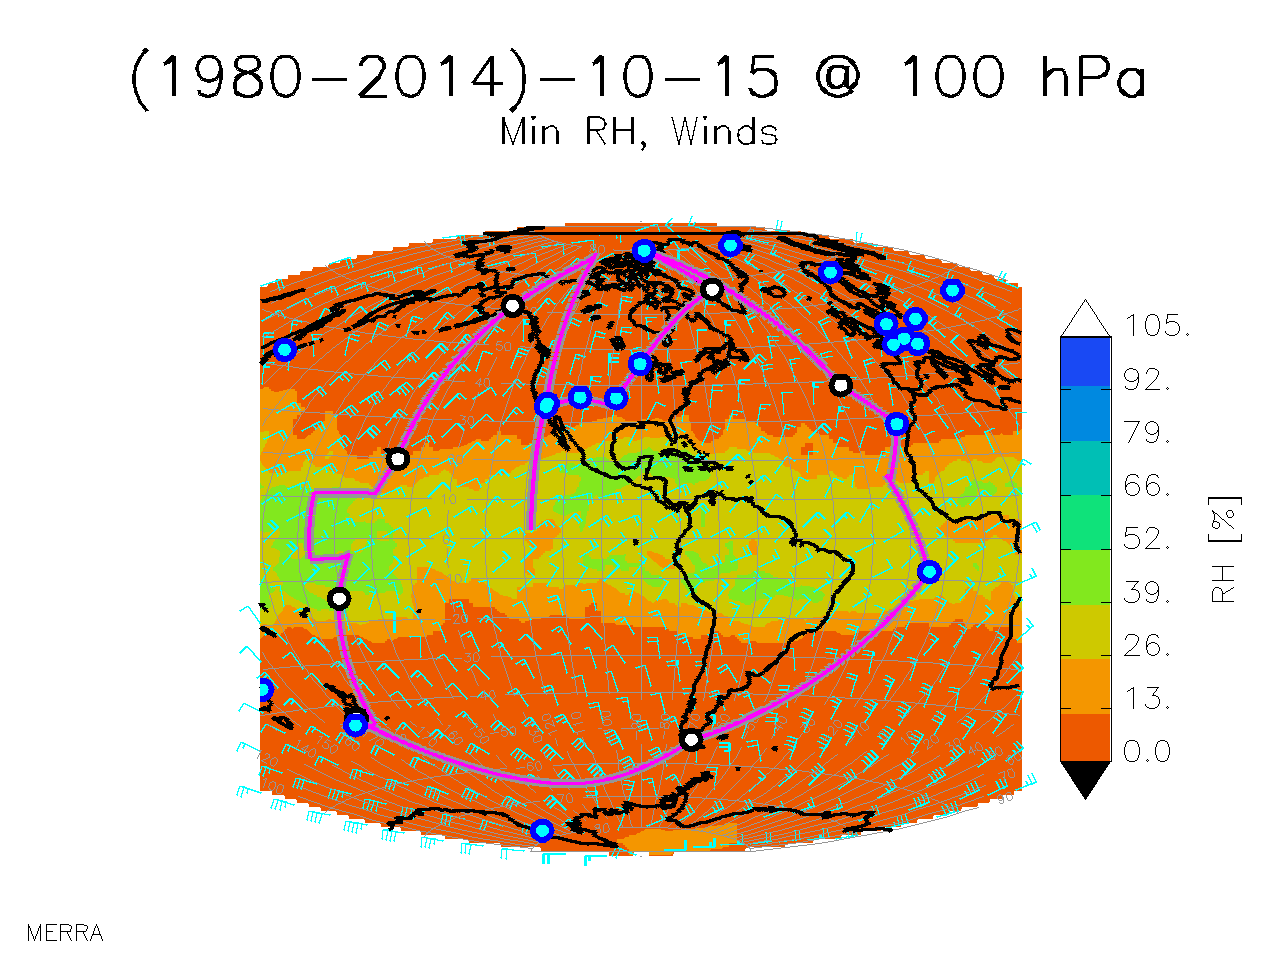
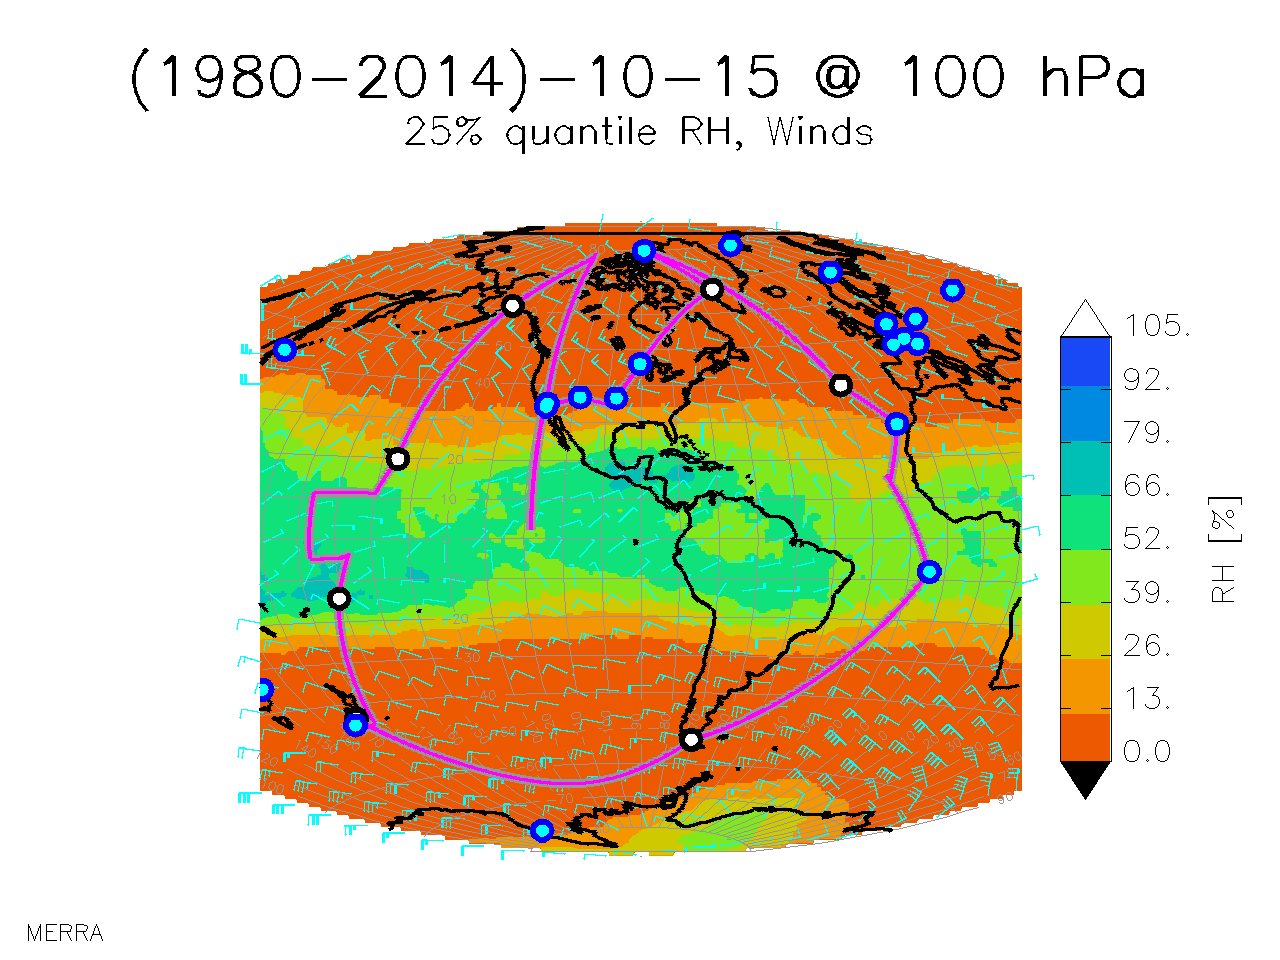
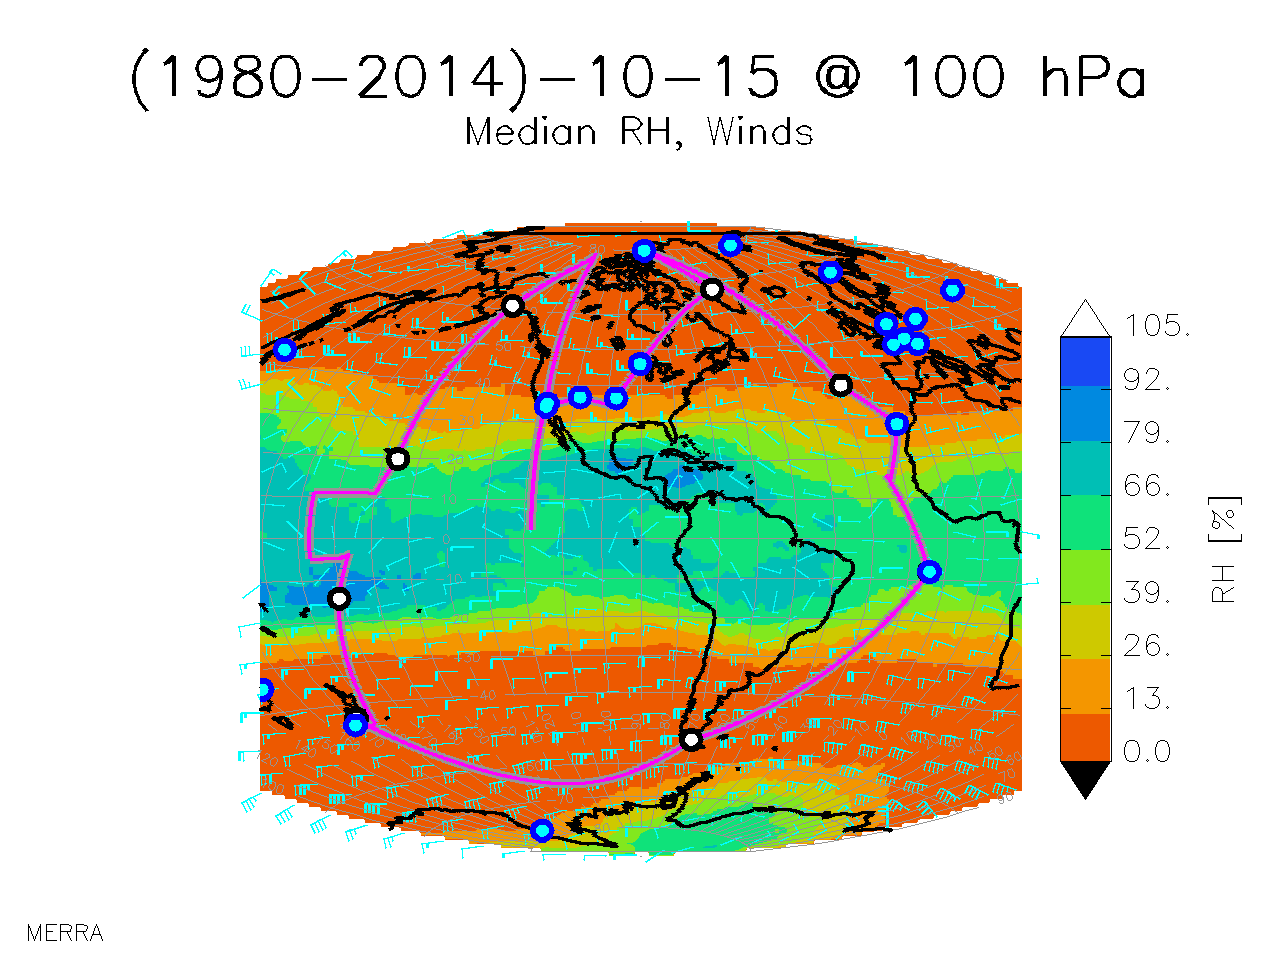
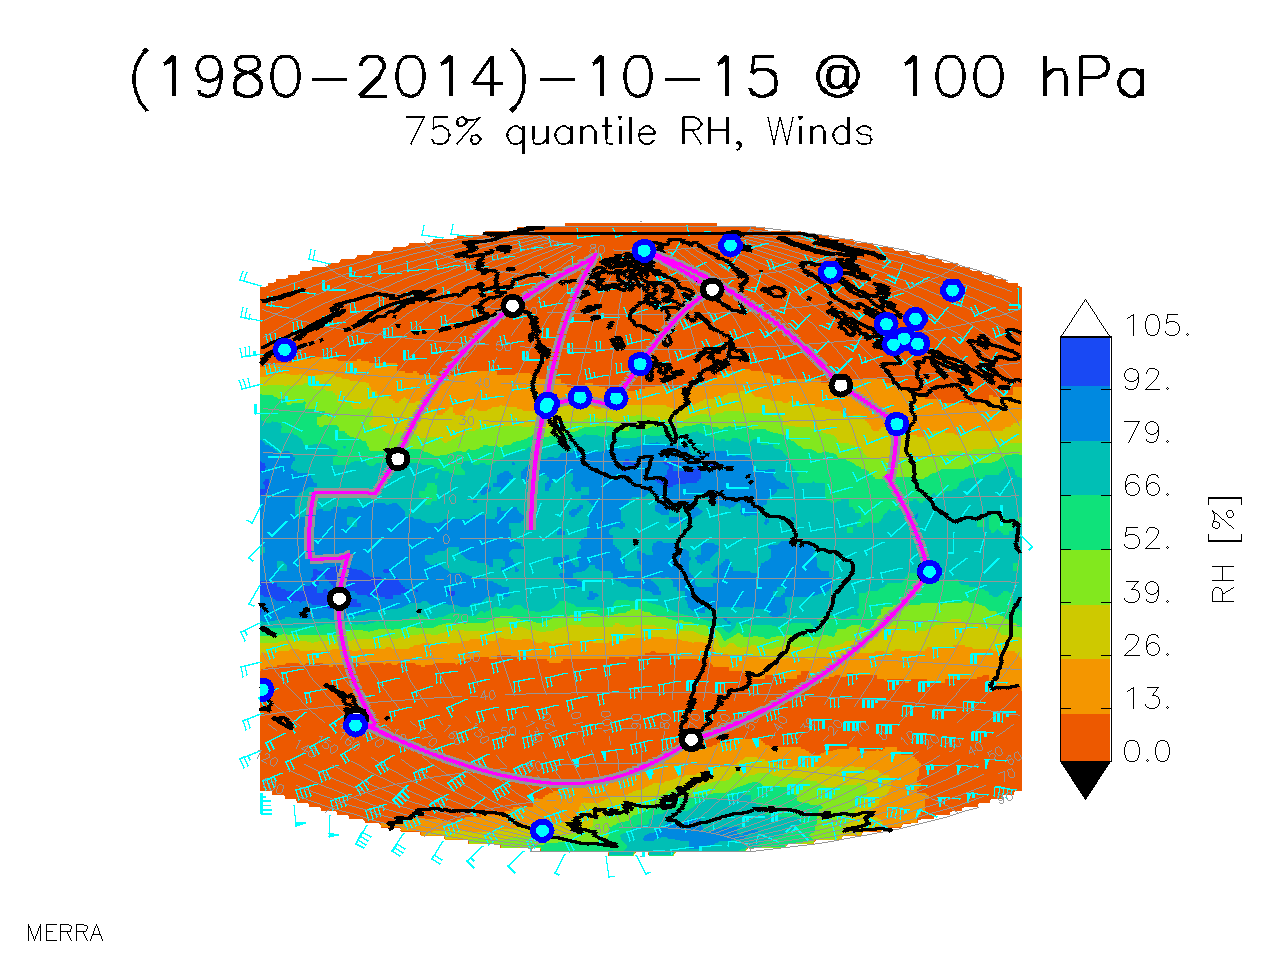
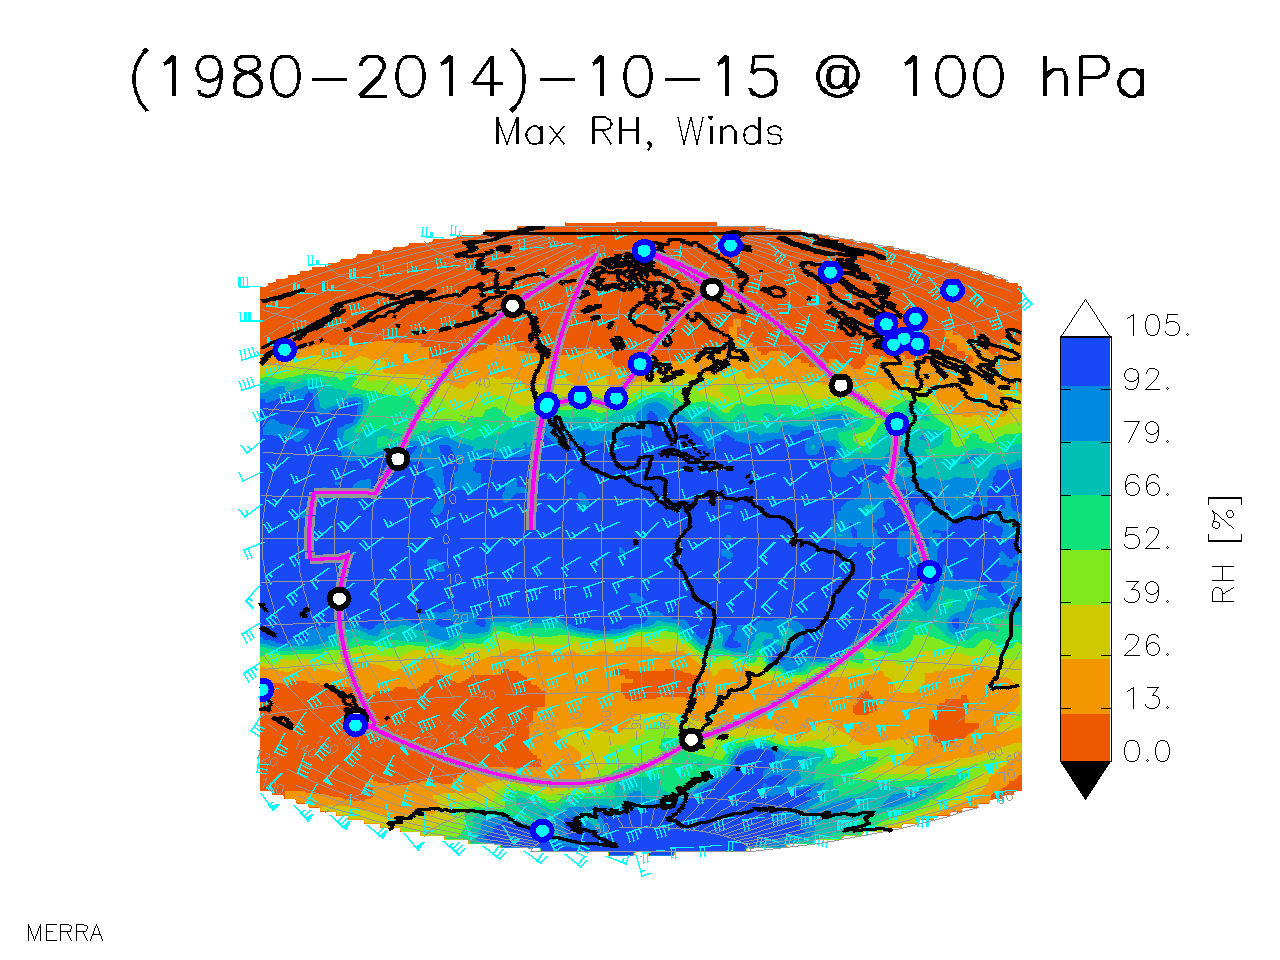
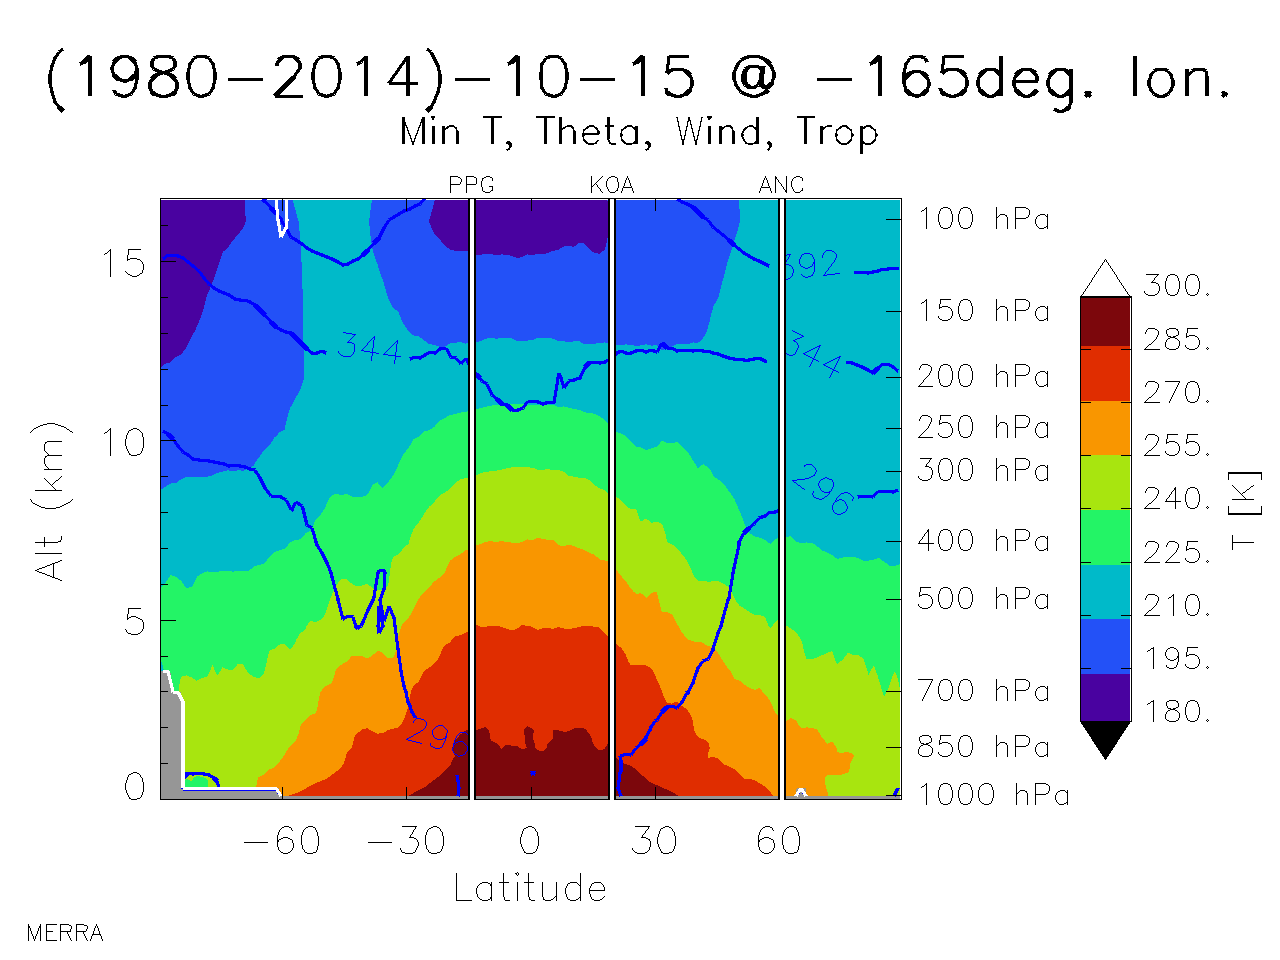
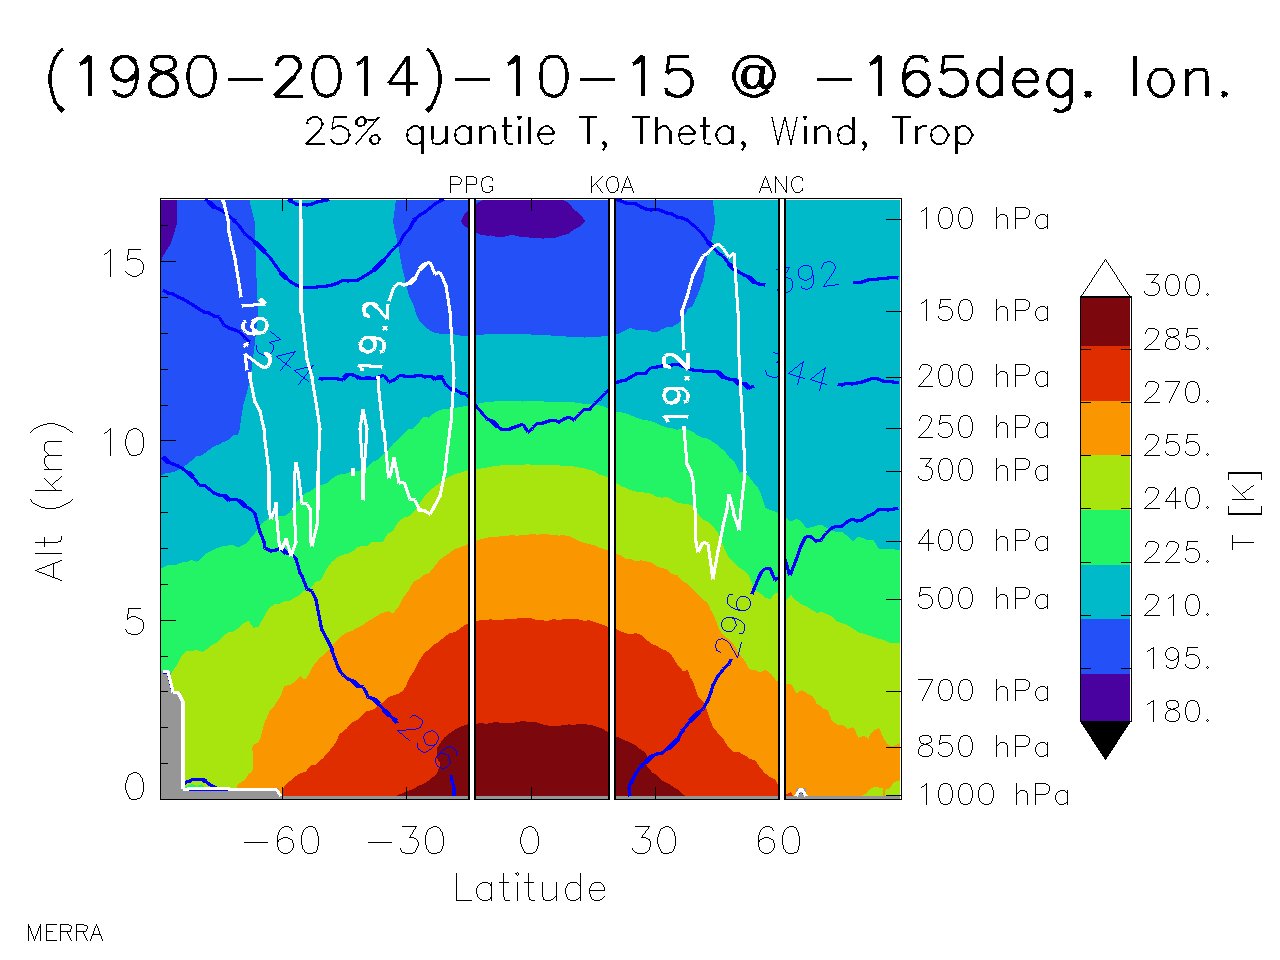
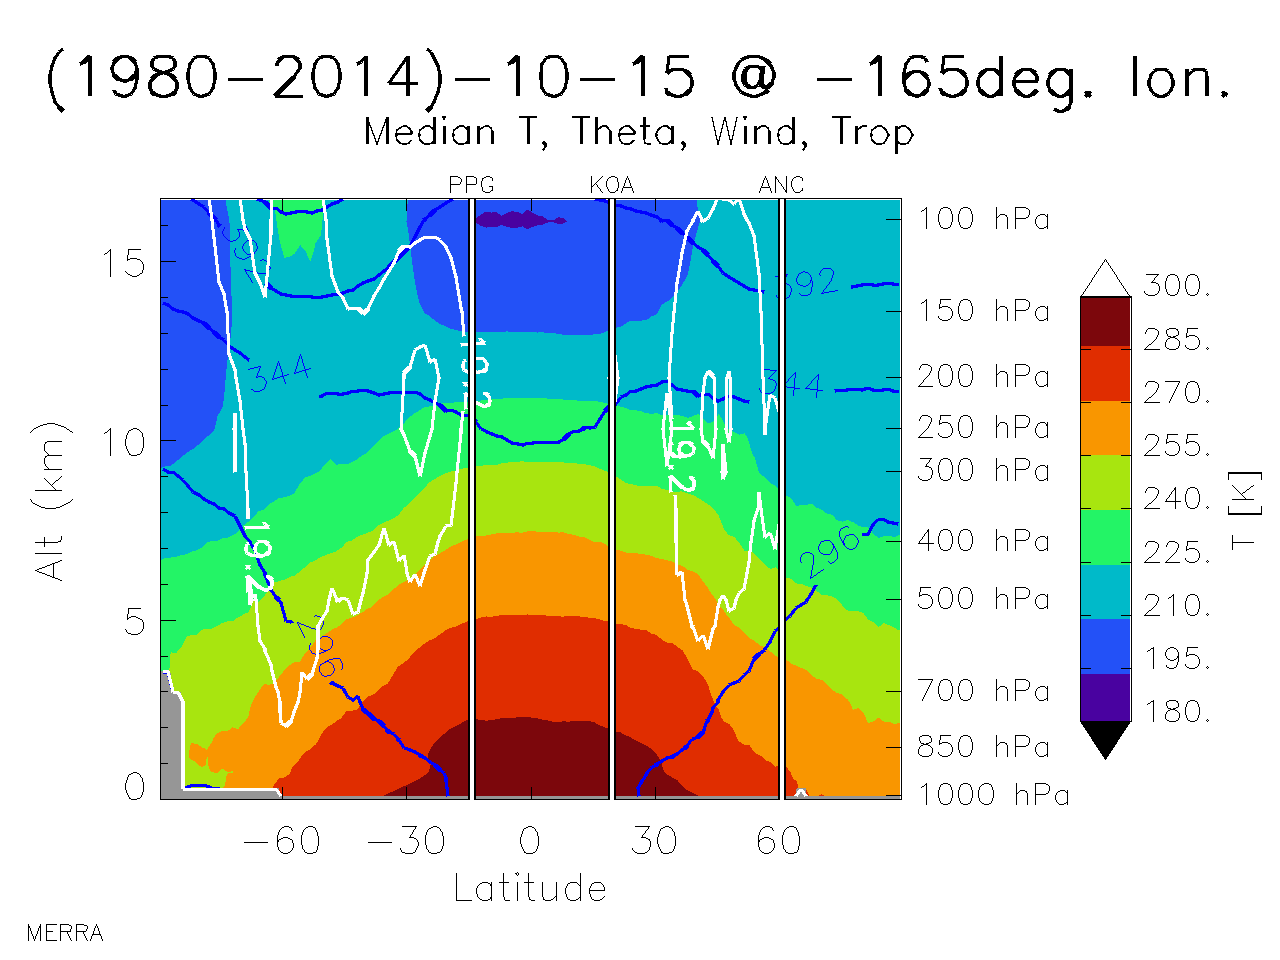
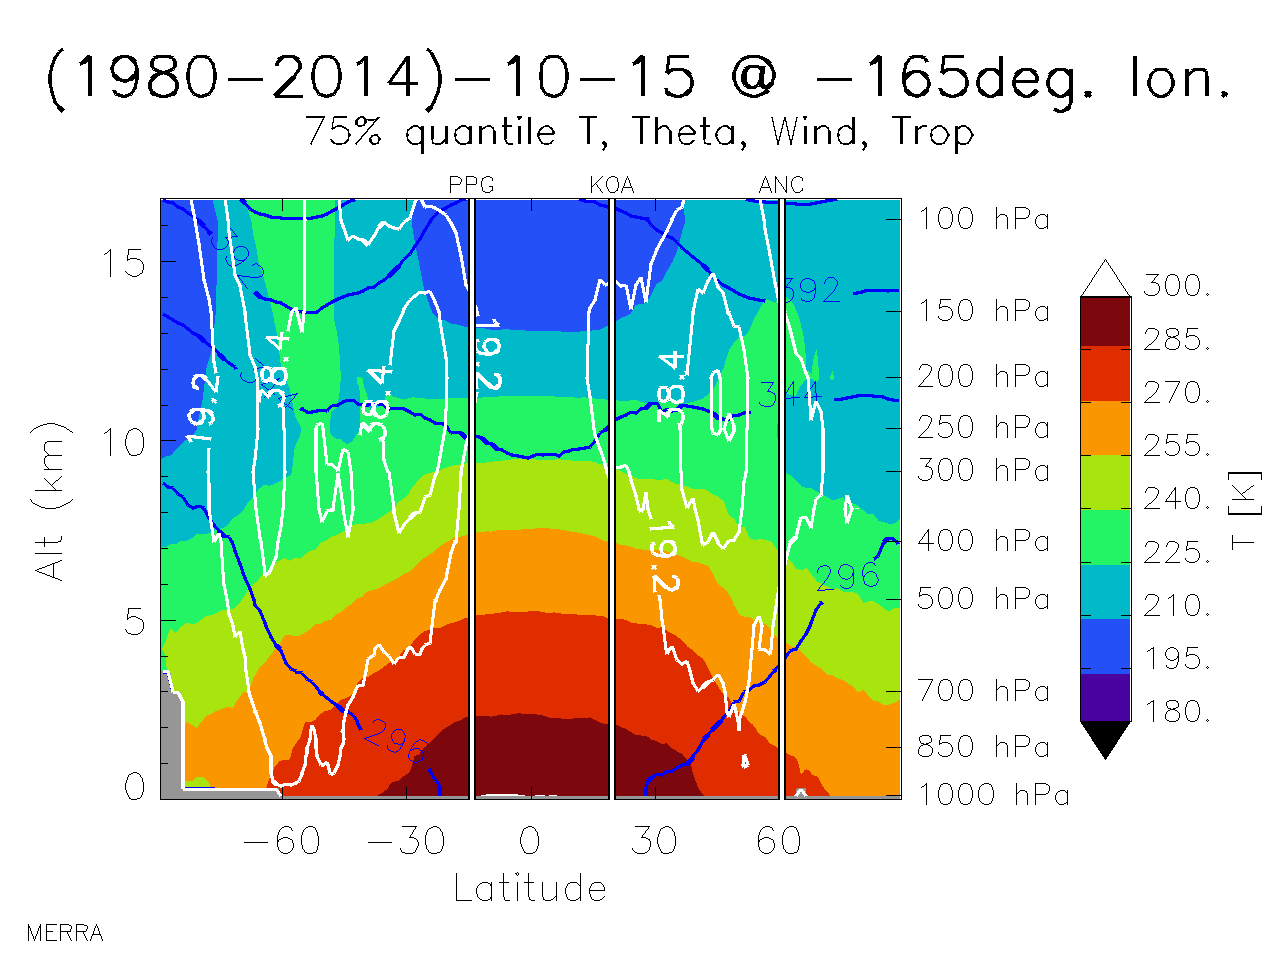
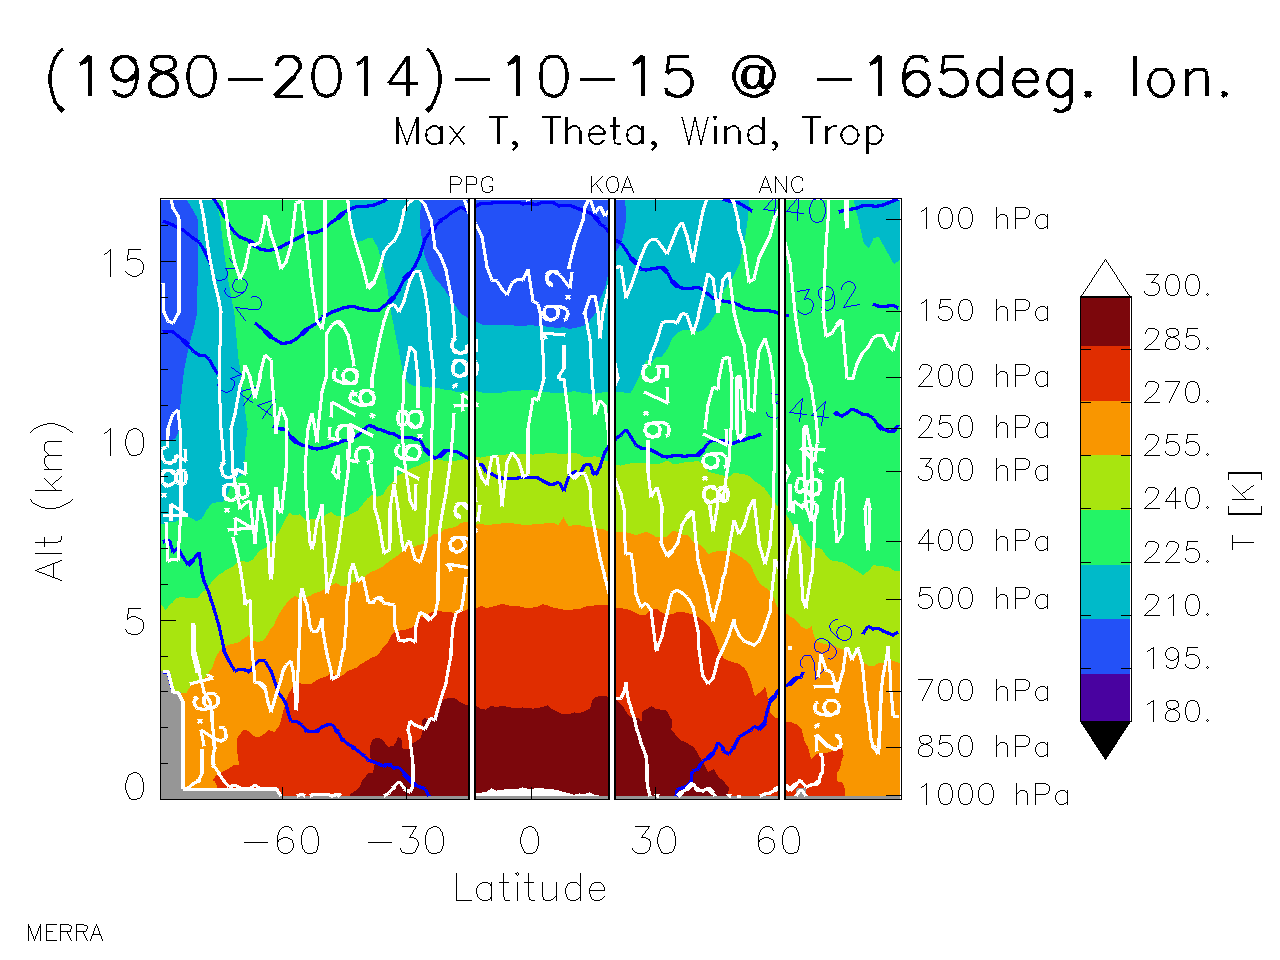
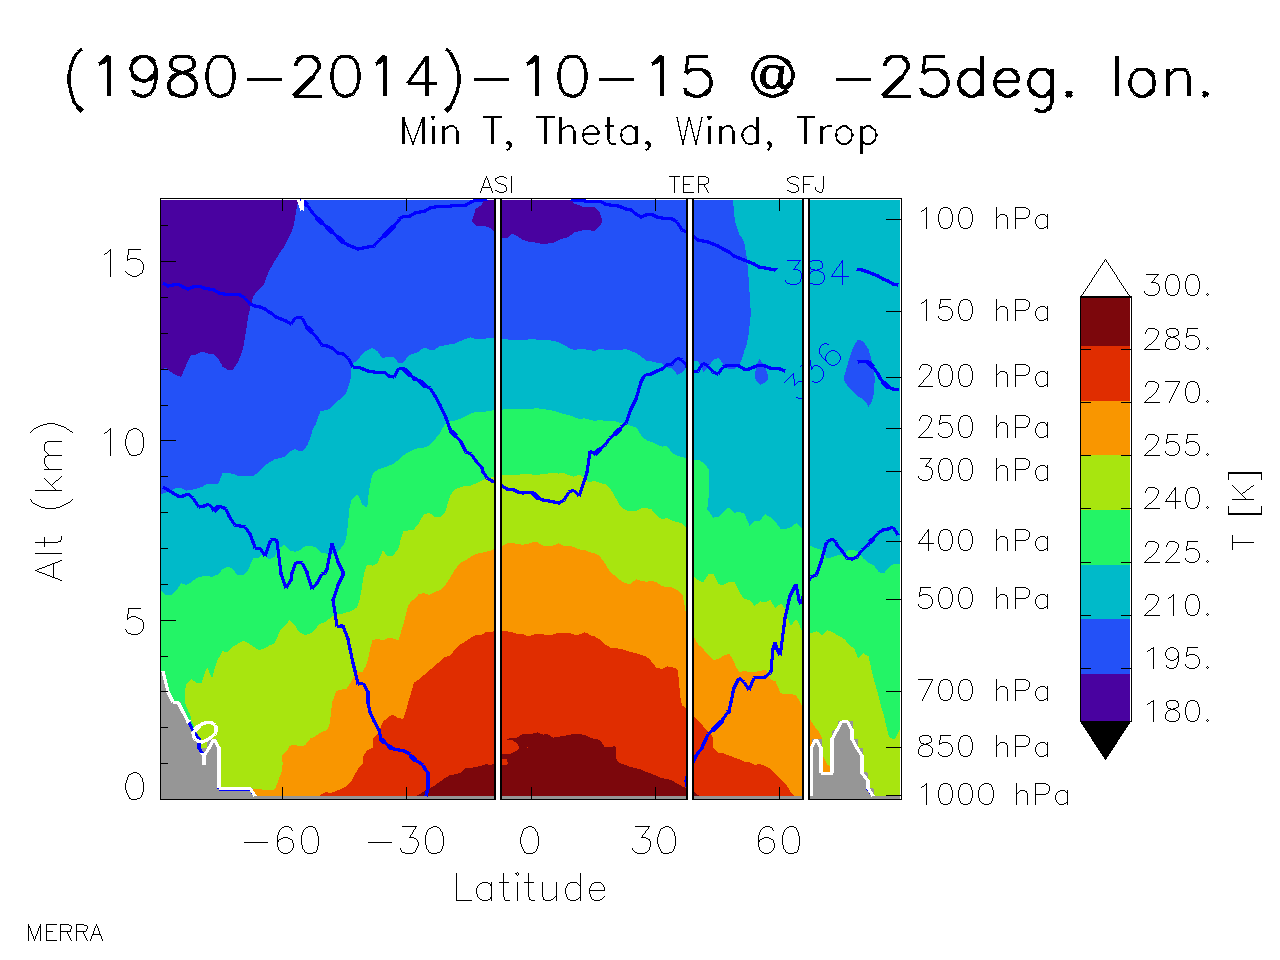
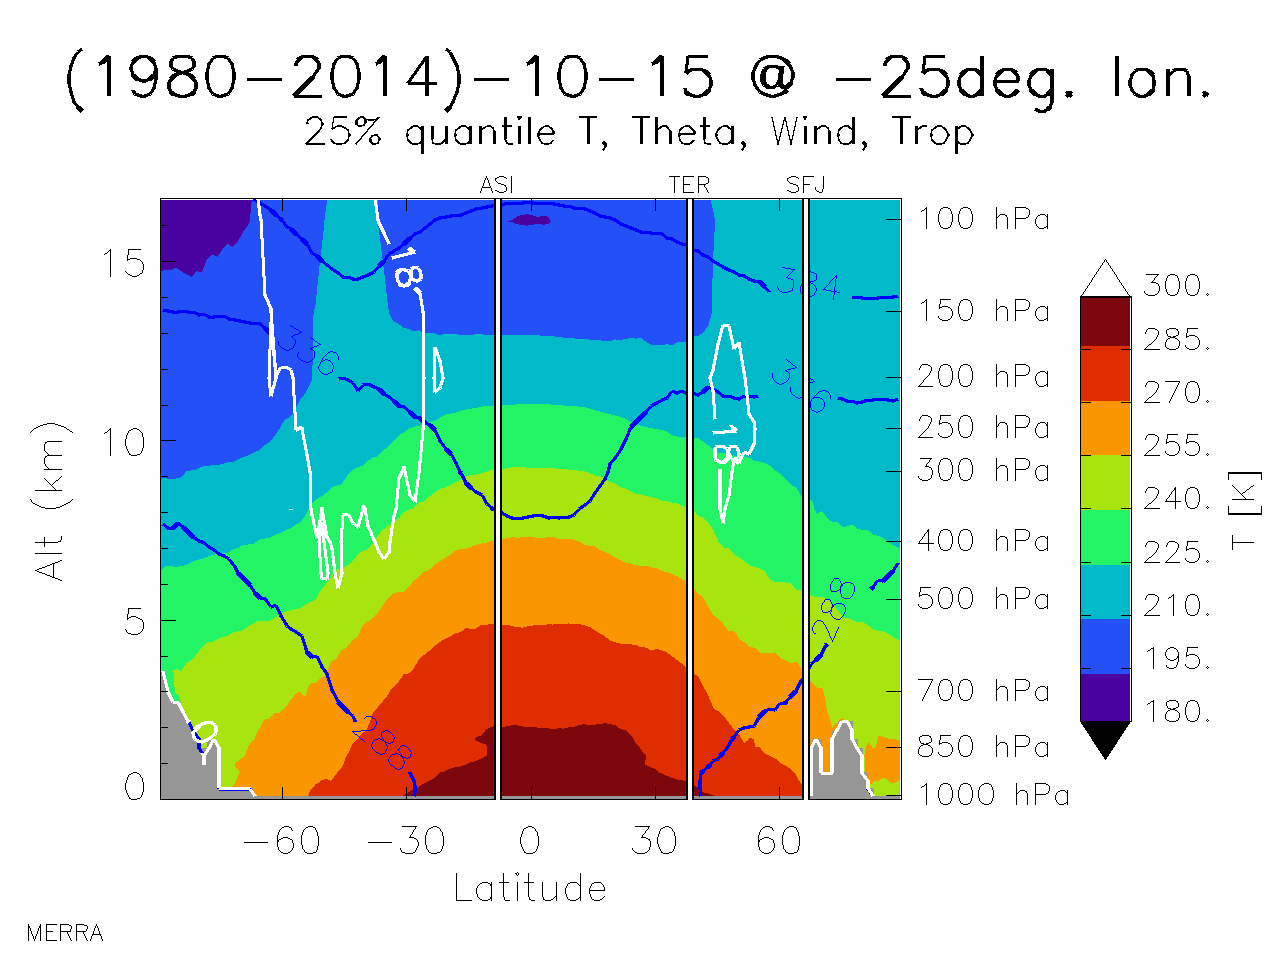
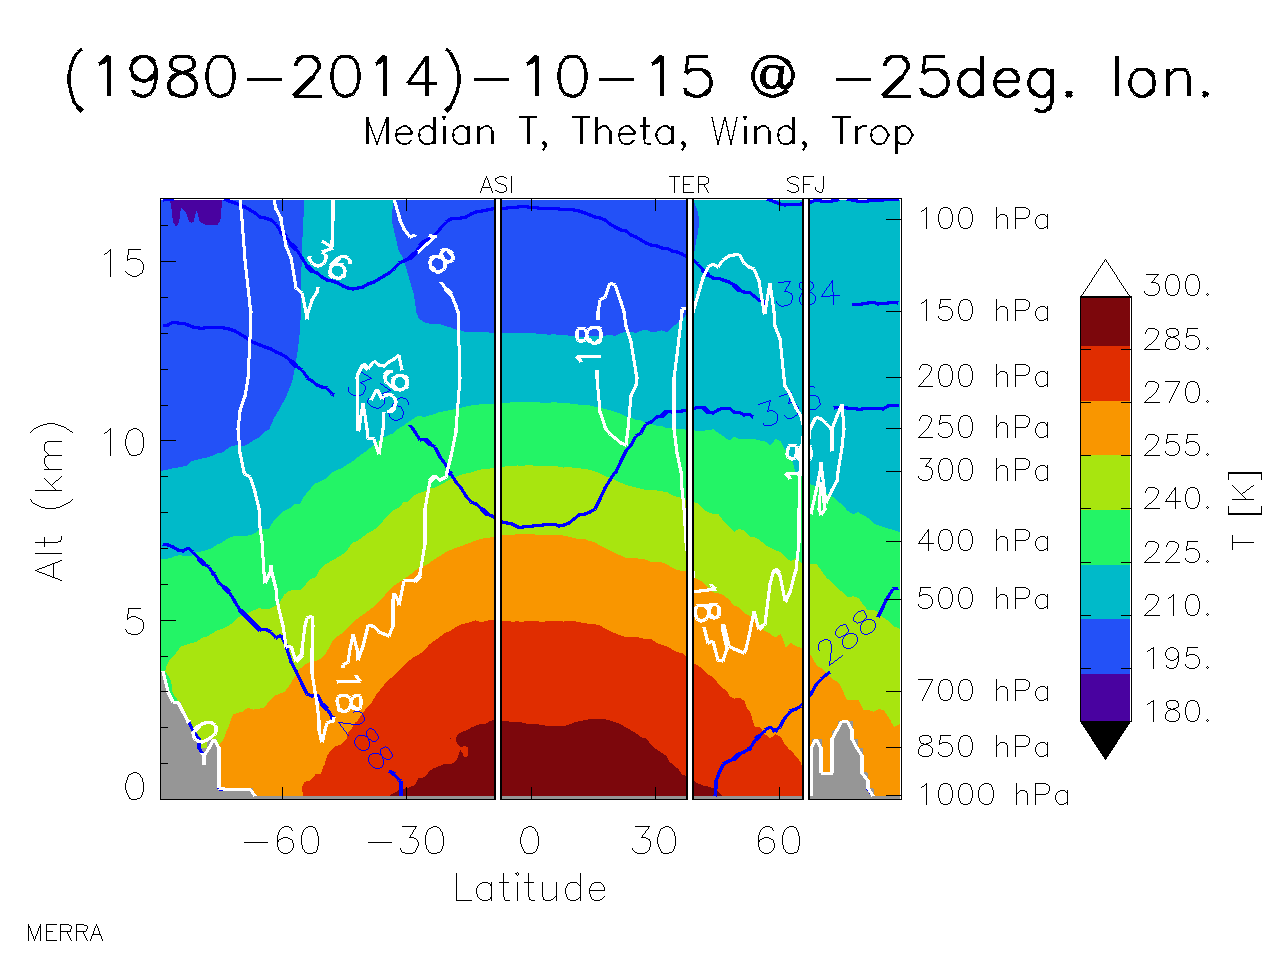
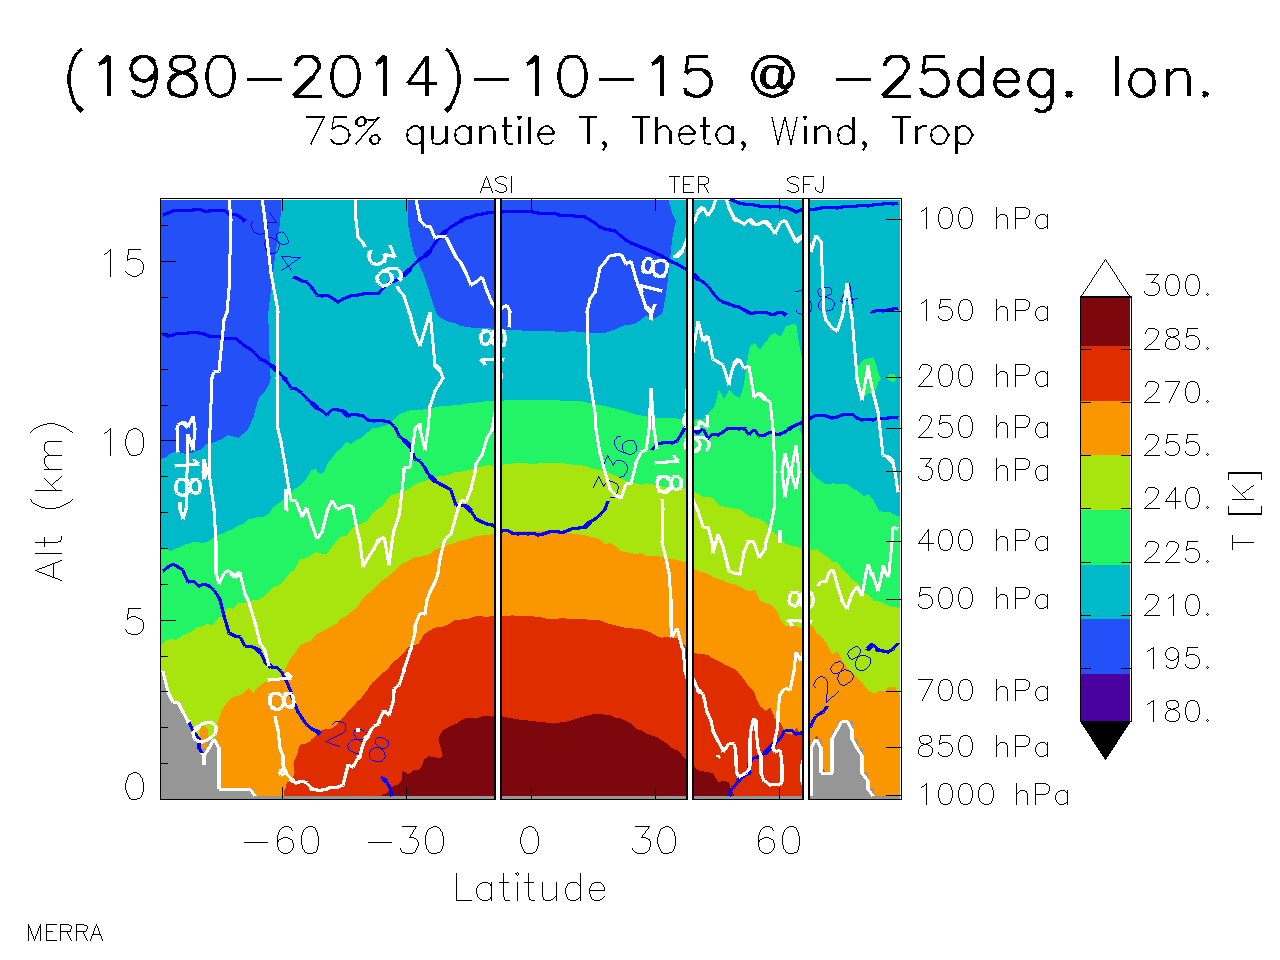
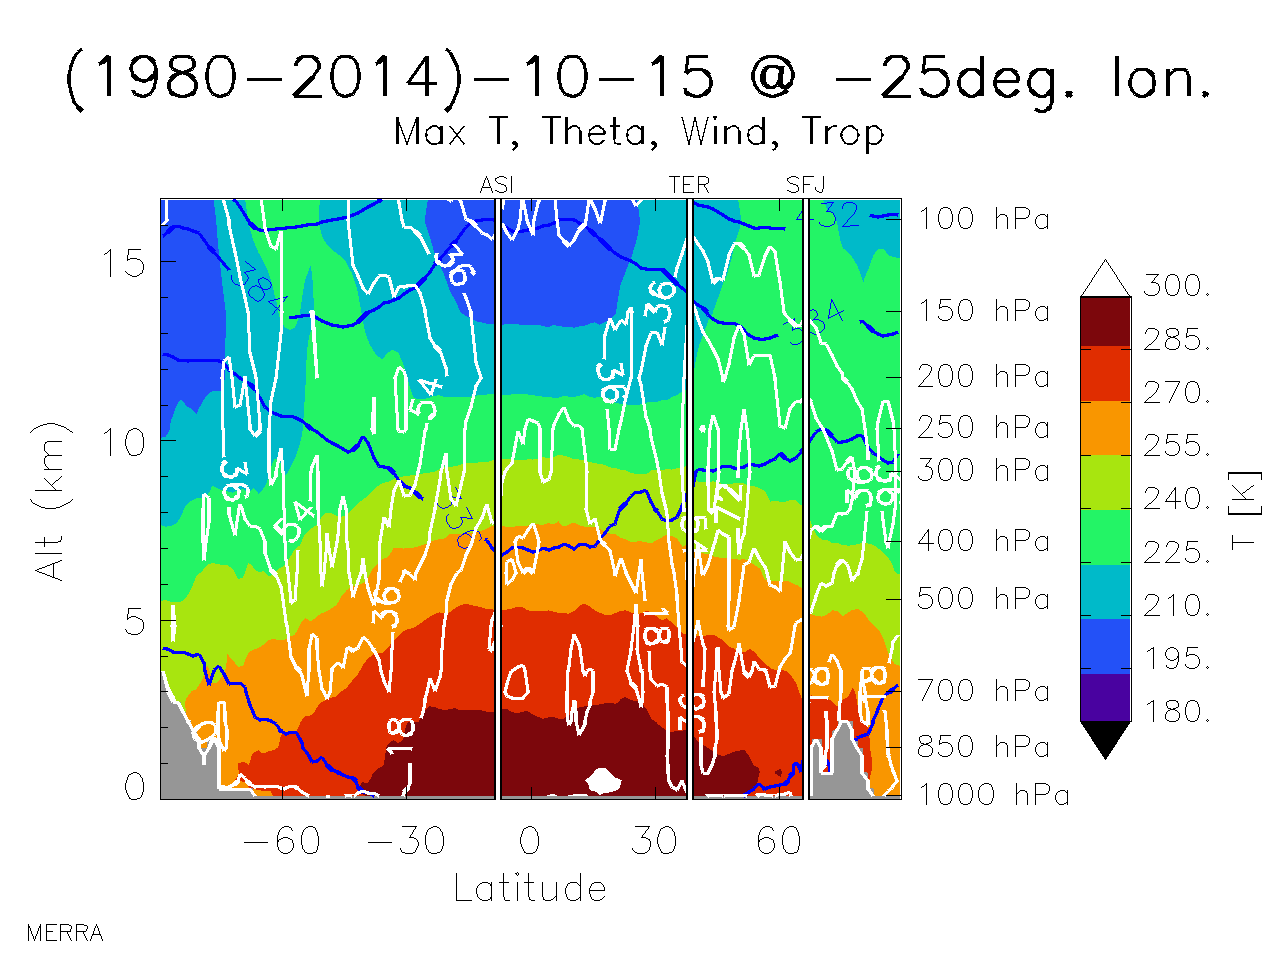
The plots show meteorological field values from 1980 through 2014. At each gridpoint, all the values for a single day in each year are collected and their population statistics examined. By looking at a plot of a single statistic for all the gridpoints, you can get an idea of the spatial distribution of typical fields and the variability of those values. Each plot in the table shows quantile values of grid points in meteorological fields taken from 1980 through 2014. For each grid point, the 0th, 25th, 50th, 75th, and 100% percentile values were calculated from all the years'd meteorological data for the given day. The quantiles form the columns, and the quantities plotted are the rows. Thus, the far left-hand side of the page shows minimum values at each gridpoint, and the far right-hand side plots show the maximum values. The "median" column shows the 50th percentile values; there can be taken as typical. Half of all the value lie between the 25th and the 75th percentiles.
| Plot | Min | 25th pctile | Median | 75th pctile | Max |
|---|---|---|---|---|---|
| Temperature, Geopotential Height, Winds @ 1000 hPa (~ 0 kft) |
|
|
|
|
|
| Windspeed, Potential Temperature @ 1000 hPa (~ 0 kft) |
|
|
|
|
|
| Relative Humidity, Winds @ 1000 hPa (~ 0 kft) |
|
|
|
|
|
| Temperature, Geopotential Height, Winds @ 700 hPa (~ 9 kft) |
|
|
|
|
|
| Windspeed, Potential Temperature @ 700 hPa (~ 9 kft) |
|
|
|
|
|
| Relative Humidity, Winds @ 700 hPa (~ 9 kft) |
|
|
|
|
|
| Temperature, Geopotential Height, Winds @ 500 hPa (~18 kft) |
|
|
|
|
|
| Windspeed, Potential Temperature @ 500 hPa (~18 kft) |
|
|
|
|
|
| Relative Humidity, Winds @ 500 hPa (~18 kft) |
|
|
|
|
|
| Temperature, Geopotential Height, Winds @ 300 hPa (~30 kft) |
|
|
|
|
|
| Windspeed, Potential Temperature @ 300 hPa (~30 kft) |
|
|
|
|
|
| Relative Humidity, Winds @ 300 hPa (~30 kft) |
|
|
|
|
|
| Temperature, Geopotential Height, Winds @ 200 hPa (~38 kft) |
|
|
|
|
|
| Windspeed, Potential Temperature @ 200 hPa (~38 kft) |
|
|
|
|
|
| Relative Humidity, Winds @ 200 hPa (~38 kft) |
|
|
|
|
|
| Temperature, Geopotential Height, Winds @ 100 hPa (~53 kft) |
|
|
|
|
|
| Windspeed, Potential Temperature @ 100 hPa (~53 kft) |
|
|
|
|
|
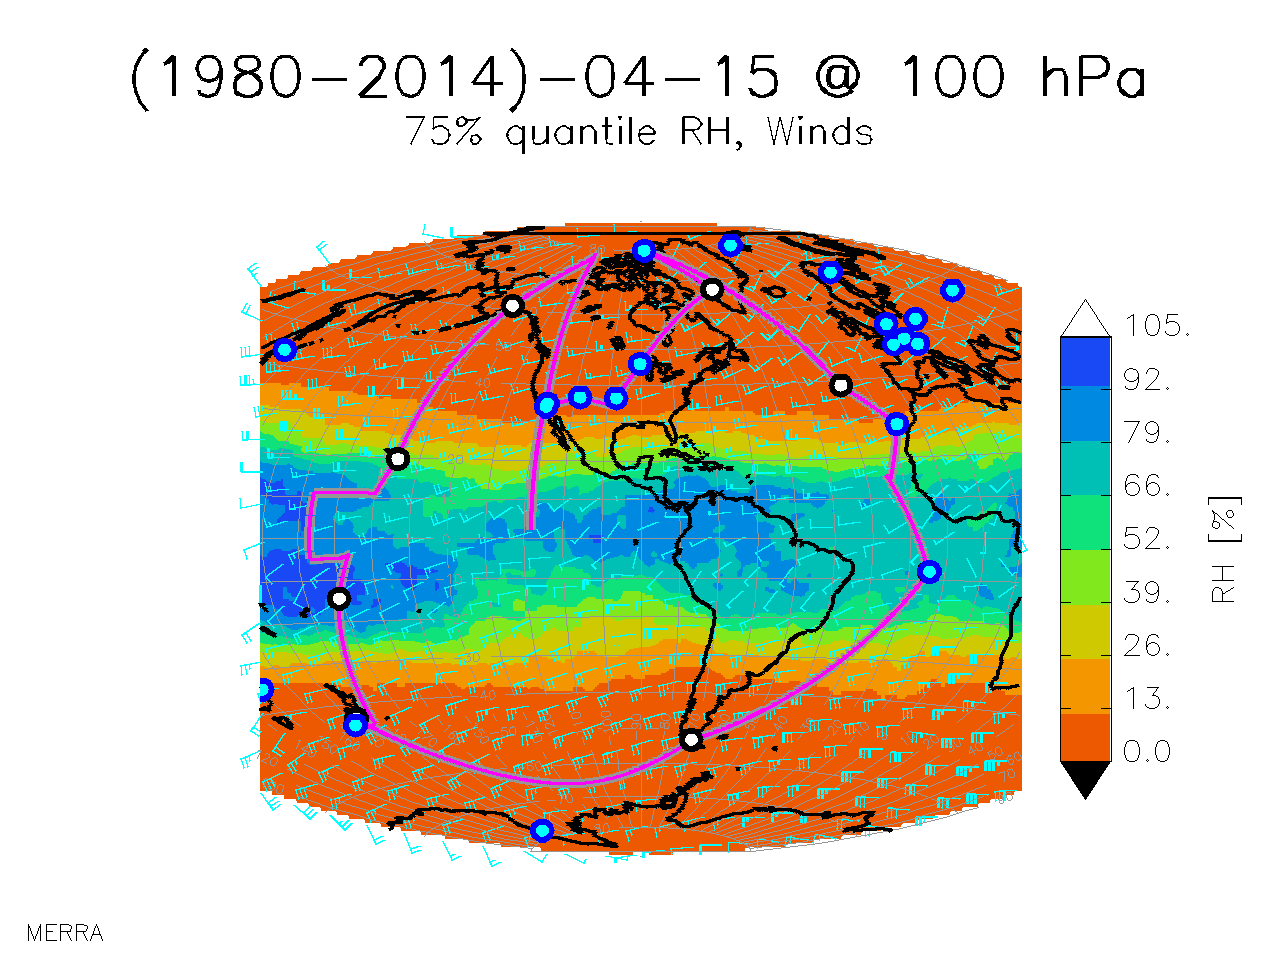
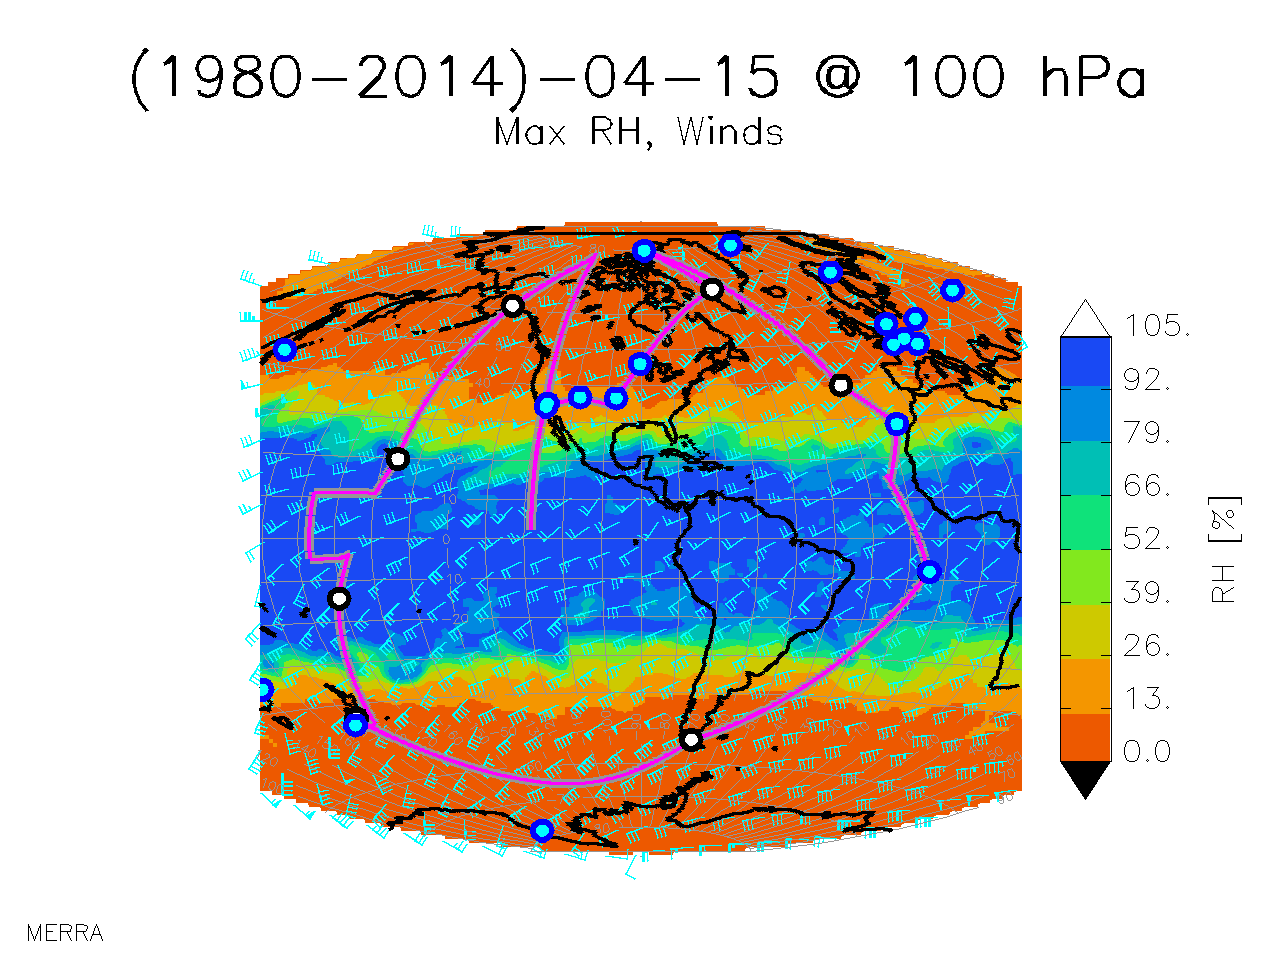
| Relative Humidity, Winds @ 100 hPa (~53 kft) |
|
|
|
|
|
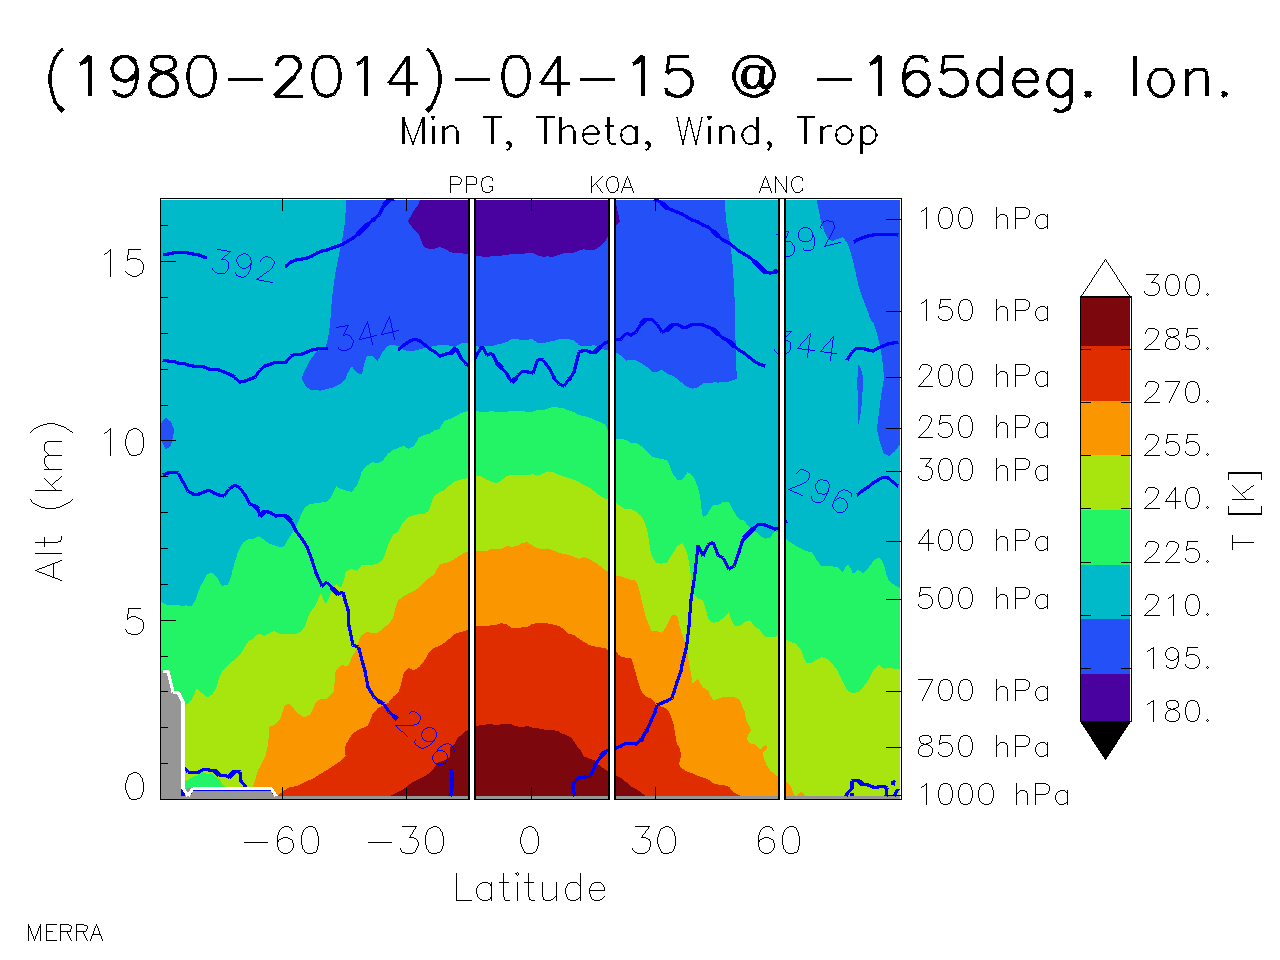
| Temperature, Potential Temperature, Windspeed @ -165 Longitude |
|
|
|
|
|
| Temperature, Potential Temperature, Windspeed @ -25 Longitude |
|
|
|
|
|
| Plot | Min | 25th pctile | Median | 75th pctile | Max |
|---|---|---|---|---|---|
| Temperature, Geopotential Height, Winds @ 1000 hPa (~ 0 kft) |

|
|

|

|

|
| Windspeed, Potential Temperature @ 1000 hPa (~ 0 kft) |

|
|
|
|
|
| Relative Humidity, Winds @ 1000 hPa (~ 0 kft) |
|
|
|

|
|
| Temperature, Geopotential Height, Winds @ 700 hPa (~ 9 kft) |
|
|
|
|
|
| Windspeed, Potential Temperature @ 700 hPa (~ 9 kft) |
|
|
|
|
|
| Relative Humidity, Winds @ 700 hPa (~ 9 kft) |
|
|
|
|
|
| Temperature, Geopotential Height, Winds @ 500 hPa (~18 kft) |
|
|
|
|
|
| Windspeed, Potential Temperature @ 500 hPa (~18 kft) |
|
|
|
|
|
| Relative Humidity, Winds @ 500 hPa (~18 kft) |

|
|
|
|
|
| Temperature, Geopotential Height, Winds @ 300 hPa (~30 kft) |
|
|
|
|
|
| Windspeed, Potential Temperature @ 300 hPa (~30 kft) |
|

|
|
|
|
| Relative Humidity, Winds @ 300 hPa (~30 kft) |
|
|
|
|
|
| Temperature, Geopotential Height, Winds @ 200 hPa (~38 kft) |
|
|
|
|
|
| Windspeed, Potential Temperature @ 200 hPa (~38 kft) |
|
|
|
|
|
| Relative Humidity, Winds @ 200 hPa (~38 kft) |
|
|
|
|
|
| Temperature, Geopotential Height, Winds @ 100 hPa (~53 kft) |
|
|
|
|
|
| Windspeed, Potential Temperature @ 100 hPa (~53 kft) |
|
|
|
|
|
| Relative Humidity, Winds @ 100 hPa (~53 kft) |
|
|
|
|
|
| Temperature, Potential Temperature, Windspeed @ -165 Longitude |
|
|
|
|
|
| Temperature, Potential Temperature, Windspeed @ -25 Longitude |
|
|
|
|
|
| Plot | Min | 25th pctile | Median | 75th pctile | Max |
|---|---|---|---|---|---|
| Temperature, Geopotential Height, Winds @ 1000 hPa (~ 0 kft) |
|

|
|
|
|
| Windspeed, Potential Temperature @ 1000 hPa (~ 0 kft) |
|

|
|
|
|
| Relative Humidity, Winds @ 1000 hPa (~ 0 kft) |
|
|
|
|

|
| Temperature, Geopotential Height, Winds @ 700 hPa (~ 9 kft) |
|
|
|
|
|
| Windspeed, Potential Temperature @ 700 hPa (~ 9 kft) |
|
|
|
|
|
| Relative Humidity, Winds @ 700 hPa (~ 9 kft) |
|
|
|
|
|
| Temperature, Geopotential Height, Winds @ 500 hPa (~18 kft) |
|
|
|
|
|
| Windspeed, Potential Temperature @ 500 hPa (~18 kft) |
|
|
|
|
|
| Relative Humidity, Winds @ 500 hPa (~18 kft) |
|
|
|
|
|
| Temperature, Geopotential Height, Winds @ 300 hPa (~30 kft) |
|
|
|
|
|
| Windspeed, Potential Temperature @ 300 hPa (~30 kft) |
|
|
|
|
|
| Relative Humidity, Winds @ 300 hPa (~30 kft) |
|
|
|
|
|
| Temperature, Geopotential Height, Winds @ 200 hPa (~38 kft) |
|
|
|
|
|
| Windspeed, Potential Temperature @ 200 hPa (~38 kft) |
|
|
|
|
|
| Relative Humidity, Winds @ 200 hPa (~38 kft) |
|
|
|
|
|
| Temperature, Geopotential Height, Winds @ 100 hPa (~53 kft) |
|
|
|
|
|
| Windspeed, Potential Temperature @ 100 hPa (~53 kft) |
|
|
|
|
|
| Relative Humidity, Winds @ 100 hPa (~53 kft) |
|
|
|
|
|
| Temperature, Potential Temperature, Windspeed @ -165 Longitude |
|
|

|
|
|
| Temperature, Potential Temperature, Windspeed @ -25 Longitude |
|
|
|
|

|
| Plot | Min | 25th pctile | Median | 75th pctile | Max |
|---|---|---|---|---|---|
| Temperature, Geopotential Height, Winds @ 1000 hPa (~ 0 kft) |
|

|
|
|
|
| Windspeed, Potential Temperature @ 1000 hPa (~ 0 kft) |
|
|
|
|
|
| Relative Humidity, Winds @ 1000 hPa (~ 0 kft) |
|
|
|
|
|
| Temperature, Geopotential Height, Winds @ 700 hPa (~ 9 kft) |
|
|
|
|
|
| Windspeed, Potential Temperature @ 700 hPa (~ 9 kft) |
|
|
|
|
|
| Relative Humidity, Winds @ 700 hPa (~ 9 kft) |
|
|
|
|
|
| Temperature, Geopotential Height, Winds @ 500 hPa (~18 kft) |
|
|
|
|
|
| Windspeed, Potential Temperature @ 500 hPa (~18 kft) |
|
|
|
|
|
| Relative Humidity, Winds @ 500 hPa (~18 kft) |
|
|
|
|
|
| Temperature, Geopotential Height, Winds @ 300 hPa (~30 kft) |
|
|
|
|
|
| Windspeed, Potential Temperature @ 300 hPa (~30 kft) |
|
|
|
|
|
| Relative Humidity, Winds @ 300 hPa (~30 kft) |
|
|
|
|
|
| Temperature, Geopotential Height, Winds @ 200 hPa (~38 kft) |
|
|
|
|
|
| Windspeed, Potential Temperature @ 200 hPa (~38 kft) |
|
|
|
|
|
| Relative Humidity, Winds @ 200 hPa (~38 kft) |
|
|
|
|
|
| Temperature, Geopotential Height, Winds @ 100 hPa (~53 kft) |
|
|
|
|
|
| Windspeed, Potential Temperature @ 100 hPa (~53 kft) |
|
|
|
|
|
| Relative Humidity, Winds @ 100 hPa (~53 kft) |
|
|
|
|
|
| Temperature, Potential Temperature, Windspeed @ -165 Longitude |
|
|
|
|
|
| Temperature, Potential Temperature, Windspeed @ -25 Longitude |
|
|
|
|
|