Atmospheric Chemistry and Dynamics Laboratory (Code 614)
For Our Colleagues Scientific/Technical Information
The Quasi-biennial Oscillation (QBO) Momentum
This web page shows the Quasi-biennial Oscillation (QBO) momentum plots. Daily plots are updated at least once per day.
Zonal mean wind momentum budget
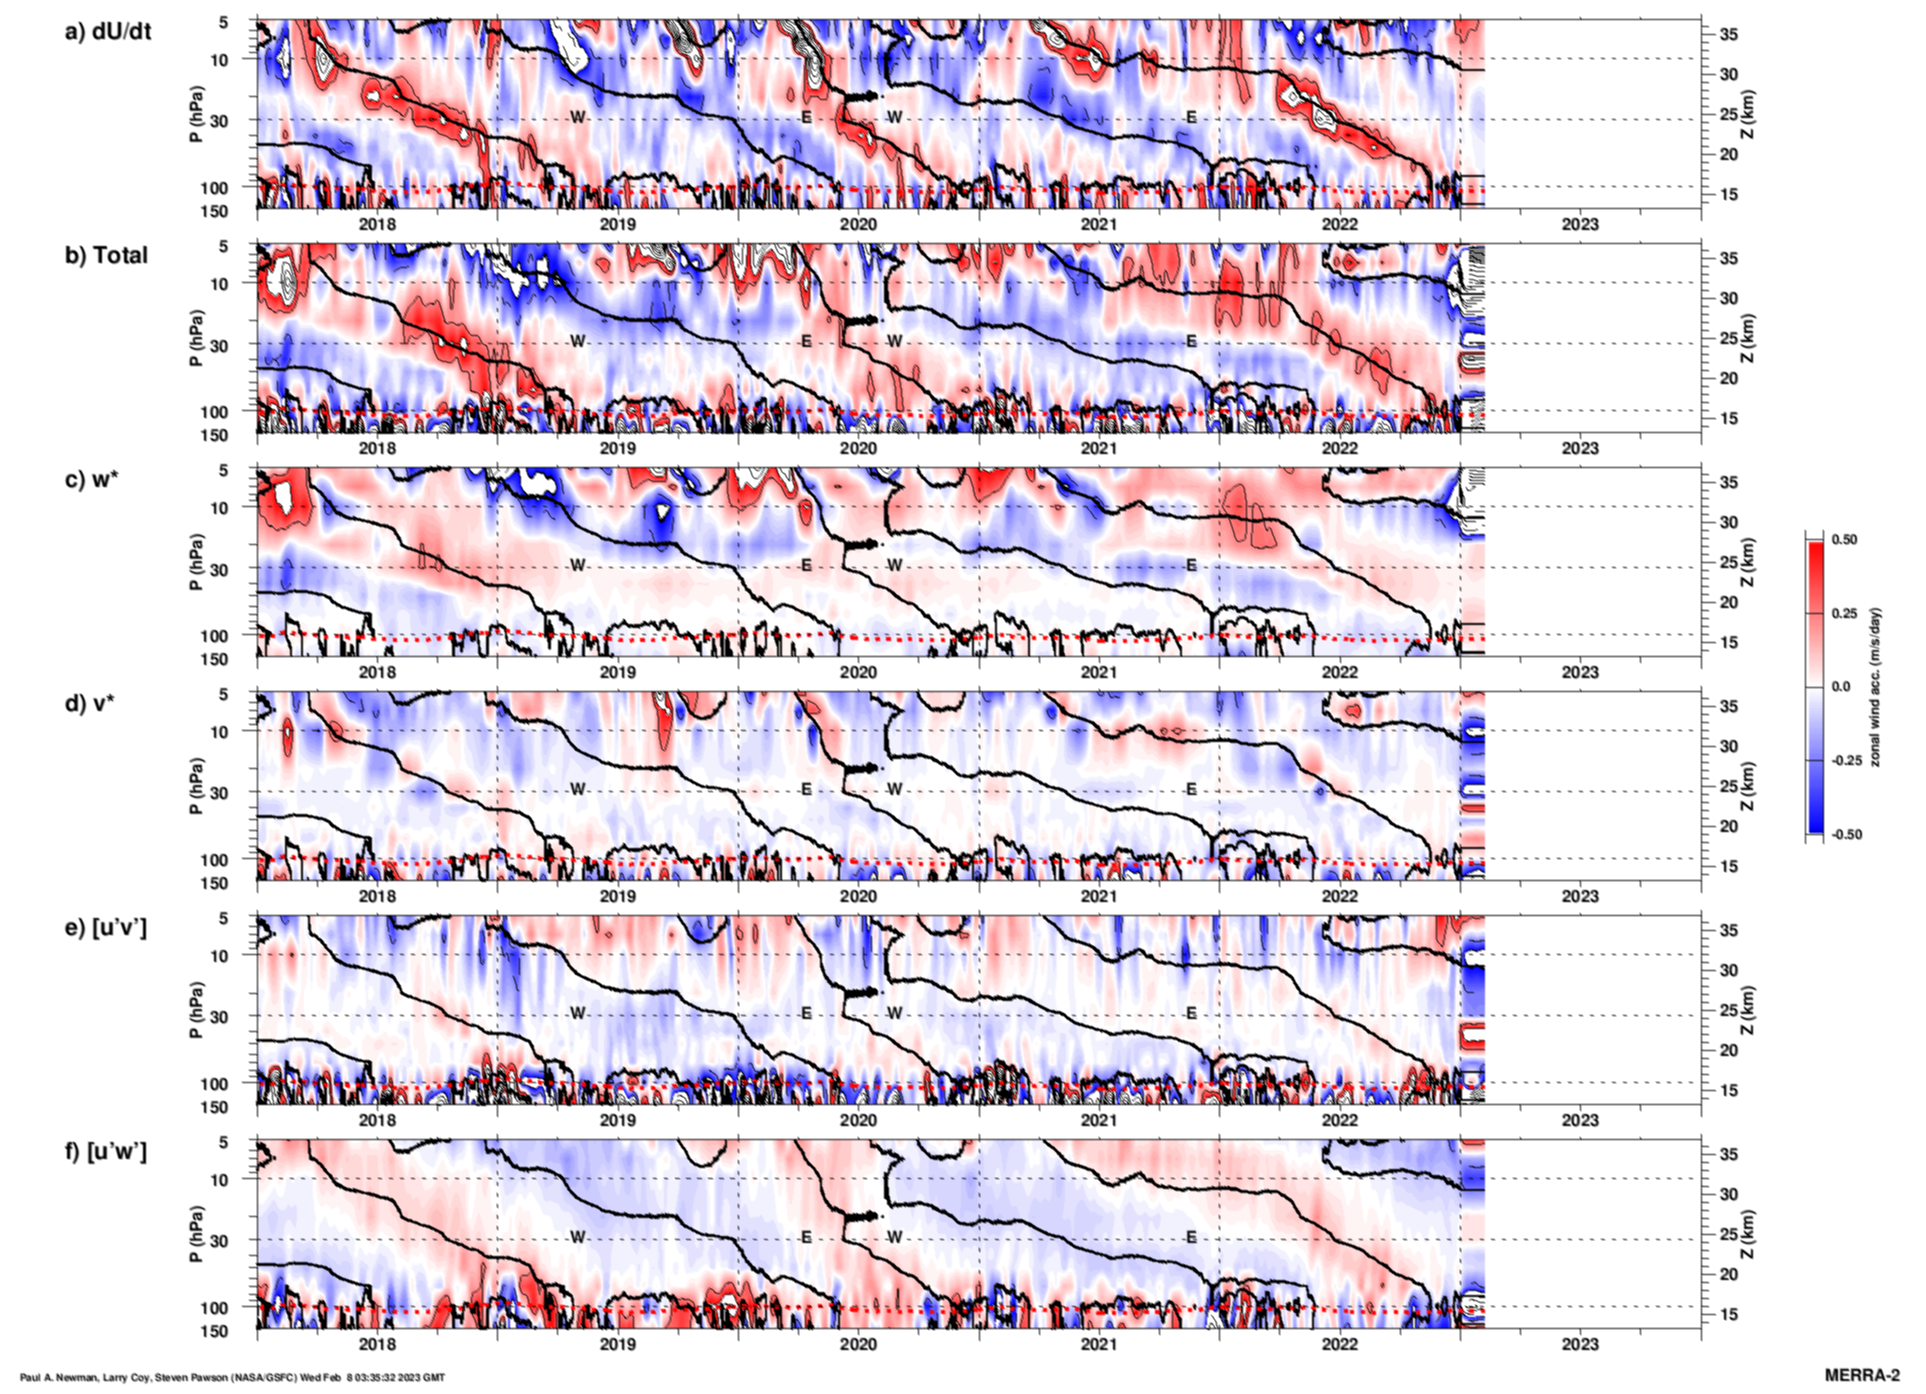
The zonal mean zonal wind budget is from MERRA-2. Daily files at 0, 6, 12, and 18Z from 2000-present are used, annual cycle is computed and removed from all terms. Smoothing is applied with a 21-day 1/2 amplituded Gaussian filter. Trends are not removed. Data are cosine-weighted averages from 5S to 5N. Plot includes (see equations below): a) the zonal mean wind tendency; b) the total momentum terms from the resolved data; and individual momentume terms: c) the mean vertical momentum advection; d) the mean horizontal momentum advection; e) the horizontal eddy momentum flux; and f) the vertical eddy momentum flux.
Transformed Eulerian Mean (TEM) zonal mean wind tendency equation is taken from Andrews et al. [1987]. Overbars indicate zonal mean averages, primes indicate deviations from the zonal mean, \( \phi \) is latitude, \( \rho \) is density, \( a \) is the Earth's radius, \( f \) is the Coriolis parameter, and \( [u, v, w] \) represent the zonal, meridional, and vertical winds, while \( t \) is time.
Eliassen-Palm flux \(= \boldsymbol{\vec{F}} = [ F^{(\phi)}, F^{(z)} ] \)
\( F^{(\phi)} = \rho_{o} a \, {\cos\phi} \; (\overline{u}_z \overline{v^\prime\theta^\prime} / \overline{\theta}_z - \overline{u^\prime v^\prime}), \; F^{(z)} = \rho_{o} a \, {\cos\phi} \, \{ \; \, [f-(a \, \cos\phi)^{-1}(\overline u \cos\phi)_{\phi} ] \; \overline{v^\prime\theta^\prime} / \overline{\theta}_z - \overline{u^\prime w^\prime} \} \)
Residual Circulation (denoted by * superscript) \( = \boldsymbol{\vec{v}^*} = [ \overline{v}^*, \overline{w}^*] \)
\( \overline{v}^* = \overline{v} - \rho_{o}^{-1}(\rho_{o} \overline{v^\prime\theta^\prime} / \overline{\theta}_z)_z, \; \overline{w}^* = \overline{w} + (a \, {\cos\phi})^{-1}(\cos\phi \, \overline{v^\prime\theta^\prime} / \overline{\theta}_z)_{\phi} \)
\(\overline u \) tendency equation = \( \overline u_t = - \overline v^* [( a \, \cos\phi )^{-1} (\overline u \cos\phi )_\phi -f ] - \overline w^* \overline u_z + (\rho_{o} a \, \cos\phi)^{-1} \nabla \cdot \boldsymbol{\vec{F}} + X \)
Momentum (5S-5N) versus pressure
The full terms for the plot below are:
(a) \( \frac{\partial \overline u}{\partial t} \)
(b) \(- \overline v^* [( a \, \cos\phi )^{-1} (\overline u \cos\phi )_\phi -f ] - \overline w^* \overline u_z + (\rho_{o} a \, \cos\phi)^{-1} \nabla \cdot \boldsymbol{\vec{F}} \)
(c) \( - \overline w^* \overline u_z \)
(d) \( - \overline v^* \, [ \, ( a \, \cos\phi )^{-1} (\overline u \cos\phi )_\phi -f \, ] \)
(e) \( (\rho_{o} a^2 {\cos^2\phi})^{-1} \frac{\partial}{\partial \phi}(F^{(\phi)} \cos\phi) \)
(f) \( (\rho_{o} a^2 {\cos^2\phi})^{-1} \frac{\partial F^{(z)}}{\partial z} \)
Colors represent accelerations (red) and decelerations (blue) . The thick black lines are zero wind lines of the zonal mean zonal wind average, and the westerly (W) and easterly (E) phases are noted. The tropopause is shown as the thick red dotted line.
This momentum budget is not complete, since it does not include the parameterized gravity wave drag term, the wet momentum deposition term, and the assimilation increments.
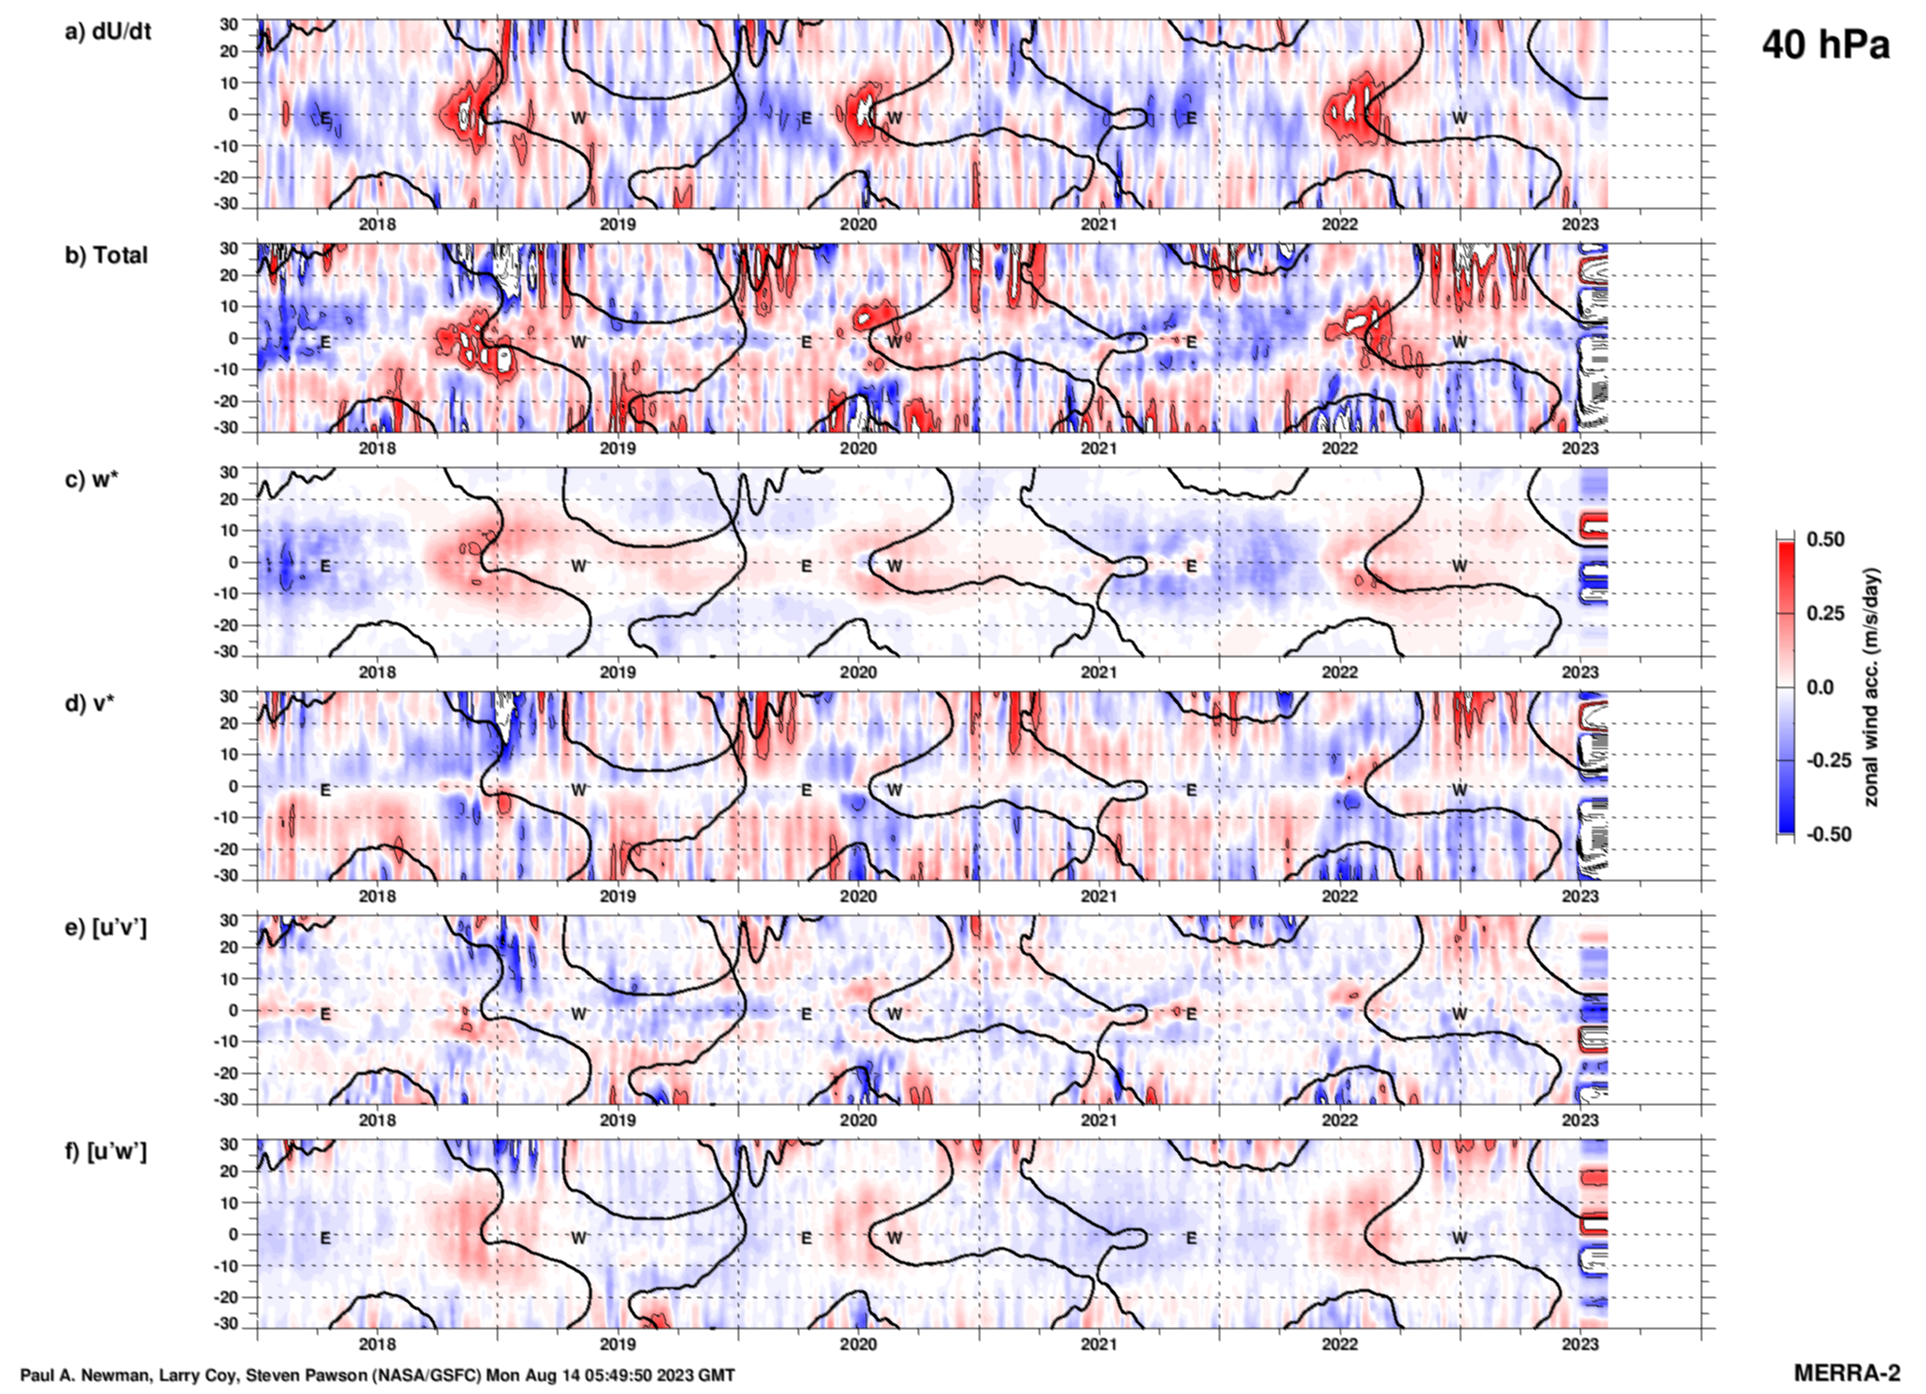
Momentum versus latitude
The latitudinal structure of the zonal mean zonal wind budget from MERRA-2 at 40hPa. Units are meters per second per day. Daily files at 0, 6, 12, and 18Z from 2000-present are used, annual cycle is computed and removed from all terms. Smoothing is applied with a 21-day 1/2 amplituded Gaussian filter. Trends are not removed.
40 hPa
As above, but for 40 hPa.
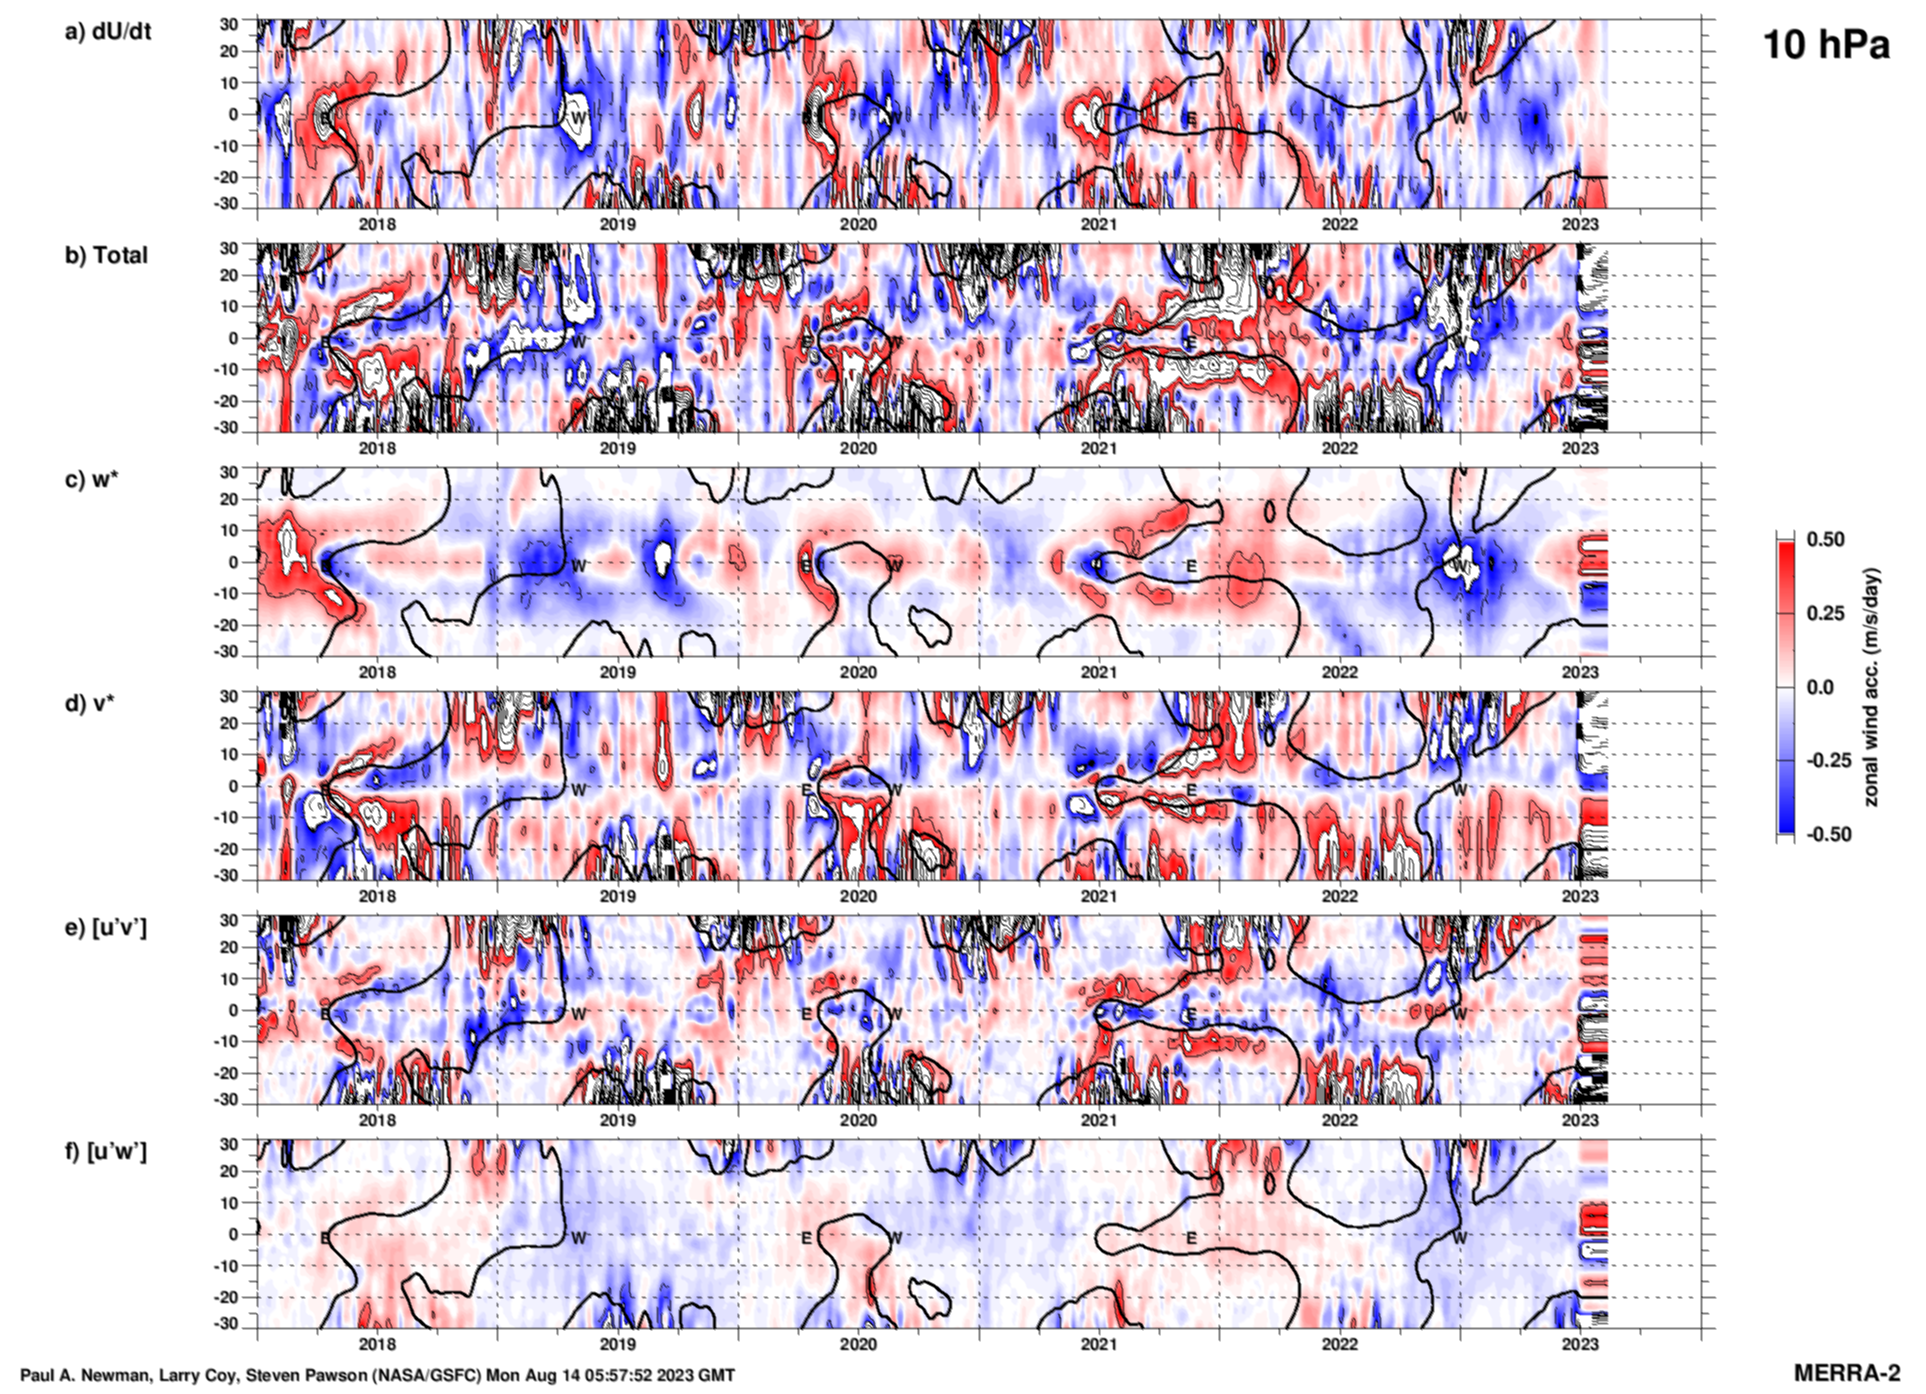
10 hPa
As above, but for 10 hPa.
- NASA Official: Dr. Paul Newman
- Web Content: Dr. Paul Newman
- Last Updated: 2019-06-10


