Search:
Flight Projects | Sciences and Exploration
Atmospheric Chemistry and Dynamics Laboratory (Code 614)
For Our Colleagues Scientific/Technical Information

Annual Meteorological Statistics
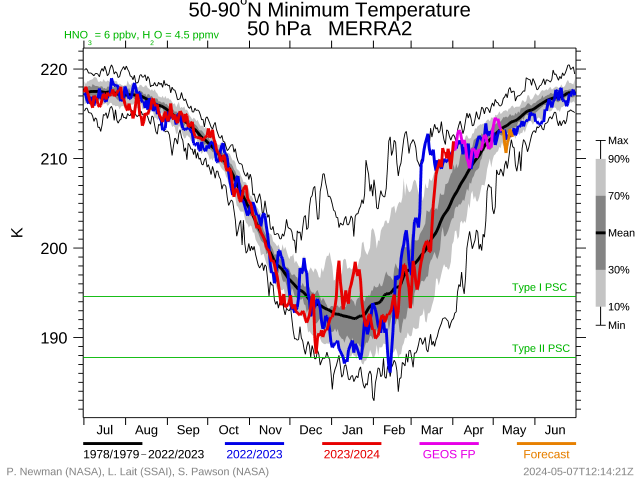
- Annual Meteorological Statistics: Graphs for the Northern Hemisphere
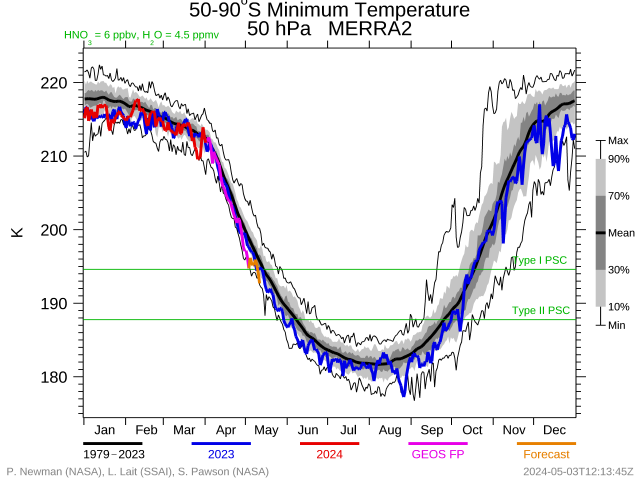
- Annual Meteorological Statistics: Graphs for the Southern Hemisphere
- Annual Meteorological Statistics: Data Request Form
- Disclaimers, Variable descriptions, output formats, and other help
- Back to the Plots page
Annual Meteorological Statistics for the Northern Hemisphere
Annual Meteorological Statistics for the Southern Hemisphere